
7 minute read
Monitor Your Network

by Hiba Dweib
Admin How To
Monitor Your Network Effectively with Monit
Advertisement
Monit is a utility for monitoring and managing programs, processes, files, directories and filesystems on UNIX and Linux systems. Monit monitors systems, maintains them automatically and even repairs them. This article deals with its installation and configuration.
Do you want to know more about what to do if your server goes down? Well, if you have only a little or no idea about network monitoring but are willing to delve into it, Monit gives you a start with the minimum effort.
At the very elementary level, an SNMP (Simple Network Management Protocol) relies on just two basic things—a management server and a managed device. The management server retrieves information from the managed devices and stores it in the information table. However, this data is useless until it's presented properly for the end user. For this, you need a network monitoring tool. And if you are a beginner, you can get nothing better than Monit to start with.
According to Wikipedia, Monit “...is a free, open source process supervision tool for UNIX and Linux.” It is written in C by Tildeslash Ltd with its latest stable release being 5.5, and is licensed under the GNU General Public License 3.0. It gained popularity after its use with Ruby on Rails and the Mongrel Web server, since it suits the diverse needs of both.
Features
Monit is an open source utility that is designed for the management and monitoring of the various processes and programs running at a time—the files, directories and more— on a Linux or UNIX system. Although it has a distinctly large number of features, what actually makes it different is its ability to conduct automatic maintenance, i.e., it can execute causal actions, automatically, at the time the error occurrs. The following are some features of Monit: It monitors the daemon processes or similar ones at the localhost. The daemon processes include programs such as Apache, MySQL, Sendmail and the like. It monitors files and directories on the localhost, and is useful in keeping a check on the MD5 or SHA1 checksum of files. It gives alerts if a change is detected. It monitors network connections to servers, whether it is on the localhost or on a remote server. It monitors general system resources on the localhost such as CPU usage, memory and much more.
Monit can act automatically when an error occurs.
For instance, if your Apache server is using too many resources, it can automatically restart Apache and send you an alert message.
Installation
Monit is meant for Linux and UNIX systems, so all you need to do is open your command line and type in the commands given below. It’s just that simple.
For Debian-based Linux distros, the command is:
$ sudo apt-get install monit
For RPM-based systems, such as Fedora, CentOS and more, you need to work a little harder. Let’s first install some prerequisites, as follows:
$ yum -y install openssl* gcc $ yum install pam-devel $ yum install openssl-devel
Now you need to download the latest version of Monit from http://mmonit.com/monit
$ cd /usr/src/ $ wget http://mmonit/monit/dist/monit-5.5.tar.gz
Extract the tar file now, as follows:
$ tar zxvf monit-5.5.tar.gz
Compile from the source:
$ cd monit-5.5/ $ ./configure $ make && make install
Configuring and running Monit
By now, your system is up with Monit, and ready to retrieve and display system information. Along with the other great features, Monit possesses a great Web interface on Port 2812. All you need to do now is edit the Monit config file monitrc located at / etc/monit/ , according to your information needs. Let's get started.
First, you need to either edit the file or change file permissions by command, as the root user:
$ chmod 0700 /etc/monit/monitrc
The very first thing you probably want to configure is enabling the Web interface. Just add the following commands:
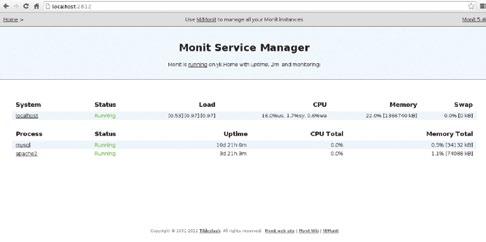
set httpd port 2812 and use address <server.example.net> allow <username>:<password> Figure: Monitoring with the web interface
With the above configuration, you can browse to the location server.example.net:2812 from your browser, with username and password as the login credentials.
Next, let’s configure Monit for email alerts, as follows:
set mailserver <smtp.example.net> username <smtp-username> password <smtp-password> set mail-format { from: server@example.net}
In the above configuration, smtp.example.net is an SMTP server, whereas the smtp-username and smtppassword are your login credentials. Much of all this is self-explanatory.
Monitoring the system
To monitor the general health and resources of the system, you need to append the lines below to the monitrc file:
check system <server.example.net> if loadavg(1min) > 4 then alert if loadavg(5min) > 2 then alert if memory usage > 75% then alert if swap usage > 25% then alert if cpu usage (user) > 70% then alert if cpu usage (system) > 30% then alert if cpu usage (wait) >20% then alert
Monitoring Apache Web server
To monitor Apache, you need to find the Apache process section in the monitrc file and uncomment it to produce the following result. Don't forget to take care of the pid file.
check process apache2 with pidfile /var/run/apache2.pid start program = “/etc/init.d/apache2 start” with timeout 60 seconds stop program = “/etc/init.d/apache2 stop” if cpu > 60% for 2 cycles then alert if cpu > 80% for 5 cycles then restart if children > 250 then restart if loadavg(5min) greater than 10 for 8 cycles then stop if 3 restarts within 5 cycles then timeout group server
Monitoring MySQL
To monitor a mysql instance, append the following to the monitrc file:
check process mysql with pidfile /var/run/mysqld/mysqld.pid group database start program = “/etc/init.d/mysql start” with timeout 60 seconds stop program = “/etc/init.d/mysql stop” if failed host 127.0.0.1 port 3306 then restart if 5 restarts within 5 cycles then timeout
There is a lot more you can do with Monit by making effective changes to the configuration file monitrc. To do that, uncomment the commented commands in the file. Once done, don't forget to restart Monit from the terminal before entering its Web interface. Restart by typing in:
$ sudo service monit restart
Once you restart Monit, browse to server.example.net:2812 to view process monitoring with a Web interface that would look something like what’s shown in Figure 1.
Continued from page 57....
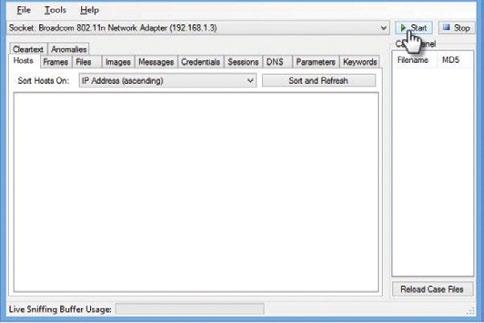
Figure 12: Options to start/stop the analysis
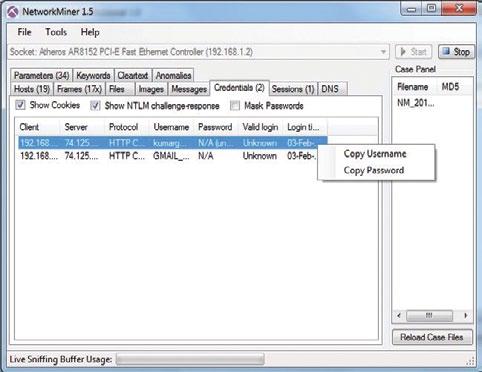
Figure 13: Copy information including username, password for the captured packet
Application
Monit has been used widely with popular Rail sites such as Twitter and Scribd. Apart from its use with Ruby and the Mongrel server, it can also be used to monitor system resources, Apache server, MySQL, SSH, nginx server and a lot more. Its unique capabilities that help it handle error situations, respond to services automatically and send alerts take Monit to the next level.
Its enterprise edition, called M/Monit, can be deployed for large applications while ensuring better control. Undoubtedly, Monit ranks high among the various network monitoring tools available.
References
[1] http://en.wikipedia.org [2] http://mmonit.com/monit
By: Yatharth A Khatri
The author is a FOSS lover and enjoys working on all types of FOSS projects. He is currently doing research on cloud computing and recent trends in programming. He is the founder of the project Brick the Code, which is meant to teach programming to kids in an easy and interactive way. You can reach him easily regarding FOSS issues at yatharth@brickthecode.org
The switch can also be merged to make it easy:
snort -dev -i eth0
ARP
Generally, you can see the IP packets. You can add ‘-a’ to see the ARP packets:
snort –deva –i eth0
Identifying the network
Often, you are required to log the packets relative to the network. To log the packets into directories where they are associated, use the ‘-h’ switch with the network address and the mask of home network.
snort -dev -i eth0 -l $HOME/log -h 192.168.1.0/24
Packet tracers or sniffers are also used by the hacking community to analyse data packets, but such tools are very useful for network administrators. They can use these sniffers to analyse the type of packets flowing in their network infrastructure, resolve bandwidth issues, and study the port and its protocols.
By: Dr Gaurav Kumar
The author is the managing director, Magma Research and Consultancy Pvt Ltd, Ambala. He is associated with a number of academic institutes, where he delivers expert lectures and conducts technical workshops on the latest technologies and tools. He can be contacted at kumargaurav.in@gmail.com
