
11 minute read
Turbocharged Tracing with LTTng

by Hiba Dweib
Developers How To
Turbocharged Tracing with LTTng
Advertisement
LTTng is the acronym for Linux Tracing Toolkitnext generation. This highly speed tracing tool helps in tracking down performance issues and debugging problems across several concurrent processes and threads. Read on to learn how to install the tool and carry out a trace
Tracing in the Linux world is part of the performance analysis activities such as debugging, profiling or even logging. Tracers are generally quicker and more accurate than other tools used for performance analysis. But why do we need them?
Tracing 101
Consider a soft real-time system in which the correctness of the output is highly dependent on not just the accuracy, but also on how long a program takes to execute in it. In such a system, it’s not really feasible to use the traditional debug approach of pausing the program and analysing it. Even a small ptrace() call can add an unwanted delay to the whole execution. Simultaneously, there could be a need to gather huge amounts of data from the kernel as well as your user space application at the same time. Is there a way to gather all that without disrupting the program’s execution?
Indeed, there is. The answer to all these questions is a technique called tracing, which is more like system-wide logging, but at a very low and fine grained level. Getting such details is particularly helpful where intricate, time accurate and well represented details of the system’s functioning cannot be achieved by traditional debuggers like GDB or KGDB. Neither can sampling-based profiling tools such as Perf prove to be completely useful.
Tracing can be divided according to the functional aspect (static or dynamic) or by its intended use (kernel or userspace tracing–also known as tracing domains, in the case of LTTng). Static tracing requires source code modification and recompilation of the target binary/kernel, whereas in dynamic tracing, you can insert a tracepoint directly into a running process/kernel or in a binary residing on the disk.
Before we move further, let’s understand some jargon and see what most of the tracing tools do. Tracing usually involves adding a special tracepoint in the code. This tracepoint can look like a simple function call, which can be inserted anywhere in the code (in case of userspace applications) or be provided as part of standard kernel tracing infrastructure (tracepoint ‘hooks' in the Linux kernel). Each tracepoint hit is usually associated with an event. The events are very low level and occur frequently. Some examples are syscall entry/exit, scheduling calls, etc. For userspace applications, these can be your own function calls. In general, tracing involves storing associated data in a special buffer whenever an event occurs. This data is obviously huge and contains precise timestamps of the tracepoint hit, along with any optional event-specific information (value of variables, registers, etc). All this information can be stored in a specific format for later retrieval and analysis.
Tracing tools
An important point to note is that not all available tracing tools
follow a standard way of gathering data. They are all designed differently. However, it is important to know that most of the tools are now converging in terms of functionality (like tracing, profiling, etc), and lots of features are beginning to overlap with each other. Some well-known tools that provide tracing or trace-like functionality are: SystemTap: Uses a scripting technique somewhat similar to Dtrace, with which you have to define your tracepoint in a specific script. Conditions could be associated with each tracepoint and written in a C-like SystemTap script. The script is then compiled to a kernel module before tracing starts. For dynamic tracing in the kernel,
SystemTap uses kprobes and for static tracing, the
TRACE_EVENT macro. In userspace, dynamic tracing is provided by the uprobes kernel module and Dyninst (pure user-space dynamic instrumentation). Ftrace: This is quite a popular tool among kernel developers and is part of the mainline kernel. Dynamic traces are based on kprobes and the static ones use the
TRACE_EVENT macro. However, you can’t define conditions, and only filtering of the traces can be done.
This is quite fast compared to other tools but is mainly aimed at the kernel guys. GDB: Surprise! In case you didn’t know, your friendly neighbourhood debugger doubles up as a tracer too.
Userspace dynamic tracing can be used by the trace command, which is a TRAP-based technique to collect data. Use the ftrace command (not to be confused with Ftrace described above) for very fast tracing but remember that it can’t be used everywhere in the code.
Conditions for trace collection can be provided, which are bytecode translated and executed at runtime. You can also use KGTP for dynamic tracing, which makes the kernel expose a GDB remote interface onto which any
GDB’s instance can get hooked, and use the available trace commands. Perf: This is also a popular Swiss-army knife kind of analysis tool. Developers use this mainly to gather hardware performance counter data or gather information about bottlenecks in process execution. The tracing features of Perf are similar to Ftrace, though Ftrace is better in terms of performance. Ktap: This is a very recent entry into the tracing arena.
It functions almost exactly like Dtrace as seen from its bytecode-based dynamic tracing scripts, which are very easy to implement. A lightweight VM is implemented in the kernel itself for bytecode interpretation of tracepoint scripts.
It is not yet in the mainline kernel though.
LTTng
Linux Trace Toolkit next generation is a very fast and extremely low-overhead kernel and userspace tracer. Low overhead, in simple terms, means that even with a ‘nonactivated' tracepoint inserted in the code, it gives nearzero impact on the overall execution of the target application. This makes LTTng a bit different from the other tools and a default choice for real time applications. Its tracing technique implements a fast wait-free read-copy-update (RCU) buffer for storing data from tracepoint execution.
In Figure 1, you can see that the LTTng session daemon acts as a focal point for trace control. An instrumented application, which contains the user’s desired tracepoints, automatically registers itself to the session daemon just as its execution starts. So is the case with the kernel too. This is useful for handling simultaneous trace control for multiple trace sessions. From now on, the session daemon will manage all the tracing activity. The LTTng consumer daemon is responsible for handling the trace data coming from the applications. It exports raw trace data and builds a CTF to be written on the disk. The Common Trace Format (CTF) is a compact binary format, which stores all the trace data in a very well structured manner for further analysis by certain trace viewers and converters such as Babeltrace (command line), Linux Trace Toolkit Viewer (LTTV - graphical) or the Eclipse Tracing and Monitoring Framework (TMF - graphical). For example, you can view the exact time and the control flow through the various calls in the kernel, graphically, in a timeline using TMF, instead of wading through thousands of lines of trace data manually, as in Babeltrace’s output. We’ll cover more about using TMF efficiently later, when we discuss analysing traces graphically to diagnose bottlenecks in the system.
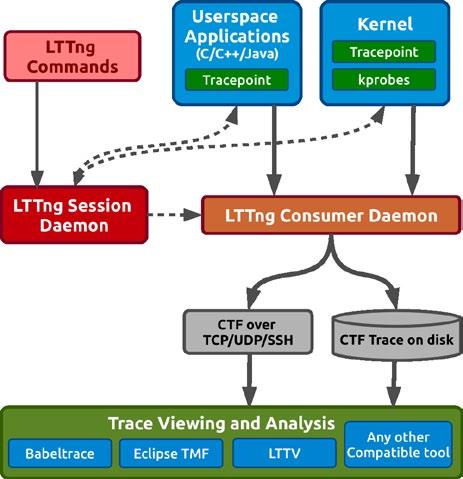
Figure 1: A typical tracing process flow with LTTng
The joys of tracing
Well, going further, let’s get our hands dirty with some tracing, and see all the insights a trace analysis can give about our kernel or application. The current stable release of LTTng is 2.3 Dominus Vobiscum.
Note: The LTTng releases starting from version 2.0 onwards are named after Québec’s micro-brewery beers!
System setup
I am using Fedora as an example; however, you can search for similar packages on Ubuntu and proceed. First, update your system and install the Development Tools package, which will give you the kernel headers too. Considering that you have configured sudo, give the following commands:
$ sudo yum update $ sudo yum group install “Development tools”
Check if the kernel headers package is the same version as your kernel:
$ rpm -qa | grep kernel-devel kernel-devel-3.11.10-301.fc20.x86_64
$ uname -r 3.11.10-301.fc20.x86_64
Building the kernel modules
If all seems to be going well, start off with building and installing the LTTng kernel modules for Fedora. If you are on Ubuntu, skip this step as the lttng-modules package is already available in the repos.
$ wget http://lttng.org/files/lttng-modules/lttng-modules2.3.4.tar.bz2 $ tar -xvf lttng-modules-2.3.4.tar.bz2 $ cd lttng-modules-2.3.4.tar.bz2 $ KERNELDIR=/usr/src/kernels/$(uname -r) make $ sudo KERNELDIR=/usr/src/kernels/$(uname -r) make modules_ install $ sudo depmod -a $ sudo modprobe lttng-tracer
You can use lsmod | grep lttng to see if the lttng_tracer module is loaded properly.
Installing LTTng packages
Install the packages for lttng-tools that provide the main components and the tracing client. You would also need lttngust for the userspace tracing library and its devel package, which will contain the necessary headers and examples for userspace tracepoints. Babeltrace, as described before, is a simple command line CTF trace viewer and converter.
$ sudo yum install lttng-tools lttng-ust babeltrace lttng-ust-devel
Post-installation
For kernel tracing, we need the LTTng session daemon to be run as root, and the LTTng client to be run either by root itself or by the user who should be part of the ‘tracing’ group.
$ sudo groupadd -r tracing $ sudo usermod -aG tracing suchakra
We are almost set! Just reboot your machine and check if the session daemon (lttng-sessiond) has started automatically and if the LTTng kernel modules are in place or not.
$ lsmod | grep lttng_tracer $ sudo service lttng-sessiond status
$ groups foo tracing
Your first trace
Let’s start with some simple experiments by tracing a 1-second sleep at the kernel level. You can first check the available kernel events:
$ lttng list -k Kernel events:
------------- writeback_nothread (loglevel: TRACE_EMERG (0)) (type: tracepoint) writeback_queue (loglevel: TRACE_EMERG (0)) (type: tracepoint) writeback_exec (loglevel: TRACE_EMERG (0)) (type: tracepoint) writeback_start (loglevel: TRACE_EMERG (0)) (type: tracepoint) writeback_written (loglevel: TRACE_EMERG (0)) (type: tracepoint) writeback_wait (loglevel: TRACE_EMERG (0)) (type: tracepoint) writeback_pages_written (loglevel: TRACE_EMERG (0)) (type: tracepoint)
. sched_switch (loglevel: TRACE_EMERG (0)) (type: tracepoint)
A long list of available kernel events is shown. Let’s pick sched_switch for our quick experiment and proceed. Make sure that lttng-session is running as the root before proceeding:
#create a new tracing session $ lttng create osfy Session osfy created. Traces will be written in /home/suchakra/lttng-traces/osfy20131227-220359
#enable the sched_switch event and $ lttng enable-event -k sched_switch kernel event sched_switch created in channel channel0
#start tracing $ lttng start
#start sleeping $ sleep 1
#stop tracing $ lttng stop Waiting for data availability. Tracing stopped for session osfy
So all the sched_switch commands between the start and stop of traces are traced, and the traces are written in /home/ suchakra/lttng-traces/osfy-20131227-220359. We can have a quick look at them using Babeltrace. Alternatively, the lttng view command calls babeltrace as the default viewer.
$ babeltrace /home/suchakra/lttng-traces/osfy-20131227-220359
This will list all the events with timing and other related context information like prev_comm, next_comm, next_tid, etc, per line. The problem is that there is an information overload for the user. In fact, we can do the following:
$ lttng view | wc -l 14520
Observe that LTTng recorded a total of 14520 sched_ switch events in the short tracing duration, which is a lot to understand in one go. To see the events of interest (those related to the sleep command), take a look at the following code snippet:
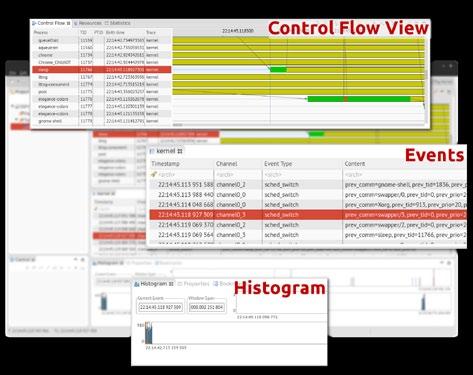
$ lttng view | grep sleep [22:14:45.118927309] (+0.004878641) isengard.localdomain sched_switch: { cpu_id = 3 }, { prev_comm = “swapper/3”, prev_tid = 0, prev_prio = 20, prev_state = 0, next_comm = “sleep”, next_tid = 11766, next_prio = 20 } [22:14:45.119069564] (+0.000000194) isengard.localdomain sched_switch: { cpu_id = 3 }, { prev_comm = “sleep”, prev_ tid = 11766, prev_prio = 20, prev_state = 64, next_comm = “swapper/3”, next_tid = 0, next_prio = 20 } [22:14:45.147798113] (+0.000301434) isengard.localdomain sched_switch: { cpu_id = 1 }, { prev_comm = “sleep”, prev_ tid = 11801, prev_prio = 20, prev_state = 1, next_comm = “swapper/1”, next_tid = 0, next_prio = 20 } Figure 2: A sample trace observed in TMF
Just a cursory look at the above code can tell you that each line is a single sched_switch event recorded from the kernel. The timestamps are high precision as you can see from two consecutive events. The one in parenthesis is the‘delta', i.e., the time between the previous event and the current one. The cpu_id tells the CPU for which the event was scheduled and various other context information is attached. All this is part of the CTF trace written.
After tracing is over, we can destroy the current tracing session as follows:
$ lttng destroy
Going further, we can use nice GUI tools such as Eclipse TMF for analysing the trace. Figure 2 shows what similar information would look like in TMF. You can see the timeline and control flow view, which is more intuitive. In the next article we will go into the details about userspace tracing with some real life examples and then move on to explore how to analyse a trace with TMF. Happy tracing!
Resources
In the meantime, have a look at http://lttng.org/documentation and http://www.youtube.com/user/lttng for more information. Note that the videos are a bit old and some steps may vary.
Acknowledgements
Thanks to Simon Marchi and Francis Giraldeau for reviewing this article and to the ‘tracing folks' at EfficiOS, Ericsson and École Polytechnique de Montréal.
By: Suchakrapani Sharma
The author is a PhD student at École Polytechnique de Montréal. He is currently doing research on dynamic tracing tools, and has varied interests—from performance analysis tools to embedded Linux and UX/graphics design. For more details, visit http://suchakra.wordpress.com
