1 minute read
Health and Social Work


Health and Social Work
Academic skills.
Advertisement
Students within HSK reported higher levels of confidence in questions regarding academic skills than in semester A. 73.33% (N=121/165) of HSK students report feeling confident in the academic skills needed for their course, 4.27% higher than in semester A.83.63% (N=138/165) of students agreed that academic staff had helped them develop these skillssince starting university, nearly 10% higher than semester A.
Course costs.
Students report facing unexpected costs as part of their course, and struggling to afford costs of course-related equipment and material. 32.93 (N=54/164) students report facing costs for essential course-related materials that they did not expect prior to starting their course, significantly (p= < .01) higher than in semester B. Furthermore, nearly 2 in 5 (39.02%, N=64/164) students report struggling to afford essential course-related materials, 9.81% higher than in semester A. The most common costs students reported struggling withwere related to placement such as travel and accommodation, as well as textbooks and laptops.
Course communication.
2 in 5
students are struggling to afford essentail course-related materials and equiptment
Satisfactionto questions regardingcourse communication rose,driven by positive responses about academic staff. 86.66% (N=143/165) reportedthat academic staff have been helpful when they’ve contacted them, 13.64% higher than in semester A. Satisfactionwith response time from staff rosefrom 72.49% (N=137/189) to 85.45% (N=141/165).Agreement that students knewwho they should contact if they need academic helpdecreased, from 94.18% (N=178/189) to 90.30% (N=149/165). Furthermore, understanding of the safety net policy was low, with 30.91% (N=51/165) of students reporting that they do not understand the policy and how it impacts them.
Personal Tutoring Framework.
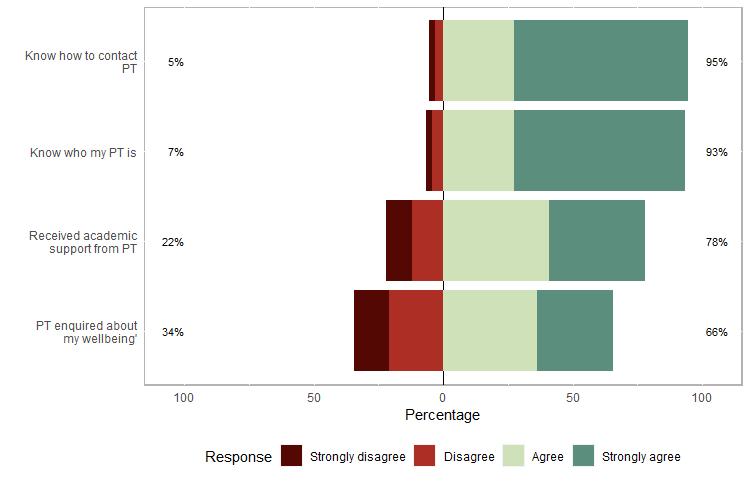
Satisfaction with the Personal Tutoring Framework was high(Figure 7). 78.11% (N=132/169) report having received academic support from their Personal Tutor this year, and 65.68% (N=111/169) report that their Personal Tutor has checked in with them about their wellbeing. 41.42% (N=70/169) report having had contact with their Personal Tutor more than twice this academic year.
Figure 7. Bar chart showing responses to questions regarding personal tutoring.