
32 minute read
Findings

from The Digital Drift
by HatchGlobal
The following findings summarise all participant responses to the seventeen interview questions. Responses have first been summarised in an overview table (Table 3), followed by a more detailed summary of each question in question number order below.
The detailed summaries of responses to each question include a graphical representation of responses to quantitative questions, the brief overview of all responses to that question (also shown in the table), followed by a list of bullet points highlighting some of the most salient perspectives and attitudes that emerged in response to that question.
Advertisement
The results confirmed the study’s hypothesis, that digital adoption in capital projects in Australia’s M&M industry has been limited to date. The Conclusion and discussion section analyses and further summarises the findings to pull out a set of overarching research themes and discusses how these themes may be interpreted in a broader industry context.
Table 3 – Summary of findings
100% of respondents said they had a varied approach to their project feasibility and feasibility stages of a project.
Question number
1
2
3
4
Question
Historically, how have you met budget/ schedule targets on projects?
What best describes your project delivery approach/contracting strategy?
Is the project delivery function centralised or commodity-focused? Does the project delivery function deliver new capital and sustaining capital
Have you deployed new or innovative partner/ supplier models and have you found them more/less successful?
Overview of responses
Respondents showed very little commonality on the degree to which projects have historically met budget/schedule targets. But there was general agreement that measuring and meeting those targets fell well short of the much broader and more nuanced range of metrics and targets that could be indicative of success on any given project at any given time. delivery/contracting strategy. Most respondents had a process to define the approach and the delivery model based on assessments of an individual project’s risks and requirements. Approaches tended to vary based on the project size, type, and in some cases, phase, as well as a broad variety of different factors. The chosen approach was typically made early in the preprojects?
Respondents generally said that major projects had a centralised project delivery function whereas smaller projects and capital-sustaining projects tended to be more regional or commodity-focused. While there was an even split between all three types for owner operators, 66% of service providers said they were commodity or industry focused. Service providers explained that a strong driver of the model they used was to align with clients.
Several respondents cited a tendency for project teams to be conservative when it came to delivery models with a common preference to stick to more traditional ones, particularly for major projects and the biggest industry players. Most respondents tended to emphasise that the impetus for innovation should be focused on the relationships between teams and partners and how everyone works together rather than on delivery models. To this point, one respondent described the likelihood of success as dependent on how well you manage the model, which comes down to relationships.
Question number
5
6
7
8
9
10
11
Question
Do you have internal and/or external project benchmarks for project delivery performance in place?
How would you describe your experience with continuous improvement/delivery excellence programs?
What five initiatives have delivered the greatest improvement in capital project performance/ management? Do you measure and/ or benchmark postproject performance i.e., operations readiness/ramp-up effectiveness?
Have you created analytics and predictive metrics (on projects) to support project managers?
How mature is your corporate capital project delivery methodology? Has it been updated to align with new digital tools/ applications?
Are all the execution processes and information/data requirements well understood and codified?
Overview of responses
All respondents confirmed they use benchmarks, and most confirmed they use both internal and external ones. A range of external benchmarks were mentioned, the most frequent, cited by 53% of respondents, was Independent Project Analysis (IPA). Other external benchmarks included those from Deloitte, Project Management Institute (PMI), Oxford University Projects, PM+, Hatch, and other sources. Most respondents used their own historical projects as internal benchmarks. Respondents described a wide variety of levels and types of implementation of continuous improvement/delivery excellence programs. While some were using well-defined programs, tools, and initiatives on a project-by-project basis, many simply referred to larger corporate improvement programs and a couple simply referred to it as an area of opportunity. The lack of commonality in responses indicated that there is little standardisation in the industry when it comes to continuous improvement/delivery excellence programs.
Respondents consistently cited one particular area for initiatives that has delivered the greatest improvement in capital project performance and management: people/relationship/cultural initiatives. Other types of initiatives mentioned include: digital/technology, integration, safety and readiness, and productivity.
Almost all respondents said they measure post-project performance: 64% said that it was a shared Key Performance Indicator (KPI) while 36% defined the KPIs as a project performance metric.
Generally, despite confirming that they saw the value of such things, respondents reported very minimal to no creation of analytics and predictive metrics or next-level KPIs on projects. Those that did report something described the efforts as being in their infancy. 61% of respondents said they were not using such things, 17% claimed they were investigating, 22% cited some project instances, and 0% had anything fully adopted.
While many respondents described their corporate capital project delivery methodology as mature or fairly/relatively mature, most respondents said they had not updated it or were in the process of trying to update it to align with new digital tools and applications. 11% of respondents said they had updated it, 61% said it was in progress, and 28% said they had not updated it.
While respondents tended to think their processes and data requirements were well understood, they differed on the level to which they described them as codified. Many described them as being codified in a documentcentric way (53%) while others described a more data-centric, workflowbased, and integrated way (47%). Several said they were not perfect and needed updating. There was a general desire for those that had not already to transition to a more integrated workflow-based system.
Question number
12
13
14
15
16
17
Question
Is there a corporate/ enterprise set of project delivery systems? Do these systems cover the execution of suppliers’ activities? What best describes the development of a specific capital projects digital strategy for your organisation? Does the organisation have a digital team dedicated to a project or is digital support provided from a central function? What has been the investment in BIM (4D, 5D, etc.) and/or digital twins (virtual representation of the physical)?
Is a defined strategy in place regarding mobility i.e., connected worker, RFID, etc.?
How would you rate your level of digitisations on projects? Are you using technologies such as blockchain, VR, AR, and/or AI?
Overview of responses
79% of respondents described the systems as project specific while 21% described them as enterprise. 92% of respondents said they did not cover suppliers’ activities while just 8% said they did. There was a general desire or at least an interest in exploring the potential of a single-platform integrated approach, but many challenges in getting the suppliers, service providers, clients, and owners on the same page.
Most respondents described little to no development of digital strategies for capital projects. 72% said they had no digital strategy, 11% said they had a documented (not embraced) strategy, and 17% said they had an embraced strategy.
78% of respondents said that digital support was provided by a central function, while 22% described it as project-dedicated. One respondent described what they believed would be an inevitable shift from technology being a “thing” to being a tool used by everyone and owned by project team leaders. Another explained that they can only see the requirement for digital growing in the future.
Respondents described a full range of levels of investment in BIM and digital twins from none to significant. Most reported being in the early stages of investment, particularly with respect to digital twins.
Most respondents either had no defined strategy or were thinking of trying out mobility technologies and practices in an ad-hoc or adopt-and-adapt manner with no centralised or consistent approach. Two respondents described a well-established mobile strategy using RFID tags, one of which said the technology has driven value for operations in terms of safety and asset management. Another said they are working on incorporating these elements into a wider digital strategy focused on capturing data more effectively, and they see the benefit for productivity. Respondents varied in the degrees to which they rated their levels of digitisations on projects from low to high. Most respondents indicated that where they were using advanced technologies like blockchain, VR, AR, and AI it was generally on an ad-hoc basis or being trialled but not being fully committed to yet. 12% of respondents confirmed they had adopted all leading technologies, 35% were trialling on projects, 41% were investigating, and 12% were not considering.
Question 1: Historically, how have you met budget/schedule targets on projects?
Overview of responses: respondents showed very little commonality on the degree to which projects have historically met budget/schedule targets. However, there was general agreement that measuring and meeting those targets fell well short of the much broader and more nuanced range of metrics and targets that could be indicative of success on any given project at any given time.
Wide range of variance on meeting budget/
schedule targets: of those who answered with quantifiable percentages, a broad range of averages were cited. Everything from being under budget and within schedule to being within 5% to 10% of those targets, to being within 25% of those targets.
Project phase matters for measuring and
meeting budget/schedule targets: one respondent claimed that in the study phase it is a lot easier to deliver projects as the focus is on assessing technical options and divergent solutions to achieve a capital risk return profile that is commensurate with the business’ requirements. Another respondent said that budget and schedule metrics were only relevant once the project achieved its performance targets, i.e., the actual benefits for which the investment was approved.
Relevant targets go well beyond budget and
schedule: most respondents said that while budget and schedule adherence was important, a much broader set of metrics and targets were important for assessing the success of any given project. Respondents emphasised that different targets are needed for different types of projects, different clients and partners, and different stages in the life cycle of a project. Such targets respondents mentioned included: performance against project benefits promised, predictability, efficiency, business value, nameplate capacity, safety performance, net present value (NPV), toll gate performance, the customer view of success (tangible and perceived) and customer satisfaction, technology/support function, environmental and social license performance, quality, value earned at the right rate, turnover ratios and culture, training adherence, and cashflow adherence.
Other success factors: some respondents cited other success factors in the process including the development of early-stage divergent solutions and integration of teams and processes through delivery and ramp-up.
Question 2: What best describes your project delivery approach/contracting strategy? (Answer options: 1. Singular approach 2. Varied approach)
What best describes your project delivery approach/contracting strategy? Overview of responses: 100% of respondents said they had a varied approach to their project delivery/ contracting strategy. Most respondents had a process to define the approach and the delivery model based on assessments of an individual project’s risks and requirements. Approaches tended to vary based on the project size, type, and in some cases phase, as well as a broad variety of different factors. The chosen approach was typically made early in the pre-feasibility and feasibility stages of a project.
Major dimensions along which
size (mega, asset-level, minor), project type (traditional construction, technology), and project phase (development, execution). One respondent described a stage gate process by which projects had the flexibility to change in approach from one phase to the next (for example, the first two development stages might start with ECM while later execution stages would use an EPC model).
Risks and requirements considered in defining
an approach: complexity, how much detailed engineering has been done, teams and skill sets, priorities, budget and schedule constraints, knowledge, scale, impact, market and people availability, geographic conditions, and type of technology being applied.
Models mentioned: respondents cited a range of contracting models used including EPC, EPCM, PCM, D&C, P&C, client management models including owner’s team and integrated owner’s team, as well as financial models including lump sum and reimbursable.
project delivery approaches vary: project
120%
100%
80%
60%
40%
20%
0%
Singlular approach Varied approach
Attitudes to project delivery: respondents revealed that business and project groups tend to be risk averse and there is a reticence to change in the industry. Despite believing every project is unique, people tend to like tried and true methods and three out of four times you define a model that is a variant of the previous project.
Next steps: one respondent cited a need to get better at articulating the business case for the contracting strategy itself, while another felt that moving towards a more integrated approach to delivery, making better use of digital solutions (such as interacting via a common platform, getting more transparency and visualisations into what is happening across the entire value chain, and getting the right people involved earlier on), as well as having more trust in people was the right way forward. The vision was an integrated partnership type model—the walls are beginning to come down and there is a change from what has traditionally been a siloed approach, but in order to unlock the true value people need to share their information with each other.
Question 3: Is the project delivery function centralised, regional, or commodityfocused? Does the project delivery function deliver new capital and sustaining capital projects? (Answer options: 1. Centralised 2. Regional 3. Commodity-focused)
Overview of responses: respondents generally said that major projects had a centralised project delivery function whereas smaller projects and capital sustaining projects tended to be more regional or commodityfocused. While there was an even split between all three types for owner operators, 66% of service providers said they were commodity or industry focused. Service providers explained that a strong driver of the model they used was to align with clients.
Technology projects are delivered
0% differently: those that commented on technology projects described them as being delivered by a
drive synergies and commonalities across the full separate function within the business based on the recognition that they often follow a different project delivery methodology.
Many use centres of excellence: in addition respondents confirmed the existence of a project centre of excellence, a centralised group that is responsible for providing good rules, tools, people, and systems support and governance, as well as centralised cost, schedule, and estimating
Is the project delivery function centralised, regional or commodity-focused?
45%
40%
35%
30%
25%
20%
15%
10%
5%
Centralised (39%) Regional (28%) Commodity (33%)
functions. Within these centres there are generally different frameworks for major projects and asset or sustaining capital projects, but with overlaps to to having a centralised project group, several
range of projects.
Centralisations has been a beneficial
transition: one respondent noted the transition to centralisations they have made over the past six years has driven improvements across all projects.

Question 4: Have you deployed new or innovative partner/supplier models and have you found them more/less successful?
Overview of responses: several respondents cited a tendency for project teams to be conservative when it came to delivery models with a common preference to stick to more traditional ones, particularly for major projects and the biggest industry players. Most respondents tended to emphasise that the impetus for innovation should be focused on the relationships between teams and partners and how everyone works together rather than on delivery models. To this point, one respondent described the likelihood of success as dependent on how well you manage the model, which ultimately comes down to relationships.
Traditional tendencies: several respondents described the conservative nature of the industry. A shared sentiment was that project teams are not incentivised to be creative.
Uncertainty over what constitutes an innovative
model: several respondents also expressed uncertainty about whether what they were doing was innovative or not.
Innovative approaches: a few respondents cited some innovative initiatives including technology development through a prototype, alternative framework agreements, an open book partnership with a technology partner, incentivised or gain sharing contracts, and crowdsourcing digital solutions. One respondent’s global platform for crowdsourcing won an industry award and has delivered $10M of free cash flow for some (smaller) companies. Another respondent described their agile project development pathway based on principles rather than process, with greater flexibility and adaptability to allow the project to change form to better meet budget and schedule targets. Others offered up innovations they had developed in other areas, not in partner/supplier models but in processing technologies and the maintenance side of the business.
Barriers to innovation: respondents noted several concerns that constitute potential barriers to innovation, including the capability of the industry to correctly understand each contracting model alongside an increasing preference for lump-sum fixed-price contracts which was attributed to a reduced level of experience in the contracting, procurement, and project delivery capabilities across the industry. In another vein, one respondent said when they have tried something different, for example technology development through a prototype, they got value out of it and it got the job done. The barrier is not that it is not successful, but that the nature of the process of setting up a project execution strategy tends to land on a model that is a variation of a previous (more traditional) one. Another respondent had trialled some innovative initiatives without any beneficial results or outcomes.
Opportunities for improving
relationships: respondents listed several areas in which relationships could be improved to deliver better value for projects, including earlier engagement with contractors, continuity of working relationships throughout the project life cycle, and generally moving away from delivery siloes towards a more integrated team approach that considers the whole life cycle. One respondent cited the importance of fostering a more collaborative approach to partnerships, information, and gain sharing in the development of more innovative approaches and solutions.
(Answer options: 1. Yes 2. No)
Overview of responses: all respondents confirmed they use benchmarks and most confirmed they use both internal and external ones. A range of external benchmarks were mentioned, the most frequent, cited by 53% of respondents, was IPA. Other external benchmarks included those from Deloitte, PMI, Oxford University Projects and other sources. Most respondents used their own historical projects as internal benchmarks.
Challenges of using external benchmarks: one respondent cited the challenges of using external benchmarking as the fact of it being difficult to find relevant examples that are directly comparable to any given current project.
Overview of responses: respondents described a wide variety of levels and types of implementation of continuous improvement/delivery excellence programs. While some were using well-defined programs, tools, and initiatives on a project-byproject basis, many simply referred to larger corporate improvement programs and a couple simply referred to it as an area of opportunity. The lack of commonality in responses indicated that there is little standardisation in the industry when it comes to continuous improvement/ delivery excellence programs.
Corporate improvement programs: respondents cited various annual or corporate improvement programs focused on areas such as safety, risk management, health and well-being, digital and technology, culture and engagement, and project delivery improvement. One respondent mentioned that all programs were assessed quarterly and annually and that this was rolled into PM+. Another said their annual reviews included improvements that were then fed back into methodologies, procedures, and controls. A couple of respondents described dedicated teams including an agile improvement team and productivity and innovation teams, as well as support networks to identify opportunities, provide tools, etc. One respondent described continuous improvement as a concept built into the culture of the organisations.
Project improvement initiatives: several respondents mentioned using lessons learned as a way to drive improvements on projects. One respondent cited inflight reviews done on studies and projects in implementation. One respondent mentioned using IPA value improvement practices. Another cited the use of a range of technologies on one particular project (BIM 6D, full digital twin, iPads, GPS) to perform a six-month selfmonitoring followed by a recommissioning based on this data. Another respondent mentioned they were in the early stages of developing a set of process close-outs to capture data to do better. Another mentioned a community-based living document in SharePoint for executive phase reviews, postinvestment reviews, etc. Another respondent described a weekly check-in on projects and a monthly SteerCo check.
Challenges: there was generally an expectation that suppliers or partners would bring innovation, and a corresponding disappointment when it was not found. A couple of respondents said they expected to see such improvement programs built into the EPC work plan or innovative approaches taken by the project managers, but were not seeing any evidence of it. Another challenge cited by two respondents was the reticence of projects or project managers to change once they were up and running. Finally, a lack of continuity or consistency of resources (i.e., turnover) on a project was cited as another barrier to implementing improvement programs as high-performing resources are not dedicated for five- to or ten-plus years.
Areas of opportunity: one respondent cited the need for digital technologies to help optimise capital spend by integrating the value chain. Another encouraged the ownership of innovation by the project manager and their ability to operate autonomously.

Overview of responses: Particular areas for initiatives that are consistently cited as delivering the greatest improvement in capital project performance and management are people/relationship/cultural initiatives. Other types of initiatives mentioned include: digital/technology, integration, safety and readiness, and productivity.
People/relationship/cultural initiatives: a majority of respondents cited people, relationships, and cultural initiatives among those that have yielded the greatest improvements. These include initiatives related to people’s well-being, the diversity of teams (i.e., gender diversity, diversity of thought), as well as improving the relationships between people and teams for smoother workflow, and improving the emphasis on better safety and productivity.
Digital/technology initiatives: digital and technology initiatives were most often cited as an emerging area that could yield big improvements at some point in the future, but some respondents also expressed hesitation in this area and stressed that such initiatives needed to more robustly demonstrate value before being considered. However, one respondent spoke at length about the value of digital citing an enterprise reporting platform that delivers $10M in improvements each year already. That same respondent also mentioned the importance of automation and continuous learning for improving safety, decreasing costs, and increasing productivity. Finally, that same respondent identified that one of the biggest challenges to reaping the rewards of digital initiatives is the need to also invest in more digital education and getting people to use the digital tools.
Integration initiatives: an integrated approach involves getting the right people involved, at the right time, with the right voice. Integration initiatives were mentioned by several respondents as delivering major improvements. This included different types of integration both across project stages (between delivery, ramp-up, and operations teams) and across current operations teams.
Safety and readiness initiatives: respondents cited an improvement in safety performance as contributing to project delivery performance, and the importance of engaged, embedded teams to improve readiness which in turn contributes to better outcomes. It was also noted that operations teams need to improve digital capabilities.
Productivity initiatives: respondents also cited the benefits of targeted initiatives to improve productivity. One respondent said that while reducing quantities in engineering helps, often the real wins are the billions of dollars of indirects related to construction.

Question 8: Do you measure and/or benchmark post-project performance (i.e., operations readiness/ramp-up effectiveness)?
(Answer options: 1. Yes 2. No)
Overview of responses: almost all respondents said they measure post-project performance: 64% said that it was a shared KPI while 36% defined the KPIs as a project performance metric.
Shared KPIs: many respondents described the post-project KPIs as being shared between the projects and operations teams. Metrics used: respondents described various metrics used including capacity and rampup performance, asset performance, capital productivity, meeting budget and schedule, engagement of site operations, and executing a proper operational readiness plan.
Timelines: respondents cited a range of postproject performance timelines for measurement, anywhere from immediately after, to seven days after, to even one year after project completion. Some assessed performance at multiple points over time.

(Answer options: 1. Fully adopted 2. Project instances 3. Investigating 4. Not using) Have you created analytics and predictive
Overview of responses: generally, despite confirming that they saw the value of such things, respondents reported very minimal to no creation of analytics and 10%
predictive metrics or next-level KPIs on projects. Those that did report something described the efforts as being in their infancy: 61% of respondents said they were not using such things, 17% claimed they were investigating, 22% cited some project instances, and 0% had anything fully adopted.
Barrier to adoption—data quality: several respondents cited the problem of data quality and integrity as being a barrier to adopting more sophisticated analytics. One respondent said data libraries are not well structured, another described data cleaning as an important part of analysis, and another said that data needed to be in the right format and visualisations tools also need to be in place.
Barrier to adoption—scepticism over value
added: a few respondents explained that they were not using more advanced analytics to tell them something that a person could already tell them. One respondent said they had tried but found they were not getting better insights than their project services people could tell them. Another echoed this sentiment in describing their approach as expert-driven rather
70%
60%
50%
40%
30%
20%
0%
than analytics-driven. metrics (on projects) to support project managers?
Fully Adopted (0%)
Project Instances (22%) Investigating (17%) Not Using (61%)
Barrier to adoption—partner expectations:
several respondents claimed that they were looking for innovation from service providers or contract partners and were finding it lacking. One described this syndrome as an industry-wide issue. Another respondent expressed difficulty in moving into the digital age when workers on site were still asking for 2D drawings.
Next steps: many respondents said they saw the value of a more sophisticated approach and using predictive analytics, and one explained that while the solution is not a five-minute conversation, the conversation is happening.
Question 10: How mature is your corporate capital project delivery methodology? Has it been updated to align with new digital tools/ applications? (Answer options: 1. Updated 2. In progress 3. Not updated)
Overview of responses: while many respondents described their corporate capital project delivery methodology as mature or fairly/relatively mature, most respondents said they had not updated it or were in the process of trying to update it to align with new digital tools and applications. About 11% of respondents said they had updated it, 61% said it was in progress, and 28% said they had not updated it.
Digital tools mentioned: several respondents mentioned some digital tools they were either 20% 10%
using, starting to use, or considering using, including Ecosys, SPMat, SP Suite, Procon, PowerBI, MS Azure, SAP, Ariba, and Aconex.
Updates being made or considered: respondents were making updates such as developing automated reporting, accurate progress measurement, purchasing commitments, automatic integration, conveyor monitoring, digital twins, and improved control systems for safety management, data management, and financial package control. One respondent explained they were changing the way they did studies to consider what was needed to create a digital asset or to fully enable assets. Another was considering instrumentation, communication networks, and transactional applications to take full advantage of the data they already have in order to set up scopes to support projects that could deliver better digital insights.
Barriers to updating for digital: a disconnect in understanding of the scope and capability of digital advances was mentioned by one respondent with contractors and suppliers: people who deliver projects do not think like operators. The respondent also described a tendency to create static models,
70%
60%
50%
40%
30%
not those that learn and change, and mentioned the
0% Have you updated project methodology to be aligned with new digital tools/applications?
Yes (11%) In Progress (61%) No (28%)
problem of a plethora of siloed platforms provided by different suppliers as a challenge for integrating systems properly. Finally, this respondent described the confusion surrounding tools available in the market and lack of value being delivered by big platform companies that fail to target solutions appropriately.
Attitudes towards digital: attitudes towards digital were mixed. Some respondents still questioned the value of making particular digital updates or going through the trouble of creating complex systems when they could just use contractors’ and suppliers’ tools. Others, however, saw the value and were actively trying to develop more digital sophistication. One respondent described the integration potential of the system as being able to greatly reduce the cycle time of implementing major changes (normally taking weeks or months to process) by 75%. Another respondent spoke at length about the dynamic digital twins they were creating for all sites, capturing the entire value chain using MS Azure.
Overview of responses: while respondents tended to think their processes and data requirements were well understood, they differed on the level to which they described them as codified. Many described them as being codified in a document-centric way (53%) while others described a more data-centric, workflowbased, and integrated way (47%). Several said they were not perfect and needed updating. There was a general desire for those that had not already done so to transition to a more integrated workflow-based system.
Defined processes and data: for an owner, they provided design criterion, data, systems, and integration requirements, and a handover standard to the EPCM, leaving the rest to them, but would only hire those with a leading edge in digital systems. Others had study definition guidelines including workflows, forms, templates, and quick start tools. One respondent explained that their definitions were created to achieve an outcome rather than dictating the process to get there. Flexible workflows: one respondent had flexible guidelines where the project teams were expected to develop their own process flows and ways of working, and even their own preferred project delivery tools. Documents were only used to give a head start, but while they made some things quicker, the documents also hampered projects from adopting a data-centric approach, so the emphasis was on letting the team define their own approach.
Attitudes toward codification: generally, respondents were in favour of updating their systems toward better integration and a workflowbased structure. One respondent recognised that codification was necessary because of the level of investment in the processes. In contrast, another respondent reported that project teams do not respond well to being forced into systems, while another thought that they had too many documents.

Question 12: Is there a corporate/enterprise set of project delivery systems? Do these systems cover the execution of suppliers’ activities?
(Answer options: Part 1: 1. Enterprise 2. Project-specific Part 2: 1. Yes 2. No)
Overview of responses: 79% of respondents described the systems as project-specific while 21% described them as enterprise. Further, 92% of respondents said they did not cover suppliers’ activities, while just 8% said they did. There was a general desire or at least an interest in exploring the potential of a single-platformintegrated approach, but there are many challenges in getting the suppliers, service providers, clients, and owners on the same page.
Attitudes towards ownership of systems versus
system-agnostic approach: one respondent reported that they felt as though they were funding a number of systems for their EPCMs without seeing enough returns. They believed that getting into design tools would remove the ownership, responsibility, and productivity from an EPCM. Another described conversations and studies in place to determine whether mandating or having agnostic systems was the better way to go, questioning what the limitations would be on a single global model. Another respondent described a goal of trying to be system-agnostic through a centralised platform.
Challenges for integration: a respondent explained one of the biggest problems for integration was that every supplier has a different platform and customised tools, so in order to achieve full digital operations at sites you either have to pick a platform or have a neutral platform that pulls data from others, and with the latter the question was what level of intelligence do you lose through this central data aggregator? Other respondents echoed the problem of service providers’ capabilities to present


information in an appropriate form as well as the need for flexibility to cater to many different clients with different approaches. One respondent described the attitude or interest of the company’s owner in data-driven systems and integration as low. Another respondent described hesitation to over-invest in a fully integrated suite of project delivery tools.
(Answer options: 1. Documented and embraced 2. Documented and not embraced 3. No digital strategy)
Overview of responses: most respondents described little to no development of digital strategies for capital projects. Approximately 72% said they had no digital strategy, 11% said they had a documented (not embraced) strategy, and 17% said they had an embraced strategy.
Barriers to adoption: one respondent described being sceptical, noting that while they see the benefits, they cannot be quantified. Another respondent described the challenges of What best describes the development of a specific
board. Another explained that they had people in the business who have done things a certain way for a long time, so there is a big change management component needed in shifting to digital.
People-first approach: one respondent described an adopt-and-adapt approach, meaning that projects are driven by team members and enabled by technology, and a good project person is aware of the benefits and risks of digital and will choose to use a digital strategy to achieve certain goals like reducing cycle times, using fewer EPCM people, and better asset integration and handover.
80% 70% 60% 50% 40% 30% 10% 0%
20% industry preparedness and getting all players on capital projects digital strategy for your organisation?
Embraced (17%) Documented (not embraced) (11%) No Digital Strategy (72%)

Attitudes toward digital strategy for capital
projects: generally, respondents identified a more sophisticated digital strategy as a future goal for the organisation for which they understood the benefits and acknowledged the inevitability of a shift to digital more broadly. One respondent revealed that companies that invest now will have the biggest advantage.
Opportunities: one respondent cited the important role of a new generation of project managers that have grown up surrounded by technology and are driving the shift to digital.
(Answer options: 1. Dedicated 2. Centralised)
Overview of responses: 78% of respondents said that digital support was provided by a central function, while 22% described it as project-dedicated. One respondent described what they believed would be an inevitable shift from technology being a “thing” to being a tool used by everyone and owned by project team leaders.
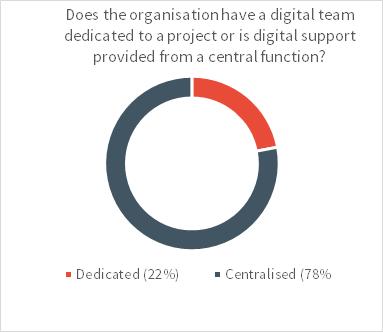
Does the organisation have a digital team dedicated to a project or is digital support provided from a central function?

Overview of responses: respondents described a full range of levels of investment in BIM and digital twins from none to significant. Most reported being in the early stages of investment, particularly with respect to digital twins.
How to do it successfully: one respondent said it was important to frame the investment in these technologies in the context of an overall digital strategy from an operations perspective, and that the rest of the asset needed to be up-to-date in order to derive value from these technologies. The respondent also said that the potential of digital when considered in the early stages was a relatively small investment.
Approaches to adoption: one respondent described a project-by-project approach to investment. Another described the collaborative

involvement of engineering and construction companies in the design environment. Another said they had hired a full-time data scientist to work on such things. One respondent said they had already implemented a virtual reality room with Synchro-4D to optimise schedule activities and present a visual representation to workers before they get to the site. This same respondent described investing in their own people to up-skill them on these types of technologies.
Barriers to adoption: barriers mentioned included a lack of understanding of how BIM was different from digital twins, the lack of a standard delivery model in the industry and thus the problem of dealing with constant change, the uncertainty as to the ultimate value of such things, practical challenges such as missing aspects, a lack of uniformity across sites, and the lack of support from drafters and operators to maintain the data.
Overview of responses: most respondents either had no defined strategy or were thinking of trying out mobility technologies and practices in an ad-hoc or adopt-and-adapt manner with no centralised or consistent approach. Two respondents described a well-established mobile strategy using RFID tags, one of which said the technology has driven value for operations in terms of safety and asset management. Another said they are working on incorporating these elements into a wider digital strategy focused on capturing data more effectively, and they see the benefit for productivity. Barriers to adoption: several respondents questioned the value or emphasised the need for demonstrable value before considering such things. One respondent also noted that the value may be there but if it was challenging to quantify there could be a missed opportunity. Another respondent pushed the responsibility for this to the service provider, explaining the challenges of being able to sort through the gimmicks to find the value. This respondent also cited the challenge of variable connectivity in remote locations for using RFID technology. One respondent, while they acknowledged the value of mobility technology and sensors that could eventually enable artificial intelligence applications, said they are currently better served by expert advice.

Overview of responses: respondents varied in the degrees to which they rated their levels of digitisations on projects from low to high. Most respondents indicated that where they were using advanced technologies like blockchain, VR, AR, and AI it was generally on an ad-hoc basis or being trialled but not being fully committed to yet. About 12% of respondents confirmed they had adopted all leading technologies, 35% were trialling on projects, 41% were investigating, and 12% were not considering.
Technologies in use: several respondents said they were using VR technology. One, for local communities to show them what will be built. Two respondents said they were using HoloLens to run management teams through the plant. One respondent said they were using machine learning and AI “extensively” including everything from machine vision to tell what asset you are looking at, to Watson for cognitive intelligence. Those respondents who said they were using machine learning and AI said it was being used more widely in operations with limited implementation into the project domain. One respondent cited the use of sensors including RFID tags that were being used to track material in a mill alongside others that were described as laying all the right foundations to be AI-ready, though right now the operation is lacking enough data for such technologies to be useful, and still relies on experts for decision-making.
Barriers to adoption: several respondents identified certain barriers to adoption including those related to data and integration, responsibility and decision-making, and cultural resistance. Many respondents cited quality of data as being a big barrier to adopting new technologies such as
45% 40% 35% 30% 25% 20% 15% 10% 5% 0%
How would you rate your level of digitisation on projects? Are you using technologies such as Blockchain, VR, AR, AI?
Adopted (12%) Trialing (35%) Investigating (41%) Minimal (12%)
applying machine learning and AI applications. The need for better integration between existing systems and the need to create an open architecture were also cited as challenges. On the topic of responsibility and decision-making, one respondent said that older generations of decision-makers are often the furthest from the technology and the least technology savvy. Many respondents felt that the onus was on engineering and construction companies to tell the owners what was required in terms of technology and make suggestions for innovation.
Where the interest lies: respondents expressed interest in advanced technologies for a broad range of applications including scheduling, project delivery, cost reduction, and training. Many respondents said they were having conversations about certain technologies, but have not often moved beyond this stage.
