10 minute read
DEGRADATION

In its raw state natural rubber will degrade rapidly whence weathered. Subsequently UV absorbers, antioxidants and antiozonants are used to contribute in prolonging a vulcanised rubber compounds service life by preserving their elastic and resilient properties over a longer time frame.
The service life and durability of rubber is dependant on its exposure to oxygen, ozone, UV light and heat, which all contribute to its ageing process and subsequent degradation due to natural rubbers high unsaturation(29,25). The major cause of degradation is caused by the rubbers exposure to oxygen. However prior to the commencement of its degradation by oxidisation, energy is required to break the carbon-carbon or carbon-oxygen bonds in the polymer chain. This energy usually originates from prolonged exposure to UV but can also be caused by applied stress or extreme heat (2,3). Hence when natural rubber is protected from these degradation initiators, Its mechanical properties are preserved for significantly longer periods of time.
Advertisement
However through prolonging its lifespan through the inclusion of fillers (in particular carbon black), certain accelerators and synthetic rubbers, natural rubbers biodegradable properties are undermined (29). Hence, their inclusion must be minimised throughout its processing if biodegradtion of the material is required.
2.5
Internal Environment Degradation
Authors review on data collected by Rapra technology Ltd on the Natural ageing of rubber: changes in physical properties over 40 years.
The rate of a rubbers degradation, is dependant on various factors such as the grade of natural rubber sourced, the vulcanization system and the type of antidegradant agents used. Due to the complexity of predictive ageing with the various blends of compound rubbers, a natural ageing programme was developed in 1958 with rubber and polymer testing company Rapra technology Ltd to determine the natural alteration in physical properties in rubber compounds over a 40 year period.(30)
The test consisted of placing 19 different test samples of varying blends of natural and synthetic rubber within internal environments in which the pieces were placed unstrained (with the exception of a long term compression set samples) with free access of air but excluding light to simulate shelf storage. (30)
Although the placing of the sample pieces internally (due to the erratic nature of external conditions over this time period) only provides relevant data for unlit conditions, sample rubber composites were placed in 3 different climates to account for the effect of climatic variance such as temperature and humidity. The three climates consisted of one temperate climate in Shawbury England(average indoor temperature range between 18-25oC). One hot and dry climate in Clonacurry Australia(average daily minimum, mean and maximum temperatures were 18oC, 25oC, 32oC). As well as one hot and wet climate in Innisfail Australia(average daily minimum, mean and maximum temperatures were 19.8oC, 23,6oC and 28.2oC)(30).
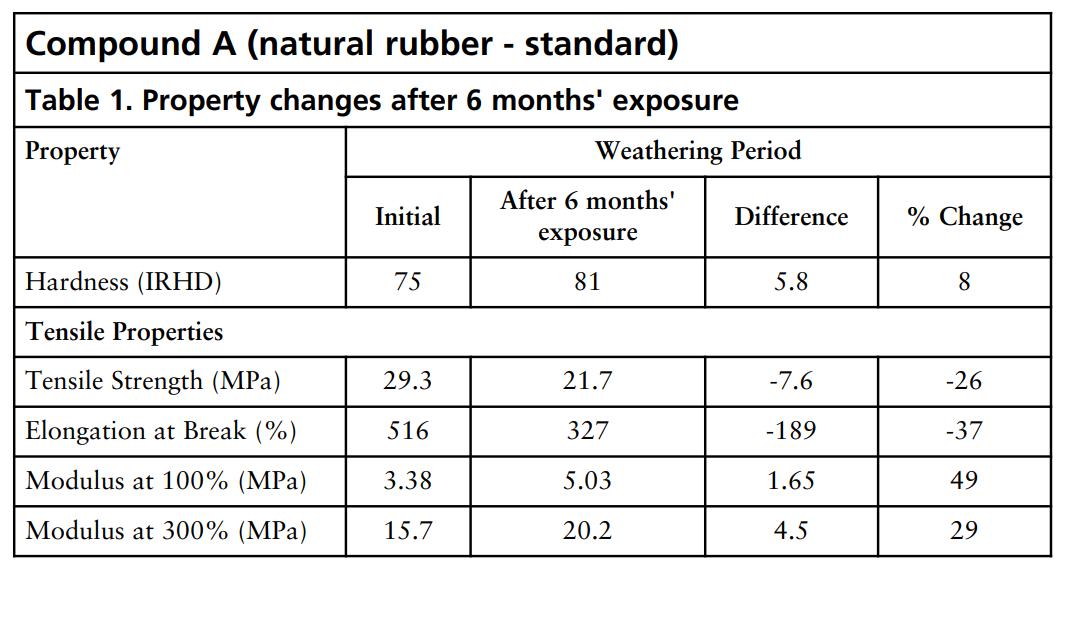
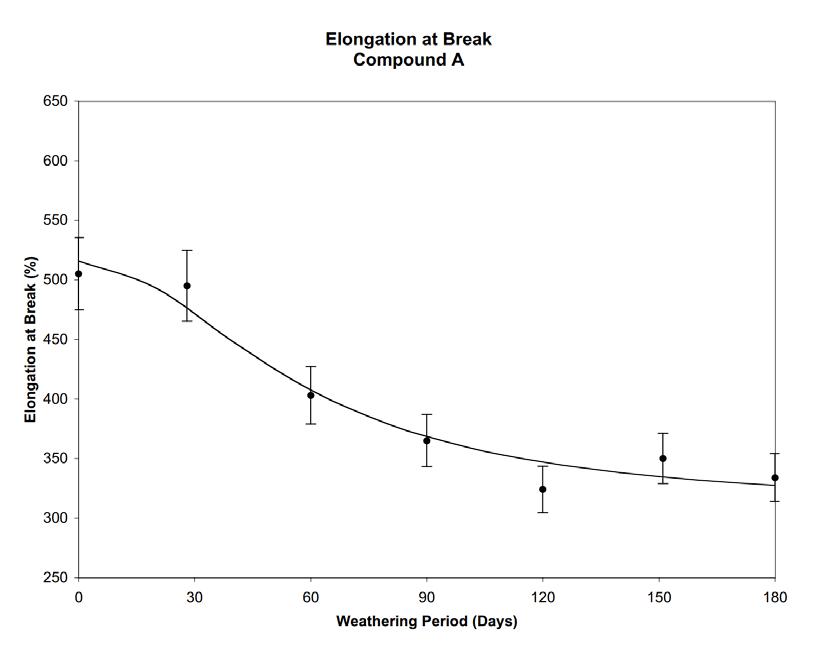
Sample composites were tested bi-annually for changes in mechanical properties. Of the 19 pieces sample blends tested, four of these were natural rubber composites, of which the first, compound A, contains the least amount of additives to natural rubber proportion therefore this composite was selected as the sample of my review.
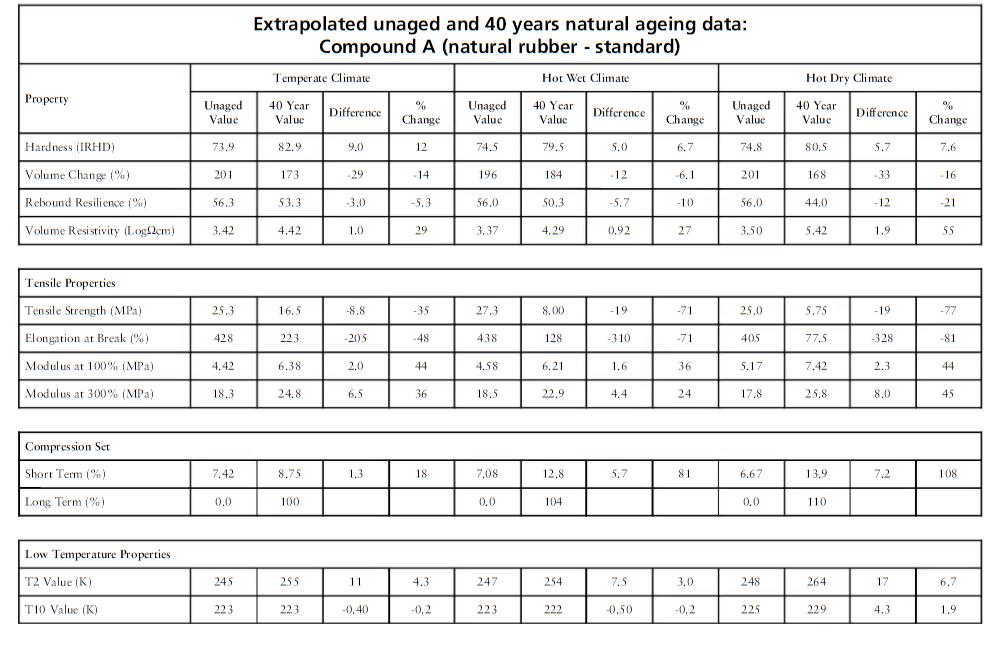
Although multiple properties were tested for, such as tensile strength, hardness, modulus 100% and modulus 300%, the authors focus lies in the performance of the materials elongation at break as these results will most significantly affect the intended deformation of the architectural facade.
The results displayed that compound A’s elongation at break, in a temperate climate (TC) decreased by 48% after a 40 year period. In the hot and humid climate (HWC) decreased by 71 %, and in the hot and wet climate (HDC) 81%.
Overall the tests show that over time the materials elasticity decreases at a fairly constant rate, however it is evident that an increase in temperature drastically increases the rate of its deterioration. Although not mentioned in the report by Rapra technology Ltd, it might be assumed the increase in temperature, provided sufficient energy for the breaking of the bonds and subsequently dictates the rate and extent degradation by oxidisation occurs. As well as oxidisation, the natural occurrence of crystallisation in natural rubber, caused by changes in temperature would have increased the hardness of the material (and subsequent decrease of elasticity)(2,31,32,33).
These assumptions correlate with polymer conservationist notes, which state that chemical reactions are doubled with each 10oC increase(2,32). For optimal preservation conditions, it is suggested to store polymers away from UV emissions, with a maximum 100 lux, at 10oC and 50% humidity and preferably lower levels of oxygen. This is standard procedure for most conservation of polymer artwork or museum pieces (2,31,32,34).
Once the rubber composites were collected after the 40 year test, most of the samples were considered to still be in ‘usable’ condition (apart from the test pieces in stretched conditions) by Rapra technology Ltd (35). Due to the lack of UV emitted onto the pieces or any other weathering exposure, the performance of the material sample in these conditions can be compared to that of the materials performance in internal conditions of a building not exposed to natural lighting (UV) over a similar time frame.
Its worth of note, as to the artificial lighting of internal rooms, incandescent bulbs have little to no UV radiance (36), therefore due to its minimal effect degradation by artificial lighting is not accounted for.
External Environment Degradation
Authors review on data collected by Rapra technology Ltd on the Ageing of rubber: accelerated Weathering and Ozone test results & Ageing of rubber: accelerated heat ageing test results.
Forty two years after the natural ageing of rubber test began, Rapra technology Ltd conducted follow up experiments, whereby accelerated heat ageing and artificial weathering and ozone experiments of the same rubber compounds were tested for the same alteration in mechanical properties but over a different time frame(37, 38).
The pieces were tested over a period of 6 months in an artificial heated climate (air exchange oven for heat) that simulated 23oC temperature over 40 years. The accelerated weathering climate (UVA 340 lamps with a black panel temperature of 45 °C, cycle of 4 hours condensation and 4 hours dry) experiment was also run over a 6 month time frame to simulate an accelerated weathered 23oC environment (37,38).
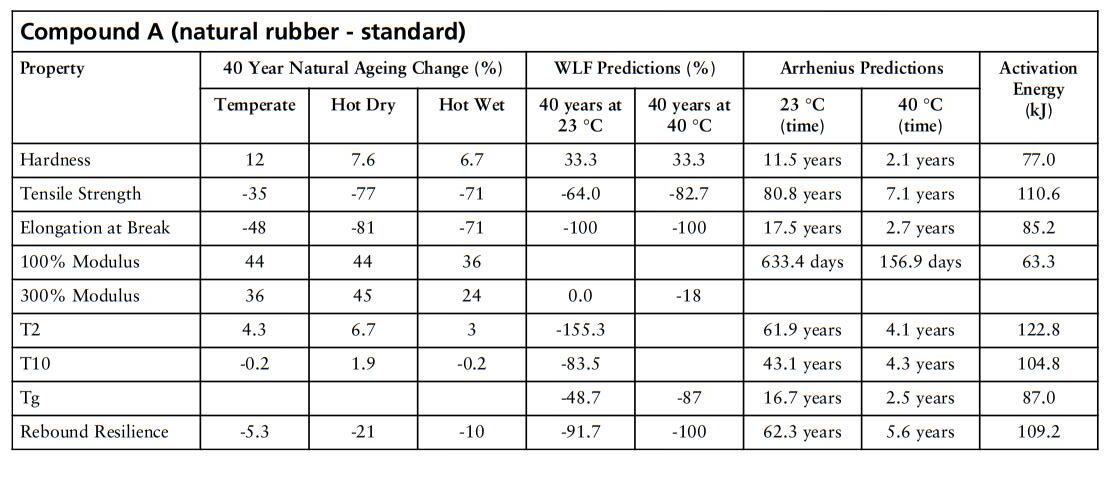
Once the experiment concluded and the data collected, the results were then extrapolated to provide a future time based prediction using the Arrhenius equation which was simultaneously compared to the results against the natural ageing tests (37,38).
The age accelerated heated results show that to reach the same 47.9 % decrease in elongation at break in the temperate climate of the natural ageing test, it would take 17.5 years in the artificially simulated 23oC climate. This difference in time can be attributed to its exposure to a UV source, as well as well as discrepancy and inaccuracies of a simulated environment over such a short time frame.
However, in order to obtain a weathered prediction over a future time frame, this data is then intended to be compared against the accelerated weathering and ozone tests, as per Rapra technology Ltd reviews instructions in Ageing of rubber: accelerated Weathering and Ozone test results (37).
The results of the weather experiment provide the order of magnitude of the effects of weathering in comparison to those from heat ageing over a predicted time frame.
If an acceleration factor due to the higher irradiance in the weathering apparatus compared to natural sunlight is assumed it is possible to estimate the effects of weathering at 23 °C under natural exposure to light (37).
Although it can only be estimated due to variations in solar radiation, the equation below can be used to give an estimate of the order of magnitude of change that might be expected from weathering. Acceleration factors were derived from quoted irradiance and annual solar radiation figures (37). The factors used for the artificial weathering tests were conducted under UVA 340 lamps for a London climate, quantified at 14.0 (This weathering factor can be altered depending on location) (29).
C is the net change due to weathering after 6 months.
The year factor period is equivalent to only a relatively modest extrapolation of the 6 month exposure graphs(37), because of the uncertainty in the acceleration factor, the figures can only be considered an approximation of the predicted result.
In the table the estimated time frame is calculated for 10 years in a UK climate. However the equation provided in the paper allows for the author to conduct the same test at 17.5 years (the time frame estimated for the artificially heated simulation) .
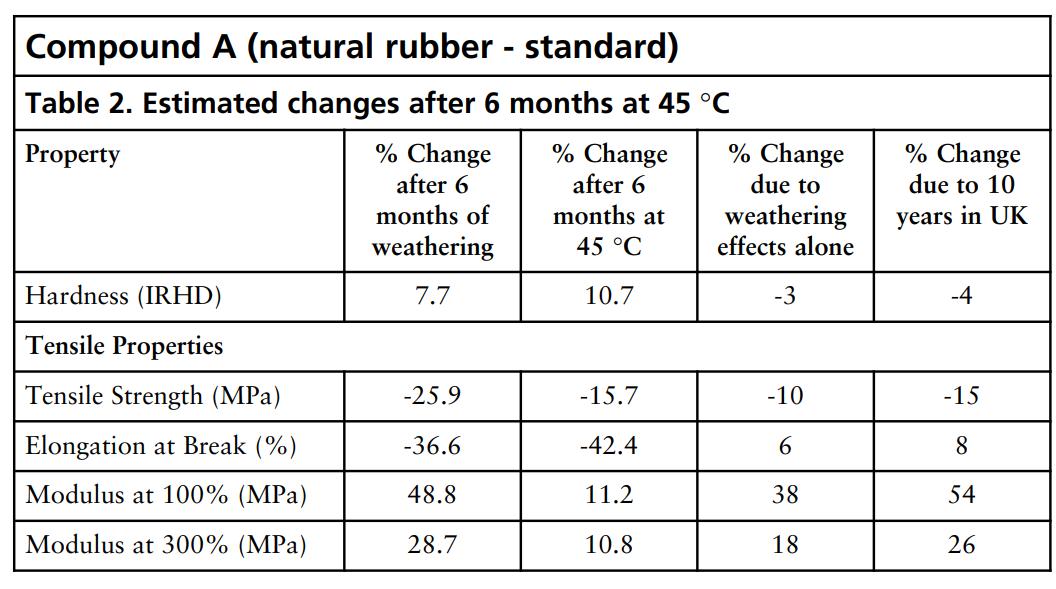
Weathering estimated factor is 15%
223% elongation at break after 17.5 years from heat ageing (Figure 14).
15% of 223 =33.5
223-33.5= 189.5
Subtract the equivalent weathering degradation factor from the elongation at break recorded at that time frame.
428% initial elongation at break(Figure 12).
428 to 223 shows a decrease of 48% of its elongation at break
428 to 189.5 shows a decrease of 55.7% of its elongation at break
55.7-48= 7.7
7.7% difference in elongation at break
The calculated difference between the natural ageing test and the estimated predicted weathering test shows an 7.7 % difference in the effect on elongation before break whence exposed to UV after 17.5 years. Although the UV degradation should have lead to a higher number than 7.7% , which can be attributed to the inaccuracy of the prediction method. The result is extremely close to the to the percentage at the 10 year UK where a prediction 8% is recorded.
This might suggest the actual UV degradation is almost negligible over the 7.5 years (10 to 17.5 year calculation).
This discrepancy can be partially explained when looking at the elongation at break graphs over the 6 month period heat ageing tests. Within all the rubbers, the elongation at brake graphs show a sudden dip in the first 30 days which accounts for about 10% of decrease in elongation at break (similar to the 8% and 7.7% in this case).
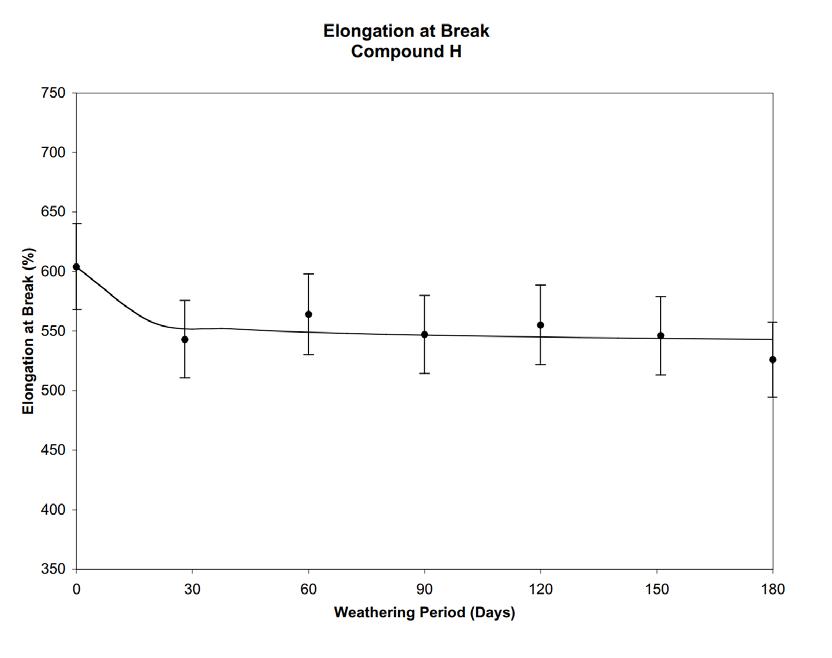
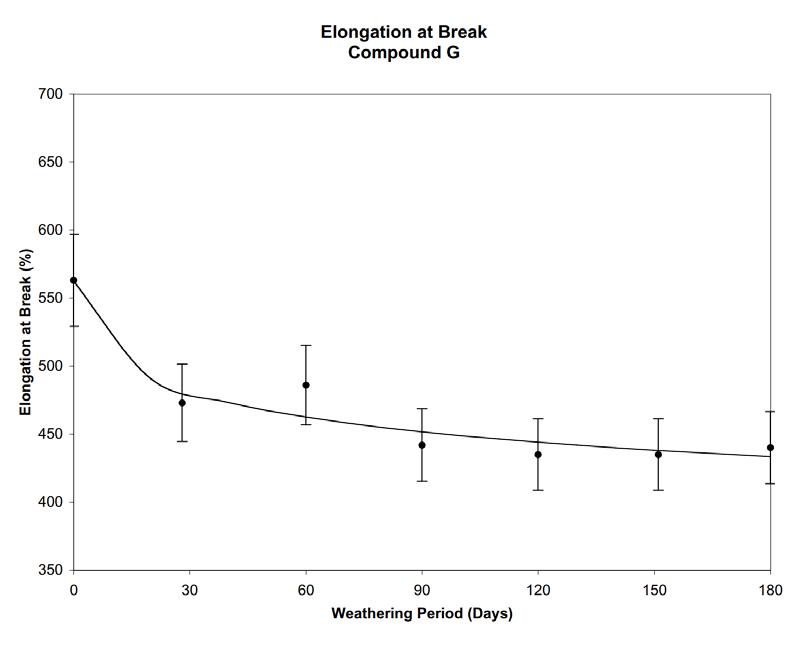
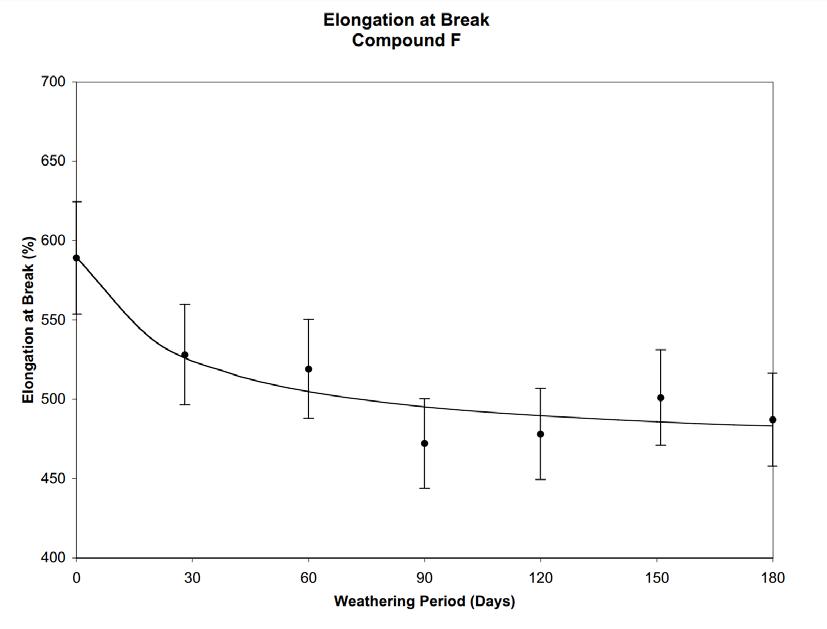
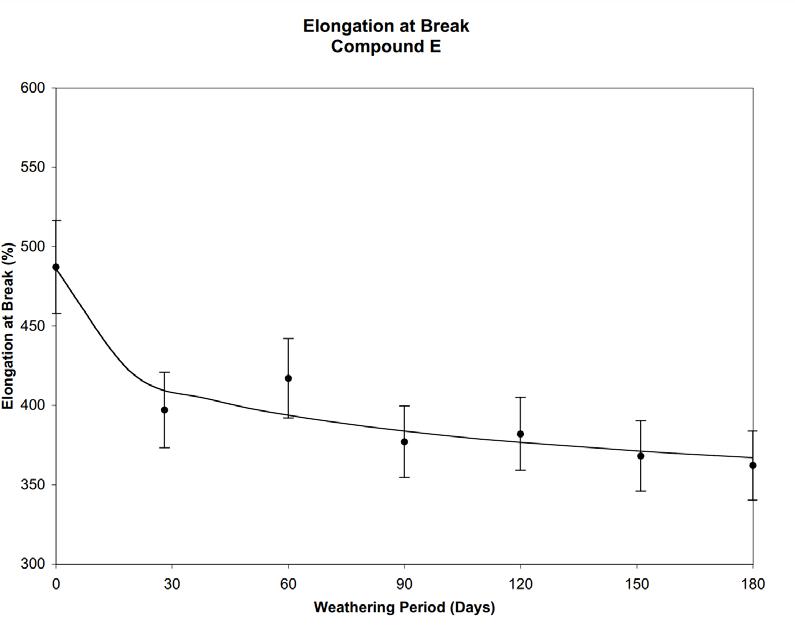
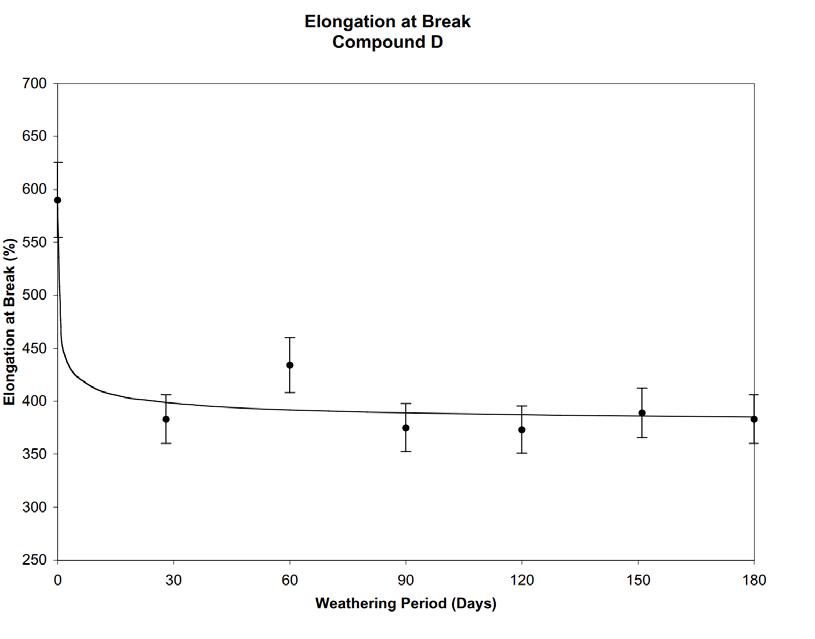
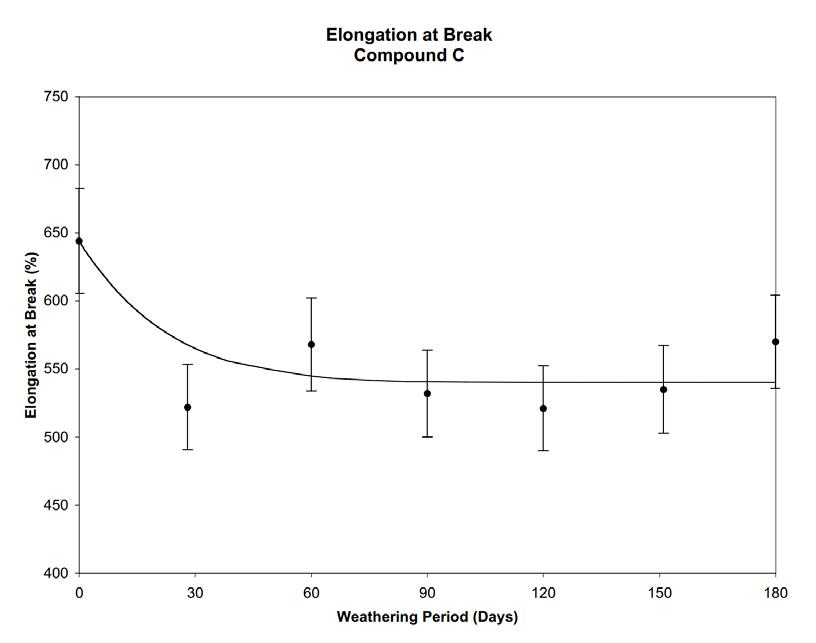
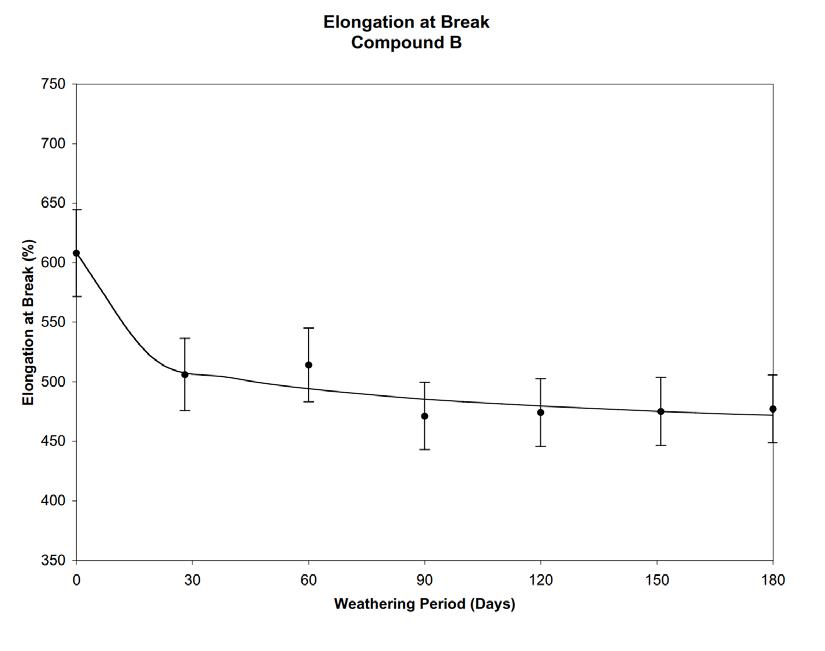
The dip is then followed by a seemingly constant rate of degradation. It is therefore assumed that based on the data collected, the energy provided by the UV exposure in the first month initiates the ‘braking of the bonds’ that allow oxidisation to commence and subsequently dictates the following rate of degradation once exposed (2,32). Therefore suggesting that UV degradation factor is only relevant in the first month which would explain the unchanging factor of 8% and 7.7% over a 7.5 year lifespan.
This analysis review of the experiments conducted by Rapra technology Ltd therefore concludes that UV exposure significantly effects the rate of degradation in the first month through the braking of the bonds (which can be similarly achieved with high temperature or stress), however based on the natural ageing test in figure 13, it is evident temperature determines the rate of degradation by oxidisation. This result supports observations made by polymer conservationists in museums (2,32,33,34). Additionally, it must be considered, that the equation, irradiance factors and other variable assumed factors only allow for an estimation at best, therefore the listed predictive numbers below are merely an approximation used to predict degradation as well as understated the principals and factors that drive its degradation (37).
The predicted behaviour of composite A with an estimated elongation at break of 190% after an averaged 18 years is therefore taken as the estimated lifespan for a single natural rubber layer of approximately 4mm tick (thickness of samples in the conducted test) and is hence used to determine the lifespan of the building at an estimated 54 life year cycle, with 3 cycles of shedding of layers.
Natural Rubber Composite Selection
In order to determine the degradation behaviour for commercially available natural rubber compounds, three samples of varying blends were selected to cross reference their resistance to UV light and their individual elastic behaviour (relevant for the robotic manufacturing process)in relation to the results gathered from compound A Rapra technology Ltd accelerated ageing test.
The samples chosen were based on aspects such as, individual physical properties, commercial availability and application.
Linatex R was chosen based on its similar tensile strength to that of compound A, for long term comparison purposes as well the materials exceptionally high natural rubber content (95%) (39), making it an extremely high quality natural rubber with high elasticity, strength and resilience.
Para (shotblast/gum) rubber was chosen due to it also containing similar physical characteristics similar to that of compound A, however less expensive and more commercial available than Linatex R rubber
A natural/ synthetic rubber blend (NR/SBR Blend 70° Shore Rubber Sheeting) was selected as sample to be tested due to it being one of the most commercially used applications of natural rubber as well as being one of the cheapest, and low performing natural rubber blends.
The Young’s Modulus equation listed below is used to determine the stiffness of each sample material through determining the stress and strain from the data collected.
The results showed an expected linear behaviour as the jig and weight weren’t sufficient to reach the materials plastic stage (permanent deformation). As expected the LinatexR rubber which has the highest tensile strength displays the highest capability of withstanding load whilst the natural/ synthetic blend showed the least.
Therefore LinatexR would be the chosen composite blend in terms of commercially availability and application of high stress at a large scale application.
The results from the experiment showed that the Para and Linatex rubber stretched samples did not fail, in figure 27 a comparison can be seen between the stretched and non-stretched sample, the stretched Para rubber was permanently deformed, no longer displaying elastic behaviour but a plastic behaviour, whilst the Linatex rubber retained its elastic behaviour. The NR/ SR stretched samples failed after one hour into the experiment, due to its low tensile strength as opposed to the effect of UV degradation
After the one month test period, the Young’s modulus test was repeated on the un-stretched UV aged samples. The Linatex and NR/SR samples showed similar tendencies to their prior un-aged performance, however both showed a slight increase in stiffness. The Para rubber sample failed almost immediately, as seen in figure 27, this sample produced a hard outer surface displaying cracks, affecting the integrity of the material.
From this analysis, it can be determined that a high percentage natural rubber composite such as LinatexR rubber would be most suited to a long term performance over the time frame of a building skin due to a noticeable alteration of its properties consistent with that of the long term Rapra predictive experiment conducted. The Para rubber’s susceptibility to UV was too drastic to be considered and the NR/SR blend performed poorly overall.