Washington, D.C. Metro
March 2026 Housing Market Report
by Bright Research
Key Market Statistics
Housing Market Trends
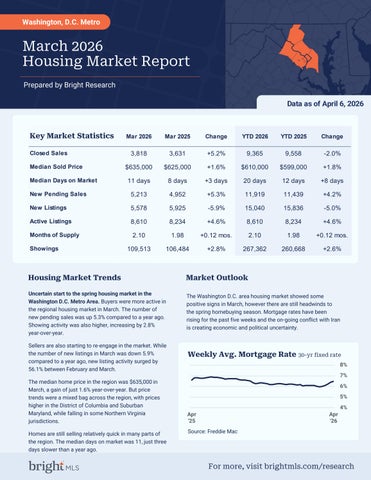
Uncertain start to the spring housing market in the Washington D.C. Metro Area. Buyers were more active in the regional housing market in March. The number of new pending sales was up 5.3% compared to a year ago. Showing activity was also higher, increasing by 2.8% year-over-year.
Sellers are also starting to re-engage in the market. While the number of new listings in March was down 5.9% compared to a year ago, new listing activity surged by 56.1% between February and March.
The median home price in the region was $635,000 in March, a gain of just 1.6% year-over-year. But price trends were a mixed bag across the region, with prices higher in the District of Columbia and Suburban Maryland, while falling in some Northern Virginia jurisdictions.
Homes are still selling relatively quick in many parts of the region. The median days on market was 11, just three days slower than a year ago.
Data as of April 6, 2026
The Washington D.C. area housing market showed some positive signs in March, however there are still headwinds to the spring homebuying season. Mortgage rates have been rising for the past five weeks and the on-going conflict with Iran is creating economic and political uncertainty.
Source: Freddie Mac
Sales March 2026
3,818 +5.2% +32.1%
Mar '26 vs. Mar '25
(Mar '25: 3,631) (Feb '26: 2,890)
Mar '26 vs. Feb '26
Median Sold Price
$635,000 +1.6% +4.1%
Mar '26 vs. Feb '26 March 2026
Mar '26 vs. Mar '25
(Mar '25: $625,000) (Feb '26: $610,000)
Median Days on Market
11 days +3 days -11 days
Mar '26 vs. Mar '25 March 2026
(Mar '25: 8 days)
Mar '26 vs. Feb '26
(Feb '26: 22 days)
March 2026
Mar '26 vs. Mar '25
Mar '26 vs. Feb '26
5,213 +5.3% +43.9% (Mar '25: 4,952) (Feb '26: 3,622)
Listings
March 2026
Mar '26 vs. Mar '25
Mar '26 vs. Feb '26
5,578 -5.9% (Mar '25: 5,925) +56.1% (Feb '26: 3,574)
Active Listings
March 2026
Mar '26 vs. Mar '25
Mar '26 vs. Feb '26
8,610 +4.6% +13.1% (Mar '25: 8,234) (Feb '26: 7,612)
Local Markets
Local Markets
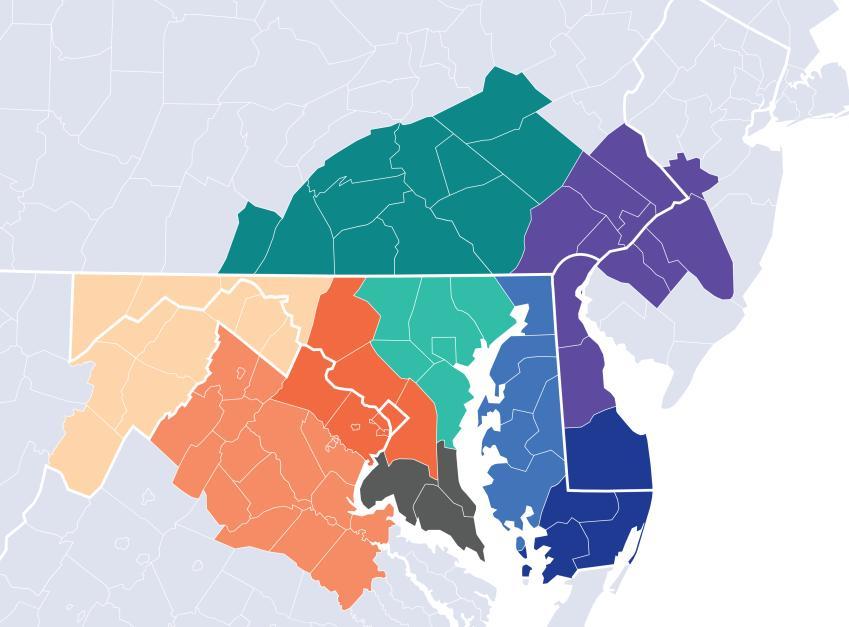
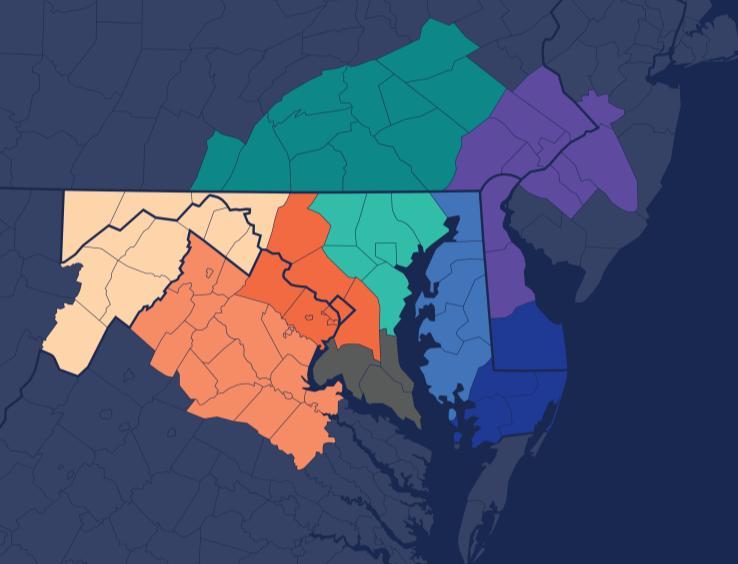
Local Market Map
MD/WV Panhandle
North Central Virginia
Washington D.C., Metro
Central Pennsylvania
Baltimore Metro
Southern Maryland
Maryland Eastern Shore
Philadelphia Metro
Del/Mar Coastal
About Bright MLS
Bright MLS powers some of the nation’s most dynamic real estate markets as the largest MLS in the U.S. Serving over 100,000 professionals across Delaware, Maryland, New Jersey, Pennsylvania, Virginia, West Virginia, and D.C., Bright provides real-time data, deep market intelligence, and tools supporting more than half a million buyers and sellers each month. In 2025, Bright enabled over 460,000 listings. Built to lead, Bright delivers trusted housing insights and industry-leading tools that drive a more transparent, competitive marketplace. Learn more at BrightMLS.com
Please contact Christy Reap, Media Relations Director with interview or information requests:
• (202) 309-9362
• christy.reap@brightmls.com
March 2026
Prepared by Bright Research Data as of April 6, 2026
Market Statistics
1,718 March 2026
+4.6%
Mar '26 vs. Mar '25 (Mar '25: 1,642)
+31.5%
Mar '26 vs. Feb '26 (Feb '26: 1,306)
$850,000
March 2026
+4.2%
Mar '26 vs. Mar '25 (Mar '25: $815,500)
+7.6%
Mar '26 vs. Feb '26 (Feb '26: $790,000)
$900,000
$850,000
$800,000
$750,000
$700,000
$650,000
$600,000
Median Days on Market
7 days
March 2026
+1 day
Mar '26 vs. Mar '25 (Mar '25: 6 days)
-7 days
Mar '26 vs. Feb '26 (Feb '26: 14 days)
New Pending Sales
2,418
March 2026
+3.8%
Mar '26 vs. Mar '25 (Mar '25: 2,330)
+50.7%
Mar '26 vs. Feb '26 (Feb '26: 1,605)
2,349 March 2026 -9.9%
Mar '26 vs. Mar '25 (Mar '25: 2,607) +76.4%
Mar '26 vs. Feb '26 (Feb '26: 1,332)
3,086 March 2026
-5.6%
Mar '26 vs. Mar '25 (Mar '25: 3,268)
+15.0%
Mar '26 vs. Feb '26 (Feb '26: 2,683)
About Bright MLS
Bright MLS powers some of the nation’s most dynamic real estate markets as the largest MLS in the U.S. Serving over 100,000 professionals across Delaware, Maryland, New Jersey, Pennsylvania, Virginia, West Virginia, and D.C., Bright provides realtime data, deep market intelligence, and tools supporting more than half a million buyers and sellers each month. In 2025, Bright enabled over 460,000 listings. Built to lead, Bright delivers trusted housing insights and industry-leading tools that drive a more transparent, competitive marketplace. Learn more at BrightMLS.com.
Prepared by Bright Research Data as of April 6, 2026
Market Statistics
1,089 March 2026
+8.1%
Mar '26 vs. Mar '25 (Mar '25: 1,007)
+34.8%
Mar '26 vs. Feb '26 (Feb '26: 808)
$614,410
March 2026
+0.7%
Mar '26 vs. Mar '25 (Mar '25: $610,000)
+3.3%
Mar '26 vs. Feb '26 (Feb '26: $595,000)
Median Days on Market
11 days
March 2026
+3 days
Mar '26 vs. Mar '25 (Mar '25: 8 days)
-8 days
Mar '26 vs. Feb '26 (Feb '26: 19 days)
New Pending Sales
1,495
March 2026
+10.1%
Mar '26 vs. Mar '25 (Mar '25: 1,358)
+46.6%
Mar '26 vs. Feb '26 (Feb '26: 1,020)
1,494
March 2026 -7.3%
Mar '26 vs. Mar '25 (Mar '25: 1,612)
+50.5%
Mar '26 vs. Feb '26 (Feb '26: 993)
1,922
March 2026
+3.7%
Mar '26 vs. Mar '25 (Mar '25: 1,854)
+8.7%
Mar '26 vs. Feb '26 (Feb '26: 1,768)
About Bright MLS
Bright MLS powers some of the nation’s most dynamic real estate markets as the largest MLS in the U.S. Serving over 100,000 professionals across Delaware, Maryland, New Jersey, Pennsylvania, Virginia, West Virginia, and D.C., Bright provides realtime data, deep market intelligence, and tools supporting more than half a million buyers and sellers each month. In 2025, Bright enabled over 460,000 listings. Built to lead, Bright delivers trusted housing insights and industry-leading tools that drive a more transparent, competitive marketplace. Learn more at BrightMLS.com.
Prepared by Bright Research
Market Statistics
1,010 March 2026
+2.9%
Mar '26 vs. Mar '25 (Mar '25: 982)
+30.2%
Mar '26 vs. Feb '26 (Feb '26: 776)
Data as of April 6, 2026
$400,000
March 2026
+0.3%
Mar '26 vs. Mar '25 (Mar '25: $399,000)
+3.9%
Mar '26 vs. Feb '26 (Feb '26: $385,000)
$420,000
$320,000
$300,000
Median Days on Market
24 days
March 2026
+8 days
Mar '26 vs. Mar '25 (Mar '25: 16 days)
-19 days
Mar '26 vs. Feb '26 (Feb '26: 43 days)
New Pending Sales
1,296
March 2026
+2.6%
Mar '26 vs. Mar '25 (Mar '25: 1,263)
+30.0%
Mar '26 vs. Feb '26 (Feb '26: 997)
1,731
March 2026
+1.7%
Mar '26 vs. Mar '25 (Mar '25: 1,702) +39.0%
Mar '26 vs. Feb '26 (Feb '26: 1,245)
3,602
March 2026
+15.7%
Mar '26 vs. Mar '25 (Mar '25: 3,112)
+14.0%
Mar '26 vs. Feb '26 (Feb '26: 3,161)
About Bright MLS
Bright MLS powers some of the nation’s most dynamic real estate markets as the largest MLS in the U.S. Serving over 100,000 professionals across Delaware, Maryland, New Jersey, Pennsylvania, Virginia, West Virginia, and D.C., Bright provides realtime data, deep market intelligence, and tools supporting more than half a million buyers and sellers each month. In 2025, Bright enabled over 460,000 listings. Built to lead, Bright delivers trusted housing insights and industry-leading tools that drive a more transparent, competitive marketplace. Learn more at BrightMLS.com.