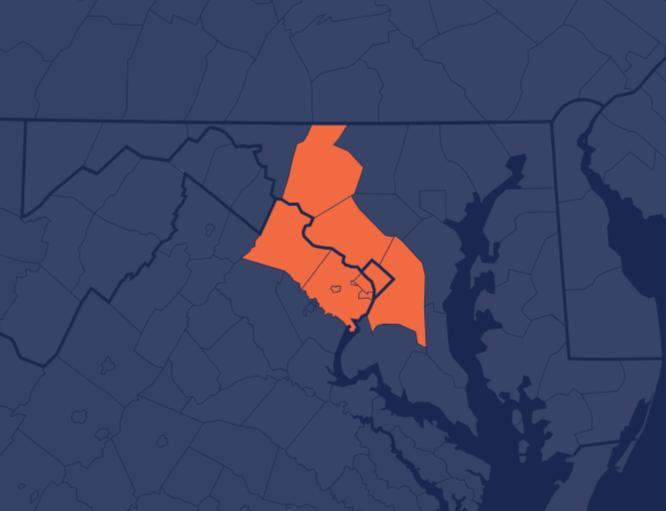
Washington, D.C. Metro
February 2026 Housing Market Report
Prepared by Bright Research
Key Market Statistics
Data as of March 5, 2026
Housing Market Trends Market Outlook
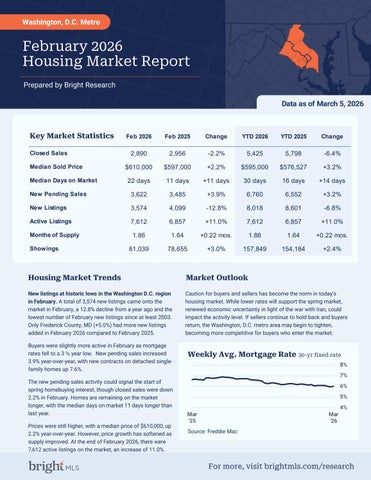
New listings at historic lows in the Washington D.C. region in February. A total of 3,574 new listings came onto the market in February, a 12.8% decline from a year ago and the lowest number of February new listings since at least 2003. Only Frederick County, MD (+5.0%) had more new listings added in February 2026 compared to February 2025.
Buyers were slightly more active in February as mortgage rates fell to a 3 ½ year low. New pending sales increased 3.9% year-over-year, with new contracts on detached singlefamily homes up 7.6%.
The new pending sales activity could signal the start of spring homebuying interest, though closed sales were down 2.2% in February. Homes are remaining on the market longer, with the median days on market 11 days longer than last year.
Prices were still higher, with a median price of $610,000, up 2.2% year-over-year. However, price growth has softened as supply improved. At the end of February 2026, there were 7,612 active listings on the market, an increase of 11.0%.
Caution for buyers and sellers has become the norm in today’s housing market. While lower rates will support the spring market, renewed economic uncertainty in light of the war with Iran, could impact the activity level. If sellers continue to hold back and buyers return, the Washington, D.C. metro area may begin to tighten, becoming more competitive for buyers who enter the market.
Weekly Avg. Mortgage
Source: Freddie Mac
February 2026
Feb '26 vs. Feb '25
2,890 -2.2% +18.0%
Feb '26 vs. Jan '26
(Feb '25: 2,956) (Jan '26: 2,450)
Median Sold Price
February 2026
$610,000 +2.2% +4.3%
Feb '26 vs. Feb '25
(Feb '25: $597,000) (Jan '26: $585,000)
Feb '26 vs. Jan '26
Median Days on Market
22 days +11 days -14 days
Feb '26 vs. Feb '25 February 2026
(Feb '25: 11 days)
Feb '26 vs. Jan '26
(Jan '26: 36 days)
February 2026
Feb '26 vs. Feb '25
Feb '26 vs. Jan '26
3,622 +3.9% +13.3% (Feb '25: 3,485) (Jan '26: 3,196)
New Listings
February 2026
Feb '26 vs. Feb '25
3,574 -12.8% (Feb '25: 4,099)
+0.9% (Jan '26: 3,541)
Feb '26 vs. Jan '26
Active Listings
February 2026
Feb '26 vs. Feb '25
Feb '26 vs. Jan '26
7,612 +11.0% +6.6% (Feb '25: 6,857) (Jan '26: 7,142)
Local Markets
Local Markets
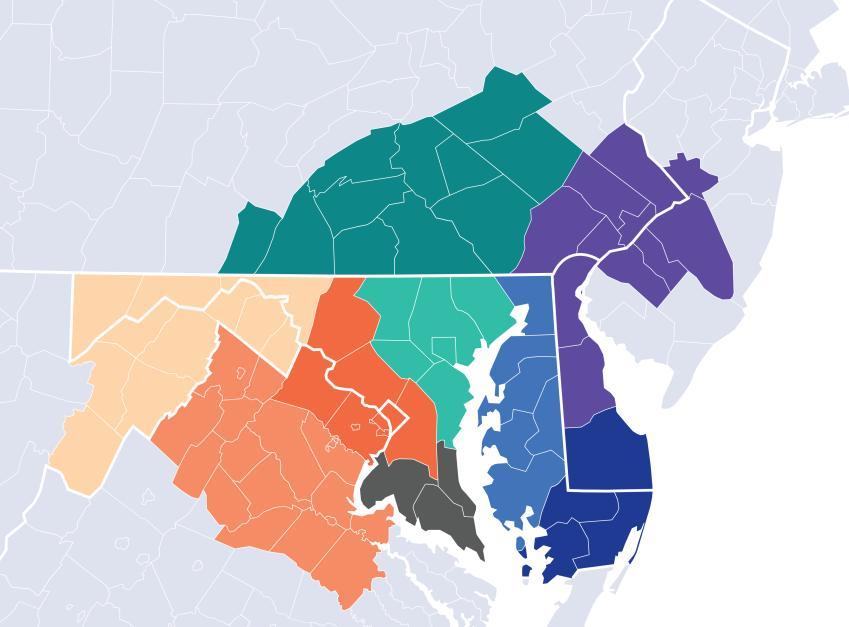
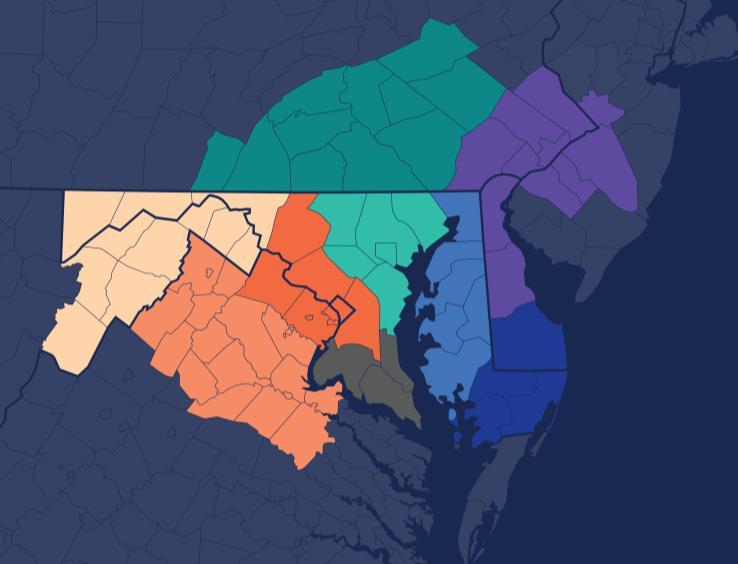
Local Market Map
MD/WV Panhandle
North Central Virginia
Washington D.C., Metro
Central Pennsylvania
Baltimore Metro
Southern Maryland
Maryland Eastern Shore
Philadelphia Metro
Del/Mar Coastal
About Bright MLS
Bright MLS powers some of the nation’s most dynamic real estate markets as the largest MLS in the U.S. Serving over 100,000 professionals across Delaware, Maryland, New Jersey, Pennsylvania, Virginia, West Virginia, and D.C., Bright provides real-time data, deep market intelligence, and tools supporting more than half a million buyers and sellers each month. In 2025, Bright enabled over 460,000 listings. Built to lead, Bright delivers trusted housing insights and industry-leading tools that drive a more transparent, competitive marketplace. Learn more at BrightMLS.com
Please contact Christy Reap, Media Relations Director with interview or information requests:
• (202) 309-9362
• christy.reap@brightmls.com
February 2026
Prepared by Bright Research
Market Statistics
1,306 February 2026
+5.6%
Feb '26 vs. Feb '25 (Feb '25: 1,237)
+20.5%
Feb '26 vs. Jan '26 (Jan '26: 1,084)
Data as of March 5, 2026
$790,000
February 2026
-1.3%
Feb '26 vs. Feb '25 (Feb '25: $800,000)
+5.3%
Feb '26 vs. Jan '26 (Jan '26: $750,000)
$900,000
$850,000
$800,000
$750,000
$700,000
$650,000
$600,000
Median Days on Market
14 days
February 2026
+6 days
Feb '26 vs. Feb '25 (Feb '25: 8 days)
-17 days
Feb '26 vs. Jan '26 (Jan '26: 31 days)
New Pending Sales
1,605
February 2026
+7.6%
Feb '26 vs. Feb '25 (Feb '25: 1,491)
+15.0%
Feb '26 vs. Jan '26 (Jan '26: 1,396)
1,332
February 2026
Feb '26 vs. Feb '25 (Feb '25: 1,689) -3.2%
Feb '26 vs. Jan '26 (Jan '26: 1,376)
2,683
February 2026
+4.8%
Feb '26 vs. Feb '25 (Feb '25: 2,559)
+4.2%
Feb '26 vs. Jan '26 (Jan '26: 2,576)
About Bright MLS
Bright MLS powers some of the nation’s most dynamic real estate markets as the largest MLS in the U.S. Serving over 100,000 professionals across Delaware, Maryland, New Jersey, Pennsylvania, Virginia, West Virginia, and D.C., Bright provides realtime data, deep market intelligence, and tools supporting more than half a million buyers and sellers each month. In 2025, Bright enabled over 460,000 listings. Built to lead, Bright delivers trusted housing insights and industry-leading tools that drive a more transparent, competitive marketplace. Learn more at BrightMLS.com.
by Bright Research Data as of March 5, 2026
February 2026 -4.2%
Feb '26 vs. Feb '25 (Feb '25: 843) +13.6%
Feb '26 vs. Jan '26 (Jan '26: 711)
$595,000
February 2026
-0.8%
Feb '26 vs. Feb '25 (Feb '25: $600,000) +3.5%
Feb '26 vs. Jan '26 (Jan '26: $575,000)
Median Days on Market
19 days
February 2026
+9 days
Feb '26 vs. Feb '25 (Feb '25: 10 days)
-17 days
Feb '26 vs. Jan '26 (Jan '26: 36 days)
New Pending Sales
1,020
February 2026
+4.3%
Feb '26 vs. Feb '25 (Feb '25: 978) +13.1%
Feb '26 vs. Jan '26 (Jan '26: 902)
993
February 2026 -6.1%
Feb '26 vs. Feb '25 (Feb '25: 1,058) +5.0%
Feb '26 vs. Jan '26 (Jan '26: 946)
1,768
February 2026
+16.0%
Feb '26 vs. Feb '25 (Feb '25: 1,524)
+4.8%
Feb '26 vs. Jan '26 (Jan '26: 1,687)
About Bright MLS
Bright MLS powers some of the nation’s most dynamic real estate markets as the largest MLS in the U.S. Serving over 100,000 professionals across Delaware, Maryland, New Jersey, Pennsylvania, Virginia, West Virginia, and D.C., Bright provides realtime data, deep market intelligence, and tools supporting more than half a million buyers and sellers each month. In 2025, Bright enabled over 460,000 listings. Built to lead, Bright delivers trusted housing insights and industry-leading tools that drive a more transparent, competitive marketplace. Learn more at BrightMLS.com.
Market Statistics
776
February 2026 -11.3%
Feb '26 vs. Feb '25 (Feb '25: 875)
+18.7%
Feb '26 vs. Jan '26 (Jan '26: 654)
Data as of March 5, 2026
$385,000
February 2026 -2.2%
Feb '26 vs. Feb '25 (Feb '25: $393,495) +2.7%
Feb '26 vs. Jan '26 (Jan '26: $375,000)
$300,000
Median Days on Market
43 days
February 2026
+26 days
Feb '26 vs. Feb '25 (Feb '25: 17 days)
+0 days
Feb '26 vs. Jan '26 (Jan '26: 43 days)
New Pending Sales
997
February 2026
Feb '26 vs. Feb '25 (Feb '25: 1,015)
Feb '26 vs. Jan '26 (Jan '26: 897)
1,245
February 2026 -7.8%
Feb '26 vs. Feb '25 (Feb '25: 1,351) +2.1%
Feb '26 vs. Jan '26 (Jan '26: 1,219)
3,161
February 2026
+14.0%
Feb '26 vs. Feb '25 (Feb '25: 2,774)
+9.8%
Feb '26 vs. Jan '26 (Jan '26: 2,879)
About Bright MLS
Bright MLS powers some of the nation’s most dynamic real estate markets as the largest MLS in the U.S. Serving over 100,000 professionals across Delaware, Maryland, New Jersey, Pennsylvania, Virginia, West Virginia, and D.C., Bright provides realtime data, deep market intelligence, and tools supporting more than half a million buyers and sellers each month. In 2025, Bright enabled over 460,000 listings. Built to lead, Bright delivers trusted housing insights and industry-leading tools that drive a more transparent, competitive marketplace. Learn more at BrightMLS.com.