Washington, D.C. Metro
April 2026 Housing Market Report
Prepared by Bright Research
Key Market Statistics
Housing Market Trends
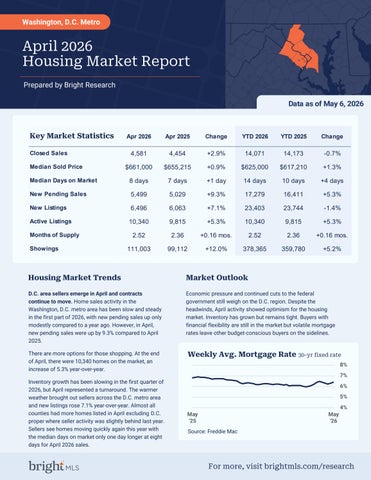
D.C. area sellers emerge in April and contracts continue to move. Home sales activity in the Washington, D.C. metro area has been slow and steady in the first part of 2026, with new pending sales up only modestly compared to a year ago. However, in April, new pending sales were up by 9.3% compared to April 2025.
There are more options for those shopping. At the end of April, there were 10,340 homes on the market, an increase of 5.3% year-over-year.
Inventory growth has been slowing in the first quarter of 2026, but April represented a turnaround. The warmer weather brought out sellers across the D.C. metro area and new listings rose 7.1% year-over-year. Almost all counties had more homes listed in April excluding D.C. proper where seller activity was slightly behind last year. Sellers see homes moving quickly again this year with the median days on market only one day longer at eight days for April 2026 sales.
Data as of May 6, 2026
Economic pressure and continued cuts to the federal government still weigh on the D.C. region. Despite the headwinds, April activity showed optimism for the housing market. Inventory has grown but remains tight. Buyers with financial flexibility are still in the market but volatile mortgage rates leave other budget-conscious buyers on the sidelines.
Source: Freddie Mac
Closed Sales April 2026
Apr '26 vs. Apr '25
Apr '26 vs. Mar '26
4,581 +2.9% +20.0% (Apr '25: 4,454) (Mar '26: 3,818)
Median Sold Price
$661,000 +0.9% +4.1%
Apr '26 vs. Mar '26 April 2026
Apr '26 vs. Apr '25
(Apr '25: $655,215) (Mar '26: $635,000)
Median Days on Market
8 days +1 day -3 days
Apr '26 vs. Apr '25 April 2026
(Apr '25: 7 days) (Mar '26: 11 days)
Apr '26 vs. Mar '26
April 2026
Apr '26 vs. Apr '25
Apr '26 vs. Mar '26
5,499 +9.3% +5.5% (Apr '25: 5,029) (Mar '26: 5,213)
New Listings
April 2026
6,496 +7.1% (Apr '25: 6,063)
Apr '26 vs. Apr '25
+16.5% (Mar '26: 5,578)
Apr '26 vs. Mar '26
Active Listings
April 2026
Apr '26 vs. Apr '25
Apr '26 vs. Mar '26
10,340 +5.3% +20.1% (Apr '25: 9,815) (Mar '26: 8,610)
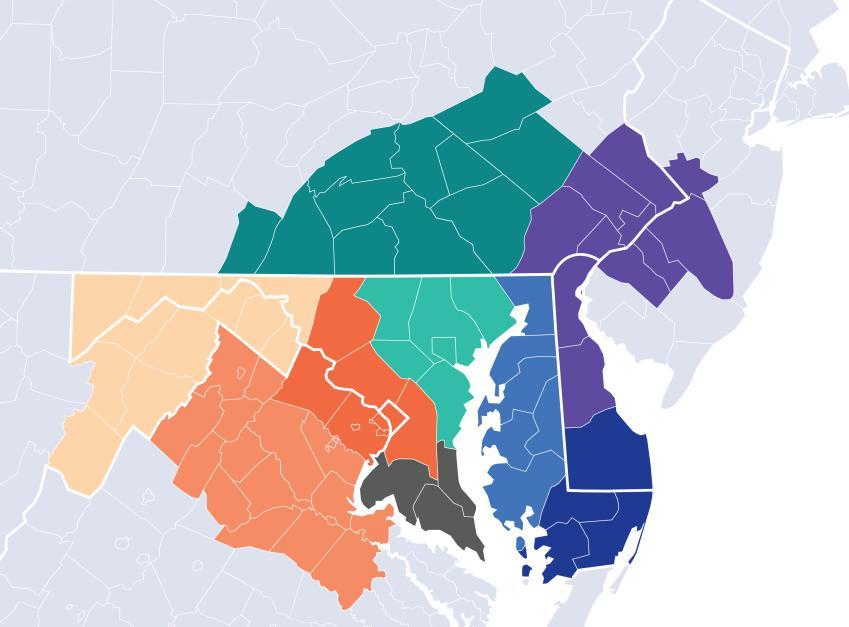
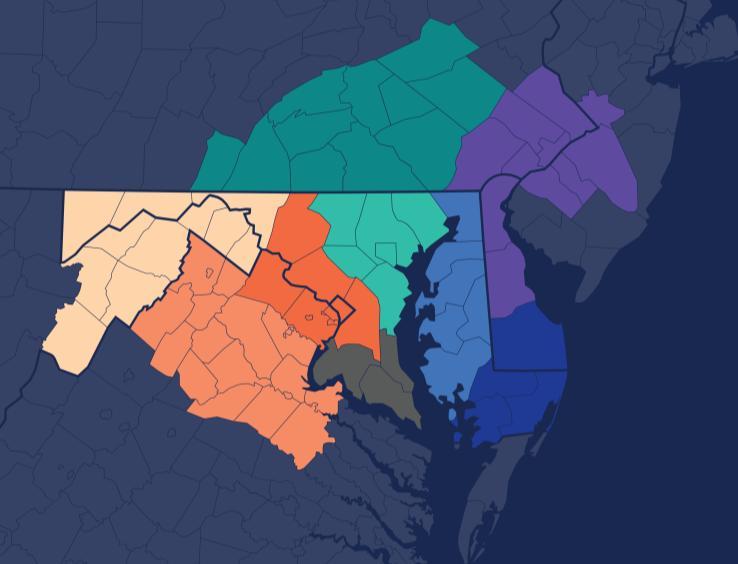
Local Market Map
MD/WV Panhandle
North Central Virginia
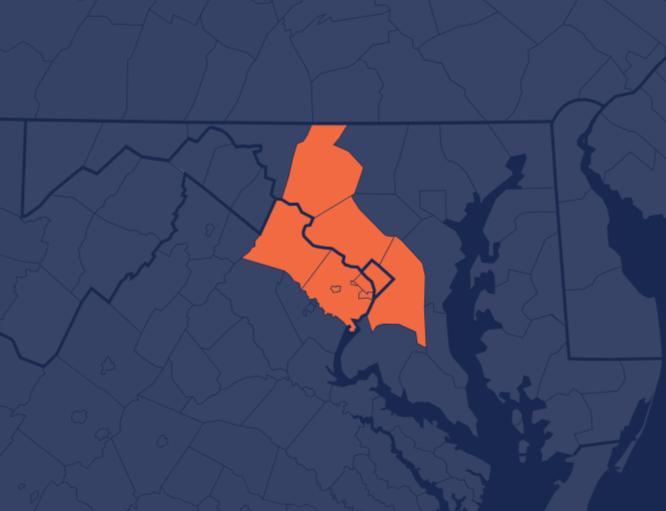
Washington D.C., Metro
Central Pennsylvania
Baltimore Metro
Southern Maryland
Maryland Eastern Shore
Philadelphia Metro
Del/Mar Coastal
About Bright MLS
Bright MLS powers some of the nation’s most dynamic real estate markets as the largest MLS in the U.S. Serving over 100,000 professionals across Delaware, Maryland, New Jersey, Pennsylvania, Virginia, West Virginia, and D.C., Bright provides real-time data, deep market intelligence, and tools supporting more than half a million buyers and sellers each month. In 2025, Bright enabled over 460,000 listings. Built to lead, Bright delivers trusted housing insights and industry-leading tools that drive a more transparent, competitive marketplace. Learn more at BrightMLS.com
Please contact Christy Reap, Media Relations Director with interview or information requests:
• (202) 309-9362
• christy.reap@brightmls.com
Prepared by Bright Research Data as of May 6, 2026
Market Statistics
2,201 April 2026
+3.5%
Apr '26 vs. Apr '25 (Apr '25: 2,126)
+28.1%
Apr '26 vs. Mar '26 (Mar '26: 1,718)
$875,000
April 2026
+0.2%
Apr '26 vs. Apr '25 (Apr '25: $873,667)
+2.9%
Apr '26 vs. Mar '26 (Mar '26: $850,000)
$900,000
$850,000
$800,000
$750,000
$700,000
$650,000
$600,000
Median Days on Market
6 days
April 2026
+0 days
Apr '26 vs. Apr '25 (Apr '25: 6 days)
-1 day
Apr '26 vs. Mar '26 (Mar '26: 7 days)
New Pending Sales
2,706
April 2026
+8.1%
Apr '26 vs. Apr '25 (Apr '25: 2,504)
+11.9%
Apr '26 vs. Mar '26 (Mar '26: 2,418)
2,951 April 2026 +8.4%
Apr '26 vs. Apr '25 (Apr '25: 2,722) +25.6%
Apr '26 vs. Mar '26 (Mar '26: 2,349)
Listings
3,987 April 2026
+1.0%
Apr '26 vs. Apr '25 (Apr '25: 3,949)
+29.2%
Apr '26 vs. Mar '26 (Mar '26: 3,086)
About Bright MLS
Bright MLS powers some of the nation’s most dynamic real estate markets as the largest MLS in the U.S. Serving over 100,000 professionals across Delaware, Maryland, New Jersey, Pennsylvania, Virginia, West Virginia, and D.C., Bright provides realtime data, deep market intelligence, and tools supporting more than half a million buyers and sellers each month. In 2025, Bright enabled over 460,000 listings. Built to lead, Bright delivers trusted housing insights and industry-leading tools that drive a more transparent, competitive marketplace. Learn more at BrightMLS.com.
Prepared by Bright Research
Market Statistics
1,267 April 2026
+3.8%
Apr '26 vs. Apr '25 (Apr '25: 1,221)
+16.3%
Apr '26 vs. Mar '26 (Mar '26: 1,089)
Data as of May 6, 2026
$621,231
April 2026
+0.3%
Apr '26 vs. Apr '25 (Apr '25: $619,500)
+1.1%
Apr '26 vs. Mar '26 (Mar '26: $614,410)
Median Days on Market
8 days
April 2026
+1 day
Apr '26 vs. Apr '25 (Apr '25: 7 days)
-3 days
Apr '26 vs. Mar '26 (Mar '26: 11 days)
New Pending Sales
1,464
April 2026
+11.3%
Apr '26 vs. Apr '25 (Apr '25: 1,315) -2.1%
Apr '26 vs. Mar '26 (Mar '26: 1,495)
1,706 April 2026
+4.3%
Apr '26 vs. Apr '25 (Apr '25: 1,635) +14.2%
Apr '26 vs. Mar '26 (Mar '26: 1,494)
2,330 April 2026
+2.0%
Apr '26 vs. Apr '25 (Apr '25: 2,285)
+21.2%
Apr '26 vs. Mar '26 (Mar '26: 1,922)
About Bright MLS
Bright MLS powers some of the nation’s most dynamic real estate markets as the largest MLS in the U.S. Serving over 100,000 professionals across Delaware, Maryland, New Jersey, Pennsylvania, Virginia, West Virginia, and D.C., Bright provides realtime data, deep market intelligence, and tools supporting more than half a million buyers and sellers each month. In 2025, Bright enabled over 460,000 listings. Built to lead, Bright delivers trusted housing insights and industry-leading tools that drive a more transparent, competitive marketplace. Learn more at BrightMLS.com.
Prepared by Bright Research
Market Statistics
1,110 April 2026
+0.4%
Apr '26 vs. Apr '25 (Apr '25: 1,106)
+9.9%
Apr '26 vs. Mar '26 (Mar '26: 1,010)
Data as of May 6, 2026
$395,000
April 2026
-1.3%
Apr '26 vs. Apr '25 (Apr '25: $400,000) -1.3%
Apr '26 vs. Mar '26 (Mar '26: $400,000)
$420,000
$300,000
Median Days on Market
19 days
April 2026
+6 days
Apr '26 vs. Apr '25 (Apr '25: 13 days)
-5 days
Apr '26 vs. Mar '26 (Mar '26: 24 days)
New Pending Sales
1,326
April 2026
+10.0%
Apr '26 vs. Apr '25 (Apr '25: 1,205)
+2.3%
Apr '26 vs. Mar '26 (Mar '26: 1,296)
1,836
April 2026
+7.7%
Apr '26 vs. Apr '25 (Apr '25: 1,705) +6.1%
Apr '26 vs. Mar '26 (Mar '26: 1,731)
4,023
April 2026
+12.3%
Apr '26 vs. Apr '25 (Apr '25: 3,581)
+11.7%
Apr '26 vs. Mar '26 (Mar '26: 3,602)
About Bright MLS
Bright MLS powers some of the nation’s most dynamic real estate markets as the largest MLS in the U.S. Serving over 100,000 professionals across Delaware, Maryland, New Jersey, Pennsylvania, Virginia, West Virginia, and D.C., Bright provides realtime data, deep market intelligence, and tools supporting more than half a million buyers and sellers each month. In 2025, Bright enabled over 460,000 listings. Built to lead, Bright delivers trusted housing insights and industry-leading tools that drive a more transparent, competitive marketplace. Learn more at BrightMLS.com.