
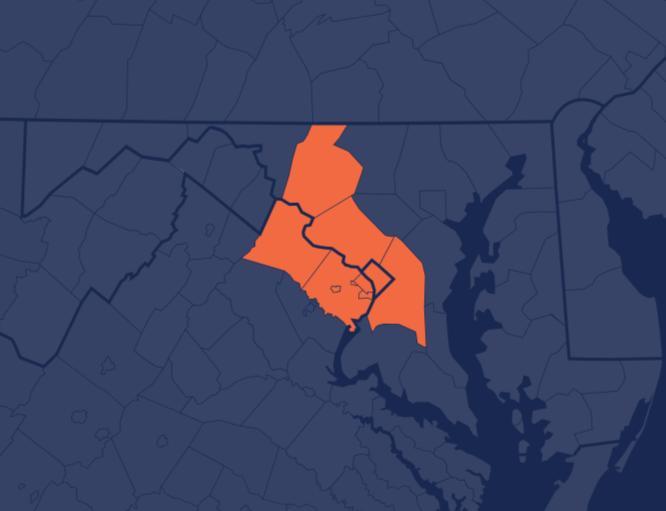
Washington, D.C. Metro
January 2026 Housing Market Report
Prepared by Bright Research
Key Market Statistics
Pending Sales
Housing Market Trends
Closed sales down sharply in January though buyers may be reemerging. The Washington, D.C. area housing market started 2026 with fewer sales but higher prices.
Closed sales fell 10.3% year-over-year in January, with declines across property types and in most local markets. New pending contracts edged up 1.9% from a year ago, which could be an early sign that demand is returning as mortgage rates ease from their 2025 peaks.
Buyers do have more choices than they did a year ago, with active listings up 18.0% compared to January 2025. The number of new listings coming onto the market in January was down, however, as some sellers continue to hold back waiting for warmer weather or clearer signals from the housing market.
The median price rose 4.8% year-over-year to $585,000, though there was a lot of variation across local markets. Prices of detached homes rose while townhome prices were flat and condo prices fell year-over-year, pointing to softer conditions at the more affordable end of the market.
Data as of February 5, 2026
The spring 2026 housing market in the Washington, D.C. region is likely to be more active, as mortgage rates come down and inventory improves. However, ongoing economic uncertainty could make both buyers and sellers more cautious. As a result, prices are likely to be softer in the D.C. region than in most other MidAtlantic housing markets.
Source: Freddie Mac
Sales January 2026
Jan '26 vs. Jan '25
Jan '26 vs. Dec '25
2,450 -10.3% -35.2% (Jan '25: 2,732) (Dec '25: 3,780)
Median Sold Price
January 2026
Jan '26 vs. Jan '25
Jan '26 vs. Dec '25
$585,000 +4.8% -5.6% (Jan '25: $558,285) (Dec '25: $620,000)
Median Days on Market
36 days +13 days +9 days (Jan '25: 23 days) (Dec '25: 27 days)
Jan '26 vs. Jan '25 January 2026
Jan '26 vs. Dec '25
January 2026
Jan '26 vs. Jan '25
Jan '26 vs. Dec '25
3,196 +1.9% +14.3% (Jan '25: 3,137) (Dec '25: 2,795)
New Listings
January 2026
Jan '26 vs. Jan '25
Jan '26 vs. Dec '25
3,541 -5.0% (Jan '25: 3,726) +66.0% (Dec '25: 2,133)
Active Listings
January 2026
Jan '26 vs. Jan '25
Jan '26 vs. Dec '25
7,142 +18.0% +1.4% (Jan '25: 6,054) (Dec '25: 7,044)
Local Markets
Local Markets
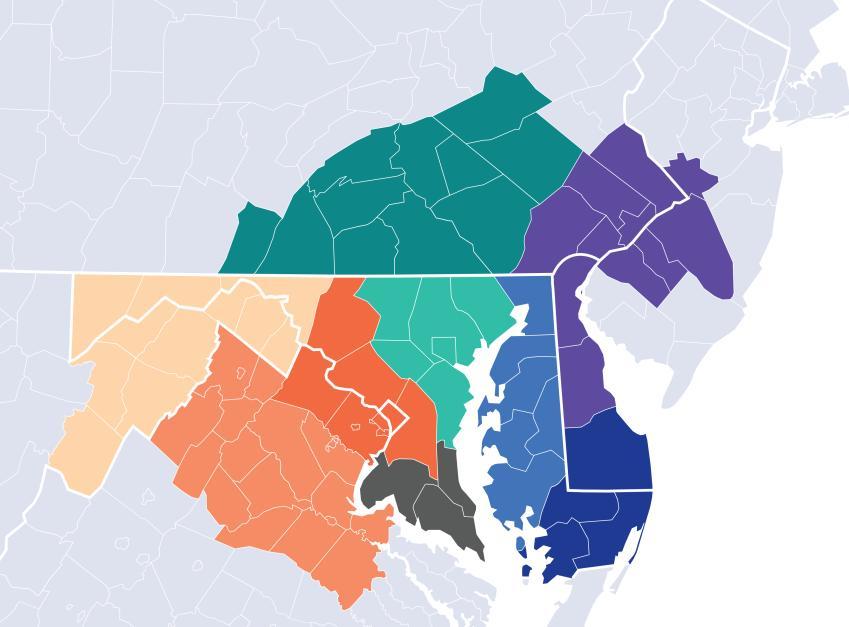
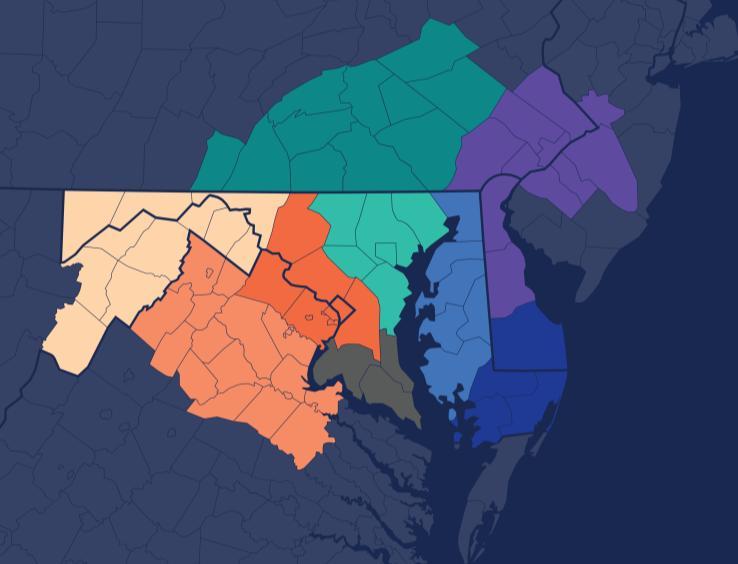
Local Market Map
MD/WV Panhandle
North Central Virginia
Washington D.C., Metro
Central Pennsylvania
Baltimore Metro
Southern Maryland
Maryland Eastern Shore
Philadelphia Metro
Del/Mar Coastal
About Bright MLS
Bright MLS powers some of the nation’s most dynamic real estate markets as the largest MLS in the U.S. Serving over 100,000 professionals across Delaware, Maryland, New Jersey, Pennsylvania, Virginia, West Virginia, and D.C., Bright provides real-time data, deep market intelligence, and tools supporting more than half a million buyers and sellers each month. In 2025, Bright enabled over 460,000 listings. Built to lead, Bright delivers trusted housing insights and industry-leading tools that drive a more transparent, competitive marketplace. Learn more at BrightMLS.com
Please contact Christy Reap, Media Relations Director with interview or information requests:
• (202) 309-9362
• christy.reap@brightmls.com
January 2026 Detached Single-Family Home Report
Prepared by Bright Research
Market Statistics
1,084 January 2026
-3.7%
Jan '26 vs. Jan '25 (Jan '25: 1,126) -35.9%
Jan '26 vs. Dec '25 (Dec '25: 1,692)
Data as of February 5, 2026
$750,000
January 2026
+2.1%
Jan '26 vs. Jan '25 (Jan '25: $734,900) -3.8%
Jan '26 vs. Dec '25 (Dec '25: $780,000)
$900,000
$850,000
$800,000
$750,000
$700,000
$650,000
$600,000
Median Days on Market
31 days
January 2026
+13 days
Jan '26 vs. Jan '25 (Jan '25: 18 days)
+7 days
Jan '26 vs. Dec '25 (Dec '25: 24 days)
New Pending Sales
1,396
January 2026
+10.6%
Jan '26 vs. Jan '25 (Jan '25: 1,262)
+15.4%
Jan '26 vs. Dec '25 (Dec '25: 1,210)
1,376 January 2026 -1.8%
Jan '26 vs. Jan '25 (Jan '25: 1,401) +64.8%
Jan '26 vs. Dec '25 (Dec '25: 835)
2,576 January 2026 +19.9%
Jan '26 vs. Jan '25 (Jan '25: 2,149)
-0.8%
Jan '26 vs. Dec '25 (Dec '25: 2,597)
About Bright MLS
Bright MLS powers some of the nation’s most dynamic real estate markets as the largest MLS in the U.S. Serving over 100,000 professionals across Delaware, Maryland, New Jersey, Pennsylvania, Virginia, West Virginia, and D.C., Bright provides realtime data, deep market intelligence, and tools supporting more than half a million buyers and sellers each month. In 2025, Bright enabled over 460,000 listings. Built to lead, Bright delivers trusted housing insights and industry-leading tools that drive a more transparent, competitive marketplace. Learn more at BrightMLS.com.
Prepared by Bright Research
January 2026 -7.2%
Jan '26 vs. Jan '25 (Jan '25: 766)
Jan '26 vs. Dec '25 (Dec '25: 1,120)
Data as of February 5, 2026
$575,000
January 2026
+0.0%
Jan '26 vs. Jan '25 (Jan '25: $575,000) -3.7%
Jan '26 vs. Dec '25 (Dec '25: $597,000)
Median Days on Market
36 days
January 2026
+17 days
Jan '26 vs. Jan '25 (Jan '25: 19 days)
+9 days
Jan '26 vs. Dec '25 (Dec '25: 27 days)
New Pending Sales
902
January 2026
Jan '26 vs. Jan '25 (Jan '25: 882)
Jan '26 vs. Dec '25 (Dec '25: 832)
946
January 2026 -7.9%
Jan '26 vs. Jan '25 (Jan '25: 1,027) +50.4%
Jan '26 vs. Dec '25 (Dec '25: 629)
1,687
January 2026 +16.3%
Jan '26 vs. Jan '25 (Jan '25: 1,450)
-0.8%
Jan '26 vs. Dec '25 (Dec '25: 1,700)
About Bright MLS
Bright MLS powers some of the nation’s most dynamic real estate markets as the largest MLS in the U.S. Serving over 100,000 professionals across Delaware, Maryland, New Jersey, Pennsylvania, Virginia, West Virginia, and D.C., Bright provides realtime data, deep market intelligence, and tools supporting more than half a million buyers and sellers each month. In 2025, Bright enabled over 460,000 listings. Built to lead, Bright delivers trusted housing insights and industry-leading tools that drive a more transparent, competitive marketplace. Learn more at BrightMLS.com.
Market Statistics
654 January 2026 -22.0%
Jan '26 vs. Jan '25 (Jan '25: 838) -32.4%
Jan '26 vs. Dec '25 (Dec '25: 968)
Data as of February 5, 2026
$375,000
January 2026 -1.3%
Jan '26 vs. Jan '25 (Jan '25: $380,000) -5.1%
Jan '26 vs. Dec '25 (Dec '25: $395,000)
$420,000
$380,000 $400,000
$360,000
$340,000
$320,000
$300,000
Median Days on Market
43 days
January 2026
+11 days
Jan '26 vs. Jan '25 (Jan '25: 32 days)
+7 days
Jan '26 vs. Dec '25 (Dec '25: 36 days)
New Pending Sales
897
January 2026
Jan '26 vs. Jan '25 (Jan '25: 992)
Jan '26 vs. Dec '25 (Dec '25: 752)
1,219
January 2026 -5.7%
Jan '26 vs. Jan '25 (Jan '25: 1,293) +82.2%
Jan '26 vs. Dec '25 (Dec '25: 669)
2,879
January 2026 +17.3%
Jan '26 vs. Jan '25 (Jan '25: 2,455)
+4.8%
Jan '26 vs. Dec '25 (Dec '25: 2,747)
About Bright MLS
Bright MLS powers some of the nation’s most dynamic real estate markets as the largest MLS in the U.S. Serving over 100,000 professionals across Delaware, Maryland, New Jersey, Pennsylvania, Virginia, West Virginia, and D.C., Bright provides realtime data, deep market intelligence, and tools supporting more than half a million buyers and sellers each month. In 2025, Bright enabled over 460,000 listings. Built to lead, Bright delivers trusted housing insights and industry-leading tools that drive a more transparent, competitive marketplace. Learn more at BrightMLS.com.