Washington, D.C. Metro
August 2026 Housing Market Report Prepared by Bright Research
Data as of September 4, 2026
Key Market Statistics
Aug 2026
Aug 2025
Change
YTD 2026
YTD 2025
Change
3,872
4,264
-9.2%
33,786
33,576
+0.6%
Median Sold Price
$640,000
$625,000
+2.4%
$646,725
$630,000
+2.7%
Median Days on Market
19 days
19 days
+0 days
13 days
12 days
+1 day
New Pending Sales
3,732
4,217
-11.5%
35,130
34,802
+0.9%
New Listings
4,300
4,469
-3.8%
50,361
50,281
+0.2%
Active Listings
11,280
10,136
+11.3%
11,280
10,136
+11.3%
Months of Supply
2.73
2.45
+0.28 mos.
2.73
2.45
+0.28 mos.
Showings
82,793
89,359
-7.3%
751,581
745,802
+0.8%
Closed Sales
Housing Market Trends
Market Outlook
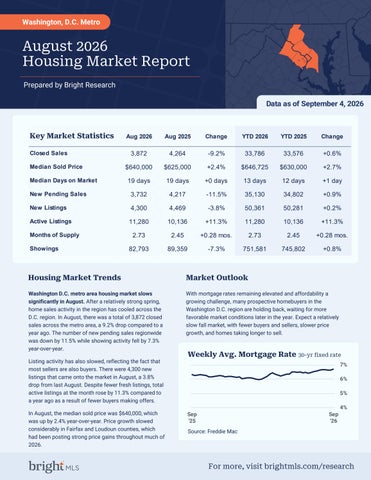
Washington D.C. metro area housing market slows significantly in August. After a relatively strong spring, home sales activity in the region has cooled across the D.C. region. In August, there was a total of 3,872 closed sales across the metro area, a 9.2% drop compared to a year ago. The number of new pending sales regionwide was down by 11.5% while showing activity fell by 7.3% year-over-year.
With mortgage rates remaining elevated and affordability a growing challenge, many prospective homebuyers in the Washington D.C. region are holding back, waiting for more favorable market conditions later in the year. Expect a relatively slow fall market, with fewer buyers and sellers, slower price growth, and homes taking longer to sell.
Listing activity has also slowed, reflecting the fact that most sellers are also buyers. There were 4,300 new listings that came onto the market in August, a 3.8% drop from last August. Despite fewer fresh listings, total active listings at the month rose by 11.3% compared to a year ago as a result of fewer buyers making offers. In August, the median sold price was $640,000, which was up by 2.4% year-over-year. Price growth slowed considerably in Fairfax and Loudoun counties, which had been posting strong price gains throughout much of 2026.
Weekly Avg. Mortgage Rate 30-yr fixed rate 7% 6%
5% 4% Sep '25
Sep '26
Source: Freddie Mac
For more, visit brightmls.com/research
Closed Sales
3,872
2026
2025
2024
2023
2022
Aug Sep
Oct
Nov Dec
2024
2023
2022
7,500
August 2026
-9.2%
5,000
Aug '26 vs. Aug '25 (Aug '25: 4,264)
2,500
-17.4% Aug '26 vs. Jul '26
0 Jan
(Jul '26: 4,690)
Feb
August 2026
+2.4% Aug '26 vs. Aug '25 (Aug '25: $625,000)
Jul
2025
$700,000 $650,000 $600,000 $550,000 $500,000
$450,000
-1.5%
$400,000
Aug '26 vs. Jul '26
$350,000 Jan Feb Mar Apr May Jun
(Jul '26: $650,000)
Median Days on Market
19 days
Apr May Jun
2026
Median Sold Price
$640,000
Mar
2026
Jul Aug Sep Oct Nov Dec
2025
2024
2023
2022
40 days
August 2026
+0 days Aug '26 vs. Aug '25
30 days 20 days
(Aug '25: 19 days)
+4 days Aug '26 vs. Jul '26 (Jul '26: 15 days)
10 days 0 days Jan Feb Mar Apr May Jun
August 2026 Housing Market Report
Jul
Aug Sep
Oct Nov Dec
Washington, D.C. Metro : 2
New Pending Sales
3,732
2026
2025
2024
2023
2022
Aug Sep
Oct
Nov Dec
2024
2023
2022
Aug Sep
Oct
Nov Dec
2024
2023
2022
Aug Sep
Oct
Nov Dec
7,500
August 2026
-11.5%
5,000
Aug '26 vs. Aug '25 (Aug '25: 4,217)
2,500
-11.2% Aug '26 vs. Jul '26
0 Jan
(Jul '26: 4,202)
Feb
Apr May Jun
2026
New Listings
4,300
Mar
Jul
2025
10,000
August 2026
7,500
-3.8% Aug '26 vs. Aug '25
5,000
(Aug '25: 4,469)
-15.4% Aug '26 vs. Jul '26
2,500 0 Jan
(Jul '26: 5,085)
Active Listings
11,280 August 2026
+11.3% Aug '26 vs. Aug '25 (Aug '25: 10,136)
-1.3% Aug '26 vs. Jul '26 (Jul '26: 11,431)
Feb Mar Apr May Jun
2026
Jul
2025
12,500 10,000 7,500 5,000
2,500 0 Jan
August 2026 Housing Market Report
Feb Mar Apr May Jun
Jul
Washington, D.C. Metro : 3
Closed Sales
Local Markets
Median Sales Price
Median Days on Market
Aug '26
vs. Aug '25
Aug '26
vs. Aug '25
Aug '26
vs. Aug '25
Washington, D.C. Metro
3,872
-9.2%
$640,000
+2.4%
19 days
+0 days
Alexandria City, VA
130
-28.6%
$752,500
+9.1%
19 days
+2 days
Arlington County, VA
193
+0.5%
$860,729
+14.8%
14 days
-10 days
Fairfax City, VA
22
-35.3%
$677,450
-26.8%
18 days
+12 days
Fairfax County, VA
957
-5.7%
$752,250
-0.4%
13 days
-1 day
Falls Church City, VA
22
+37.5%
$1,250,000
+76.7%
17 days
+2 days
Frederick County, MD
299
-4.5%
$525,000
+2.7%
25 days
+6 days
Loudoun County, VA
432
-16.9%
$771,250
+0.9%
16 days
+2 days
Montgomery County, MD
779
-8.1%
$639,540
+3.3%
18 days
-1 day
Prince George's County, MD
600
+0.0%
$445,000
+1.1%
27 days
+3 days
Washington, DC
438
-19.5%
$681,500
+1.7%
28 days
-5 days
New Pending Sales
Local Markets
New Listings
Showings
Aug '26
vs. Aug '25
Aug '26
vs. Aug '25
Aug '26
vs. Aug '25
Washington, D.C. Metro
3,732
-11.5%
4,300
-3.8%
82,793
-7.3%
Alexandria City, VA
132
-22.4%
149
-12.9%
2,477
-24.9%
Arlington County, VA
180
-2.7%
190
+5.6%
3,197
-11.6%
Fairfax City, VA
30
-3.2%
26
-10.3%
596
+2.8%
Fairfax County, VA
938
-7.0%
951
-1.9%
20,186
-9.8%
Falls Church City, VA
7
-12.5%
8
-42.9%
135
-15.1%
Frederick County, MD
330
+2.2%
362
-3.2%
5,141
-10.8%
Loudoun County, VA
358
-24.6%
420
-6.5%
7,272
-8.4%
Montgomery County, MD
697
-15.8%
783
-2.9%
16,981
-6.3%
Prince George's County, MD
687
-8.5%
840
+5.3%
17,573
+2.4%
Washington, DC
373
-14.6%
571
-15.9%
9,235
-10.6%
August 2026 Housing Market Report
Washington, D.C. Metro : 4
Active Listings
Local Markets
Months of Supply
Aug '26
vs. Aug '25
Aug '26
vs. Aug '25
Washington, D.C. Metro
11,280
+11.3%
2.73
+0.28 months
Alexandria City, VA
390
+22.6%
2.35
+0.37 months
Arlington County, VA
470
+12.2%
2.44
+0.19 months
Fairfax City, VA
51
+6.3%
1.89
+0.04 months
Fairfax County, VA
1,985
+20.3%
1.97
+0.29 months
Falls Church City, VA
36
-10.0%
2.57
-0.76 months
Frederick County, MD
770
+8.9%
2.52
+0.12 months
Loudoun County, VA
907
+17.6%
2.09
+0.33 months
Montgomery County, MD
2,023
+18.3%
2.47
+0.33 months
Prince George's County, MD
2,134
+15.5%
3.33
+0.68 months
Washington, DC
2,514
-4.3%
4.91
+0 months
Local Market Map MD/WV Panhandle North Central Virginia Washington D.C., Metro Central Pennsylvania Baltimore Metro Southern Maryland
Maryland Eastern Shore Philadelphia Metro Del/Mar Coastal
About Bright MLS Bright MLS powers some of the nation’s most dynamic real estate markets as the largest MLS in the U.S. Serving over 100,000 professionals across Delaware, Maryland, New Jersey, Pennsylvania, Virginia, West Virginia, and D.C., Bright provides real-time data, deep market intelligence, and tools supporting more than half a million buyers and sellers each month. In 2025, Bright enabled over 460,000 listings. Built to lead, Bright delivers trusted housing insights and industry-leading tools that drive a more transparent, competitive marketplace. Learn more at BrightMLS.com.
More market insights are available at brightmls.com/research.
Please contact Christy Reap, Media Relations Director with interview or information requests: •
(202) 309-9362
•
christy.reap@brightmls.com
Washington, D.C. Metro : 5
Washington D.C. Metro
August 2026 Detached Single-Family Home Report Prepared by Bright Research Data as of September 4, 2026
Key Market Statistics
Aug 2026
Aug 2025
Change
1,875
1,974
-5.0%
Median Sold Price
$835,000
$835,000
+0.0%
Median Days on Market
14 days
17 days
-3 days
New Pending Sales
1,791
1,988
-9.9%
New Listings
1,743
1,934
-9.9%
Active Listings
4,187
4,240
-1.3%
Months of Supply
2.15
2.25
-0.10 mos.
Closed Sales
Closed Sales
1,875 August 2026
-5.0%
2026
2022
2,500
(Aug '25: 1,974)
1,500
(Jul '26: 2,244)
2023
3,000
2,000
Aug '26 vs. Jul '26
2024
3,500
Aug '26 vs. Aug '25
-16.4%
2025
1,000 500 0 Jan
Feb Mar
Apr May Jun
Jul
Aug Sep
Oct
Nov Dec
For more, visit brightmls.com/research
2026
Median Sold Price
$835,000
$950,000
August 2026
$900,000
+0.0% Aug '26 vs. Aug '25 (Aug '25: $835,000)
-1.8% Aug '26 vs. Jul '26
$700,000 $650,000 $600,000 Jan Feb Mar Apr May Jun
2026
35 days
August 2026
30 days
+3 days Aug '26 vs. Jul '26
Oct
Nov Dec
2024
2023
2022
Aug Sep
Oct
0 days Jan
Feb Mar Apr May Jun
2026
3,000
(Jul '26: 1,943)
2022
5 days
August 2026
Aug '26 vs. Jul '26
2023
10 days
3,500
-7.8%
2024
15 days
1,791
(Aug '25: 1,988)
2025
Aug Sep Oct Nov Dec
20 days
New Pending Sales
Aug '26 vs. Aug '25
Jul
25 days
(Jul '26: 11 days)
-9.9%
2022
$750,000
14 days
(Aug '25: 17 days)
2023
$800,000
Median Days on Market
Aug '26 vs. Aug '25
2024
$850,000
(Jul '26: $849,995)
-3 days
2025
Jul
2025
Aug Sep
2,500 2,000 1,500 1,000 500
0 Jan
Feb
Mar
Apr May Jun
August 2026 Detached Single-Family Home Report
Jul
Nov
Dec
Washington D.C. Metro : 2
2026
New Listings
1,743 August 2026
-9.9% Aug '26 vs. Aug '25 (Aug '25: 1,934)
-19.8% Aug '26 vs. Jul '26
Jan
Feb
Mar
Active Listings
August 2026
-1.3% Aug '26 vs. Aug '25 (Aug '25: 4,240)
-3.9% Aug '26 vs. Jul '26 (Jul '26: 4,357)
2024
2023
Aug Sep
Oct
2024
2023
Aug Sep
Oct
2022
4,500 4,000 3,500 3,000 2,500 2,000 1,500 1,000 500 0
(Jul '26: 2,174)
4,187
2025
Apr May Jun
2026
Jul
2025
Nov
Dec
2022
5,000 4,500 4,000 3,500 3,000 2,500 2,000 1,500 1,000 500 0 Jan
Feb
Mar
Apr May Jun
Jul
Nov
Dec
About Bright MLS Bright MLS powers some of the nation’s most dynamic real estate markets as the largest MLS in the U.S. Serving over 100,000 professionals across Delaware, Maryland, New Jersey, Pennsylvania, Virginia, West Virginia, and D.C., Bright provides realtime data, deep market intelligence, and tools supporting more than half a million buyers and sellers each month. In 2025, Bright enabled over 460,000 listings. Built to lead, Bright delivers trusted housing insights and industry-leading tools that drive a more transparent, competitive marketplace. Learn more at BrightMLS.com.
August 2026 Detached Single-Family Home Report
Washington D.C. Metro : 3
Washington D.C. Metro
August 2026 Attached/Townhomes Report Prepared by Bright Research Data as of September 4, 2026
Key Market Statistics
Aug 2026
Aug 2025
Change
1,106
1,137
-2.7%
Median Sold Price
$588,000
$592,250
-0.7%
Median Days on Market
17 days
17 days
+0 days
New Pending Sales
1,063
1,133
-6.2%
New Listings
1,223
1,277
-4.2%
Active Listings
2,756
2,514
+9.6%
Months of Supply
2.37
2.17
+0.20 mos.
Closed Sales
Closed Sales
1,106 August 2026
-2.7% Aug '26 vs. Aug '25 (Aug '25: 1,137)
-15.9% Aug '26 vs. Jul '26 (Jul '26: 1,315)
2026
2025
2024
2023
2022
2,000 1,800 1,600 1,400 1,200 1,000 800 600 400 200 0 Jan
Feb Mar
Apr May Jun
Jul
Aug Sep
Oct
Nov Dec
For more, visit brightmls.com/research
2026
Median Sold Price
$588,000 August 2026
-0.7% Aug '26 vs. Aug '25 (Aug '25: $592,250)
-3.2% Aug '26 vs. Jul '26
$500,000 $450,000 $400,000 Jan Feb Mar Apr May Jun
2026
40 days
August 2026
35 days
(Aug '25: 17 days)
15 days
(Aug '25: 1,133)
-12.0% Aug '26 vs. Jul '26 (Jul '26: 1,208)
2023
2022
Oct
Nov Dec
2024
2023
2022
Aug Sep
Oct
5 days 0 days Jan
Feb Mar Apr May Jun
2026
New Pending Sales
Aug '26 vs. Aug '25
2024
10 days
(Jul '26: 13 days)
-6.2%
2025
Aug Sep Oct Nov Dec
25 days 20 days
August 2026
Jul
30 days
Aug '26 vs. Aug '25
1,063
2022
$550,000
17 days
Aug '26 vs. Jul '26
2023
$600,000
Median Days on Market
+4 days
2024
$650,000
(Jul '26: $607,500)
+0 days
2025
Jul
2025
Aug Sep
2,500 2,000 1,500 1,000 500
0 Jan
Feb
Mar
August 2026 Attached/Townhomes Report
Apr May Jun
Jul
Nov
Dec
Washington D.C. Metro : 2
2026
New Listings
1,223
3,000
August 2026
2,500
-4.2%
2,000
Aug '26 vs. Aug '25
1,000
-14.5%
500 Jan
Feb
Mar
Active Listings
Aug Sep
Oct
2024
2023
Aug Sep
Oct
2022
Jul
2025
Nov
Dec
2022
3,000 2,500
+9.6%
2,000
Aug '26 vs. Aug '25
1,500
(Aug '25: 2,514)
1,000
+0.9%
500
(Jul '26: 2,731)
Apr May Jun
2026
August 2026
Aug '26 vs. Jul '26
2023
0
(Jul '26: 1,430)
2,756
2024
1,500
(Aug '25: 1,277)
Aug '26 vs. Jul '26
2025
0 Jan
Feb
Mar
Apr May Jun
Jul
Nov
Dec
About Bright MLS Bright MLS powers some of the nation’s most dynamic real estate markets as the largest MLS in the U.S. Serving over 100,000 professionals across Delaware, Maryland, New Jersey, Pennsylvania, Virginia, West Virginia, and D.C., Bright provides realtime data, deep market intelligence, and tools supporting more than half a million buyers and sellers each month. In 2025, Bright enabled over 460,000 listings. Built to lead, Bright delivers trusted housing insights and industry-leading tools that drive a more transparent, competitive marketplace. Learn more at BrightMLS.com.
August 2026 Attached/Townhomes Report
Washington D.C. Metro : 3
Washington D.C. Metro
August 2026 Condos Report Prepared by Bright Research Data as of September 4, 2026
Key Market Statistics
Aug 2026
Aug 2025
Change
890
1,152
-22.7%
Median Sold Price
$386,500
$410,000
-5.7%
Median Days on Market
34 days
25 days
+9 days
New Pending Sales
878
1,094
-19.7%
New Listings
1,333
1,257
+6.0%
Active Listings
4,337
3,382
+28.2%
Months of Supply
4.30
3.11
+1.19 mos.
Closed Sales
Closed Sales
890 August 2026
-22.7% Aug '26 vs. Aug '25 (Aug '25: 1,152)
-21.2% Aug '26 vs. Jul '26 (Jul '26: 1,129)
2026
2025
2024
2023
2022
2,000 1,800 1,600 1,400 1,200 1,000 800 600 400 200 0 Jan
Feb Mar
Apr May Jun
Jul
Aug Sep
Oct
Nov Dec
For more, visit brightmls.com/research
2026
Median Sold Price
$386,500
$420,000
August 2026
$400,000
-5.7%
$380,000
Aug '26 vs. Aug '25
$340,000
-1.5%
$320,000 Jan Feb Mar Apr May Jun
Median Days on Market
August 2026
+9 days Aug '26 vs. Aug '25 (Aug '25: 25 days)
+4 days Aug '26 vs. Jul '26
2026
Jan
-19.7% Aug '26 vs. Aug '25 (Aug '25: 1,094)
-16.4%
Jul
2025
Feb Mar Apr May Jun
2026
New Pending Sales
August 2026
2022
Aug Sep Oct Nov Dec
2024
2023
2022
Oct
Nov Dec
2024
2023
2022
Aug Sep
Oct
50 days 45 days 40 days 35 days 30 days 25 days 20 days 15 days 10 days 5 days 0 days
(Jul '26: 30 days)
878
2023
$300,000
(Jul '26: $392,500)
34 days
2024
$360,000
(Aug '25: $410,000)
Aug '26 vs. Jul '26
2025
Jul
2025
Aug Sep
2,500 2,000 1,500 1,000 500
Aug '26 vs. Jul '26 (Jul '26: 1,050)
August 2026 Condos Report
0 Jan
Feb
Mar
Apr May Jun
Jul
Nov
Dec
Washington D.C. Metro : 2
2026
New Listings
1,333
3,000
August 2026
2,500
+6.0%
2,000
Aug '26 vs. Aug '25
1,000
-9.9%
500 Jan
(Jul '26: 1,480)
Feb
Mar
Active Listings
+28.2% Aug '26 vs. Aug '25 (Aug '25: 3,382)
-0.1% Aug '26 vs. Jul '26
2023
Aug Sep
Oct
2024
2023
Aug Sep
Oct
2022
0
Aug '26 vs. Jul '26
August 2026
2024
1,500
(Aug '25: 1,257)
4,337
2025
Apr May Jun
2026
Jul
2025
Nov
Dec
2022
5,000 4,500 4,000 3,500 3,000 2,500 2,000 1,500 1,000 500 0
(Jul '26: 4,343)
Jan
Feb
Mar
Apr May Jun
Jul
Nov
Dec
About Bright MLS Bright MLS powers some of the nation’s most dynamic real estate markets as the largest MLS in the U.S. Serving over 100,000 professionals across Delaware, Maryland, New Jersey, Pennsylvania, Virginia, West Virginia, and D.C., Bright provides realtime data, deep market intelligence, and tools supporting more than half a million buyers and sellers each month. In 2025, Bright enabled over 460,000 listings. Built to lead, Bright delivers trusted housing insights and industry-leading tools that drive a more transparent, competitive marketplace. Learn more at BrightMLS.com.
August 2026 Condos Report
Washington D.C. Metro : 3