Assume that the UK population was 1.5% higher in September 2023 than in 2020.
Use Extract A and the information in Extract B (line 17) to calculate UK national debt per head in September 2023.
Give your answer to the nearest thousand [4 marks]
Use Extract A to identify two significant points of comparison between the natural change in the population and net migration into the UK over the period shown.
[4 marks]
Comparison 1
Extra space
Comparison 2
Extra space
Turn over for the next question
Use the information in Extract B (lines 8–12) to complete the pie chart to show the forecast age structure of the UK population in 2039.
[4 marks]
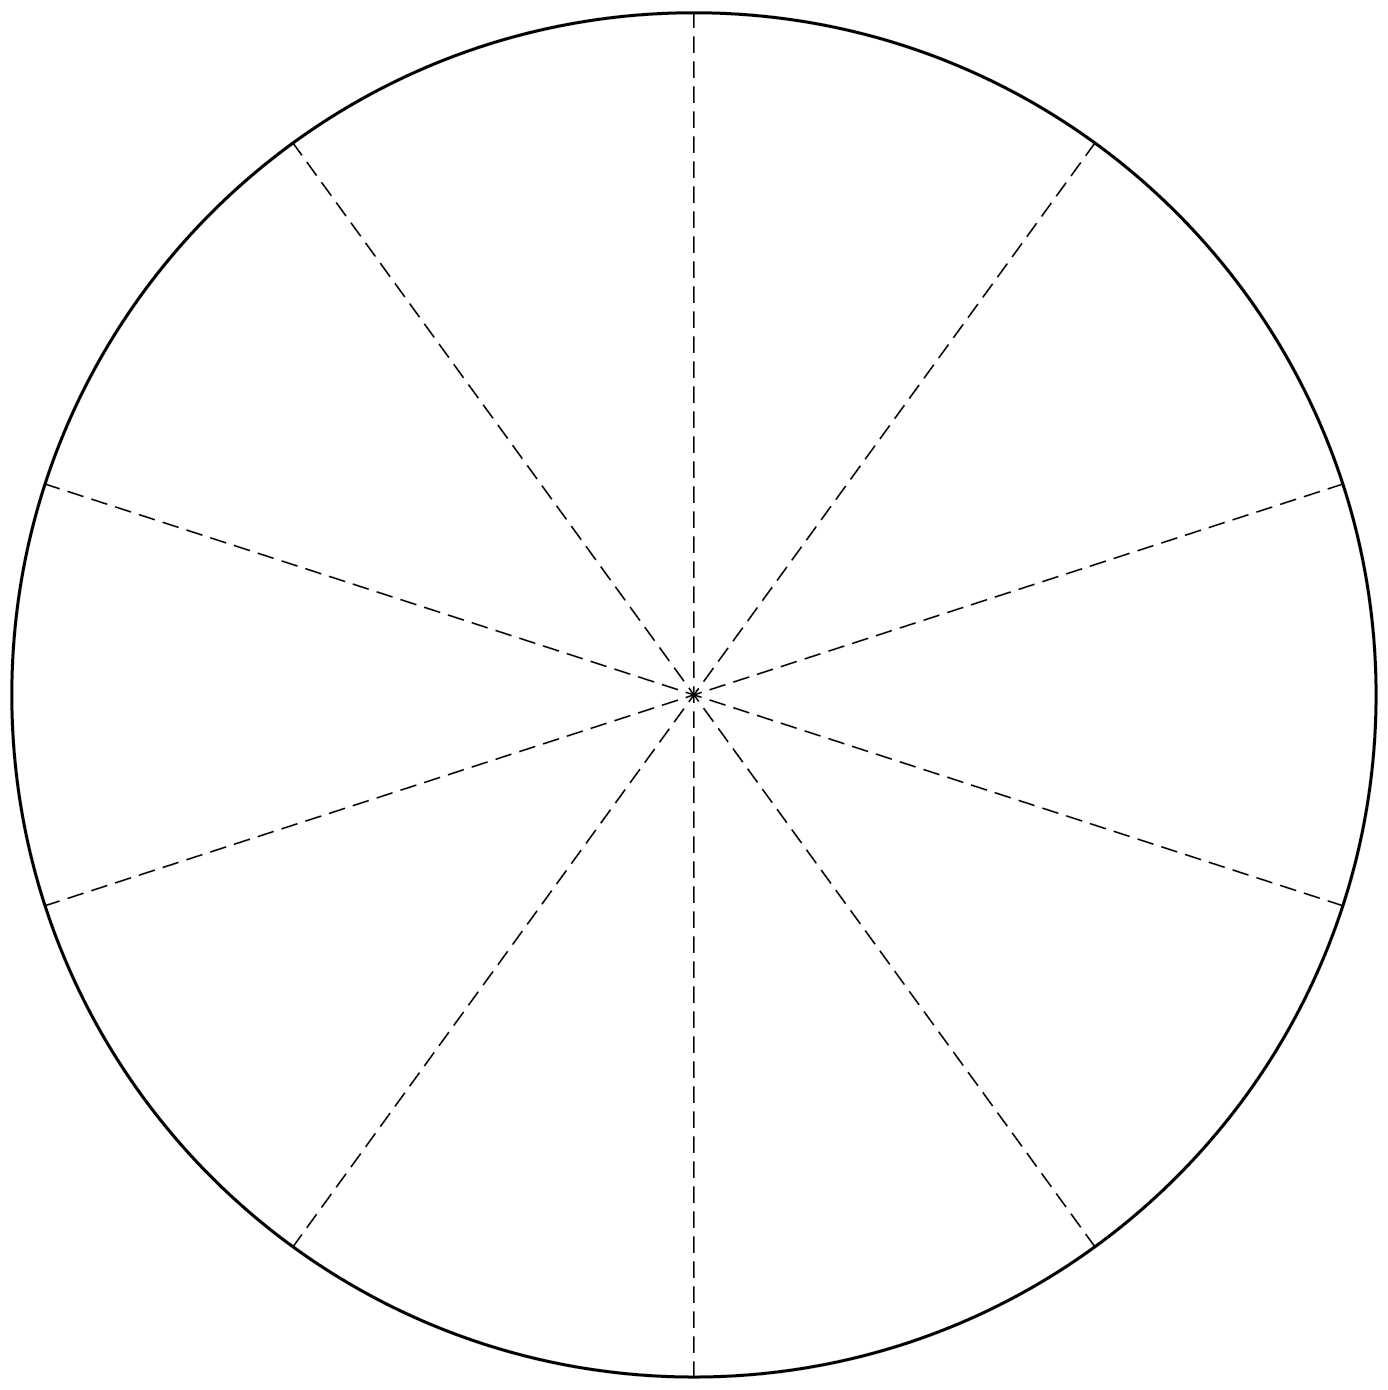
As a guide, each sector of the pie chart represents 10% of the total. The use of a protractor is not required.
CLICK THE LINK BELOW TO ACCESS THIS PAPER
MERGED 2025 AQA AS ECONOMICS Paper 2 and Mark Scheme (7135/2: The National Economy in a Global Context)