SPECIAL TOPIC: LAND SEISMIC
Redefining transition-zone 3D seismic acquisition: Flexible land-nodal methods applied to the Kalundborg-Gassum CCS site, Denmark Piotr Potepa1*, Karim Souissi2, Manuel Beitz 2, Ewa Zubrzycka1 and Jerzy Trela1 describe how the challenges specific to the transition zone (TZ) in 3D seismic surveys can be overcome in a cost-effective manner by adapting land seismic equipment for use in marine conditions. Abstract Equinor and its partners Ørsted and Nordsøfonden recently conducted the Kalundborg carbon capture and storage (CCS) 3D seismic survey, acquired by Geofizyka Toruń S.A. (GT), to evaluate the suitability of subsurface sites for CO2 storage in Denmark’s coastal transition zone. This paper describes how challenges specific to transition zone (TZ) in 3D seismic surveys can be overcome in a cost-effective manner, by adapting land seismic equipment to marine conditions. With a strong focus on compliance with environmental regulations, the project successfully delivered high-quality 3D seismic data by integrating land-nodal technology across both onshore and offshore settings. The innovative application of buoy-mounted nodes, combined with an adaptive acquisition design, enabled seamless data acquisition and processing while minimising operational complexity. This approach sets a new benchmark for transition-zone seismic surveys. Introduction Seismic operations in transition zones and shallow water present unique challenges (Clark et al. 2025). The dual nature
of transition zones, which straddle both marine and terrestrial conditions, requires equipment and methodologies from both domains. In many cases, this is neither economically nor operationally efficient. Traditional marine methods, such as streamer vessels and ocean-bottom nodes (OBNs), are designed for use in deeper waters, whereas conventional land seismic systems cannot be used directly in shallow water. The lack of suitable technology has led to transition zones being overlooked in many projects, resulting in data gaps and compromised subsurface models. For the Kalundborg CCS 3D seismic survey here presented, having both features of transition zone and shallow water (Figure 1), we developed an innovative solution by adapting wireless land seismic node technology for use in shallow water. These self-contained recording units are mounted on buoyancy systems with integrated hydrophones. The nodes operate independently, storing data locally and being powered by internal batteries. By bridging the gap between land- and marine-based methods, this solution transforms one of the most challenging survey environments into a manageable and predictable part of seismic exploration.
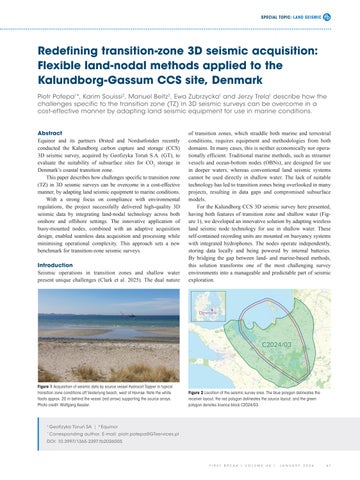
Figure 1 Acquisition of seismic data by source vessel Hydrocat Tapper in typical transition zone conditions off Vesterlyng beach, west of Havnsø. Note the white floats approx. 20 m behind the vessel (red arrow) supporting the source arrays. Photo credit: Wolfgang Kessler.
Figure 2 Location of the seismic survey area. The blue polygon delineates the receiver layout, the red polygon delineates the source layout, and the green polygon denotes licence block C2024/03.
1
Geofizyka Torun’ SA | 2 Equinor
*
Corresponding author, E-mail: piotr.potepa@GTservices.pl
DOI: 10.3997/1365-2397.fb2026005
FIRST
BREAK
I
VOLUME
44
I
JANUARY
2026
67
SPECIAL TOPIC: LAND SEISMIC
Figure 3 Simplified geologic cross section from Stenlille (Stenlille domal structure) across Havnsø (Havnsø domal structure) to Nekselø Island (Zappalá et al. 2024).
Survey objectives
The Kalundborg CCS 3D seismic survey is the initial phase of the CO2 Storage Kalundborg initiative supported by Equinor and its partners Ørsted and Nordsøfonden. The aim is characterisation of the key geological formations targeted for CO2 storage. This work contributes to Denmark’s broader strategy for carbon management and reduction through the development of a CO2 injection and storage facility. The survey took place in northwestern Zealand (Sjælland in Danish), Denmark, within licence C2024/03, primarily covering the Kalundborg municipality. The receiver area covered approximately 225 km², including 171 km² onshore and 54 km² in the transition and shallow water zones of Nekselø Bay (Figure 2). The main objective was the mapping and characterisation of the Havnsø structure, a four-way anticline formed by the halokinetic movement of Zechstein salt and subsequently uplifted during the Cenozoic period. The main reservoir extends from Upper Triassic to Lower Jurassic Gassum-Fjerritslev formations, and the Lower Triassic Bunter sandstone formation could be considered as a secondary reservoir (Figure 3). Since only sparse 2D seismic data was covering the area, this new 3D survey was essential for modelling the structure’s storage capacity, planning and positioning of future exploration and injection wells, as well as derisking the injection and storage process. Survey framework The licence award in June 2024 included a commitment to Danish authorities to have processed data available by March 2026, thus requiring acquisition to be conducted in the first half of 2025. However, as the survey area extended over marine protected and sensitive ecosystems, and with Equinor and partners strong focus on safety and environmental compliance, offshore data acquisition could only proceed during the period between early February and late April, outside nesting and feeding periods of marine fauna. Beside the offshore part, the survey area covered a variety of terrains, including agricultural lands, urban settlements, lakes and shallow coastal waters with variable bathymetry. It presented the typical logistical and operational challenges associated with complex transition zone projects. Additionally, strict environmental regulations, distributed unevenly across the survey region and driven by the ecological characteristics of specific zones were thoroughly followed. For example, the coastal zone, being 68
FIRST
BREAK
I
VOLUME
44
I
JANUARY
2026
Figure 4 Environmental regulations in the work area. The blue polygon indicates the receiver area and the red polygon indicates the source area. Coloured areas: regions where seismic acquisition was either permanently restricted (red) or time/ technology-limited (other colours).
designated as a protected landscape, was entirely excluded from the survey (Figure 4). Successfully navigating through these dynamic operational challenges and strictly complying with the environmental regulations meant that a highly adaptive and carefully sequenced acquisition plan was necessary. It demanded precise planning, operational flexibility, and close co-ordination with the permitting and land access consenting teams to ensure that all activities were completed on time, in full compliance with environmental requirements, and without compromising on safety or data quality. Innovative and sustainable acquisition approach Equinor entrusted Geofizyka Toruń with the safe execution of the Kalundborg 3D survey to deliver a seismic solution that combined high data quality, operational flexibility and cost efficiency.
SPECIAL TOPIC: LAND SEISMIC
Survey design
The initial onshore design specified intervals of 300 m and 200 m between the source and receiver lines, respectively, and 20 m spacing for both the source points and receivers. This resulted in approximately 26,000 vibrator points (VPs) and 45,000 receiver positions on land. As for the offshore configuration, the initial plan was to have 200-m receiver lines and 300-m receiver intervals, together with a very dense source grid of 20-m intervals between both points and lines. This would have resulted in more than 110,000 source points and around 860 receiver positions at sea (Table 1). Recording so many marine source points in approximately 10 weeks of acquisition – to comply with the environmental regulations – was deemed challenging given the operational limitations. Therefore, for the sake of keeping up with the timeframe allowed for offshore acquisition, and to further adapt to the complex transition zone setting of the project, GT offered here a forward-thinking concept and a technically robust approach. The configuration at sea was revised by adopting a carpet design, with the receivers arranged in a grid pattern at 160-m intervals. Source lines were spaced at 60-m intervals, with 20-m source point spacing. These modifications decreased the number of source points down to 38,000 approx. and thus saved time, but the number of receivers increased from 860 to about 2000. This was still operationally acceptable and allowed for effective quality control over all receivers while ensuring adequate space for passing vessels and reducing the risk of equipment damage. Despite these changes, the match between the offshore grid and the land geometry was maintained to
ensure consistency as land nodes were also recording marine source points and similarly marine nodes were recording VPs. The resulting preplots, presented on Figure 5 (left) were adapted throughout the acquisition to meet operational challenges and environmental regulations and led to postplots presented in Figure 5 (right). Table 1 summarises the onshore and offshore survey design from the initial proposal to the actual postplots that were acquired. Data acquisition
Offshore The seismic survey began with the offshore phase to ensure completion ahead of 1 May as required by the environmental regulations. Before acquiring data, navigational warning buoys were used to mark the survey area, and a dedicated navigation corridor was established between the port of Havnsø and the islands of Nekselø and Sejerø to ensure the safe passage of vessels. Three smaller vessels were used to deploy the buoy-based receiver nodes. Where the water was too shallow for the source to be deployed, either the density of the receivers was increased in surrounding areas, or marsh phones were used to maintain data coverage. Due to the variable bathymetry, two vessels of different sizes were used for the source operations: a larger 24h operational vessel for deeper waters and a smaller vessel for shallower zones for daylight only operations. Seismic energy was generated using two airgun arrays with volumes of 450 and 480 cubic inches,
Onshore
Offshore
Initial proposal
45,000 Receivers: 20 m x 200 26,000 Sources: 20 m x 300 m
860 Receivers: 300 m x 200 m 110,000 Sources: 20 m x 20 m
Preplot
45,000 Receivers: 20 m x 200 m 26,000 Sources: 20 m x 300 m
2,000 Receivers: 160 m x 160 m 38,000 Sources: 20 m x 60 m
Postplot
33,752 Receivers 23,957 Sources
1,842 Receivers 36,758 Sources
Table 1 Acquisition designs and their evolution for both offshore and onshore portions.
Figure 5 Survey geometry layout: theoretical preplot (left) versus after acquisition postplot (right). Sources are marked in red and receivers in blue.
FIRST
BREAK
I
VOLUME
44
I
JANUARY
2026
69
SPECIAL TOPIC: LAND SEISMIC
Figure 6 The Quantum® node on the buoys records its position continuously at least every 10 minutes. These co-ordinates (blue dots) were used to determine the COG (centre of gravity, black points) versus the buoy drop position (red points). The figure shows a good match between the COG and the dropped position.
respectively. Both arrays were operated at a depth of two metres and a working pressure of 2000 psi. A total of 36,758 source points were acquired, including infill source lines around non-accessible areas such as Nekselø island, as if undershooting an obstruction, to maximise coverage on mid and far offsets. Data were recorded using 1842 buoy-mounted nodes. The offshore acquisition began on 7 March 2025 and was completed on 28 April 2025. The key part of the offshore acquisition was the innovative use of onshore nodal systems for data recording across the entire survey area, including offshore. Specifically, the project utilised Quantum nodes from Inova, which were originally designed for land operations and were successfully adapted for deployment in marine conditions. The nodes were mounted on surface buoys, each of which was connected to a hydrophone that was lowered and laid on the seafloor. The buoys and hydrophones were stabilised using anchors.
The Quantum® nodes deployed on buoys were fitted with the HyperQ feature which was a key factor in the success of the offshore campaign. It enables the nodes to communicate wirelessly to a central location over a range of several kilometres and to provide regular operational status updates. This allowed the crew to continuously monitor node performance and respond quickly to any anomalies, significantly reducing the risk of data loss. As a result, the number of buoys lost throughout the entire offshore operation was only 4, which is a remarkably low number given the challenging marine environment. The final positioning of the offshore receivers was determined using the internal Global Navigation Satellite System (GNSS) of each node. Geofizyka Toruń then used an in-house processing solution to clean and refine the raw positioning data, enabling the precise determination of the final centre of gravity (COG) coordinates for each receiver. This ensured that the recorded data was precisely spatially referenced, thereby contributing to the overall quality and consistency of the seismic dataset (Figure 6). Onshore The onshore phase of the Kalundborg CCS 3D seismic survey required careful consideration of the staggered environmental regulations and constraints on land access. Protected areas were either excluded from the survey (Saltbæk Vig Lake, coastal zone, birds nesting locations, etc…) or had limited access (Nekselø Island, low lands, etc…) with only a limited number of source and receiver points deployed. Furthermore, access to some private properties and farmland was not granted, which also shaped the final survey footprint. Dynamic and real time adjustments of the receiver layout were made regularly to account for permitting conditions throughout the campaign. Using a nodal acquisition system was crucial to maintaining flexibility and enabling the team to adapt the grid as needed, especially to prioritise farmers to conduct agricultural work on their fields. Additional source and receiver points were included where necessary to maintain fold coverage in areas with restricted access.
Figure 7 Overview of seismic survey operations. Left side – onshore operations: a heavy vibrator operating in a field and a mini vibrator working along a coastal road in Havnsø. Right side – offshore operations: one of the source vessels and node on the buoy deployment process. In the middle – a node mounted on a buoy. Photo credit: Karim Souissi, Ionut Popa, Mariusz Wisnowski, Branislav Berger.
70
FIRST
BREAK
I
VOLUME
44
I
JANUARY
2026
SPECIAL TOPIC: LAND SEISMIC
Figure 8 Post acquisition fold map (left); black line corresponds to the seismic brute post-stack migration with elevation statics and residual static correction with post-stack processing (right).
Source point acquisition on land was carried out using the slip-sweep technique, with a standard configuration of one 60,000 lb vibrator and a 60-second sweep. Four heavy vibrators were used across most of the survey area, while two mini-vibrators were deployed in more sensitive locations, such as Nekselø island and the urban settlements of Havnsø and Jyderup. Traffic management measures and peak particle velocity (PPV) monitoring were employed to ensure operations were conducted safely and without any effects on local infrastructure. To complement the land-based acquisition, buoy-mounted nodes were deployed on Skarresø Lake using a small electric-powered boat. A compact airgun array configured from two 40 cu.in units and towed by a customised rigid inflatable boat (RIB) was utilised as source. Compressed air on the RIB was supplied by a set of high-pressurised air bottles, pre-filled on the shore of the lake.
with limited access or heightened environmental sensitivity. The robust design, adaptive planning and flexible deployment strategies enabled the project to achieve full coverage of the target area while being fully compliant with environmental regulations. Using a homogeneous nodal recording system for the entire survey area, both onshore and offshore, enabled seamless dataset integration, QC and processing, significantly reducing logistical complexity, and allowing for on-demand and remote health monitoring of nodes without the requirement to pass each node separately. The quality of the seismic data acquired was consistently high in both land and marine environments (Figure 8) and exceeded expectations. Consistency in acquisition geometry and equipment type minimised discrepancies between different survey segments, contributing to the clarity and reliability of the final seismic volumes.
Summary The acquisition campaign, which spanned from 7 March to 26 July 2025, delivered a comprehensive seismic dataset across both onshore and offshore areas. A total of 60,715 source points were recorded, including 36,758 offshore and 23,957 on land. Offshore operations accounted for over 60% of the total source points, with the majority executed in deep water. The combination of robust equipment and advanced QC functionality provided by HyperQ proved stable and reliable and was essential to the successful execution of the offshore phase. Onshore nearly 24% of the VPs were performed using mini-vibrators to ensure a minimum impact on infrastructure and surrounding nature. This proportion reflects the logistical complexity of the survey, particularly in areas
Acknowledgements The authors gratefully acknowledge Equinor and the partners for giving permission to publish this paper. References Clark, A., Trela, J., Potepa, P., Ziółkowski, S. and Pavel, D. [2025]. Developments in nodal data acquisition in the transition zone and shallow water. First break, 40(1), 51-56. Zappalá, S., Malehmir, A., Papadopoulou, M., Gregersen, U., Funck, T., Clausen, O. and Nørmark, E. [2024]. Case History, Combined onshore and offshore wide-scale seismic data acquisition and imaging for carbon capture and storage exploration in Havnsø. Denmark. Geophysics, 89(4), B257-B272, doi: 10.1190/GEO2023-0503.1.
FIRST
BREAK
I
VOLUME
44
I
JANUARY
2026
71