LESSONS FOR HUMAN SURVIVAL: NATURE'S RECORD FROM THE QUATERNARY S.L
rising
PRESENT
Before 7 ka BP LAGOON
OCEAN
- sand and coral _ rubble
Present
S.L.
old weathered reef fresh
water
lenses
FUTURE?
6 ka - 5 ka BP erosion
reef flat High S.L.
storm ridge forms nucleus of new island
Slight fall in S.L
rubble Higher
S.L?
FUTURE?
4 ka - 3 ka BP storm waves salt Higher
S.L.
Paul Bishop (Editor) GEOLOGICAL SOCIETY OF AUSTRALIA SYMPOSIUM PROCEEDINGS 1 Symposium held as part of the International Geographical Union Congress, Sydney, August 25, 1988
LESSONS FOR HUMAN SURVIVAL: NATURE'S RECORD FROM THE QUATERNARY
Paul Bishop (Editor) GEOLOGICAL SOCIETY OF AUSTRALIA SYMPOSIUM PROCEEDINGS 1 Symposium held as part of the International Geographical Union Congress, Sydney, August 25, 1988
LESSONS FOR HUMAN SURVIVAL: NATURE'S RECORD FROM THE QUATERNARY GEOLOGICAL SOCIETY OF AUSTRALIA SYMPOSIUM PROCEEDINGS 1 ISBN: 0-909869-73-1
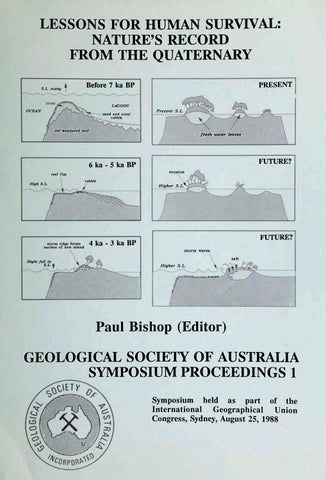
The cover figure is based on Figures 2 and 4 in the paper by Peter Roy and John Connell.
Geological Society ofAustralia Symposium Proceedings (1990) 1
CONTENTS Paul Bishop: Lessons for human survival: Nature's record from the Quaternary. Foreword
1
R.W. Galloway: Will greenhouse put us in the doghouse? - Opportunities and pitfalls in current research
5
A.P. Kershew and PA. Gell: Quaternary vegetation and the future of the forests
11
Ian Douglas: Quaternary legacies problems associated with urban andand ruralenvironmental development engineering in the South-East Asian humid tropics
21
Hiroshi Machida: Frequency and magnitude of catastrophic explosive volcanism in the Japan region during the last 130 ka: Implications for human occupance of volcanic regions
27
John Chappell: Some effects of sea-level rise on riverine and coastal lowlands
37
J.P. Cull: Cultural changes to ground temperature and anomalies in geothermnal data
51
Peter Roy and John Connell: Greenhouse effects on atoll islands in the South Pacific
57
Peter Whetton, Donald Adamson and Martin Williams: Rainfall and river flow variability in Africa, Australia and East Asia linked to El Nino-Southern Oscillation events
71
RJ. Wasson: Palaeoenvironmental research and global warming
83
iii
Geological Society of Australia Symposium Proceedings (1990) 1, 1-3.
Lessons for human survival: Nature's record from the Quaternaiy. Foreword Paul Bishop
Graduate School of Environmental Science Department of Geography & Environmental Science, Monash University, Clayton, VIC 3168, Australia THE PAST AND THE FUTURE
of research based on the possibilities of global warming by the greenhouse effect. Wasson does not By-and-large, this volume presents papers from necessarily accept the reality of this effect, but uses it authors who spoke at a half-day symposium in August as a context for his consideration of the types and 1988 during the International Geographical Union quality of palaeo-environmental data that are suitable Congress at the University of Sydney. All speakers, and appropriate for the prediction of future climates bar one, submitted manuscripts for this volume, and should the greenhouse effect indeed result in two authors, R.W. Galloway and J. Cull, did not increased global temperatures. Wasson notes that it speak at the symposium. Some authors submitted is often difficult to obtain a match in temporal/spatial papers differing in flavour or content from the papers scales and detail between the historical data and the they delivered at the symposium. requirements for prediction of future environmental Speakers were asked to speak, and subsequently trends. One trusts that this issue will be increasingly write, about aspects of using the past ("Nature's addressed by historical earth scientists. Record from the Quaternary") to guide predictions The second type of paper takes one or more about the future ("Lessons for Human Survival"). This examples of using the historical approach to provide conjunction of past and future is a currently popular insight into some aspect of the future of the theme in the earth sciences and its emphasis is partly environment or its use. Case studies are drawn from a way of highlighting a role for the geosciences in a range of environments and time scales, including debates and research on future global and local Southeast Asia, volcanic Japan, Pacific and other coral environmental crises. atolls, Africa, India, China, and southeastern and The value of this approach is examined in two tropical Australia, over time periods from the ways in the volume. One type of paper, represented Quaternary to the recent historical. by the contributions of Galloway and Wasson, The papers by Douglas and Machida are studies explicitly examines the practice of using the past to in the use of Quaternary data as aids in planning make predictions about the future. Both papers offer human occupance of Southeast Asia and Japan, methodological examinations of the roles and respectively. Douglas provides examples from various responsibilities of the geosciences in the current parts of Southeast Asia to highlight the necessity of investigations of the greenhouse effect and both a full understanding of Quaternary stratigraphy and authors strike a very cautionary note in their environmental change as a pre-requisite to human discussions. This is why these papers have been development of such areas. Machida's stratigraphical, placed first and last in the volume. chronological and archaeological data from Japan Galloway brings a long experience of research, in demonstrate the catastrophic effects of high Australia and elsewhere, to his argument that magnitude volcanic eruptions on human populations geoscientists must be circumspect in their embracing during the late Quaternary. These data suggest that
2
PAUL BISHOP
such eruptions virtually obliterated whole civilisations and Machida notes that large areas of heavily populated present-day and future Japan would be no less severely affected by such eruptions. The role of stratigraphic palynological studies in understanding past and future environmental changes is explored by Kershaw and Gell. They note that such palaeo-ecological data must be interpreted carefully, and that not all data from the past are automatically useful in a predictive way, a point echoed by Wasson, as we have seen. An important use of fine-resolution palynological data may be as a monitoring tool in areas of disturbance such as timber harvesting, although geoscientists must be very careful that their data are not 'adjusted' by authorities to support their own ends. Several papers explore the predicted global warming attendant on the greenhouse effect. Two papers (those by Chappell, and Roy and Connell) examine the effects of rising sea-level on coastal and atoll environments. The latter is probably something of a milestone in publications by the Geological Society of Australia because it discusses in some detail the effects of a sea-level rise on both physical and social, including economic, environments of low coral atolls. The physical nature of the atolls is considered in terms of their geology, geomorphology and ecology, an important element of the latter being the human occupants of the atolls. The authors note that a new class of refugee, the "environmental" refugee, may count among its number victims of the greenhouse effect, should the predicted sea-level rise come to pass. Chappell takes a different approach and uses late Quaternary environmental history to investigate the effects on tropical coastal plains of the predicted, greenhouse-induced sea-level rise. The study aims both to set out a methodology for, and give results from, such an approach. Chappell shows that the pattern of events during sea-level rise on the coastal plains investigated depends critically on sediment flux to the coast and the tidal range, and not just on simple elevation data from the coast and the projected rise in sea-level. Cull's paper is the third in the volume that examines data related to greenhouse warming. This paper shows that informative and quite precise information on past surface temperature regimes may be obtained from geothermal data. Interestingly, CulPs data from southeastern Australia do not show any evidence of surface warming during the last century, and will add to the ongoing debate about the reality of recent global warming.
The remaining paper, by Whetton, Adamson and Williams, takes a shorter-term view of the past and presents data on the variations in the El Nino over the last 100 years or so. The historical data indicate important global linkages between El Nino and floods and droughts. Unfortunately, it is not yet possible to predict the future pattern of El Nino occurrences, but the establishment of the reality of these weather and climate linkages at the global scale means that research effort must continue to be devoted to this predictive work. Certainly, much of human and other ecological well-being depends on moderate frequency, moderate magnitude events of the El Nino type, rather than on slower events to which adaptation may be made.
GEOGRAPHY AND GEOLOGY Traditionally in Australia, the subject matter of this volume has been largely the preserve of stratigraphic geomorphologists based, or trained, in the Geography departments of the country's universities. This probably reflects partly the situation in British earth sciences and partly the concentration, historically, on pre-Cainozoic geology by the State Geological Surveys and the university Geology departments. The obvious lack of interest of many practising geologists in areas of "Quaternary alluvium" on geological maps is well-known. This situation should not be taken to be that pertaining in other countries, however; indeed, I noted in a recent report in The Australian Geologist (Newsletter No. 73) that the prominence of representatives of Government Geological Surveys at the 1989 meeting of IGCP Project 296, The Quaternary of Asia and the Pacific, was very striking. The current pre-occupation with the Quaternary on the part of earth scientists hitherto little interested in this part of geological time is therefore both interesting and welcome. The interest may, in small part, be opportunistic, but it is also part of a genuine concern for the future of global environments. This interest and concern are also reflected in the mushrooming of inter-disciplinary programmes concerned with global, physical issues. It is a pleasing sign of the convergence of interest between two branches of Australian earth sciences that the symposium on "Lessons for Human Survival: Nature's Record from the Quaternary" was sponsored by the International Geographical Union whereas the Proceedings volume is being published by the Geological Society of Australia. I thank the Society for supporting the publication.
NATURE'S RECORD FROM THE QUATERNARY UNESCO The prominent role being exercised by UNESCO in considerations of current and future global change is apparent in the support provided for the "Lessons for Human Survival" symposium. The Australian National Commission for UNESCO provided the assistance necessary for Dr Hiroshi Machida to attend the symposium. The UNESCO Regional Office for Science and Technology for Southeast Asia (ROSTSEA), Jakarta, enabled the attendance of three scientists from Southeast Asia: Dr Soren Mailing (ROSTSEA, Jakarta), Dr Raymundo Punongbayan (Director of the Philippine Institute of Volcanology & Seismology, Quezon City), and Dr Lee Dong Young, the Director of the Quaternary Geology Section of the Korean Institute of Energy and Resources, Seoul. Both offices of UNESCO are sincerely thanked for this assistance.
PRODUCTION OF THIS VOLUME All papers in this volume have been refereed by at least two outside referees, as well as the editor. The following acted as referees: R J . Blong (Macquarie University) E. Bryant (Wollongong University) R.F. Cas (Monash University) W.C. Clarke (University of the South Pacific) J. Dodson (University of New South Wales) J. Grindrod (Monash University) G. Houseman (Monash University) P A . Hunt (ABC Radio Science Unit) K. Kiernan (University of Tasmania) J.B. Kirkpatrick (University of Tasmania) A.B. Pittock (CSIRO Division of Atmospheric Research, Aspendale) I. Simmonds (Bureau of Meteorology, Melbourne)
3
B.G. Thorn (University of Sydney) M A J . Williams (Monash University) BA. Zaitlin (Esso Resources, Canada) One referee chose to remain anonymous. I am very grateful to these people, all of whom refereed the manuscripts promptly and conscientiously. I also thank the authors who generally responded to my goadings with promptness (or, in a couple of cases, gave very plausible excuses for the ongoing delays in producing their manuscripts!) I assembled the text of the volume using WordPerfect v.5.0 and Mr Ian Baker of Blackwell Scientific Publications, Melbourne, provided guidance on the format of the volume, for which I am grateful.
CONCLUDING COMMENT The subject matter of this volume, namely the use of historical studies in elucidating future trends, has come to prominence only relatively recently in the earth sciences; to-date, the common, two-way conjunction has been between the past and the present. It is noteworthy that we are in the august company of two Karls, Marx and Popper, in this consideration of the interaction between the past and the future. As Galloway points out in the first paper, it is important that we do not treat this opportunity lightly, not least because the debate about the future should be modulated by experience from the past. Moreover, the standing in the community of geoscientists will be damaged by cavalier and ill-considered attempts to jump onto bandwaggons that happen to be rolling by. It would be most unfortunate if the future looked back on our current attempts to link the past and this very future, and passed the same judgement that Popper did, rightly or wrongly, in his discussion of The Poverty of Historicism.
Geological Society of Australia Symposium Proceedings (1990) 1, 5-9.
Will greenhouse put us in the doghouse? Opportunities and pitfalls in current research R.W. Galloway Honorary Fellow, CSIRO Division of Water Resources, GPO Box 1666, Canberra, ACT 2601, Australia The current wide discussion of a possible climatic warming due to the effects of increasing C0 2 and other gases in the atmosphere carries both risks and opportunities for Quaternary research. If the forecast warming does not occur, the credibility of such research will be severely affected. On the other hand, Quaternary research can contribute evidence bearing on the likelihood of a greenhouse effect and its impact on the environment. Key words: climate change, greenhouse, Quaternary.
The greenhouse effect is news. Hardly a day passes but it is mentioned by the press or radio. TV stations run greenhouse programs at peak viewing times and dire predictions of our future in a warmer earth are made on every hand. A veritable industry of greenhouse conferences has arisen with meetings every month or two somewhere in the world. In the popular mind, there is a good deal of confusion with the overlapping problem of the ozone hole but at least the public, and even politicians, are thoroughly alerted to the possibility of drastic climatic change. "Ominous changes in the world's weather ... could bring massive tragedies for mankind." This quotation is not from today's newspaper — threatening doom and gloom because of the greenhouse effect but dates from fifteen years ago (Alexander 1974). He was discussing not a projected rise in mean temperatures but a fall with conditions reverting to the 'Little Ice Age' of a few centuries ago. At about the same time, the Whitlam Government asked the Academy of Science to look into the possible impact of climate change on Australia as concern was being expressed about falling temperatures (Australian Academy of Science 1976). Evidence indicating cooling included falling global temperatures and advancing glaciers (Bryson 1973; Lamb 1974; Wood 1988). Now the wheel of fashion has turned, the worry is all about rising temperatures and, fortunately, the public has forgotten these earlier predictions. This time around, the greenhouse concept has received such an airing that the public, our paymasters, may not forget or forgive if the predicted changes fail to eventuate and the credibility of much environmental science (and scientists!) could be severely damaged.
Doubtless, if there is such a reaction, some scientists will blame the media for not stressing the caveats they build into their pronouncements (Pittock & Pearman 1989). However, an impartial radio listener, TV watcher or newspaper reader would admit that the scientists themselves often give insufficient prominence to the doubts about the greenhouse warming. For instance, the draft conference statement for the Greenhouse 88 Conference, held simultaneously in several Australian cities, states unequivocally: "There is now sufficient evidence to accept that the greenhouse effect is a reality". This statement is far too confident. There are welcome signs of increasing caution on the part of some climate modellers (Kerr 1989A) but they may have come too late to influence public perceptions of the greenhouse question. Mankind is indeed engaged in a vast, unwitting, climatic experiment. In my lifetime, world population has multiplied over two and one half times and the rate of C0 2 release from fossil fuels, forest burning and cement manufacturing has at least quadrupled to over 6 billion tonnes annually. There is no doubt that the increasing amount of C0 2 and associated 'greenhouse gases' in the atmosphere would raise world temperatures in a simple system - but the climate system is extremely complex and "... the link between carbon dioxide (and the other greenhouse gases) and climatic change is shot through with uncertainty" (Maddox 1988). There is also no doubt that climate can and will change although the direction, amount and rate can only be predicted by models, even the best of which have many uncertainties. Existing models do not take proper
6
R.W. GALLOWAY
account of such important parameters as changes in cloud type and amount, marine temperatures and circulation, marine biota and changes in aerosols (e.g. Manton 1989; Wigley 1989). A change in the way of handling clouds in the British Meteorological Office climate model, for example, has halved the temperature rise it predicts over the next few decades from 5°C to 2-3°C (Canberra Times 1 July 1989). If the greenhouse effect increases cloudiness, some very recent satellite measurements indicate that global temperatures could fall (Ramanathan et al. 1989). In considering the greenhouse question, several propositions need airing. 1. The greenhouse effect has not definitely arrived It is likely that the early Middle Ages were warmer than today, at least in northern Europe (Wigley et al. 1981), at a time when atmospheric concentrations of 'greenhouse' gases were far lower. Wine was then made in England. Although this has been possible again in recent decades, viticulture now benefits from modern plant breeding and cultivation techniques which have possibly widened the climate tolerance of vines. Cereals grew further north iTI Scandinavia and there was less sea ice in the northern Atlantic. There is no way of knowing whether the current upturn in world temperatures is a relatively minor, short term variation such as the temperature fall in the 1960s which raised fears of a return to conditions of the 'Little Ice Age' or if it is the start of a longer-term change. Is the current slight warming a natural reversion to the mild conditions of the early Middle Ages or is it indeed a greenhouse effect? As Kerr (1989b) has noted, the past century's warming is just consistent with the predictions made by models least sensitive to greenhouse gases; they are not consistent with the greater changes predicted by several other models. It is often stated that the present decade has been the warmest in the historical record with the explicit or implicit connotation that the warming is indeed a greenhouse effect. In this context, the term 'historical record' has caused confusion in the public mind. It refers to the instrumental record since the middle of the 19th century, not to the entire span of written history. Even the reality of the current warming is not entirely certain: a recent careful analysis of temperature and precipitation records over the last century in North America has failed to reveal a definite overall trend apart from a slight rise in autumn precipitation since ca 1970 (Hanson et al. 1989). Similarly, the reality, amount, and significance of recent and current sea level changes remain
uncertain (Bryant 1988). 2. Recent unusual seasons are not direct greenhouse effects The severe 1988 drought in the central U.SA. has been linked to a greenhouse effect in articles written by responsible journalists who presumably derived their ideas from interviews with scientists. Yet the drought is no more severe than the dust-bowl conditions which occurred more than half a century ago when the atmospheric content of greenhouse gases was substantially lower. It is a relief to have any link between the 1988 drought and the greenhouse effect authoritatively denied (Namias 1989). European ski resorts had a very poor snow season in the winter of 1988/89. It has been suggested that this is a greenhouse effect but there is no reason to believe that the mild season was anything other than a normal variation like the unusually cold winter experienced in western North America at the same time. Even the high rates of temperature rise predicted by global circulation models are unlikely to be detectable from one year to the next because of masking by normal variations. Consequently individual warm seasons should not be ascribed to greenhouse effects. 3. No causal link between Quaternary temperatures and carbon dioxide content of the atmosphere has been demonstrated Ice core evidence shows that atmospheric C0 2 was lower during glacial times than in the Holocene and the rise in C0 2 coincided with the post-glacial rise in temperature (Neftel et al. 1988). However, this relationship is not necessarily cause-and-effect in either direction. Bryson (pers. comm. November 1988) has pointed out that in North America the postglacial temperature rise preceded, rather than accompanied or followed, the increase of atmospheric C0 2 . Parker (1989) has stated that: "changes in atmospheric C0 2 concentrations accompanied or slightly lagged the glacialinterglacial periods, so they did not cause them." If it can be confirmed that the temperature rise preceded the C0 2 increase on the global scale, this would be a strong argument against a greenhouse effect. If the converse is demonstrated, i.e. that globally the temperature rise followed a C0 2 rise, this would be not inconsistent with a greenhouse effect. Webb (1988, p. 392) has pointed out that there is no evidence that the low concentration of C0 2 at 18 ka
GREENHOUSE OPPORTUNITIES AND PITFALLS BP had any influence on the vegetation or climate of North America. 4. Predicted rates of greenhouse temperature change are no greater than some past rates Current general circulation models predict rates of global greenhouse warming over the next half century between 0.04 and 0.1°C per year; such rates have been claimed as exceeding anything in the Quaternary record (Schneider 1989). This claim may be true on a world scale, but it is very dubious at a continental or regional scale. The occurrence of sudden climate changes in the Quaternary is now widely acknowledged (Berger & Labeyrie 1987). During the Late Pleistocene Allerod-Younger Dryas oscillation in Northwest Europe, vegetation in The Netherlands changed from tundra to forest to tundra and back to forest in less than 2 ka. During these events, the rates of temperature change must have at times been comparable to those predicted for a greenhouse earth especially since the rate of vegetation change usually lags behind the rate of climate change. 5. The Holocene record offers analogies for a greenhouse-warmed world This point has often been discussed (e.g. Bolin et al. 1986). While such warm intervals as the early Middle Ages or the post-glacial 'climatic optimum' are not exact analogues for a greenhouse-warmed earth by virtue of the different atmospheric C0 2 content and because important parameters such as the cloud cover cannot be known, they do offer many points of comparison and potential for testing the predictions of general circulation models. Evidence from such past warm intervals may also enable us to predict changes in biota likely to eventuate in a greenhousewarmed earth. However, there is some risk of circular argument here since the evidence for past warmth largely depends on the interpretation of biotic data such as pollen analysis. In view of the obvious relevance of Holocene palaeoclimate studies, the in data in Table 1 are thought-provoking. It might be said that the portion allotted to studies of the past is ludicrously small in view of their relevance but it could also be claimed that such research is remarkably cost-effective! Incidentally, in view of the potential significance for national and world economies, it is curious that such limited funds were allocated for research into the socio-economic implications.
7
Table 1 Research expenditure in 1989 related to greenhouse effects (Department of The Arts, Sport, Environment, Tourism and Territories, pers. comm.)
$M Atmospheric/climatic Oceanic Primary production Natural resources Geology/palaeoclimatology Socio-economic aspects
9.9 1.1 1.0 0.85 0.56 0.1
6. What can we do? Few of us are privileged to work at the cutting edge of studies directly related to the greenhouse effect. The excitement of analysing the gas content of ice cores, or attempting climatic modelling, are beyond the reach of most Quaternarists. However, not just the modellers but the whole body of environmental scientists, including Quaternarists, is likely to share the opprobrium if the greenhouse effect does not eventuate. In this situation there are several important things we can do. Firstly, as informed nembers of the public we can closely question greenhouse pronouncements in seminars, conferences or the press. The role of informed sceptic is important in most scientific endeavours, especially one where the public is so interested, where the policy implications are so immense and where the reputation of environmental sciences are so much at risk. Secondly, we can help to formulate 'downstream scenarios' outlining the implications of the initial scenarios provided by the climate modellers and perhaps considering some they have not provided. For instance, how would the vegetation of northern Australia be affected by increased precipitation? At what rate would such changes take effect? How would the pastoral industry be affected? Henderson-Sellers and Blong (1989) have discussed some of these issues but only in the context of a greenhouse warming. The implications of other climate scenarios also need to be set out. The validity of such secondary predictions, of course, ultimately depends on the initial climatic scenario but is rendered more secure by knowledge of the effects of past climate changes derived from studies of the Quaternary. We should seek analogues for climatically different environments not only temporally (i.e. from the Quaternary record) but also spatially. A simple example is found in the Snowy Mountains: if a modest
8
R.W. GALLOWAY
greenhouse warming of 2°C occurs, Perisher ski resort will have a much shorter and less reliable snow season resembling that which now prevails at Mt Selwyn (Galloway 1988). This simple comparison brings home the direct implications for the economics of skiing. Indirect effects extend to wider issues such as the economics of the proposed Very Fast Train and land values and ownership in the surrounding region. Thirdly, there are aspects of Quaternary researches in Australia which could provide valuable evidence on the greenhouse question. Although substantial work has been carried out on the Holocene record (see Thom & Wasson 1982), it is perhaps fair to say that the more exciting Pleistocene has attracted most attention. The Holocene has often been regarded as a time when the Australian climate was not significantly different from that of today. However, even modest differences may turn out to be important in understanding and predicting greenhouse effects. If Australian Quaternary studies are to achieve their full impact in relation to the greenhouse problem more attention needs to be devoted to the Holocene. Many Quaternary researches relevant to the greenhouse problem can be envisaged. Perhaps the most fundamental is to test whether world temperature changes preceded or followed the changes in atmospheric C0 2 revealed by ice core studies. This would involve studying closely-dated sequences of marine and lacustrine sediments and detailed pollen analyses of suitable peats. Such an investigation uses the Quaternary record as a test of C0 2 control of temperatures and not just as a source of analogues for a greenhouse-warmed world. As part of this investigation it would be of great interest to determine whether the late-glacial Younger Dryas-Allerod oscillation occurred in our hemisphere; to date the evidence is inconclusive. The obvious place to investigate is the sub-antarctic islands which lie in similar latitudes to northern Europe where the Allerod oscillation is best known. If the oscillation did occur in our hemisphere, the rapid global temperature switches implied would be very difficult to reconcile with any C0 2 -led climatic effect. Effective palaeoclimatic reconstructions for the Holocene require the best possible dating. Studies of coral growth features, tree rings and closely dated pollen records, as well as radiometric and thermoluminescence dating, have great potential for enabling Holocene conditions to be studied in increasing detail and are well developed in Australia (e.g. Ogden 1978; Isedale 1984; Green et al. 1988).
One of the most frequently-cited effects of a greenhouse warming is a rise in sea level due to thermal expansion of the oceans. Evidence for slightly higher Holocene sea levels, if correlated in time with Holocene warmer intervals, would support such a greenhouse effect; finding it would be an important task for Quaternary studies in this country. However, the results would not be incontrovertible since relative sea level could be substantially affected by tectonism (Belperio 1989), by atmospheric conditions (Bryant 1988) and by the release of land ice from Antarctica and Greenland which is affected by climate and sea level over preceding millennia. The short historic record of extreme weather events such as floods, droughts and cyclones, makes it difficult to estimate their return intervals but this information is needed to evaluate the potential impact on them of greenhouse climate changes. Consequently, any evidence from the Quaternary record that bears on the frequency of extreme events (e.g. Chappel et al. 1983) is potentially relevant.
CONCLUSIONS The greenhouse question offers both opportunities and risks to the Quaternary sciences. In order to avoid a catastrophic loss of credibility, the uncertainties surrounding even the possibility of a significant greenhouse warming in the near future must be constantly stressed and evidence against, it as well as analogues, sought in the Quaternary record. Stressing the uncertainties will not be popular with our potential clients who, naturally, seek definite forecasts on which to base their investment decisions; nor will it be popular with some scientists who, also naturally, wish to be as definitive as possible. It is nevertheless incumbent on scientists to point out the uncertainties of the greenhouse effect as well as its implications. The uncertainties are no reason for not attempting to understand and predict climatic change. A pessimist might say that we will never know what the climate is going to do until it has done it but such a negative attitude is to be deplored. Very important issues are involved in greenhouse studies and we must do our best to illuminate them. Study of the Quaternary and in particular the Holocene, can provide relevant ideas, tests and concepts. Australia, as the most scientifically advanced country in the southern hemisphere with a field of interest extending from the equator to the pole, can play a particularly important role.
REFERENCES
GREENHOUSE OPPORTUNITIES AND PITFALLS 9
ALEXANDER T . 1974. Ominous changes in the world's weather. Fortune, February 1974, 90-95, 142, 146, 150, 152. AUSTRALIAN ACADEMY OF SCIENCE. 1976. Report of a Committee
on Climatic Change. Report No. 21. BELPERIO T. 1989. The Greenhouse debate and rising sea-levels. Search 20, 48-50. BERGER W . H . & LABEYRIE L.D. eds. 1987. Abrupt Climatic Change: Evidence and Implications. Proceedings NATO Advanced Research Workshop, St Hugues de Biviers, October 1985. BOLIN B., DOOS B., JAGER J. & WARRICK R. eds. 1986. The
Greenhouse Effect, Climatic Change and Ecosystems. SCOPE 29. John Wiley, Chichester.
BRYANT E. 1988. Sea-level variability and its impact within the greenhouse scenario. In PEARMAN G.I. ed. Greenhouse:
Planningfor Climate Change, pp. 135-146. CSIRO, Melbourne. BRYSON RA. 1973. Drought in Sahelia, who or what is to blame? The Ecologist 3, 366-371. CHAPPELL J., CHIVAS A., WALLENSKY E., POLACH H A . & AHARON
P. 1983. Holocene palaeo-environmental changes, central to north Great Barrier Reef inner zone. BMR Journal of Australian Geology and Geophysics 8, 223-235. GALLOWAY R . W . 1988. The potential impact of climate changes on Australian ski fields. In Pearman G.I. ed. Greenhouse: Planning for Climate Change, pp.428-437. C S I R O , Melbourne. GREEN D., SINGH G., POLACH H., MOSS D., BANKS J. & GEISSLER
EA. 1988. A fine resolution palaeoecology and palaeoclimatology from south-eastern Australia. Journal of Ecology 76, 790-806. HANSON K., MAUL GA. & KARL T . R . 1989. Are atmospheric "greenhouse" effects apparent in the climatic record of the contiguous U.S. (1895-1987)? Geophysical Research Letters 16, 49-52. HENDERSON-SELLERS A . & BLONG R. 1989. The Greenhouse Effect.
University of New South Wales Press, Sydney.
ISEDALE P. 1984. Fluorescent bands in massive corals record centuries of coastal rainfall. Nature 310, 578-579.
KERR RA. 1989a. Hansen vs the world on greenhouse threat.
Science 244, 1041-1043.
KERR RA. 1989b. The global warming is real. Science 244, 603. LAMB H . H . 1974. Is the earth's climate changing? The Ecologist
4,10-15.
MADDOX J. 1988. Jumping the greenhouse gun. Nature 334, 9. MANTON M J . 1989. Uncertainties in climate change research.
Search 20, 46-48.
NAMIAS J. 1989. Cold waters and hot summers. Nature 338, 15-
16.
NEFTEL A., OESCHAGER H., STAFFELBACH T. & STAUFFER B. 1988. C0 2 record in the Byrd ice core 50 000-5000 years BP. Nature 331, 609-611. OGDEN J. 1978. On the dendrochronological potential of
Australian trees. Australian Journal of Ecology 3, 339-356.
PARKER D.E. 1989. Observed climatic change and the greenhouse
effect. Meteorological Magazine 118, 128-131. PrrrocK A.B. & PEARMAN G.I. 1989. Too late for certainty. Search 20, 50-51. RAMANATHAN V., CESS R.D., HARRISON E.F., MINNIS P., BARKSTROM B.R., AHMAD E. & HARTMANN D. 1989. Cloud-
radiative forcing and climate: results from the Earth Radiation Budget Experiment. Science 243, 57-63. SCHNEIDER S.H. 1989. The greenhouse effect: science and policy. Science 243, 771-781. THOM B.G. & WASSON R 1982. Holocene Research in Australia 1978-1982. Occasional Paper 33. Department of Geography, Faculty of Military Studies, University of New South Wales, Royal Military College. WEBB T. 1988. Eastern North America. In Huntley B. & Webb T. eds. Vegetation History, pp. 385-414, Kluwer Acadamic Publishers, Dordrecht. WIGLEY T.M.L. 1989. Possible climate change due to SO 2-derived cloud condensation nuclei. Nature 339, 365-367. WIGLEY T.M.L. Ingram M.J. & Farmer G. 1981. Climate and History. Cambridge. Cambridge University Press. WOOD F.B. 1988. Global Alpine glacier trends, 1960s to 1980s. Arctic and Alpine Research 20, 404-413.
Geological Society of Australia Symposium Proceedings (1990) 1, 11-20.
Quaternaiy vegetation and the future of the forests A.P. Kershaw and PA. Gell Department of Geography & Environmental Science, Monash University; Clayton, VIC 3168, Australia. This paper examines the value of studies in vegetation history for forest management. Pollen analysis has demonstrated the decline of forests and environmental consequences of forest destruction in traditional areas of study but little information is available on the response of forests to environmental change and disturbance in those parts of the world presently experiencing substantial forest exploitation. The situation is examined in one of these areas, Australia, where some historical data are available. Using two case studies, it is demonstrated that pollen analysis of sediments at different temporal scales of resolution can provide important information on the dynamics of vegetation and environmental change which can contribute substantially to the development of forest management strategies. However, attitudes of land-use decision makers indicate that there is a long way to go before the real value of the historical approach is appreciated. Key words: vegetation history, rainforests, Australia, conservation, vegetation dynamics, pollen analysis.
INTRODUCTION The Quaternary period is characterised by periodic fluctuations in climate and by the evolution and rise to dominance of modern people. Both have had a dramatic effect on all components of the environment and especially the vegetation cover. Communities have expanded, contracted and been reformulated while species have undergone significant evolution and extinction. The changing vegetation cover, in turn, has been an important factor in the determination of human population patterns and activities. Vegetation is a sensitive indicator of total environmental conditions, and studies of past vegetation have played an important part in the reconstuction of Quaternary environments. Information on past vegetation and environments can be derived from the living and fossilized remains of various plant parts. These include analyses of variation in the growth increments of living and dead trees and examination of microscopic and macroscopic materials preserved in sites of sediment accumulation. By far the greatest amount of such information has been gained from the quantitative analysis of resistant pollen grains and fern spores. There is general agreement that the most significant impact of modern people on natural ecosystems has occurred with the expansion of agriculture. This is nowhere more obvious than in forested areas. In contrast, it is often assumed that natural forest ecosystems are not significantly modified when managed for timber production. Foresters have been
seen as the guardians of the forests, protecting them against destruction from more intensive land uses. However, as the area of forest is reduced, and greater demands are made on timber resources, the impact of intensive forest management practices is increasingly being scrutinised. In response to such scrutiny, the official forestry position is generally that logging has no significant long term effects, a position which often leads to conflict with land managers and other interested groups who adopt the opposite position. An illustration of such a conflict in Australia was provided recently in the court case Jarasius v. Forestry involving intensive forestry operations in southeastern New South Wales (Boer 1988). Here the court rejected the New South Wales Forestry Commission's position that there would be no adverse long term effects of logging in some high altitude forests and considered that existing management practices did not guarantee the maintenance of forest diversity and integrity. A similar claim is being made by foresters about selective logging in northeast Queensland. The acceptance of the area nominated as the wet tropics by the Government of Australia for inclusion in the World Heritage List (Department of Arts, Heritage and Environment 1986) is threatened because of the desire of the Queensland Government to continue logging in these forests. With these forestry practices, it is very difficult to demonstrate whether or not there will be substantial long term effects on the ecosystems. Short term impact is inevitable but, because of the longevity of trees and the length of time required for ecosystem
12
A.P.KERSHAW AND PA.GELL
recovery, present day monitoring of such systems is insufficient to allow prediction of the eventual outcome. It is important, therefore, to undertake studies on vegetation history to provide a long term perspective on forest dynamics and to provide a potentially powerful additional tool for the generation of appropriate management practices. Specifically, these studies can provide information on the likely nature and rate of response of certain components of the forest system to disturbances and on the relative resilience of different systems to disturbance. They can also provide comparisons between the impacts of people and climate change on forests and allow prediction of the long term consequences of human-induced climatic change.
FORESTS Forested areas are ideal for studies of Quaternary vegetation and environments, particularly in relation to the impact of people. They contain the most suitable and abundant sites for analysis such as swamps and permanent lakes as well as being the centres of development and concentration of interest and expertise in vegetation history. A great deal has been learned about the nature, causes and effects of deforestation and forest disturbance in the traditional areas of pollen analytical research in Europe. People have been responsible for forest destruction over many thousands of years and many features of the landscape, including extensive areas of blanket peats, heath and grassland, can be attributed to their activities (Pennington 1969). In other areas, there is evidence of increased salinity and desertification through the removal of trees (Goudie 1986). In those parts of the world where forests are presently being exploited on a massive scale, however, there is often little palaeoecological information available to assist in understanding either the present status of the vegetation or to help determine the consequences of these actions. This is of particular concern in the humid tropics where forest is being cleared at an alarming rate. It is claimed that between 7.6 and 10 million hectares of lowland rainforest are being cut down annually and a further 10 million hectares grossly disrupted each year (World Commision on Environment and Development 1987). The rate of exploitation is accelerating, and it is considered that most forests, together with the species they contain, will disappear by the end of the century (Brown 1981;
Council on Environmental Quality and U.S. Department of State 1980). Even forests subject to less drastic disturbance such as selective logging are insufficiently well-known to determine the possible consequences of these actions on long term forest survival. Importantly, destruction and alteration are taking place so quickly that it is not feasible to wait for the results of monitoring of impact to generate appropriate management. Thus, any information that can be gained from the fossil record will be extremely valuable especially where vegetation dynamics can be related to human disturbance.
AUSTRALIAN FORESTS In Australia there are serious threats to the forests because of their replacement by agriculture, the desire to attain self-sufficiency in suitable timber, and the pressure to supply the overseas demand for woodchips and pulp. The area of forest has been reduced since European settlement from about 10% to 5% of the country (Department of Arts, Heritage and Environment 1986) and much of the remainder is being used for the production of timber products. However, because Australia is economically more advanced than the majority of exploited nations and has a low population density and effective conservation movements, the chances of maintaining at least representative samples of forest are relatively high. The forests can be divided into closed rainforests that can be floristically very diverse, and open sclerophyll forests dominated mainly by eucalypt species. Rainforest occurs only as small, isolated patches, covering less than one percent of the continent and representing only 0.02% of the world total (Werren & Allworth 1982). Nevertheless, these small remnants encompass types ranging from tropical lowland in northeastern Queensland to cool temperate in southeastern Australia and Tasmania (Fig. 1). As many of these types are more extensive and under even greater threat in less developed parts of the world, studies on Australian rainforests can provide many of the baseline data necessary for the understanding and rational management of these forests on a more global scale. In fact, it could be argued that Australia has a responsibility to do this. Rainforest patches are surrounded by extensive open sclerophyll forests which, in contrast to the rainforests, are distinctively Australian. The communities making up these forests are adapted to survival of specific fire regimes and fire is an essential
QUATERNARY AND THE FUTURE OF THE FORESTS
146°E
152°E 12°S-
Rainforest patches Sclerophyll forests Atherton 18°S Tableland
Townsville
24°S"
30°S-
Sydney
36°SErrinundra Plateau
Hobart
0
250
500
750
13
component of sclerophyll forest management. Fire also plays a major role in determining the location and nature of the boundary between sclerophyll vegetation and fire-sensitive rainforest. Traditionally, selective removal of desirable trees has been the major form of timber harvesting in Australian forests and still remains the predominant management strategy in rainforests. Most accessible rainforests outside National Parks have now been selectively logged and the timber supply from these sources is dwindling. Logging of rainforest in New South Wales has effectively ceased but in Queensland it is intended to maintain logging, although at lower levels, on a sustainable yield basis (Queensland Department of Forestry 1983). In response to increased wood demand and the 'degraded' nature of the forests through selective logging, the major timber harvesting practice in sclerophyll forests now involves effective clearfelling of sizeable coups (50-200 ha) with subsequent full forest regeneration. Timber unsuitable for sawn timber is increasingly used for woodchips and pulp (Kirkpatrick & Bowman 1982). Regeneration is accomplished from a few remaining seed trees supplemented, where necessary, by aerial seeding or planted seedlings. Remaining fuel left behind is burnt to facilitate germination and seedling growth. Although the method is based primarily on results of research on a limited number of eucalypt species within wetter, even-aged forests, it is widely applied to a wide range of eucalypt-dominated forests today (Kirkpatrick & Bowman 1982). Wildfire is a major threat to regenerating forests and controlled burns are used to reduce accumulated fuel in these and adjacent forests. In the short term both selective logging and clearfelling have obvious impact on all components of the ecosystem. The long term concern is whether these practices impose disturbances of a sufficiently different kind, intensity or frequency to those operating under natural conditions to bring about irreversible and undesirable changes in the nature of the forests.
1000
Kilometres
Fig. 1 Distribution of rainforests and sclerophyll forests in eastern Australia and location of case study areas.
FOREST HISTORY Background information on past long term changes and stability in Australian forests has been provided by pollen analysis of a number of sites within eastern Australia (Kershaw 1981; Walker & Singh 1981). These demonstrate that the distribution and composi-
14
A.P.KERSHAW AND PA.GELL
tion of forests have changed dramatically over the last few hundred thousand years. The present forest cover became established about 10 ka ago in response to climatic amelioration after the last dry glacial period. Through most of the last 10 ka there have been periods of relative stability punctuated by significant, climatically-induced changes every 2 ka to 3 ka (Kershaw 1984). The most marked changes occurred within the last 200 years, the result of the activities of European settlers. Fire, as deduced from charcoal contained within the sediment samples, has been a continuously operating component of the environment through this period and the identification of high burning levels in association with human or climatically controlled vegetation changes is a feature of many pollen diagrams (Kershaw 1984). These studies show that variability and change are characteristic features of Australian forests and provide a yardstick against which the present status of communities and future changes can be evaluated. More specific implications for forest management can be derived from an examination of specific case studies undertaken within areas of utilization/conservation conflict; these are now considered.
THE ATHERTON TABLELAND The Atherton Tableland lies within the largest and most complex area of rainforest in Australia (Fig. 1). Both economic and conservation values are extremely high and the area has been a focus of major land-use conflicts for many years. To date, about 28% of the rainforest within the region has been cleared, mainly for agriculture (Winter et al. 1984), while much of the remainder has been selectively logged. There is pressure from the local timber industry and the State Government to continue logging on a sustained yield basis. The rainforest possesses a number of intrinsic values. These include a wide variety of community types that are representative of vegetation which, in the geological past, covered much of the continent, and a large number of species of evolutionary and potential economic importance. The conservation significance of the area has been acknowledged by the nomination of a large proportion of it for inclusion on the World Heritage List, as previously mentioned. The State Government, however, still regards timber harvesting and maintenance of other forest values as compatible and draws upon information derived from limited monitoring of rainforest plots (Queensland Department of Forestry 1983) to support its views.
The Atherton Tableland contains several records of Quaternary vegetation and environments. One of the longest is from Lynch's Crater and part of this record, covers the last glacial/interglacial cycle (Kershaw 1978) (Fig. 2a.). High percentages of pollen from rainforest angiosperms are interpreted as indicating the dominance in the area of complex rainforest, similar to that of today, existing under high precipitation. By contrast, abundant pollen of sclerophyll taxa and rainforest gymnosperms, representative of sclerophyll woodland and 'drier' rainforest respectively, reflect times of relatively low rainfall. The last interglacial period, from about 123 ka to 79 ka BP and the present interglacial (the Holocene) were wet whereas the intervening glacial period was much drier. Superimposed on this pattern are major sustained changes in the vegetation. During the latter part of the glacial period, drier rainforests were replaced almost entirely by sclerophyll vegetation, and are still restricted to very small, isolated patches in the present landscape. It is considered that an increase in burning was responsible for the destruction of these fire-sensitive forests and this interpretation is supported by a contemporaneous increase in charcoal particles in the core. Furthermore, an anthropogenic cause is invoked on the grounds that Aboriginal people are known to have been present in Australia by this time and no similar high burning levels or expansion of fire-promoting sclerophyll vegetation are noted from the previous dry glacial period (Kershaw 1986). There are a number of features of this record relevant to management of rainforest. In the first place, the data demonstrate that rainforest, despite its high degree of floristic and structural complexity, is able to respond to the levels of disturbance imposed by Quaternary climatic changes. This is contrary to the traditional view of geographical and ecological stability in this kind of system (Walker 1986). Furthermore, many rainforest elements must possess the ability to survive in very restricted refugia during unfavourable conditions, such as the last glacial period, and to expand rapidly when the climate becomes favourable. The sharp changes noted at climatically induced boundaries suggest that readjustment of the vegetation to new conditions is accomplished in a relatively short period of time, perhaps hundreds rather than thousands of years. Although rainforest demonstrates a high degree of adaptibility it is necessary to ensure that a sufficient variety of environments, and in particular refugia, is available to cater for the changing distributions of communities in response to variable climatic conditions.
QUATERNARY AND THE FUTURE OF THE FORESTS
50
75 100
200 400 600
RAINFOREST GYMNOSPERMS RAINFOREST ANGIOSPERMS SCLEROPHYLL TAXA
0
25
ESTIMATED TIME SCALE (MILLIONS OF YEARS BEFORE PRESENT)
0
EXAGGERATION x10
CHARCOAL PARTICLES per cm3 (1 000's)
0 10
b. RAINFOREST GYMNOSPERMS RAINFOREST ANGIOSPERMS SCLEROPHYLL TAXA
ESTIMATED TIME SCALE (THOUSANDS OF YEARS BEFORE PRESENT)
a.
15
0
25
50
75 100
123
26 38
116-
86'
50 63
7963-
79 86
5038-
116
2610-
123 I 0
1 25
1 50
1 1 75 100
I 1 1 1 0 200 400 600
/o
0
25
50 /o
75 100
ARRIVAL OF MAN (homo-erectus approx.1.5 million years ago)
Fig. 2 Summaries of the pollen diagram from Lynch's Crater a. after Kershaw (1978), b. after Queensland Forestry Department.
Although capable of surviving substantial climatic changes, drier communities have shown an inability to cope with increased disturbance associated with higher burning levels during the last glacial period. The failure of remnant patches to respond to increasing precipitation at the beginning of the Holo-
cene is probably due to the nature of the surrounding sclerophyll vegetation. Once established, sclerophyll forest promotes fire and even in the absence of humans, fire is probably capable of maintaining the advantage of sclerophyll over rainforest in all but the very wettest areas. The continuing survival of those
16 A.P.KERSHAW AND PA.GELL drier rainforest patches which are not in fireOne general area of concern is the likely effect protected situations depends on the application of on the forests of a suggested increase in temperature appropriate fire regimes in surrounding sclerophyll as a result of the increasing concentration of vegetation to prevent fire entering them. 'greenhouse' gases in the atmosphere (Pearman The Lynch's Crater record, although providing 1988). Prediction of vegetation changes under these some basis for assessment of the performance of conditions is difficult: it depends not only on the rainforest in the long term, is too coarse to provide ability of individual plants and communities to the detailed ecological information on the dynamics of withstand or migrate in response to rapidly rising individual taxa or even communities that will allow temperatures but also their response to other climatic prediction of vegetation responses to short term changes that will result from the temperature disturbances such as selected logging. Here, the fine increase. One method of predicting vegetation and resolution pollen studies of Professor Walker and climatic changes is the use of past analogues. associates at the Australian National University will Recently the Commonwealth Scientific and Industrial be important. Their aim is to examine the dynamics Research Organisation (C.S.I.R.O.) has devised for of selected components of rainforest from very close Australia a bioclimatic prediction model that allows sampling intervals within lake sediments. The spatial the determination of present day climatic ranges for and temporal scales of analysis are comparable with any organism or community type. Using the rainforest those used in monitoring living vegetation stands but data set of Webb et al. (1984), it has been possible to the records can extend over a much longer period of make palaeoclimatic estimates from pollen astime. Although these studies are still at an early stage, semblages of different ages on the Atherton Tableone example illustrates the potential of this line of land (Kershaw & Nix 1988). It is found that the investigation. period 5 ka to 3.6 ka BP, when temperatures were at Chen (1988) investigated the nature of population least 2 C higher than those of today, provides a good expansion in selected trees from their pollen contri- greenhouse analogue (De Deckker et al. 1988). butions to sediments in Lake Barrine, only a few During this period, there was not only an altitudinal kilometres from Lynch's Crater. It is evident that rise in lowland rainforest, but also rainforest as a most taxa expanded in an exponential manner (Fig. whole had a wider distribution. This appears to have 3), suggesting little intraspecific competition until a carrying capacity was reached. Chen suggests that this lack of competition can be explained by species patterning in rainforest where individuals do not tend to establish close to parent plants. On the other hand the logistic growth curves of some taxa such as Blepharocarya, Elaeocarpus and Macaranga/Mallotus (2) are best explained by self-thinning effects when populations reach a certain size. Self-thinning implies a tendency towards single species dominance, a feature that is rare in tropical rainforest. The fact that these taxa increase relatively late in the Holocene could indicate increased forest disturbance and the creation of a major sustained change in forest composition. Certainly Blepharocarya and Macaranga/Mallotus were not as prevalent in earlier interglacial phases when it was unlikely that there was any human disturbance. The different times of arrival of tree taxa around the site and different rates of population increase provide valuable information on migration ability and growth rates respectively. These characteristics will clearly be important in prediction of likely regeneration patterns and forest composition after clearfelling and in the calculation of optimum selective logging Fig. 3 Population growth curves for selected rainforest taxa intervals for individual species. 0
Agathis
Podocarpus (1)
4900
5100
Podocarpus (2)
3400 3600 3800
Years after 10,000 BP
' 2.0-
Rapanea
Eugenia
1.5-
4400
4800
3500
3700
Years after 10,000 BP
Macarang^Mallotus 2.0-y J
3300
(1) Moraceae/Urlicaceae 3.0->
3500
Years after 10,000 BP
Blepharocarya
Macaranga/Mallotus (2)
Elaeocarpus
§0.6-
5100 5300 Years after 10,000 BP
4100 4300 4500
derived from Lake Barrine Pollen data (after Chen 1988).
QUATERNARY AND THE FUTURE OF THE FORESTS been caused mainly by an increase in precipitation during the summer wet season (Kershaw & Nix 1988). There is no indication of an increase in precipitation during the dry season and consequently the seasonal precipitation range would have been higher. This prediction of higher rainfall during the wet season has major implications, not only for the vegetation but also for the hydrology of the region. It is likely that any forest disturbance under a changed climate as a result of greenhouse will result in greater soil instability and increased runoff, exacerbating problems of flooding and siltation in low lying coastal areas.
17
when stranded by low water levels (Orchard 1986) while Sphagnum may only spore profusely when under stress. These increases are considered to relate to changes in water yield or quality within the catchment resulting from the intensive forestry operations that have taken place within the last 20 years. These findings provide the first evidence of the magnitude of the effect of logging on catchment hydrology relative to those of climatic change documented through the Holocene. They challenge the claim of negligible impact in the long term of current clearfelling practices based on extrapolation of short term contemporary studies (Department of Conservation, Forests and Lands 1988).
EAST GIPPSLAND A fine resolution study from a Delegate River swamp on the Errinundra Plateau of East Gippsland (Fig. 1) provides a clear indication of the effects of forest disturbance on catchment hydrology. The Delegate River catchment lies predominantly within sclerophyll forest although the presence of some rainforest elements suggests that rainforest could attain a wider distribution in the absence of fire. A history covering the last 12 ka or so has been reconstructed by Ladd (1979) and shows that the vegetation has been relatively stable through much of this period. Selected features of two fine resolution pollen diagrams, dated by radiocarbon and lead-210, and covering only the latter part of the Holocene, are considered here (Fig. 4). Within the oldest phase, considered to represent conditions prior to the arrival of European people, there are fairly consistent percentages for grasses (Poaceae) and charcoal. This suggests that the vegetation was relatively stable under relatively constant burning levels. During phase 2, which probably equates with the early part of European occupation, forest disturbance as a result of gold mining, minor agriculture and bush burning is indicated by increased levels of grasses and charcoal. There are changes in the proportions of other pollen taxa but insufficient information is available to determine whether or not there were any major sustained changes in forest composition. A policy of fire exclusion introduced after the 1939 fires is indicated by reduced charcoal levels which had the effect of some replacement of the grassy understorey by sclerophyll shrubs. The most marked features of the diagrams are the massive increases in representation of the aquatic plants, Myriophyllum in one diagram and Sphagnum in the other, dated to about 1965. While little is known about the ecology of these plants it has been suggested that Myriophyllum flowers only
HOW WELL ARE THE LESSONS LEARNED? It is clear from the case studies outlined that a great deal can be learned about the nature of present day vegetation from a knowledge of its history, and that this can be applied to the prediction of changes resulting from climatic change and management practices. One question which arises is how is this information received and used by landuse decision makers? In other words, how well are the lessons learned? In both areas described, some attention has been paid to the results of the studies but the full potential value of this historical approach has yet to be explored. The Lynch's Crater diagram featured in a Queensland Department of Forestry promotion brochure but the information was used selectively in an attempt to support the Department's logging activities, rather than as background to formulation of comprehensive management strategies. The brochure implies that, because there is the same amount of forest now as there has been at times in the past and it has the capacity to expand aggressively when environmental conditions are suitable, additional disturbances such as selective logging will have either no effect or are a positive influence on forest diversity. However, no attention is given to the fact that rainforest is made up of a variety of types that may respond differently to disturbance. Certainly the 'drier' forest types could not cope with the additional firing pressure exerted during the last glacial period, most likely the first human impact. Even amongst the wetter forest types, some, particularly the cyclone scrubs, are probably better adapted to regular disturbance than others. Nor is it acknowledged by the Department that rainforest is not as extensive now as
18
A.P.KERSHAW AND PA.GELL
0
1965" 46
-19391885-
1 unit = 5%
10
Phase 4 Phase 3 Phase 2
Phase 1 Sphagnum
Inferred dates A.D.
2iopb date B.P.
date B.P.
Poaceae
SUA 2426 660 70
5
I—I—I
Charcoal/Eucalyptus pollen concentration ratio 01 2i 4i 6i 8i 10i 1214 16 18 20 22 24 26 28 30 Depth (cm) i I l 1 1 I I I I I
1985
1 unit = 5%
0
Phase 3 Phase 2
Phase 1
No Data
Myriophyllum
Poaceae
Charcoal/Eucalyptus Pollen Concentration ratio (x 10) Depth (cm)
ziopb date B.P.
1«C date B.P.
Inferred dates A.D.
Wk-958 2840 150
12 16 20 24 28 32 36 40 44 48
1885"
8
50 "1939-
Phase 4
4
20
1985"1965 ~
Fig. 4 Selected attributes of two fine resolution pollen diagrams from Delegate River Swamp, Errinundra Plateau.
it was between 123 ka and 116 ka ago, which was the last time that temperature and precipitation achieved comparable levels to those of today. More serious are the errors in the pollen diagram as presented in the brochure and reproduced here (Fig. 2b). These errors include stratigraphic inversion of the diagram, incor-
rect placement of dates on zone boundaries, the invention of an additional zone boundary to accommodate the youngest date, the timescale given in millions rather than thousands of years, and a purely hypothetical date for the arrival of people. The indication that people arrived at the time of maximum
QUATERNARY AND THE FUTURE OF THE FORESTS 19 rainforest expansion is certainly much more Clearly, there is a need to work more closely with convenient for their argument than the originally those involved in applied forest research and proposed date of 38 ka BP (50 Ma BP on their dia- management and to present the results of Quaternary gram) that coincides with the beginning of a major investigations in the most relevant and digestible reduction in the distribution of rainforest. This is fashion. This may help to overcome the resistance of surely deliberate misrepresentation of the data. decision makers and to ensure that the maximum The results of the East Gippsland study were information is made available for long term submitted to the Land Conservation Council of Vic- environmental prediction and planning. toria and to relevant State Government ministers to assist in their deliberations over the future of the East Gippsland forests. In response the Department of ACKNOWLEDGEMENTS Conservation, Forests and Lands undertook an evaluation of the study. The results from this were con- We thank Dr John Dodson, Dr Peter Hunt and sidered to bring into question the dating of the pollen Professor Jamie Kirkpatrick for very valuable comsequences and the role of logging in the production of ments on drafts of this paper, and Garry Swinton for the environmental changes. However, no support was drawing the text figures. forthcoming for further research which could have clarified the issue, and the attitude of the Department of Conservation, Forests and Lands to proposals to REFERENCES undertake further independent reseach has been less than enthusiastic. Logging continues in the catchment. BOER B. 1988. Forestry Commission brought to heel. Environmental and Planning Law Journal 5, 165-172. Political considerations appear to have interfered with BROWN NJ. 1981. Environment in the 80s: global challenges and the need to investigate the nature of the changes responsibilities. Alternatives 10, 7-12. attributed to logging practices. CHEN Y. 1988. Early Holocene population expansion of some rainforest trees at Lake Barrine basin, Queensland. Australian
CONCLUSIONS The present composition and distribution of forests is a product of evolutionary and environmental changes that have taken place over a long period of time. The Quaternary, being the most recent geological period and characterised by dramatic fluctuations in climate together with disturbances imposed by human activity, is of greatest relevance to the understanding of present day patterns and the prediction of future changes. The forests of Australia result from adjustments to Quaternary climatic oscillations and human pressures. Examples described illustrate the kinds of changes that have taken place and how these may assist in the formulation of future management strategies. The approach is relevant both to Australia and to other parts of the world where there is intensive pressure on the forests and a lack of resources and expertise to undertake the necessary research. Despite the obvious importance of the historical approach, there is a reluctance on the part of planners and managers to take full account of its implications. This is perhaps partly due to a lack of appreciation or concern for timescales greater than those that dominate political processes and consequently support for such reseach is limited.
Journal of Ecology 13, 225-233. COUNCIL ON ENVIRONMENTAL QUALITY AND U.S. DEPARTMENT OF STATE. 1980. The Global 2000 Report to the President: Entering
the Twenty-first Century; the Technical Report Volume 2. U.S. Government Printing Office, Washington D.C.
D E DECKKER P., KERSHAW A.P. & WILLIAMS MA.J. 1988. Past
environmental analogues. In Pearman G.I. ed. Greenhouse:
Planning for Climate Change, pp 473-488. CSIRO, Melbourne. DEPARTMENT OF ARTS, HERITAGE AND ENVIRONMENT. 1986. State of the Environment in Australia. Australian Government Publishing Service. Canberra.
DEPARTMENT OF CONSERVATION, FORESTS AND LANDS. 1988.
Environmental effects statement. Melbourne.
GOUDIE A . 1986. The Human Impact on the Natural Environment.
2nd ed. Blackwell. Oxford.
KERSHAW A.P. 1978. Record of last glacial-interglacial cycle from
northeastern Queensland. Nature 272, 159-161.
KERSHAW A.P. 1981. Quaternary vegetation and environments. In
Keast, A. ed. Ecological Biogeography in Australia, pp. 81-101. Dr. Junk, The Hague. KERSHAW A.P. 1984. Some applications of studies on vegetation and fire history to forest management. In Ealey, E.H.M. ed. Fighting Fire with Fire, pp. 55-69. Graduate School of Environmental Science, Monash University, Melbourne. KERSHAW A.P. 1986. Climatic change and Aboriginal burning in northeastern Queenland during the last two glacial/interglacial cycles. Nature 322, 47-49. KERSHAW A.P. & Nix HA. 1988. Quantitative palaeoclimatic estimates from pollen data using bioclimatic profiles of extant taxa. Journal of Biogeography 15, 589-602. KIRKPATRICK J.B. & BOWMAN D.M.J.S. 1982. Clearfelling versus selective logging in uneven-aged eucalypt forest. Search 13, 136-141. LADD P.G. 1979. Past and present vegetation on the Delegate River in the highlands of eastern Victoria, II. Vegetation and climatic history from 12,000 B.P. to the present. Australian
20
A.P.KERSHAW AND PA.GELL
framework of Australian rainforests. Australian Journal of Journal of Botany 27,185-202. Ecology 9, 169-198. ORCHARD A.E. 1986. Myriophyllum (Haloragaceae) in Australasia. WERREN G.L. & ALLWORTH D. 1982. Australian Rainforests: A II. The Australian species. Brunonia 8, 173-291. Review. Monash Publications in Geography, No. 28. PEARMAN G.I. 1988. ed. Greenhouse: Planning for Climate Change. C.S.I.R.O. Melbourne.
Department of Geography, Monash University. Melbourne.
PENNINGTON W. 1969. The History of the British Vegetation. English WINTER J.W., BELL F.C., PAHL L.I. & ATHERTON R.G. 1984. T h e
distribution of rainforest in northeastern Queensland. In University Press, London. Werren, G.L. & Kershaw, A.P. eds. Australian Rainforest Study Vol. 3. Proceedings of a workshop on the past, present and in North Queensland. Queensland Department of Forestry, future of Australian rainforests, Griffith University, Brisbane, Brisbane. 1983. Report to the World Wildlife Fund, Australia (Project WALKER D. 1986. Tropical rainforests. Science Progress, Oxford 70, 44). pp.145-154. Department of Geography, Monash 461-472. University, Melbourne. WALKER D. & SINGH G. 1981. Vegetation history. In Groves, R.H. ed. Australian Vegetation pp. 26-43. Cambridge University WORLD COMMISSION ON ENVIRONMENT AND DEVELOPMENT. 1987. Our Common Future. Oxford University Press, Oxford. Press. WEBB LJ., TRACEY J.G. & WILLIAMS W.T. 1984. A floristic QUEENSLAND DEPARTMENT OF FORESTRY. 1983. Rainforest Research
Geological Society of Australia Symposium Proceedings (1990) 1, 21-26.
Quaternary legacies and environmental and engineering problems associated with urban and rural development in the South-East Asian humid tropics
Ian Douglas School of Geography, Mansfield Cooper Building, University of Manchester Manchester, M13 9PL U.K. Although many of the present humid tropical lowland areas of Africa and South America experienced much drier climates during montane and higher latitude Pleistocene glaciations, as yet the evidence for greater aridity during Quaternary low sea levels in glacial times in South East Asia is insufficient to identify areas from which tropical rainforest disappeared. The low sea levels were accompanied by deposition of coarse sediments indicating greater erosive energy than at present. Such higher energy conditions may have been related to either montane or lowland vegetation changes, or both. The changing sea levels and coarse sediments have left areas of poor soils, relict landslides, buried karst plains and placer deposits which influence rural and urban development and pose special engineering problems. Compaction and subsidence in coastal deltas and sinkhole development in karst follow excessive groundwater abstraction. Exploration for placer deposits requires thorough understanding of Quaternary fluvial processes and deposits. Urban and rural developments both require a thorough knowledge of the ground to be built upon. Key words: Quaternary, karst, subsidence, engineering geology, sea level change, placer deposits, fluvial processes.
INTRODUCTION
QUATERNARY CLIMATIC CHANGE
Although palynological and other evidence have indicated that many present day humid tropical lowland localities in Africa and South America were commonly more arid during Pleistocene glaciations, the evidence for such aridity in South East Asia is patchy, incomplete and controversial. Nevertheless, the major changes in sea-level had profound effect on landform evolution, erosion and deposition, creating topographic and sedimentary features which now pose problems for planners, engineers, agriculturalists and foresters endeavouring to develop the urban areas and rural resources of the region. This paper examines the nature of Quaternary changes and landform development in South-East Asia and the problems that those changes pose for present day land use and resource exploitation. Evidence of Quaternary change is now provided by both pure and applied geomorphological studies, by a growing interest in the Quaternary by national geological surveys and engineering geologists, by studies of soils and weathering profiles and by palynological studies of vegetation history.
In many parts of the present-day humid tropics, aridity, relative to today's humidity, produced spreads of sands and gravels, both fluvial and aeolian, which now provide both development opportunities and environmental problems. Such legacies are more readily found in the more stable parts of the humid tropics, as earth movements and volcanic activity have produced large supplies of coarse debris throughout the Quaternary in areas such as Central America, the Andes, Sumatra, Java, New Guinea and the Philippines. In the Cagayan basin of northern Luzon, in the Philippines, for example, a large alluvial fan was developed by coarse debris transported by braided streams as a result of tectonic uplift and volcanic activity. This episodic, tectonically-induced sedimentation must be distinguished from that associated with Quaternary climatic changes. Furthermore, if geologic conditions are favourable, rivers in technically stable areas covered with tropical rain forest today may be actively transporting large quantities of sand and gravel, as do the Kinabatangan and Segama in northern Borneo's sandstone, mudstone and slump breccia terrain. The nature and extent of Quaternary climatic
22 IAN DOUGLAS changes in the tropics has been most clearly established in the highest mountains. Deglaciation of tropical mountains occurred at least as early as 15 ka BP at an altitude of just over 2900 m on Mt Ruwenzori; by at least 12 ka BP at approximately 3700 m on Mt Wilhelm in New Guinea; no later than 9 ka BP at 4000 m on Mt Kinabalu on Borneo; and before 8 ka BP at 4400 m on Mt Wilhelm (Flenley & Morley 1978). Between 18.5 ka and 16.5 ka BP treelines in Sumatra were depressed some 1000 m at the sub-alpine/alpine boundary and about 350 m at the sub-montane/montane forest boundary (Flenley 1984). The evidence from these high mountain areas indicates cooler climates but not necessarily drier climates. At less extreme elevations in Sumatra and Java, Late Pleistocene (post 30 ka BP) vegetation changes also indicated cooler but not necessarily drier climates. Data for Danau di-Atas, at 1535 m elevation in Sumatra, and Situ Bayangbong, at 1300 m altitude in Java, indicate temperatures at least 1.8°C, and possibly as much as 7°C, lower than at present during the last glaciation (Stuijts et al. 1988). Similar changes occurred at Pea Simsin, at 1450 m elevation in North Sumatra, with the establishments of a forest similar to the present after 12 ka BP (Maloney 1980). The nature of Quaternary environmental affecting the vegetation of the present-day humid tropical lowland areas of South-East Asia is, as yet, unclear, as few lowland sites have yielded long fossil pollen records. At almost every tropical rainforest pollen site reviewed by Walker and Chen (1987) some changes in forest composition occurred around 10 ka BP. The MISEDOR borehole in the Mahakan delta in south-east Kalimantan revealed an increase in grass pollen around 18 ka BP which could indicate a more seasonal, perhaps savanna, type of vegetation (Caratini & Tissot 1988). A pollen assemblage containing 34% Pinus and 18% Gramineae pollen, both indicative of the much more seasonal climates of Thailand and Luzon, was found in the Older Alluvium at Subang, near Kuala Lumpur, Malaysia (Flenley 1987). A further indication of drier conditions in these equatorial areas comes from the kunkar nodules, which form only under a dry climate, that have been found on the Sunda Shelf (Morley 1982). Evidence of several sea-level oscillations with greater proportions of grass pollen and more detrital sedimentation associated with low sea-levels earlier in the Pleistocene from the MISEDOR borehole suggests that further research may confirm greater seasonality and aridity during glacial periods in lowland equatorial south-east Asia.
THE STRATIGRAPHIC EVIDENCE FROM ALLUVIUM AND ALLUVIAL TERRACES The widespread occurrences of Quaternary alluvium in lowland south-east Asia, although frequently described (Burton 1964), have been little studied in detail and have seldom been either firmly dated or linked to the records of high latitude and tropical mountain glaciations. The nature of lowland alluvium is well illustrated by the simple threefold sequence revealed by shallow boreholes in the coastal plain of Beruas, Perak, peninsular Malaysia (Suntharalingham 1980). Overlying the bedrock is the Simpang Formation, a deposit of gravel, sand, silt and clay, which can be divided into an older sand and gravel sequence and a younger clay and silt deposit. The whole sequence is interpreted as a terrestrial deposit formed by a succession of alluvial fans of Late Pliocene to Late Pleistocene age. This Simpang Formation sequence, termed the Older Alluvium in Malaysia and Singapore, is interpreted as a terrestrial deposit formed by a succession of alluvial fans of Late Pliocene to Late Pleistocene age. Above this material lies a grey to green marine clay, clearly indicating a higher sea level than that at which the Simpang Formation was deposited. This marine Gula Formation gives way to a sand, sandy clay and clayey peat sequence, representing colluvial, flood plain and alluvial deposits. These materials, known as the Beruas Formation, are interpreted as Holocene and Recent accumulations, the equivalent of the Younger Alluvium in Malaysia. Sands with gravels similar to the alluvial fan material of the Simpang Formation are found throughout the west of the Malay Peninsula and Singapore. The Older Alluvium of the Kinta Valley in Perak has been interpreted as a sequence of coarsegrained channel sediment and finer, better-sorted overbank deposits. Sands and gravels are generally found at the base of a local channel deposit sequence and, less commonly, as lenses higher up (Senathi Rajah 1979). The whole sedimentary pattern suggests the type of rapid infilling of the valley floor which would have occurred during a rising sea level. In Singapore, the Older Alluvium was deposited by a large braided stream carrying a considerable sediment load towards the centre of the present South China Sea (Gupta et al 1987). As the Older Alluvium deposits appear coarser and less well sorted than those of contemporary Malay peninsular rivers, they have been taken as indicators of a more seasonal climate which supported less vegetation. TheyfitBatchelor's (1979) suggestion
QUATERNARY LEGACIES IN THE S.E. ASIAN TROPICS that as sea levels rose after glaciations, the increased rainfall over less dense vegetation would have produced aggrading, braiding streams which deposited lenses of coarse sand and gravel over the coastal plains and continental shelf. However, braided channels and alluvial fans are actively developing under present day conditions in equatorial Borneo where many streams carry a considerable gravel and coarse sand bed material load (Rose 1984). Careful comparison of present-day fluvial deposits with material of Older Alluvium sequences is necessary to establish the possibility of changed conditions of denudation and deposition. Although palaeomagnetic measurements indicate that the earliest deposits of the Older Alluvium date from 1.67 to 1.87 Ma BP (Batchelor 1988), the many Quaternary sea level fluctuations, recorded in the MISEDOR borehole and in similar records from the Gulf of Thailand, would have produced repeated episodes of erosion, reworking and redeposition of the Older Alluvium. The most recent major transgression, including the last encroachment of the sea into the Gulf of Thailand (Somboon 1988), occurred after 15 ka BP Such changes are reflected in sedimentation rates. The sediments in core V35-5 from a knoll in the southern part of the south China Sea (approx 7N 112E) accumulated at a rate of 15 cm ka"1 in the Holocene but at 33 cm ka"1 during glacial time (Broecker et al. 1988). Such a change in deposition rate ties in well with the ideas of greater sediment supply in the periods of formation of the Older Alluvium. Nevertheless, the alternative hypothesis that as sea levels fell, incision of channels occurred (Rose 1984) and sediment was carried out further over the exposed floor of the South China Sea, to be deposited in areas closer to the core V35-5 locality, has to be explored. Resolution of this dilemma is likely to be reached when sufficient offshore information is available to link the terrestrial palaeogeomorphology with the Quaternary marine sedimentation. Over much of the present land area, alluvial sequences are masked by forest. Gradually land and mineral resource investigations are revealing their extent. As the largest island, Borneo, despite some late Tertiary and Quaternary tectonic movements, is likely to be particularly useful as a source of such information. In western Kalimantan, clayey sand deposits were laid down in alluvial fans and on floodplains at about 55 ka to 35 ka BP during a drier low sea level period (Thorp & Thomas 1989). The podsols which have developed on these sandy materials are similar to those on sand and gravelly sand deposits in the area between Tambunan and
23
Keningau, just to the east of the Crocker Range in western Sabah (Stein 1988). Between these two areas, aggradation of terraces along the Melinau River in Sarawak has been ascribed to greater sediment supply from the headwaters of the catchment area during wetter "interglacial" conditions (Rose 1984). Incision on the other hand is associated with the lower sea levels described earlier, although in these areas of karst rocks, the possibility that local incision is associated with the development of new stream sinks and underground passages cannot be excluded. Some resolution of the timing of aggradation may eventually come from the dating of speleothems and the analysis of cave deposits. Such work is in its infancy in south-east Asia, but preliminary studies in Perlis, Malaysia, show that some flowstones in the Kaki Bukit, Setul Formation, limestones are 280 ka to more than 400 ka old and indicate that the highest caves in these limestones may be over 2 Ma old (Smart, et al. 1984). Kiernan (1988) has also argued that the oldest erosional remnants in the tower karst of southern Thailand, north of Perlis, are unlikely to be younger than Pliocene or Miocene in age. The karst hills of South East Asia may therefore be storehouses of Quaternary chronology, especially if older cave passages were abandoned before any reworking of sediments occurred. Changing sea levels have affected karst up to 15 metres above the present sea level. The picture of Quaternary environmental changes in the South-East Asian humid tropics remains incomplete and patchy. The broadest picture yet available from the evidence collected so far is Henley's suggestion (1987) of greater seasonality and less precipitation during glacial low sea levels creating a "savanna corridor" down the Malay Peninsula into Sumatra and Java. An "everwet core" persisted to the northeast, over northern and central Borneo and, possibly, Mindanao. As the present day climates of Mindanao and the neighbouring parts of Borneo may have long dry spells, sometimes today associated with El Nino-Southern Oscillation events, the rain forests of the everwet core itself may have suffered occasional moisture stress and perhaps frequent natural disturbance. In the nineteen-eighties, these Quaternary changes have attracted greater attention from the growing geological services of the rapidly industrialising countries of the region and from international agencies, resulting in conferences such as the CCOP symposium of developments in Quaternary Geological Research in East and Southeast Asia (Wezel & Rau 1987) and the workshop on stratigraphic correlation
24
IAN DOUGLAS
of Thailand and Malaysia (Sangad 1983), and in assessments of the implications of environmental changes for urban development in the UN Economic Commission for Asia and the Pacific's atlases of urban geology project. The second half of this paper will assess the importance of such applied Quaternary studies for South East Asian development.
DEVELOPMENT OPPORTUNITIES ENVIRONMENTAL PROBLEMS
AND
The rapid growth of the economies of South-East Asian countries is readily apparent in the expanding cities where dozens of tower cranes punctuate the urban skyline. Even though change is less apparent in the countryside, the growth of road networks, reservoir construction and mineral exploitation all involve earthworks whose successful planning and execution require a sound knowledge of engineering geomorphology and Quaternary geology. Most of the large cities are located on coastal plains whose substrates reflect the influence of changing sea levels, altered fluvial sediment supplies, and hydrologic changes. Some of the most important mineral resources are Quaternary placer deposits. New roads, pipelines, harbour works and reservoirs often lie across terrain affected by Quaternary erosion or deposition. For over a century, alluvial tin from Malaysia, Thailand and Indonesia has supplied about 55 per cent of the total world production. As many of the shallow onshore deposits, such as those of the Kinta and Kelang valleys of Malaysia, have been worked out, the search for tin has moved towards that coast and offshore, into areas of deeper alluvium. The search has to cope with all the complexities of palaeochannels and ancient shorelines. Alluvial tin carried to sea levels lower than the present was reworked into beach placer deposits at high sea levels at about 120 ka BP and again since 10 ka BP (Batchelor 1979). Earlier placers of this type probably exist deeper in the sedimentary sequence. Reconstruction of the past river channels and the redistribution of the sediments they discharged into the sea greatly assist mineral exploration. Even the relatively minor Holocene changes of sea level have created a series of shorelines between 1 m below and 3.4 m above present sea level each probably having tin placers in suitable localities, such as Dindings, Perak, Malaysia. Buried stream channels are also important as alluvial aquifers for rural and urban water supplies.
Even in humid tropical peninsular Malaysia, seasonal water shortages may occur locally where wells penetrating shallow sand and fine gravel aquifers are overpumped. As new industrial enterprises sink and exploit deeper wells, water tables are lowered and traditional groundwater supplies become exhausted. Other shallow supplies may become contaminated by local waste dumping and sewage effluent. Exploration of the buried channel systems could provide cheaper sources of water than the piped supplies from reservoirs in the foothills of Main Range generally used to alleviate shortages in Malaysia.
GROUNDWATER SUBSIDENCE
ABSTRACTION
AND
Overpumping of groundwater leads to compaction of the water-bearing strata and ground surface subsidence. One of the most serious examples of this in South East Asia occurs in Bangkok, where an area in the east of the city has subsided at a rate of 14 cm per year (Nutalaya 1981; Nutalaya and Rau 1981; Premchitt 1979; Rau and Nutalaya 1982). Although the alluvial sediments of the Chao Phraya delta are a deep complex sequence of clays with buried channels providing lenses of sands and gravels, the sinking is confined largely to the top 200 m, with about 40 per cent of all the lowering confined to the top 15 m of the Bangkok Clay. As neotectonic movements have led to complex faulting of the alluvial sediments, small segments of terrain subside differentially, causing canals to no longer flow in their orginal directions and disrupting stormwater drainage. Localised, short-duration storm period flooding has become more and more prevalent. Restoration and levelling of road surfaces has left many houses and shop premises with ground floors below street level, with consequent increased risk of frequent invasion by stormwater. The costly remedy has been to install a deep, main drainage system with powerful pumps to raise the surplus water up to the level of the Chao Phrya downstream of the city. Particularly severe flooding in 1983, when parts of the city were under water for more than 3 months caused US $ 241 million worth of damage (ESCAP Secretariat 1988). Since that date further flood mitigation works costing over US $ 6.5 million have been undertaken. The construction of a flood control dike to protect the urban area has however led to increased flooding of the padi fields outside the city where water levels were over a metre higher than inside the city. Strict control of groundwater pumping
QUATERNARY LEGACIES IN THE S.E. ASIAN TROPICS has led to a rise of 2.5 m in the piezometric level and a reduction in the rate of lowering of the ground surface (ESCAP Secretariat 1988). Nevertheless, the Bangkok authorities recognise that the Chao Phrya Plain has been downwarping for most of the Quaternary and that part of the subsidence is likely to continue whatever restrictions on human activities exist. Monitoring of ground level changes and sea level trends has to continue, so that urban managers can be prepared for the impact of any future global climatic changes.
ENGINEERING PROBLEMS IN KARST TERRAIN Subsidence of another form occurs in the limestone areas of South East Asia. Around many of the prominent tower karst hills of northern Vietnam, southern Thailand, Malaysia and Indonesia, extensive alluvial deposits bury karst surfaces which are often pinnacled, encumbered with limestone blocks and pitted with sinkholes which developed during Pleistocene low sea levels. Beneath the north-eastern part of central Kuala Lumpur is a highly cavernous buried karst, with many voids. Alluvial tin mining around the city often exposed the pinnacles on the floor of opencast pits. Such mining produced two types of subsidence: that due to the general lowering of the groundwater table, especially by the pumping of water out of mine pits, and that due to sudden collapse of sediments over sinkholes (Hasan 1984). Many abandoned tin mines have now been used for landfill. The shortage of urban residential land in Kuala Lumpur has led to some of the filled areas being reclaimed for low-cost housing. In a few instances fill has later subsided into sinkholes, with in one place, a row of low-cost houses collapsing into a re-opened hole (Tan 1986). Such buried karst plains are composite, being the product of evolution in relation to changing sea levels (Chow Weng Sun 1988). The pinnacles exposed beneath the alluvium may be but the summit of a series of caverns which have been invaded by the sea and drained more than once. Boreholes often encounter a sequence of voids or loosely compacted clays, separated by hard limestone. Although Glazek (1966) suggested that caverns may continue to evolve below sea level, it is most likely that the present buried karst all developed when the limestones were exposed during Pleistocene cold periods. The buried karst now poses serious problems for civil engineering works (Tan & Batchelor 1981, Bergado and Sebanayagan 1987). New high rise
25
buildings require deeper foundations than the low rise buildings which sufficed until the nineteen-seventies. In Kuala Lumpur, the low rise structures had their foundations on the stiff clay layer within the alluvium. Taller multistorey structures require piling into the underlying limestone. However, the irregularity of both the karst surface and the cavities within the buried karst means that foundation investigations have to be particularly circumspect (Yunus Abdul Razak 1988). Drill holes may strike limestone, unaware as to whether it is buried rockfall material or a pinnacle, while a neighbouring hole might pass through several more metres of alluvium before hitting limestone. Analagous karst terrain in southern China (Waltham & Smart 1988, Yuan Daoxian 1988, Chen Jian 1988) and Florida (Beck 1984) exhibits a whole range of buried karst engineering problems that can only be overcome by careful geophysical investigation of subsurface geomorphology.
CONCLUSION: A FRAGILE ENVIRONMENT Pleistocene aridity and associated erosion and sedimentation accounts for some of the unstable hillslopes and fragile soils of the south east Asian humid tropical environment. Fire, both natural and induced by shifting cultivators, has long disturbed the forest. Where the soils are poor or slopes unstable, the forest may not regenerate fully, but be replaced by a grassland or heath-like formation. The majority of the true heath forest formations, characteristic of quartz-rich, nutrient poor beach ridge and river terrace deposits, is a direct response to Pleistocene and Holocene environmental change. Any disturbance of this vegetation is likely to cause loss of the few nutrients in the litter layer and surface soil. The acidic soils of these sandy deposits have low agricultural potential and are liable to severe erosion if vegetation is removed. Land evaluation for agriculture thus has to involve assessment of Quaternary legacies affecting terrain stability and soil capability. All to often, disturbance by people can result in the land returning to the unstable conditions of greater seasonality and less reliable water supplies in Pleistocene glacial periods. Far from being stable and unchanging, the humid tropics in South East Asia suffered major changes in environmental conditions affecting landform evolution during the Quaternary. As development proceeds and the scientific and technical agencies of the region advance, the practical knowledge of the Quaternary necessary to cope with the legacies of climatic change
26 IAN DOUGLAS will grow. A thorough understanding of the ground being developed must eventually be built into a full geomorphology and surficial geology of the Quaternary, which will not only help development in other cities and other countries, but will provide a basis from which the likely consequences of global warming for the humid tropics may be better forecast. REFERENCES BATCHELOR B.C. 1979. Geological characteristics of certain coastal
MORLEY R. J. 1982. A palaeoecological interpretation of a 10,000
year pollen record from Danau Padang, Central Sumatra,
Indonesia. Journal of Biogeography 9, 112-124. NUTAIAYA P. 1981. Land subsidence in Bangkok and its possible
remedial measures. Abstracts ofPapers 4th Regional GEOSEA, Manila, pp. 18-20, November 1981, 12-13.
NUTALAYA P. & RAU J. L. 1981. The sinking metropolis. Episodes 1981 (4), 3-8. PREMCHITT J. 1979. Land subsidence in Bangkok, Thailand: results of initial investigations. Geotechnical Engineering 10, 107-119. RAU J. L. & NUTAIAYA P. 1982. Geomorphology and land
subsidence in Bangkok, Thailand. In Craig R. G. & Craft R. L. eds. Applied Geomorphology, pp. 181-201, Allen & Unwin, London. ROSE J. 1984. Alluvial terraces of an equatorial river, Melinau drainage basin, Sarawak. Zeitschrift fur Geomorphologie N. F.
and offshore placers as essential guides for tin exploration in Sundaland, Southeast Asia. Geological Society ofMalaysia Bulletin 11, 283-313. 28, 155-177. BATCHELOR D. A. F. 1988. Dating of Malaysian fluvial tin placers. SANGAD B. ed. 1983. Proceedings of the Workshop on Stratigraphic Journal of Southeast Asian Earth Sciences 2, 3-14. Correlation of Thailand and Malaysia. Vol. 1 Technical Papers. BECK B. F. ed. 1984. Sinkholes: their Geology, Engineering and Geological Society of Thailand, Bangkok, and Geological Environmental Impact. Proceedings of the First Society of Malaysia, Kuala Lumpur. Multidisciplinary Conference, Orlando, Florida, 15-17 October SENATHI RAJA S. 1979. The Kinta Tinfield, Malaysia. Geological 1984. Balkema, Rotterdam. Society of Malaysia Bulletin 11, 111-136. BERGADO D. T. & SEBANAYAGAN A.N. 1987. Pile foundation P. L., ANDREWS J. N. & BATCHELOR B. C. 1984. problems in Kuala Lumpur limestone, Malaysia. Quarterly SMART Implications of uranium series dates from speleothems for the Journal of Engineering Geology 20, 159-175. age of landforms in north-west Perlis, Malaysia: preliminary BROEKER W. S., ANDREE M., KLAS M., BONANI G., WOLFI W. & study. Malaysian Journal of Tropical Geography 9, 59-68. OESCHGER H. 1988. New evidence from the South China Sea SOMBOON J. R. P. 1988. Palaeontological study of the recent for an abrupt termination of the last glacial period. Nature marine sediments in the lower central plain, Thailand. Journal 333, 156-158. of Southeast Asian Earth Sciences 2, 201-210. BURTON C.K. 1964. The older alluvium of Johore and Singapore. STEIN N. 1988. Podsole, Relief und Vegetation in Nord Borneo. Journal of Tropical Geography 18, 30-42. Erdkunde 42, 294-310. CARATINI C. & TISSOT C. 1988. Palaeogeographical evolution of 1., NEWSOME J. C. & FLENLEY J. R. 1988. Evidence for the Mahakam Delta in Kalimantan, Indonesia, during the STULFTS Late Quaternary vegetational change in the Sumatran and Quaternary and Late Pliocene. Review of Paleobotany and Javan highlands. Review of Palaeobotany and Palynology 55, Palynology 55, 217-228. 207-216. CHEN JIAN. 1988. Karst collapse in cities and mining areas, China. SUNTHARALINGHAM T. 1980. A systematic investigation of the Environmental Geology and Water Resources 29, 29-35. Quaternary deposits in the coastal plain of Beruas, Perak. CHOW WENG SUN. 1988. Geological hazards in the urban centre Report Geological Survey of Malaysia 1980, 185-192. of Kuala Lumpur. Atlas of Urban Geology, Vol. 1, pp. 98-106, TANAnnual B. K. 1986. Geological and geotechnical problems of urban U N ESCAP. centres in Malaysia. In Tan B.K. and Rau J.L. eds. Landplan ESCAP SECRETARIAT. 1988. Geological information for planning II Role of Geology in Planning and Development of Urban in Bangkok, Thailand. Atlas of Urban Geology, Vol. 1, pp. 24Centres in Southeast Asia, pp. 10-14, Association of 60, UN ESCAP. Geoscientists for International Development, Bangkok. FLENLEY J. R. 1984. Late Quaternary changes of vegetation and TAN B. K. & BATCHELOR B. C. 1981. Foundation problems in climate in the Malesian mountains. Erdwissenschaftliche limestone areas. A case study in Kuala Lumpur, Malaysia. In Forschung 18, 261-267. Proceedings of the International Symposium on Weak Rock, FLENLEY J. R. 1987. Palynological evidence for land use changes Tokyo, pp. 1461-1463, Balkema, Rotterdam. in South-east Asia. Journal of Biogeography 15, 185-197. THORP M. B. & THOMAS M. F. 1989. Some aspects of the FLENLEY J. R. & MORLEY R. J. 1978. A minimum age for the geomorphology of Late Pleistocene alluvial sediments in deglaciation of Mt. Kinabalu, East Malaysia. Modern Western Kalimantan, Indonesia. GeoOko plus 1, 292. Quaternary Research in South-east Asia 4, 57-61. WALKER D. & CHEN Y. 1987. Palynological light on tropical GLAZEK J. 1966. On the karst phenomena in North Vietnam. rainforest dynamics. Quaternary Science Review 6, 77-92. Bulletin of the Polish Academy of Sciences, Geographical and WALTHAM A. C. & SMART P. L. 1988. Civil engineering difficulties Geological Series 14, 45-52. in the karst of China. Quarterly Journal ofEngineering Geology GUPTA A., RAHMAN A., WONG P. P. & PITTS J. 1987. The old 21, 2-6. alluvium of Singapore and the extinct drainage system to the South China Sea. Earth Surface Processes and Landforms 12, WEZEL F. & RAU J. eds. 1987. Proceedings of the CCOP Symposium on Development in Quaternary Geological Research 259-276. in East and Southeast Asia during the last Decade. HASAN M J \ . 1984. Mineral and energy resources: its exploitation Publication 18. UN ESCAP, Bangkok. related to mining operation hazards, subsidence and other YUANCCOP/Technical DAOXIAN. 1988. Environmental and engineering problems effects. In Sahabat Alam Malaysia, eds. Environment, of karst geology in China. Environmental Geology and Water Development & Natural Resource Crisis in Asia and the Resources 12, 79-88. Pacific, pp. 131-155, Sahabat Alam Malaysia, Penang. YUNUS ABDUL RAZAK. 1988. The state of the art of the KIERNAN K. 1988. Mangroves, mountains and munching molluscs: application of urban geology to planning in Malaysia. Atlas of the evolution of a tropical coastline. Helictite 26, 16-31. Urban Geology, Vol. 2, pp. 145-150. UN ESCAP. MALONEY B. K. 1980. Pollen analytical evidence for an early forest clearance in North Sumatra. Nature 287, 324-326.
Geological Society of Australia Symposium Proceedings (1990) 1, 27-36.
Frequency and magnitude of catastrophic explosive volcanism in the Japan region during the past 130 ka: Implications for human occupance of volcanic regions Hiroshi Machida Department of Geography, Tokyo Metropolitan University, 2-1-1, Fukazawa, Setagaya, Tokyo 158, Japan This paper demonstrates that the characteristics and ages of Quaternary tephras provide a valuable guide to the nature, magnitude and frequency of past explosive events. The frequency of eruptions decreases with increasing magnitude. In and around Japan large eruptions of the size of Mount St. Helens (1980) have occurred at an average of once a century and those like Krakatau (1883) twice or three times per 10 ka. Eruptions with a volcanic explosivity index (VEI) of about 7, like Tambora (1815), occur perhaps once every 10 ka. As well, it is apparent that large caldera volcanoes have experienced major tephra eruptions, with VEIs of 7, once or twice in the last 130 ka; each caldera has been formed by multicyclic major eruptions which recurred every 10 ka or so. Of the ten late Quaternary eruptions with VEIs of 7, the Kikai-Akahoya eruption of 6.3 ka BP would have had heavy impacts on the neolithic culture in southwestern Japan including Kyushu. The recurrence of such an explosive volcanism would be of severe consequence over a vast area anywhere in the world. Key words: tephra, tephrochronology, explosive volcanism, volcanic hazard, late Quaternary, caldera volcano, archaeology.
INTRODUCTION Tephra layers not only directly govern the nature of soil and landform, but are also important timemarkers in interpreting Quaternary records. Consequently, tephrochronology has been one of the most flourishing fields of study in the Quaternary records of highly volcanic areas like Japan. This paper deals with aspects of tephrochronological studies in Japan and adjacent areas, emphasising that Quaternary tephrochronology should provide basic guidelines for predicting future explosive volcanism, because the tephras clearly indicate the size and nature of the past explosive events and how frequently they happened. Application of such studies to human occupance of volcanic areas is explored using a case study of the cataclysmic eruptions of prehistoric age in southwestern Japan and their impacts on human beings and the environment.
RECENTPROGRESSOFTEPHROCHRONOLOGY IN JAPAN Tephrochronological studies are based on the characterisation and identification of specific tephras
and their ages. In practice, we use every technique available for identification of tephra. In the field we investigate various macroscopic and stratigraphic characteristics of tephra such as sorting and grading of tephra, mode of occurrence, stratigraphic relationships with other marker-tephras and nonvolcanic sediments and surfaces, and even relationships with archaeological remains. Recently, detailed laboratory descriptions have been given of the petrographical and chemical characters of specified minerals and glass. Thus, catalogues of Late Quaternary tephras in and around Japan (Arai & Machida; 1980; Arai et al. 1987) include several criteria for identification. The refractive indices of volcanic glass and phenocrysts from tephras have been determined to be the first and most efficient parameter for quick characterisation, together with crystal assemblages and so on. The chemical compositions of volcanic glass shards and crystals are also used for discrimination and identification of specific tephras. Ages of tephragenic eruptions in the last 1.5 ka have been determined by historical documents together with archaeology and dendrochronology. The majority of tephras ejected between c.30 ka and 1.5 ka BP have been dated by the radiocarbon method.
28 HIROSHIMACHIDA Moreover, the use of other dating techniques, such as fission-track, uranium-series, thermo-luminescence, and stratigraphic methods, means that the tephronological approach can be employed beyond the limit of radiocarbon dating. Indeed, a number of ages obtained from various methods on the same tephra at different localities can be checked with each other, resulting in high-quality age control. The increase in the number of dated markertephras has greatly contributed to the understanding of Quaternary problems. Such increases have made it possible to obtain correlation between tephras in widely-separated districts. Machida and Arai (1976, 1978) reported two widespread tephra, the Aira-Tn ash (AT) and the Kikai-Akahoya ash (K-Ah), which were produced by gigantic eruptions of the Aira and Kikai calderas in southern Kyushu and distributed throughout Japan and adjacent seas as coignimbrite ash falls. Both tephras are dated by great numbers of radiocarbon age determinations from all over Japan, resulting in high-quality ages. These ages are 22 ka and 6.3 ka, respectively (Machida & Arai 1983). These results have encouraged identification and correlation of other widespread tephras. The petrographic characteristics of fine-grained tephras have been thoroughly investigated not only on land but also in cores from abyssal sediment around Japan. Many tephras have now been successfully identified, the most extensive of which from the late Quaternary are shown in Table 1. Figure 1 shows the fallout areas of several extensive tephras ejected in the late Quaternary. These tephras occur throughout almost the whole of the Japanese islands and adjacent seas. Most of such tephras are of the co-ignimbrite ash fall type (Machida & Arai 1976; Sparks & Walker 1977). They are characterised by dominance of silicic fine-grained glass shards generated by phreato-plinian eruption and/or delayed vesiculation, and enormous eruptive volumes, often in excess of the volume of erupted ignimbrite. Standard ages of most older tephras in Table 1 have been given not by individual radiometric methods but by stratigraphic and synthetic interpretations. Most of the widespread tephras derived from Kyushu calderas, for example, were dated by examining their stratigraphic positions within well-dated Quaternary sequences in areas such as South Kanto, central Japan, where standard chronologies of tephras and marine sequences have already been established (Machida 1975).
MAGNITUDE AND FREQUENCY OF VERY LARGE EXPLOSIVE VOLCANISM IN LATE QUATERNARY In compilations of volcanism an estimate of the scale or magnitude of each eruption is needed. Tsuya (1955) proposed a magnitude scale of I - IX on the basis of volume of pyroclastic ejecta and lava erupted. Simkin et al. (1981) and Newhall and Self (1982) proposed the volcanic explosivity index (VEI), which is a general indicator of the explosive character of an eruption on the basis of bulk volume of pyroclastic ejecta erupted. Eruptions can be assigned a VEI on a scale of 0 to 8. The larger the value of VEI, the greater the amount of damage caused by an eruption. In Japan explosive activities with VEIs of 4 and 5 have happened several times in historic times, but it seems lucky that very large scale activity with VEIs of 6 or 7, like the great 1815 Tambora eruption, has not taken place for the last 1500 years. There is abundant evidence of highly explosive activity, however, during prehistoric times. Examples include very extensive tephra sheets produced by large caldera volcanoes (Table 1). Bulk volumes of such tephras are calculated on the basis of isopach maps of airfalls and pyroclastic flow components. All of these eruptions are the products of plinian and ignimbrite-forming activity of VEIs 6 or 7. As a result of extensive research, we are currently completing a catalogue of very large eruptions of late Quaternary tephra with VEIs 5 to 7, in Japan and Korea (excluding tephras produced by submarine and/or isolated island volcanoes). Table 2 shows the frequency of very large eruptions with VEIs 5 to 7 during the last 130 ka. The data indicate that in Japan and adjacent areas, eruptions with index 5, the size of the 1980 Mount St. Helens eruption, have occurred at an average of once per century. Those like Krakatau of 1883, with index 6, have occurred twice or three times per 10 ka, whereas those of VEI 7, like Tambora (1815), have occurred perhaps once every 10 ka over the last 130 ka. Figure 2 is an illustration of late Quaternary eruptive history of large caldera volcanoes in Japan and Korea. It is clear that these large caldera volcanoes erupted major tephras with VEI 7 once or twice and those with VEI 6 several times during the last 130 ka. This clearly indicates that each caldera has been formed by multiple major eruptions, which have recurred approximately every 10 ka. Volcanoes can be classified in terms of expected maximum magnitude and frequency of eruptions based on Quaternary tephrochronology. Figure 3
CATASTROPHIC VOLCANISM IN JAPAN
126°
130°
29
146 E 134°
46° N-
42°— Spfa-H32Ka)
Toya^^
Kikaii
I 100
l i i 0i 11 100 i 200 i 3 0<0
km
AT(22ka)
Fig. 1 Fallout areas of representative widespread late Quaternary tephras. Approximate outer limits of fallout areas are shown by dashed lines. 20 cm isopach of the K-Ah ash is shown by dotted line.
o
X
Table 1: Representative large scale eruptions occurred in and around Japan during the last 130,000 years Volcano
Baegudu
Tephra
B-Tm
M
oV oo X
Age (ka) &
Mode of
Bulk
Dating method
emplacement
volume
Distal feature
Volcanic glass
Crystals
1.0
P,i,c
50 km3
vitric ash
pm>bw n = 1.506-1.523
af, (ho,cpx) af nl = 1.522-1.524
Machida & Arai (1983b)
P,i,PP,c
>150
do
bw>pm n = 1.508-1.514
pl;opx,cpx opx7 = 1.709-1.712
Machida & Arai (1978)
>10
pumice
pm n = 1.514-1.524
af; bi,ho,cpx af nl = 1.521-1.524 ho n2=1.730-1.741
Machida & Arai (1983b) Machida et al (1984)
Archaeology
VEI
Characteristics of tephra
References
o S3
Kikai
K-Ah
6.3 C-14
Ulreung
U-Oki
9.3 C-14
Towada
To-HP
12-13 C-14
P>*
>50
pumice
pm n = 1.502-1.509
pi; opx,cpx,ho opx7 = 1.705-1.708 ho n2=1.669-1.673
Hayakawa (1983)
Aira
AT
22
P,I,C,PP
300
vitric ash
bw>pm n = 1.499-1.501
pi; opx,cpx,(ho,qt) opx7 = 1.731-1.734
Machida & Arai (1976) Aramaki & Ui (1966)
P,i
150?
pumice
om>bw n = 1.500-1.505
pl,qt; opx,ho,(cpx) opx7 = 1.729-1.735 ho n2=1.688-1.691
Katsui (1959) Arai et al (1986)
10
pumice
pm n = 1.502-1.509
pi; ho,opx,(cpx) opx7 = 1.707-1.710 ho n2=1.671-1.677
Kanto (1965)
pi; ho,opx,bi opx7 = 1.702-1.708 ho n2=1.673-1.680 pi; opx,cpx,ol opx7 = 1.703-1.713
Machida & Arai (1979)
C-14 Shikotsu
Spfa
Akagi
Ak-KP
32 FT
Daisen
DKP
43-47 U
P>»
>20
pumice
pm n = 1.508-1.514
Hakone
Hk-TP
49 FT
P>»
30?
pumice
pm n = 1.510-1.514
Aso
Aso-4
70 ST & FT
>400
vitric ash
bw>pm n = 1.506-1.514
pi; ho,opx,cpx opx7 = 1.699-1.701 ho n2=1.685-1.691
Machida et al (1985) Ono et al (1977)
Kikai
K-Tz
75 ST & TL
150?
vitric ash
bw>pm n = 1.497-1.500
pl,qt; opx,cpx opx7 = 1.705-1.709
Ota & Machida (1987)
32 C-14
i,c
Loam
Res.
>
Group
Machida & Moriyama (1969)
Table 1: (Cont.) Volcano
Tephra
Age (ka) &
Mode of
Bulk
Dating method
emplacement
volume
VEI
Characteristics of tephra
References
Distal feature
Volcanic glass
Crystals
Ontake
On-Pml
80 FT
p
70?
6
pumice
pm>bw n = 1.500-1.503
pi; ho,bi,(opx) opx7 = 1.706-1.711 ho n2 = 1.681-1.690
Kobayashi et al (1968)
Ata
Ata
85 ST
p,i,c,pp
>200
7
vitric ash
bw>pm n = 1.508-1.513
pi; opx,cpx,(ho) opx7 = 1.704-1.708
Ota & Machida (1987) Aramaki & Ui (1966)
Toya
Toya
90-100 FT & ST
pp,i,c
>150
7
vitric ash
pm>bw n = 1.494-1.497
pl,qt; opx opx7 = 1.756-1.761
Machida et al (1987)
Aso
Aso-3
100-110 FT & ST
p,i,c
>100
7
crystal vitric ash
pm>bw n = 1.513-1.518
pi; opx, cpx opx7 = 1.702-1.705
unpublished
Kutcharo
Ko-Hb
100-130 FT & ST
i,c
>150
7
vitric ash
bw=pm n = 1.502-1.505
pi; opx,cpx opx7 = 1.707-1.710
Arai et al (1986)
Ata?
Torihama
120-140 U
p,i
100?
7?
crystal vitric ash
bw>pm n = 1.498-1501
qt,pl; ho,opx,bi opx7 = 1.714-1.718 ho n2 = 1.673-1.679
unpublished
pm, pumiceous glass; bw, platy bubble walled glass; af, alkali feldspar; pi, plagioclase; qt, quartz; oi, olivine; opx, orthopyroxene; cpx, clinopyroxene; ho, hornblende; bi, biotite. n, nl, n2, 7, refractive index of glass and phenocrysts.
CATASTROPHIC VOLCANISM IN JAPAN
FT, fission-track method; U, Uranium-series method; TL, thermo-luminescence method; ST, stratigraphic method, p, plinian eruption; pp, phreatoplinian eruption; i, ignimbrite forming eruption; c, coignimbrite ash fall.
31
32
HIROSHIMACHIDA
Table 2 Frequency of the largest eruptions reported in and around Japan.
VEI (total volume) 6 7 5 tt0-100km3>) flOO-lOOOkm)
Period fka^
5 ri-10km5>)
130-70 70-10 10-1.5 1.5-0
>38 >80 >14 14
>8 21 3 1
6 3 1 0
Late Quaternary
>146
>33
10
shows, for Quaternary volcanoes of Japan and Korea, the maximum magnitude of eruption that occurred in the late Quaternary (i.e., the maximum size of destructive eruption that has occurred and can therefore be predicted will occur in the future), the lapse of time since the last major eruption, and the frequency of major eruption. It must be remembered that long-quiescent caldera volcanoes, such as Aso, Ata and Toya, with no significant explosive activity (VEI 7) during these 60-70 ka, are the most hazardous. The recurrence of such a huge volcanic event would be of catastrophic consequence in the highly populated areas of modern Japan. The impact of large-scale pyroclastic flows and associated ash falls on flora and fauna, as well as human beings, is difficult to predict. Incidentally, the Aso-4 pyroclastitic flow deposit of c.70 ka BP, one of the largest pyroclastic deposits in the world, covers a land area of 30,000 km2, where about 10 million people are living now. The effects of such extreme events in the future will almost certainly result in cultural destruction and replacement over a vast area. Consequently such tephrochronological studies as mentioned here will be significant for considering future eruptions and their effects in highly volcanic areas of the world. It would be instructive to know, therefore, the impact of major late Quaternary eruptions on prehistoric communities. We now turn to an example of one such eruption.
THE KIKAI-AKAHOYA ASH AND PREHISTORIC SETTLEMENT The Kikai-Akahoya ash (K-Ah) represents the biggest explosive event in the Japanese Holocene (Figs 1 and 2). More than fifty radiocarbon dates of this ash indicate that the eruption occurred around 6.3 ka BP
(Machida & Arai 1983). Machida (1984) discussed how great this volcanic impacts were to human beings and their environment on the basis of joint studies between volcanology and archaeology. Volcano-stratigraphical studies on the ejecta associated with the K-Ah ash show that paroxysmal activity of the Kikai caldera, largely submerged to the south of Kyushu (Fig. 1), started with a plinian eruption, followed by the concentric spread of ignimbrite as low-aspect ratio pyroclastic flows (Walker et al. 1980), reaching 100 km distant from the source (including across the sea) (Fig. 1). The ignimbrite is characterised by highly vesiculated pumice lumps and fine-grained vitric ashes, and has a varied lithic assemblage, including rounded andesite gravels deposited on the sea floor. The K-Ah ash is a fine-grained vitric ash covering the ignimbrite, with many accretionary lapilli at its base. Generally speaking, the K-Ah ash was formed as co-ignimbrite ash fall, generated by the collapse of a large eruption column with high mobility. A considerable part of the ash accumulated as aggregates in a wet condition (accretionary lapilli). The K-Ah ash occurs in extensive areas from Kyushu to central Honshu far beyond the limit of ignimbrite and is also recognized in several piston cores from the southern part of the Sea of Japan, the northwest Pacific Ocean, and the East China Sea (Fig. 1). The bulk volume of tephra including plinian pumice, ignimbrite and co-ignimbrite deposits is estimated to be more than 150 km3. When the great Kikai eruption took place about 6.3 ka BP, most of the Japanese islands were occupied by neolithic Jomon people. The Jomon ceramic culture is characterised by pottery with special corded design (Jomon) and lasted from c.12 ka to c.2.3 ka BP. It was founded on an economy of hunting, fishing and gathering; agriculture was not practised (Tsuboi 1987). It would be expected that the Jomon culture in the southern part of Kyushu would have perished in the holocaust of pyroclastic flows and that almost the whole of southwestern Japan, the area surrounded by the 20 cm isopach in Figure 3, would have been significantly devastated by ash falls (probably damp) and associated events such as tsunami. In fact there is abundant evidence that the ash falls induced severe landslides and slope erosion in the mountainous areas of central Kyushu, Shikoku and Kii districts. Patches of ash scattered throughout debris avalanche and slope deposits indicate swarms of mass movement associated with, and perhaps triggered by, ash falls (Machida & Arai 1983). Also, flood deposits of thick,
CATASTROPHIC VOLCANISM IN JAPAN
Cal d e r a
Age (ka)
Volcano
i
121 i i
111 i i
Kutcharo
HOKKAIDO
33
| .|
i
II. .
. 41.
21 .
wci /bu I k . v t l 1 volume' km3
7
100-
6
10-100
Shikotsu T o y a
To wad a
K Y U S H U
A
s
o
A i r a A
t
Ignimbrite * forming
Rinian
a
KOREA
K i k a i Ba eg d u U I r eung
Fig. 2 Eruptive histories of large caldera volcanoes.
water-laid ash beds bearing large quantities of logs washed away by the floods are found within all deltaic sediments in Kyushu and Shikoku. These data indicate that extensive devastation was associated with the ash falls, and that severe flooding happened repeatedly. Torrential mud-rain and perhaps eruption-induced storms might have taken place and caused the death or significant decline of plants. The extensive occurrence on alluvial plains of large amounts of volcanic sand derived from the ash suggests that many large sand dunes were formed immediately after the eruption on the coasts of southern Kyushu and Shikoku. It seems doubtless that the K-Ah eruption induced a significant change in landforms over a vast area and must have produced a significant decline of natural
productivity over this same area. Neolithic Kyushu has been studied in detail by archaeologists who have identified regional occupation sequences. Shinto (1978) and Machida and Arai (1983) suggested a major cultural discontinuity between the pre-ash earliest Jomon phase of culture and the post-ash early Jomon phase. Prior to the eruptive episode, Kyushu was occupied by an indigenous or native culture represented by the Senokan-B style potteries. This cultural layer overlies those containing Senokan-A and Kyushu-kaigara-mon style pottery and imported pottery with a roller pattern, namely the Oshigatamon style. These pottery styles, however, are not found at all in the sediment immediately overlying the K-Ah ash. This indicates that people with the pre-ash Jomon culture in southern Kyushu either dispersed to
34
HIROSHIMACHIDA
Fig. 3 Japanese volcanoes classified in terms of the maximum eruptive magnitude in the late Quaternary, lapse of time since the last major eruption, and recurrence interval of major eruptive activity.
CATASTROPHIC VOLCANISM IN JAPAN 35 the northwestern part of Kyushu and adjacent areas, VEI 7 have occurred underwater, and hence are where volcanic impact was not so severe, or that they mostly of the devastating phreatoplinian type. totally perished in the area. Significantly, a lack of cultural continuity during this time span has not been reported from northwestern Kyushu. ACKNOWLEDGEMENTS The assemblage of Jomon ceramics and associated artifacts from immediately above the Kikai ash is I thank Professor Fusao Arai for his long-term quite different in origin and style from those below support of the tephrochronological studies. I gratefully the ash. This indicates a drastic changes in the acknowledge the critical editorial comments of Drs character of the Jomon ceramic culture in south to Russell Blong and Ray Cas. central Kyushu in association with the explosive event (Shinto 1978). The Jokon-mon style ceramic culture found immediately above the K-Ah ash had its origin REFERENCES in east and/or central Honshu and must have been brought westward to Kyushu by post-eruption ARAI F. & MACHIDA H. 1980. A catalogue of marker-tephra layers of the late Quaternary age in Honshu and Kyushu, Japan. immigrants. Zasshi 6, 65-76. These data indicate that southern Kyushu was ARAIKaruishigaku F., MACHIDA H., OKUMURA K., MIYAUCHI T., SODA T. & abandoned temporarily after the volcanic event, and YAMAGATA K. 1986. Catalog for late Quaternary marker-tephras in Japan II - Tephras occurring in northeast Honshu and then reoccupied by bearers of a different cultural Hokkaido - Geographical Report Tokyo Metropolitan University tradition. Radiocarbon dates suggest that migration 21, 223-250. into central and south Kyushu took place 300 to 800 ARAMAM S. & Ui T. 1966. The Aira and Ata pyroclastic flows and years after the Kikai eruption. It is reasonable to related caldera and depressions in southern Kyushu, Japan. Bulletin Volcanologique 29, 29-47. suggest that this time span gives some indication of HAYAKAWA Y. 1983. The Hachinohe ash: An example of an the time needed for recovery of natural productivity accretionary lapilli-fall deposit from Towada volcano, Japan. in temperate to subtropical area such as southern Volcanological Society of Japan Bulletin (Series 2) 28, 25-40. Kyushu. While this interpretation is only one of KANTO LOAM RESEARCH GROUP. 1965. Kanto loamformations - their origin and nature, isopach map geological map, atlas of several possible, the correlation between the timing of columnar sections. Tsukiji-shokan, Tokyo. the archaeological events in Kyushu and the great KATSUI Y. 1959. On the Shikotsu pumice fall deposit. Kikai eruption is both striking and instructive. Volcanological Society Japan Bulletin (Series 2) 4, 33-48. t
KOBAYASHI K, MINAGAWA K, MACHIDA M , SHIMUZU H & KITAZAWA
CONCLUDING REMARKS Tephrochronological studies on the widespread tephras from large caldera eruptions led to the conclusion that these ashes were supplied from the large-scale explosive activities of exceptional magnitude (VEI 7 or more) and that the eruptions had significant impacts on human beings and the environment over a vast area. The recurrence of such a volcanic event would be of severe consequence anywhere in the world. Fortunately, such highly explosive volcanism does not occur frequently in any one volcanic centre. The eruptive history of the caldera volcanoes in Japan suggests that such large events, of the order of the 1815 eruption of Tambora, have occurred at intervals of tens of thousand years or more during the late Quaternary. In and around Japan large eruptions of the size of Mount St. Helens (1980) have occurred at an average of once a century and those like Krakatau (1883, VEI 6), twice or three times per ten thousand years. It is noteworthy that such major eruptions with
K. 1968. The Ontake pumice-fall deposit Pm-I as a late Pleistocene time-marker in central Japan. Journal of the Faculty Science, Shinshu University 3, 171-198. MACHIDA H. 1975. Pleistocene sea level of south Kanto, Japan, analysed by tephrochronology. In Suggate R.P. & Cresswell M.M. eds. Quaternary Studies. Royal Society New Zealand Bulletin 13, 215-222. MACHIDA H. 1984. The significance of explosive volcanism in the prehistory of Japan. Geological Survey ofJapan Report 263,301313. MACHIDA H. & ARAI F. 1976. The discovery and significance of the very wide-spread tephra: The Aira-Tn ash. Kagaku 46, 339347. MACHIDA H. & ARAI F. 1978. Akahoya ash - A widespread marker erupted from Kikai caldera, southern Kyushu, Japan. Quaternary Research Japan 17, 143-163. MACHIDA H. & ARAI F. 1979. Daisen Kurayoshi pumice: Stratigraphy, chronology, distribution and implications to late Pleistocene events in central Japan. Geographical Journal (Tokyo) 88, 313-330. MACHIDA H. & ARAI F. 1983. Widespread late Quaternary tephras in Japan with special reference to archaeology. Quaternary Research Japan 22, 134-148. MACHIDA H., ARAI F., LEE B-S., MORIWAKI H. & FURUTA T. 1984.
Late Quaternary tephras in Ulreung-do Island, Korea. Geographical Journal (Tokyo) 93, 1-14.
MACHIDA H., ARAI F. & MOMOSE M. 1985. Aso-4 ash: A
widespread tephra and its implications to the event of late Pleistocene in and around Japan. Volcanological Society Japan Bulletin (Series 2) 30, 49-70.
36 HIROSHIMACHIDA MACHIDA H., ARAI F. & MIYAUCHI T. 1987. Toya ash - A
SHINTO K. 1978. Volcanic ashes in south Kyushu with special widespread late Quaternary time-marker in northern Japan. reference to archaeology. Dorumen 19, 40-54. Quaternary Research Japan 26,129-145. SIMKIN T., SEIBERT L., MCCLELLAND L., MELSON W.G., BRIDGE D., MACHIDA H. & MORIYAMA A. 1969. The development of Mt. Fuji NEWHALL C.G. & LATTER J. 1981. Volcanoes of the World. and Mt. Hakone volcanoes analyzed from the Smithsonian Institution. Hutchinson Ross. tephrochronological study in the Ooiso Hill. Geographical SPARKS R.SJ . & WALKER G.P.L. 1977. The significance of vitricReview of Japan 41, 241-257. enriched air-fall associated with crystal-enriched ignimbrites. NEWHALL C.G. & SELF S. 1982. The volcanic explosivity index Journal of Volcanology and Geothermal Research 2, 329-341. (VEI): An estimate of explosive magnitude for historical TSUBOI K. ed. 1987. Recent Archaeological Discoveries in Japan. volcanism. Journal of Geophysical Research 87 (C2), 1231-1238. UNESCO & the Centre for East Asian Cultural Studies, ONO K., MATSUMOTO Y., MIYAHISA M., TERAOKA Y. & KAMBE N. Tokyo. 1977. Geology of the Taketa district. Quadrangle Series TSUYA H. 1955. Geological and Petrological Studies of Volcano Kagoshima No. 23, Geological Survey of Japan. Fuji (5). Earthquake Research Institute University of Tokyo 33, OTA Y. & MACHIDA H. 1987. Quaternaiy sea-level changes in 341-382. Japan. In Tooley, M J. & Shennan, I. eds. Sea-level Changes. WALKER G.P.L., HEMING R.F. & WILSON CJ.N. 1980. Low-aspect pp.182-224. Blackwell, London. ratio ignimbrites. Nature 283, 286-287.
Geological Society of Australia Symposium Proceedings (1990) 1, 37-49.
Some effects of sea level rise on riverine and coastal lowlands. John Chappell
Department of Biogeography and Geomorphology, Resarch School of Pacific Studies, Australian National University, Canberra, ACT 2601, Australia. Lowland plains arc vulnerable to any future rise of sea level. The effects of tidal inundation and increased fluvial flooding are offset by sedimentation. Sediment budgets and distribution processes will differ from those occurring at present. Many coastal and riverine lowlands were invaded by rising sea level in early Holocene times; stratigraphic and radiocarbon dating studies of that period are essential for modelling the effects of any future rise. Inland from the coast, tidal range and fluvial sediment input are two important variables affecting the response to sea level rise. This is illustrated with studies of early to mid Holocene history of two contrasting lowland systems: the South Alligator plains in northern Australia (macrotidal, small input of fluvial sediment), and the lower Sepik/Ramu in Papua New Guinea (microtidal, with high input of fluvial sediment). Results from the South Alligator suggest that plains of this type will revert to widespread mangrove swamp which may aggrade with marine sediment as sea level rises. Results from the lower Sepik/Ramu indicate that in plains of this type, fairly widespread marine flooding will occur before sedimentation can keep pace with rising sea level. The conclusions appear contrary to initial expectation, emphasising the importance of such Holocene studies for predicting the future of lowland systems. A framework for systematic investigation is outlined. Key words: sea level, floodplains, Holocene, northern Australia, Papua New Guinea.
INTRODUCTION Riverine and coastal floodplains are amongst the most populated and productive lands in the world. They also are highly vulnerable to changes of sea level. Rising sea level will cause rivers to flood their plains more frequently, and will cause tidal flooding of estuarine and coastal plains. A rise of a few metres could greatly affect the ecology and agricultural useability of these lands. A larger rise may radically alter physical geography and population patterns, and even the political geography. Implications for coastal lands now receive wide attention (Carter 1987; Titus 1987), the Pacific area included (Task Team 1988, 1989). During the Quaternary period, wide-scale physical changes occurred as sea level retreated and advanced across continental shelves, with repeated growth and decay of the ice caps. The extent of such changes in the Australasian region is illustrated by late Pleistocene exposure of the wide shelves of Sundaand Sahul lands, central to the question of prehistoric human migrations (Birdsell 1977). That Quaternary sea level variations with amplitudes exceeding 100 m occurred repeatedly is clear from oxygen isotope
curves from deep sea cores (Shackleton & Opdyke 1973) arid direct sea level records (Chappell & Shackleton 1986). Curray (1964) recognised that sea level rise does not necessarily cause marine transgression (invasion of the land by the sea), because coastal sedimentation might keep the rising sea at bay. However, the effect of rising water level on lowlands inland from the coast needs careful examination, and this paper is concerned with the extent to which tidal and fluvial flooding are increased by a given rise of sea level. This is affected by factors such as floodplain slope and form, both in the downstream direction and away from the river. Flooding also is affected by the extent to which sedimentation can keep pace with rising tidal and flood levels. Without sedimentation, tidal flooding will extend across all land up to the new high spring tide level. The degree to which fluvial flooding increases upstream depends on the floodplain slope, and the new position of the high-tide shoreline. Some of these primary factors are illustrated in Figure 1, which shows a floodplain divided into estuarine and fluvial portions. In this hypothetical example, the tidal limit is taken as the furthest point upstream where highest tide levels are just below the
38
JOHN CHAPPELL
Fig. 1 Schematic lowland floodplain, divided into estuarine and fluvial segments. Tidal limit is defined here as the point beyond which flooding is purely fluvial; the floodplain gradient changes at this point. When sea level rises by h, high spring tides reach contour h. If estuarine sedimentation keeps pace with rising sea, tide limit moves to t2 on the original fluvial profile. Concurrent fluvial sedimentation can move the tidal limit seawards of t2, to t3.
floodplain level, when the incoming river is at base flow. Upstream of this point, sedimentation on the floodplain essentially isfluvial,at times when the river floods. Downstream, sedimentation may be partly fluvial but tidal flooding and sedimentation also occurs. In focussing on flooding and sedimentation, tidal limit in this sense differs from conventional definitions, which are in terms of the upstream limits of tidal rise and fall, or of the furthest point of tidal current reversal. In Figure 1, the estuarine plain is assumed to lie just above high spring-tide water level (HSWL) in the adjacent river, and the fluvial plain is graded to the surface of a standard flood, such as the mean annual flood. Figure 1 illustrates some alternative consequences of sea level rise. Without sedimentation, tidal flooding extends to the contour corresponding to the new HSWL. If the fluvial floodplain gradient is the same above this new "shoreline" as it was below it, river flooding is little affected. Alternatively, estuarine sedimentation may occur on the estuarine plain and keep pace with rising sea level. If the tidal limit moves to the contour corresponding to the new HSWL, then fluvial flooding might not be affected. If
the tidal limit moves seawards, then the fluvial plain will aggrade or fluvial flooding will increase. It is noted that this is geologically a static case, and isostatic flexure which might occur, if sea level rise and sedimentation are prolonged, is not considered. Figure 1 is oversimplified, but it shows that the rate of sediment input to floodplains should be measured, to estimate the changes which might take place if sea level rises in future. It also shows that processes of sediment movement and deposition must be understood. In real cases these will be more complex than Figure 1 suggests. New sediment is not likely to be distributed uniformly, particularly if its rate of supply is insufficient for the floodplain to keep pace. The tidal part of the river will also change if its channel has to adapt to increased flows caused by overbank tidal flooding. This may affect the flow dynamics and sedimentation within and beyond the tidal reaches. The problem may be addressed using computer models, based on hydrology, geomorphologic processes, and channel hydraulics. In the author's view, our knowledge is insufficient at present to make judgements on the basis of models alone. The effect
of rising sea level on channel migration, and on lateral versus vertical floodplain sedimentation, are examples where modelling is difficult at present. Moreover, as models are put together, they will require testing, ideally before the future is with us. Hence, the actual behaviour of riverine lowlands under various conditions of past sea level changes should be examined. The Holocene period (the last 10 ka) is most appropriate, as sea level was rising rapidly until about 6.5 ka BP, and has been relatively stationary since. Present riverine lowlands evolved during this period, and their behaviour during the rising sea level phase is recorded in shallow subsurface deposits. Several boundary variables dictate the framework for investigation. Directly affecting tidal and flooding behaviour are tidal range and type (semidurnal, diurnal, or mixed), and hydrologic parameters such as seasonal variation between base flow and flood flow levels. Sediment texture and sediment load affect geomorphic processes such as channel behaviour and sedimentation in the fluvial plain (Schumm 1977). It will be shown that interaction between fluvio-tidal factors and sediment input affects the estuarine system and its response to sea level rise. The planform shape and sedimentation patterns of the estuary and its adjacent coast are highly influenced by ocean wave and river discharge regimes, as Wright and Coleman (1973) and Wright (1977) have shown through studies of deltas. In focussing on the effects of sea level rise upon the deltaic-estuarine system (Fig. 1), this paper uses a simple two-variable framework comprised of tidal range versus fluvial sediment input. Following an outline of Holocene sea level changes, two contrasting examples of the effects of Holocene sea level rise on riverine lowlands are examined. The case studies are located in northern Australia (macrotidal, low fluvial sediment input), and northern Papua New Guinea (microtidal, highfluvialsediment input), respectively. Their position in the regional western Pacific tidal, and tectonic context is shown in Figure 2. Following their discussion, they are placed in the broader framework defined by the boundary variables, and conclusions then are drawn about the need for such studies of other systems in this frame, anticipating that sea level may rise in the future. HOLOCENE SEA LEVEL CHANGES The Holocene epoch follows the last Pleistocene ice age, and throughout is climatically more similar to the present than to the ice ages. Starting about 17 ka
SEA LEVEL RISE AND LOWLANDS 39 BP, rising sea level caused by ice melt flooded the continental shelves. This large-scale rise essentially was complete by 6.5 ka BP, when sea level began to stabilise, although there have been smaller changes since then which differ throughout the world (Tooley & Shennan 1987; Devoy 1987). Differences of relative sea level changes from one landmass to another are explained geophysically. (i) The sea surface seeks a figure which is in gravitational equipotential with the shape of the solid earth, which includes icecaps on land. (ii) Changing the mass of water by forming or melting icecaps causes isostatic changes of the solid earth, globally as well as in the ice cap regions. The effects on sea level of both factors have been analysed by Clark et al. (1978), and by others, and the problem recently has been analysed with considerably higher spatial resolution by Nakada and Lambeck (1988, 1989). The amount of sea level rise between 17 ka and 6.5 ka BP has been debated, as a world average, but probably amounts to 130 m (Chappell & Shackleton 1986; Nakada & Lambeck 1988). It is reasonably certain that sea level rose by about 30 m between 10 ka and 6.5 ka BP, relative to mainland and island coasts in the western Pacific (Thom & Roy 1985; Hopley 1987). Sea level since then has been comparatively stable, although the pattern varies from place to place. Relative to many lower latitude Pacific coasts and islands, it reached a peak a metre or two above present somewhere between 6 ka and 3 ka BP. The magnitude and timing of this peak vary with place (see, for example, Hopley 1987), and are generally consistent with geophysical predictions (Nakada & Lambeck 1988). Following the peak, relative sea level fell gradually to its present position. Exceptions to this pattern in the Pacific should be noted. Due essentially to combined ice-melt history and isostatic effects, sea level relative to some parts of the ocean basins, including the outer parts of their marginal shelves, is expected not to have reached its present position until recently (Nakada & Lambeck 1989). Chappell et al (1982) and Hopley (1987) noted evidence suggesting this. There also is evidence that relative sea levels fluctuated by 1 to 2 m, in some parts of the world such as the North Sea region, in the last 6 ka (Shennan 1987). Such evidence has been elusive in the Australian region, and, when looking for analogues to possible future sea level rise, it is probably safest not to pursue these minor changes.
40
JOHN CHAPPELL
TIDAL RANGE (metres) <2
2-4 4-6 >6
TECTONICS High Intermediate Low
Fig. 2 Western Pacific - Eastern Indian Ocean region, showing tidal range (from Times Atlas of the Oceans), and generalised tectonic activity (Asia excluded). Positions of lowland systems described in this paper shown at A (South Alligator) and S (Sepik-Ramu). metres
Selected sea level curves for the last 10 ka are generalised into a single envelope in Figure 3. The effect of Holocene sea level on riverine lowlands in the Australian region can be considered in two episodes, the first from 10 ka to 6 ka BP, when it was rising at 0.6 to 1.0 m/100 years, and the second from 6.5 ka BP to the present when it has been nearly stable. During the rising phase, the sea transgressed upon land, and valleys were drowned, these effects being offset to some extent by sedimentation. The rate of sea level rise at that time was similar to the future rise predicted for the greenhouse effect. The sedimentary record of this period is relevant to future problems, because it indicates the patterns of sedimentation which occur when sea level is rising rapidly.
5-
0-
Thousand years before present
10
8
I
0
-5-10-
-20-
-30-
-40-
Case 1: High tidal range, low sediment input -50 -
This case is represented by the South Alligator and other rivers in Northern Territory, Australia. The region is geologically ancient, dominantly Proterozoic, and generally below 300 m elevation. Tectonic movements have been negligible at least since the Cretaceous, and, although relief is rugged in places,
Fig. 3 Holocene sea level: for most places in the Australian region, sea level of the last 10 ka falls within the stippled region. The rising limb of the curve follows Thorn and Roy (1985). For some small islands in oceanic and outer shelf regions, sea level of the last 65 ka may lie between the dashed line and the horizontal axis. Curve for the last 6 ka based on Chappell et al. (1982) and Hopley (1987).
SEA LEVEL RISE AND LOWLANDS the regolith is generally stable. The fluvial sediment input to the estuarine system has been estimated by several methods to be no more than 4 x 10⁴ t/year (Woodroffe et al. 1986). Averaged over the catchment, this is a yield of 5t/km2/year, very low compared with Schumm's (1965) global estimate for tropical environments. The South Alligator river is tidal for 100 km or more, flowing through floodplains which lie only slightly above high tide levels, and roughly resembles the simple model in Figure 1. The climate is monsoon tropical, with a long dry season (McAlpine 1976). The South Alligator floodplain away from the river includes freshwater wetlands which actually lie below highest tide levels, but are protected from tidal invasion by convexity of the plain, which has the form of low river levees (Woodroffe et al. 1986). Freshwater flow is substantial for a month or two in the wet season, and the lower tidal reaches of these rivers become progressively more saline through the dry season. Tidal currents in rivers such as the South Alligator and Daly are strong, at peak exceeding 2m/s, maintaining high suspended sediment concentrations (1 to 10g/l) through repeated reworking of their beds (Woodroffe et al. 1986; Wolanski et al. 1988). It would seem that rising sea level would drown these floodplains to a depth, at high spring tide, nearly equal to the sea level rise. Estuarine floodplain sedimentation has been very slow, amounting to 0.5-1.5 m over the last 5 ka, gauged from extensive shallow drilling and radiocarbon dating (Woodroffe et al. 1986). However, the Holocene history of these systems shows that the effect of sea level rise is not a simple matter of drowning. The Holocene history of the South Alligator estuarine plains and tidal river (Fig. 4) is now reviewed, based on work by Woodroffe et al. (1986) and Chappell et al. (1990). The plains, which today are inundated seasonally by fresh water with localised tidal incursions, are built over muddy sands which were deposited in a long and rather shallow valley during the Holocene. The nature and age-structure of these sediments is known from 131 stratigraphic drillholes and 149 radiocarbon dates (Woodroffe et al. 1986). Today the plains are covered in sedges and grasses. Conditions around 6 ka ago were very different. Mangrove swamp, flooding with salt water at every tide, covered most of the South Alligator plains. Its extent around 6 ka ago is mapped in Figure 4. It is important to recognise that this mangrove developed when sea level was rising. The history of deposition beneath the floodplain, shown
41
diagrammatically in Figure 5, illustrates this. Away from the central river channel sediments, most of the floodplain is underlain by fine-textured mangrove muds up to 8-14 m thick. Radiocarbon dating shows that most of this accumulated between 8 ka and 6 ka BP, while sea level rose by 12 m. Mangrove swamp sedimentation throughout the valley virtually kept pace with rising sea level from 7 ka to 6 ka BP, while sea level locally rose 6m (Woodroffe et al. 1986, 1987). Pollen analysis shows that mangroves were vigorous Rhizophoraceae communities throughout (Chappell & Grindrod 1985; Woodroffe et al. 1985; Grindrod 1988). The mangrove sediments contain between 10 and 95% silt and clay, averaging about 80% (unpub. data). Hence, vertical accumulation of clastic sediments averaged 5 m/ka from 7 ka to 6 ka BP. The fact that mangrove sedimentation kept pace with sea level appears surprising, given that the annual sediment input from the South Alligator catchment is estimated to be 4 x 10⁴ t/year. Distributed over the estuarine plain (900 km2) with a consolidated bulk density of 1.8 t/m3, this would give a vertical accumulation rate of 0.025 m/ka, much less than occurred during the late stages of the Holocene sea level rise. Other sediment sources must be implicated, and understanding this is important for the question of future sea level rise and its effects. Table 1 summarises the volumes of sediment which accummulated beneath the estuarine plain and adjacent coastal plain, in 2 ka intervals since 8 ka BP (from Chappell 1988). The progressive increase in area of the estuarine system has been taken into account in compiling Table 1. These results show that the volume deposited during the interval of rising sea level, from 8 ka to 6 ka BP, is at least 30 times greater than in the last 2 ka. Although the estimate of present fluvial input (4 x 10⁴ t/year) may be too low, the difference from the 6ka to 8 ka BP period is so large that Woodroffe et al. (1986) and Chappell (1988) concluded that the
Table 1 Sedimentation in 2 ka intervals since 8 ka BP, South Alligator plains (from Chappell 1988). Period (ka BP)
Mean thickness(m)
8-6
Volume (m5)
Volume/year (m3/year)
8
3x10*
1.5x10*
6-4
1
5x10*
4-2*
05
4x10 s
2.5X10⁵ s
2-0*
0.1
10*
2x10 5x10*
* Estimates shown are maxima for these periods.
42
JOHN CHAPPELL
kilometres
Big swamp mangrove in core Riverbank exposure of big swamp Track of meandering river Mangrove area (proven) Mangrove area (inferred) Estuarine sedimentation Shallow marine sedimentation over drowned mangrove forest
Fig. 4 Plains of the South Alligator tidal river, including channel and track of meanders of last 5 ka. Hachured areas were mangrove swamp 7 ka to 55 ka BP, during the last stage of rising sea level. Numbers show radiocarbon ages of mangrove deposits within a few metres of present plain surface (after Woodroffe et al. 1986)
SEA LEVEL RISE AND LOWLANDS
43
Fig. 5 Three stages in the evolution of the South Alligator estuarine plain. From left to right: rising sea level transgresses prior valley, and marginal mangroves are established; sea level stabilises and widespread mangrove fills valley; thin fluvial sediment covers former mangrove after sea level has been stable for 6 ka. Estuarine sediments, stipple; mangrove sediments, black; fluvial facies, dashed.
bulk of the sediment moved into the valley from the seaward direction, as sea level rose. Strong tidal currents, caused by the large tidal range, probably were an important agent for redistributing sediment. In the early stages of marine invasion, a significant amount of sediment also may have come from widening of the channel itself, as it changed from a relatively narrow seasonal river to a large tidal estuary. In summary, strongly tidal rivers such as the South Alligator, and others in northern Australia which flow through long floodplains in shallow prior valleys, filled with sediment under vigorous mangrove forest when sea level was rising at about 0.6 m/100 years. The surface of the mangrove swamps kept pace with rising sea level, and most of the sediment apparently came from a seaward source. These swamps were not succeeded by sedge/grass plains and wetlands until sea level had stabilised. We now turn to the possible effect of a future sea level rise. In cases such as the South Alligator River, sediment carried by floods from the catchment and deposited on the plains will not keep pace with anything but the slightest rise in sea level. The average vertical accretion in the South Alligator over the last 2 ka is less than 0.1 m (Table 1), and measured sediment yield from the catchment barely accounts for even this. A rise of 0.3 to 1.0 m in the next 100 years, forecast as likely (Hoffman 1984), will cause widespread tidal flooding. The question is whether flooding will increase in depth if sea level continues rising over several centuries. The Holocene record provides some information about this. About 8 ka ago, rising sea level flooded the prior South Alligator River and its alluvial plain. Extensive drilling (Woodroffe et al. 1986) shows that sandy alluvium of the prior floodplain occurs widely beneath
the mid-Holocene mangrove sediments. Although the gradient and channel pattern of this prior system are unknown, the changes which followed tidal flooding should resemble those which will occur if sea level rises in future. Two features stand out. (i) Sedimentation under mangroves kept pace with rising sea level, throughout most of the valley. Most of this came from the seaward direction, and was distributed by tidal flooding. The flooding depth must have been sufficient for tidal flows to convey sediment throughout the mangrove, (ii) Tidal flooding depth is indicated by the composition of the mangrove communities. Those are known from pollen analysis to have been dominantly Rhizophora plus Bruguiera and Ceriops, indicating spring-tide depths of 0.4 to 1 m througout the sea level rise (Chappell & Grindrod 1985; Grindrod 1988). A future sea level rise is expected to have similar effects. Sedimentation on the South Alligator plain is unlikely to accelerate until spring-tide flooding exceeds 0.4 m, or more, by which time mangrove will have replaced the present sedge- and grasslands. The degree to which sedimentation then will keep pace with sea level will depend on processes which move sediment into the system from the seaward direction. These are examined later in the paper. Case 2: Low tidal range, high sediment input This case is represented by lowlands of the Sepik and Ramu rivers in Papua New Guinea (location, Fig. 2). These lowlands he astride the collision zone between the western Pacific and Australian crustal plates (Pigram & Davies 1987). Sediment input is high because of high relief, high seismicity, and widespread mass movement in the surrounding mountain ranges (Simonett 1967; Loffler 1977). Annual rainfall in the
44
JOHN CHAPPELL
lower floodplains is about 2000 mm, and ranges from 3000 to over 6000 mm in the mountain catchments. Freshwater discharge is large and is only mildly seasonal, averaging about 5000 m 3 /s for the Sepik and 1000 m 3 /s for the Ramu (Loffler 1977). Spring tide range at the coast is about 1 m. Although tidal rise and fall occurs weakly for about 90 km up the Sepik, measurements by the author in March 1989 show that tidal currents are insignificant. The floodplains include sago swamp, plains forest and grassland, and extensive wetlands. At issue are the extent to which river flooding will increase if sea level rises, and the extent to which the sea will invade lowlands near the coast. As tidal effects are negligible, the processes of tidal redistribution of marine and river bank sediment, which are significant in the northern Australia case, will be unimportant. The rate of sediment supply from the catchments, relative to the size of the lowland basin, is the critical factor. Maintenance of the floodplains and their ecology, with rising sea level, depends on sedimentation on the plains. Plains sedimentation is difficult to estimate from measurements of sediment transported by the rivers themselves. River gauging and measurements of sediment concentrations can provide estimates of sediment supply, but say little about floodplain accumulation. A large part of the sediment load leaves the mouths of the Sepik and Ramu, and is deposited on the sea bed; there is no continental shelf and much of this material cascades to the deep sea floor offshore. Using data from the Department of Water Resources, Port Moresby, and measurements made by the author, the rivers are estimated jointly to carry about 60 million tonnes of sediment annually in the lower Sepik-Ramu. The maximum possible rate of floodplain sedimentation would be roughly 0.3 m/100 years, assuming that virtually no sediment leaves the river mouth. This clearly is not the case at present, as the rivers are below bankfull stage most of the time. The lower Sepik-Ramu basin was invaded by rising sea level in early Holocene times. Figure 6 maps the region, and shows estimated positions of shorelines for 2 ka and 6 ka BP, which have been identified and radiocarbon-dated at some localities (Swadling et al. 1990). These former shorelines are now buried by thick floodplain sediments, and have been identified from shallow drillholes, and river bank exposures observed at times of low flow. Two petroleum exploration wells near the southern side of the basin (Keram 1 and Tsumba 1; Fig. 6) show that Lower Pleistocene marine sediments pass upwards into Upper Pleistocene alternating shallow marine and
non-marine sediments, suggesting interaction between sedimentation and fluctuating sea level in later Quaternary times (Swadling et al. 1990). The last major sea level rise, which began 17 ka BP, appears to have created a shallow inland sea which has since filled with sediment from the Sepik-Ramu catchments. Shorelines in Figure 6 show that this receded rapidly after sea level stabilised at 6 ka BP. The Sepik-Ramu floodplain built up rapidly after sea level stabilised, during recession of the inland sea. Radiocarbon ages from peats and marine beds immediately beneath the alluvial sediments provide estimates of the rate of floodplain accumulation during retreat of the inland sea. Figure 7 shows simplified sections and radiocarbon ages from four localities along the Keram River, which crosses the lower Sepik floodplain. The sites were chosen where sediments of vertical accumulation are exposed in the river banks, avoiding laterally-deposited sediments of the Keram scroll plain. These results indicate vertical sedimentation rates of up to 0.3 m/100 years. Being close to the Keram River, there is a levee effect, and these results will exceed the average rate for the entire plain. However, this figure is similar to the estimate of maximum possible rate, based on direct gauging. If future work produces similar results elsewhere in the basin, it will suggest that most of the Sepik/Ramu sediment was deposited in what is now the floodplain basin during recession of the inland sea. These results must be interpreted carefully, when estimating effects of future sea level rise. The former inland sea is not a scenario for the near future, because it formed during a major sea level rise which invaded the Sepik/Ramu lowland. The future problem concerns the beginning of a possible rise, and its effect on floodwater levels within the river. According to Figure 1, in the absence of sedimentation the area as far inland as the contour (h) corresponding to the new sea level will be more frequently inundated. Figure 1 is over-simplified in that the flooding surface inland to contour h is assumed to be horizontal. This approximation is probably satisfactory where there is a marked increase of gradient from the estuarine to the fluvial system (Fig. 1), but in a case such as the Sepik where the estuarine plain is of negligible size and the river gradient is very low, sea level rise is likely to raise the floodwater surface for some distance beyond h. In the absence of levelling data, the distance inland to which tidal water level variation affects flood level provides a minimum guide. Observations by the writer and Dr E. Wolanski during the March 1989 floods found tidal effects to 100 km
SEA LEVEL RISE AND LOWLANDS
Late Holocene swamp
Radiocarbon-dated sites
Late Quaternary sediments
Conoco drill sites
Successor Basin, Wewak Beds Miocene sediments and volcanics
Thrust
Exploration well
Cretaceous formations Mesozoic-Lower Tertiary plutonics, metamorphics, and volcanics 0 1
45
20 1 kilometres
Holocene shoreline Active volcano 40 I
Fig. 6 Floodplain of the lower Sepik-Ramu, showing approximate locations of regressive shorelines of the shallow Holocene inland sea (after Swadling et al. 1990).
Scroll plain deposits C-14 dated lignites 0i
m
20
i
kilometres
10 I
Alluvium Lignite Littoral and marine sand
Fig. 7 Longitudinal profile of Keram River (location shown in Fig. 5), showing fluvial over littoral/shallow marine sediments, and radiocarbon ages which indicate regression (based on author's field survey; dates from Swadling et al. 1990).
46
JOHN CHAPPELL
upstream with 1 m tidal range at the Sepik mouth. The gradient beyond this point has been estimated at 1:20,000 (Loffler 1977), and 1 m sea level rise thus is likely to increase flooding for another 20 km, or 120 km from the mouth. The importance of obtaining good levelling data in such cases cannot be over-stressed. Floodplain sedimentation is expected to increase, roughly in proportion to the fraction of annual flow which spills onto the plains. Initially the process will be slow, but it may become substantial when tidal flooding penetrates well inland, perhaps to the 2 ka BP shoreline shown in Figure 6. This will tend to restore the conditions which existed when floodplain sedimentation was rapid, during the late Holocene.
PROCESS MODELS FOR PAST CHANGES Two examples have been described, showing how shallow Holocene stratigraphy and radiocarbon dating can provide estimates of sedimentation and geomorphic response under conditions of rising sea level. In a broad sense, both are embayed prior valley systems, and are contrasted in terms of fluvio-tidal parameters and sediment inputs. Generalisation from these to different cases is discussed later in the paper. In both examples, conclusions about the effects of a future sea level rise were speculative for two reasons, (i) Data from the Holocene could be improved in both cases, particularly for the Sepik. The geometry and gradient of the prior floodplains, which were flooded as sea level rose, aire important and poorly-determined factors, (ii) The geomorphic and sedimentary processes which generated the Holocene deposits must be identified, before the Holocene can be used as an analogue for the future. Processes are the basis of predictive models, and the importance of these is illustrated for the case of the South Alligator River. Overbank tidal flooding, caused by rising sea level, initiates the following changes. The total volume of water entering or leaving the estuary is increased by the quantity which floods tidally onto the plains, this runs onto the plains towards the end of flood tide, and runs off during the ebb. The tidal river should enlarge to accommodate the increased flow and channel widening will liberate sediment which potentially can move tidally onto the floodplain, promoting aggradation. However, channel width is related to interaction between flow velocity and properties of the bank materials, and essentially is adjusted to peak velocities. In long macrotidal rivers,
such as the South Alligator, peak velocity occurs during early to mid flood tide, which is of shorter duration and has faster flow than the ebb. The peak will not be affected by tidal flooding onto the plains, if this commences near high tide. Only when tidal flooding becomes so extensive that the new velocities (ebb or flood) exceed the previous peak velocity, will the channel begin to widen, liberating sediment which may contribute to floodplain aggradation. Such processes probably occurred during early stages of Holocene flooding of the South Alligator. However, steady aggradation by 6 to 8 m under mangrove swamp must have involved more sediment than was released by initial widening of the flooded channel. The problem can be dissected into three components, (i) sediment released by channel widening, (ii) sediment transported from a seaward source into the tidal river, and (iii) sediment input from catchment. These are summarised in Figure 8. The channel-widening factor cannot be considered until the other inputs have been assessed, because widening will not occur if floodplain sedimentation keeps pace with rising sea level. Sediment input from seawards appears to have substantially outweighed that from the catchment, in the case of the South Alligator. The writer suggests that the mechanism involved is evaporative pumping; tidal water evaporated from the river and floodplains, during the dry season, must be replaced by net inflow from seawards. Sediment in suspension outside the river will be transported by this inflow. Some sand-size material has been shown by Vertessy and Chappell (subm.) to move upstream, through ebb/flood velocity asymmetry, but this is unlikely to add to the floodplain. A rough estimate of annual accretion to the plains surface can be reckoned from dry season evaporation, mean suspended sediment concentration (SSC) of water entering the river during flood tide, and density of compacted sediment. For the South Alligator, these data are approximately 1400 mm, 0.4 g/1, and 1.8 g/cm3 (Woodroffe et al. 1986), giving annual vertical accumulation of about 3 mm, or about 3m/ka, assuming that tidal suspension of channel sediment continues as sea level rises. The South Alligator plains, under Rhizophoraceous mangrove forest, kept pace with rising sea level between about 7 ka and 6 ka BP, as shown by pollen analysis (Woodroffe et al. 1985; Chappell & Grindrod 1985; Grindrod 1988), while sea level locally rose 6 m (Woodroffe et al. 1987). This exceeds the figure of 3 mm/year which the offshore source might supply today. Whether channel widening provided any of the material is unknown. It is possible that nearshore
SEA LEVEL RISE AND LOWLANDS
47
Fig. 8 Sources of sediment which contribute to infilling of a South Alligator-type plain, during rising sea level.
sediment sources were more extensive, following the major post-glacial sea level rise. Hence, the degree to which the Holocene past can be used to predict the exact response to a future rise is debatable. However, it is clear that the Holocene data provided information for examining models which take account of the processes discussed here.
DISCUSSION AND CONCLUSIONS Any future sea level rise may alter the geography and ecology of riverine and coastal lowlands. This is of obvious concern where intensive agriculture may be affected. Other important areas include those lowlands where there is a strong conservationist interest, such as in Kakadu National Park in Northern
Territory. Superficially, it would seem that the effects of a given rise could be estimated from topographic and hydrologic data. Realistic results are not likely to be reached so readily. Sea level rise is incremental, and at any stage the extent of inundation depends on the quantities of water reaching new levels, the extent of the land being threatened, the paths by which the water reaches these, and the counteracting effects of sedimentation. It is sensible to develop computer models, incorporating such factors, to anticipate effects of future sea level rise. However, calibration of models will need data on sediment budgets. The models should be tested using case studies from the past, as has been done for global climates (e.g. Gates 1976). Studies of the response to the last major sea level rise appear necessary for both purposes. This rise, which
48
JOHN CHAPPELL
106r
Fluvial sediment input (m3/m/year)
105
S-R
104
103
M 102
10-2
1
D
102
S 104
Tidal inflow at mouth Fluvial inflow at tidal limit Fig. 9 Schematic framework for classifying fluvial-eastuarine lowlands and their response to sea level rise. Vertical axis is fluvial sediment input at tidal limit, in m3/metre width of channel/year. S-R = Sepik-Ramu, S = South Alligator, D = Daly River, northern Australia, M = McArthur River, Gulf of Carpentaria. Positions of these estimated from author's data.
commenced about 17 ka BP and finished between 6 and 6.5 ka BP, flooded continental shelves and invaded areas which now are coastal and riverine lowlands. The rate during the final 1 to 1.5 ka was about 0.5 to 1.0 m/100 years depending on location. These values are similar to those forecast as arising from the greenhouse effect (Titus 1987). Contemporary lowlands generally overlie sediments deposited during the later stages of this rise. Close analysis of their stratigraphy, supported by radiocarbon dating, supplies important data on sediment sources, flooding and distributional processes, and rates. Two cases reviewed in this paper, illustrate these points and show why stratigraphic and process studies should be linked. However, there can be differences between the course of events during the earlier Holocene, and those which may occur in future. The Sepik lowland example showed that the inland sea, which formed towards the end of the last rise, was quite a different context for sedimentation from that which will be invaded in the early stages of the next rise. The geometry of prior floodplains in each case must be determined. Generalisation from the examples described here to other cases clearly is unwise without
appropriate field studies. However, the fluvio-tidal and sediment input parameters used here are suggested to be a useful framework for examining lowland systems, and Figure 9 shows how the Sepik, Alligator, and certain other systems are placed relative to these boundary variables. Figure 9 provides a guide to the selection of cases for study, so that a range sufficient for more general prediction might be established. A final point should be made. Sediment input, from both seaward and landward, may have changed. In some cases, coastal and nearshore sediment moved landwards with rising sea level, providing a seaward source which since has dissipated. This may account for high rates of earlier Holocene accumulation in the South Alligator, for example. Catchment sources also may be different. In middle and higher latitudes, slope processes were accelerated under harsher climates and reduced forest cover in the late Pleistocene; in some cases the sediment output from such catchments persisted at high levels into the early Holocene. Finally, catchment denudation and lowland sedimentation have increased more recently in many instances, through agricultural intensification and land degradation. The question of whether such increases
SEA LEVEL RISE AND LOWLANDS altered sediment inputs sufficiently to offset drowning effects is beyond the scope of this paper. However, in order to estimate the future of lowland basins, it does appear necessary to establish and understand their Holocene past. REFERENCES BIRDSELL J.B. 1977. The recalibration of a paradigm for the first
peopling of Australia. In Allen J., Golson J. & Jones R. eds. Sunda and Sahul, pp.113-167. Academic Press, London. CARTER R.W.G. 1987. Man's response to sea-level change. In Devoy RJ.N. ed. Sea Surface Studies, pp.464-498. Croom Helm, London. CHAPPELL J. 1988. Geomorphologic dynamics and evolution of tidal river and floodplain systems in Northern Australia. In Wade-Marshall D. & Loveday P. eds. Floodplains Research, pp.34-57. North Australia Research Unit, ANU, Darwin. CHAPPELL J., RHODES E . G . , THOM B . G . & WALLENSKY E. 1982. Hydro-isostasy and the sea-level isobase of 5500 B P in north Queensland, Australia. Marine Geology 49, 81-90. CHAPPELL J. & SHACKLETON N J . 1986. Oxygen isotopes and sea
49
Land Research Series 38, 35-49. NAKADA M. & LAMBECK K. 1988. The melting history of the late Pleistocene Antarctic ice sheet. Nature 333, 36-40.
NAKADA M & LAMBECK K. 1989. Late Pleistocene and Holocene
sea-level change in the Australian region and mantle rheology.
Geophysical Journal 96, 497-517. PIGRAM CJ. & DAVIES H.L. 1987. Terranes and the accretionary
history of the New Guinea orogen. Bureau ofMineral Resources Journal of Australian Geology & Geophysics 10, 193-212. SCHUMM S A . 1965. Quaternary palaeohydrology. In Wright H.E. & Frey D.G. eds. The Quaternary of the United States, pp.783-794. Princeton University Press, Princeton NJ. SCHUMM S A . 1977. The Fluvial System, Wiley, New York. SHACKLETON NJ. & OPDYKE N.D. 1973. Oxygen isotope and palaeomagnetic stratigraphy of equatorial Pacific core V28-238. Quaternary Research 3, 39-55. SHENNAN I. 1987. Holocene sea-level changes in the North Sea region. In Tooley M J. & Shennan I. eds. Sea Level Changes, pp. 109-151. Basil Blackwell, Oxford. SIMONETT D.S. 1977. Landslide distribution and earthquakes in the Bewani and Torricelli Mountains, New Guinea. In Jennings J.N. & Mabbutt J A. eds. Landform Studies from Australia and New Guinea, pp.64-84. ANU Press, Canberra. SWADLING P., CHAPPELL J., FRANCIS G., AROHA N. & IVUYU B.
1990. A Late Quaternary inland sea and early pottery in Papua New Guinea. Archaeology in Oceania, in press. level, Nature 324, 137-140. TASK TEAM 1988. Potential impacts of greenhouse gas generated CHAPPELL J. & GRINDROD J. 1985. Pollen analysis: key to past climatic change and projected sea level rise on Pacific island mangrove communities and successional changes in north states SPREP region. Australian coastal environments. In Bardsley K., Davie J. & TASK TEAMof the 1989. Studies and reviews ofgreenhouse related climatic Woodroffe C.D. eds. Coasts and Tidal Wetlands of the change impacts on the Pacific islands. Australian Monsoon Region, pp.225-238. North Australia THOM, B.G. & ROY, P.S. 1985. Relative sea levels and coastal Research Unit, ANU Darwin. sedimentation in southeast Australia in the Holocene. Journal CHAPPELL J. & SHACKLETON N.J. 1986. Oxygen isotopes and sea of Sedimentary Petrology 55, 257-264. levels. Nature 324, 137-140. Trrus J.G. 1987. The greenhouse effect, rising sea level and CHAPPELL J., WOODROFFE C.D., & THOM B.G. 1990. Tidal river society's response. In Devoy, RJ.N. ed. Sea Surface Studies, morphodynamics, and vertical and lateral accretion of pp.499-528. Croom-Helm, London. deltaic-estuarine plains in Northern Territory, Australia. TOOLEY M.J. & SHENNAN I. 1987. Sea Level Changes. Basil Zeitschrift fur Geomorphologie in press. Blackwell, London. CLARK J.A., FARRELL W.E. & PELTIER W.R 1978. Global changes WOLANSKI E., CHAPPELL J., RIDD P & VERTESSY R. 1988. in postglacial sea level: a numerical calculation. Quaternary Fluidisation of mud in estuaries. Journal of Geophysical Research 9, 265-287. Research 93, 2351-1361. WOODROFFE C.D., CHAPPELL J., THOM CURRAY J.R. 1964. Transgressions and regressions. In Millar RL. B.G. & WALLENSKY E . 1986. Geomorphological Dynamics and ed. Papers in Marine Geology: Shepard Commemorative Volume, Evolution ofthe South Alligator Tidal River and Plains, Northern pp.175-203. Macmillan, New York. Territory. North Australia Research Unit, ANU Darwin. DEVOY RJ.N. ed. 1987. Sea Surface Studies, Croom Helm, WOODROFFE C.D., THOM B . G . & CHAPPELL J. 1985 Development London. of widespread mangrove swamps in mid-Holocene times in GATES W.L. 1976. The numerical simulation of iceage climate with northern Australia, Nature 317, 711-713. a general circulation model. Journal ofAtmospheric Science 33, f
1844-1873. GRINDROD J. 1988. Holocene Mangrove History of the South
Alligator River Estuary, Northern Territory, Australia. PhD thesis Australian National University (unpubl.) HOPLEY D. 1987. Holocene sea level changes in Australasia and southern Pacific. In Devoy RJ.N. ed. Sea Surface Studies. pp.375-408. Croom Helm, London. LOFFLER E. 1977. Geomorphology of Papua New Guinea, CSIRO/Australian National University Press, Canberra. MCALPINE J.R. 1976. Climate and water balance. In Story R et al. Lands of the Alligator Rivers Area, Northern Territory, CSIRO
WOODROFFE C.D., THOM B.G., WALLENSKY E.P. & CHAPPELL J.
1987. Relative sea level in the South Alligator River region,
north Australia, during the Holocene. Search 18, 198-200. WRIGHT L . D . 1977. Sediment transport and deposition at river
mouths: a synthesis. Geological Society ofAmerica Bulletin 88,
857-868. WRIGHT L.D. & COLEMAN J.M. 1973. Variations in morphology
of major river deltas as functions of ocean wave and discharge regimes. American Association of Petroleum Geologists Bulletin 57, 370-398.
Geological Society of Australia Symposium Proceedings (1990) 1, 51-55.
Cultural changes to ground temperature and anomalies in geothermal data J.P. Cull Department of Earth Sciences, Monash University, Clayton, VIC 3168, Australia Geothermal gradients can be used to demonstrate significant temporal variations in the surface temperature of the Earth. Temperatures measured in boreholes at Berrigan (NSW) and Lancefield (VIC) are consistent with recent well-documented cultural events but there is no evidence for the atmospheric greenhouse effect. The removal of vegetation over a period of 50 years has been accompanied by an increase of 0J&C in the surface temperature; other, longer-term trends can be attributed to Late Quaternary glacier retreat. Abrupt changes in albedo caused by the systematic destruction of groundcover must now be considered in parallel with the conventional greenhouse model. Variations in surface temperature resulting from industrial and agricultural activity may complicate any atmospheric models of climatic change, particularly in marginal areas. Key words: heat flow, climatic change, greenhouse.
INTRODUCTION Higher ground temperatures are predicted in Australia as a result of the greenhouse effect (e.g. Gribbin 1989; Pearman 1988). However no clear trends have been established in the available data to confirm these atmospheric models. Observatory records have been maintained in Australia only for the last 100 years and data obtained prior to 1911 are generally of poor quality (Coughlan 1978). Consequently statistical evidence for the magnitude of the greenhouse effect may remain difficult to establish using conventional techniques. Coughlan (1978) presented data suggesting that temperatures in Australia have increased consistently at rates exceeding 0.1°C/yr since 1940. However except for a 21 year cycle with amplitude <0.1°C there has been no appreciable variation in marine temperatures in the period 1855-1985 (Newell et al. 1989). In contrast, complex statistical models may be required to explain a 7-year cycle in on-shore temperatures with magnitudes exceeding 1.0°C (Tucker 1975). Furthermore, a major contrary trend has been previously obtained by Deacon (1953) suggesting reductions in surface temperature exceeding 1.4°C in the period 1910-1940. Other, long-term constraints on climatic models have been reviewed by Bowler et al. (1976). Geological and geomorphological data obtained in the Snowy Mountains can be interpreted to indicate an extensive glacier retreat commencing at about 15 ka BP; variations in the rates of glacier
retreat and the extent of the associated warming are ill-determined, however. In particular, there are significant ambiguities in any correlations established between rainfall, surface temperature, and vegetation growth rates. Borehole temperatures corrected for variations in thermal conductivity can now be used to avoid these ambiguities. Abrupt changes in surface temperature attributed to cultural activity can be detected by curvature in the geothermal gradient at depths down to 200 m. No meteorological records are required for the interpretation of these geothermal data and consequently they provide independent constraints for models of climatic change.
HEAT FLOW Heat is generated in the Earth principally by the decay of radioactive trace elements contained in crustal rocks (Roy et al. 1968). As a result, temperatures in shallow boreholes generally increase with depth. Linear gradients (10-30°C/km) are expected in homogeneous layers and most anomalies in the subsurface temperature are attributed directly to variations in thermal conductivity. Most geological terranes are assumed to be in thermal equilibrium. In these circumstances all heat produced within the crust is conducted to the surface and is lost to space by radiation at rates conforming to the expression:
52
J.P. CULL Q = U
BOUNDARY CONDITIONS
(i)
where Q (W/m 2 ) is defined to be the surface heat flow, \ (W/m/K) is the thermal conductivity of the rocks in which the gradient is established, and b (K/m or°C/km) is the observed linear gradient.
Sinusoidal oscillations in surface temperature can be used to approximate seasonal and diurnal cycles in solar radiation. Carslaw and Jaeger (1959, p.65) have demonstrated that these perturbations are propagated into the Earth according to the expression
Precise measurements of \ and b are required for calculations of surface heat flow. Temperatures can be measured with a precision better than 0.01°C using thermistor probes calibrated against a platinum standard. Measurements of thermal conductivity are more complicated. Data can be obtained using variations of the divided bar apparatus designed to compare temperature gradients over small samples of core extracted from each hole. Scatter in the data may then be related primarily to inadequate sampling of a complex geological unit. Sampling errors are eliminated in uniform layers (e.g. granite) and a single value can be used to describe the thermal conductivity at any depth. Linear temperature gradients can be anticipated for constant surface temperatures conforming to equation (1). However boundary values for the geothermal gradient are dominated by thermal transients including seasonal and diurnal heating. Consequently, geothermal models are normally constructed from observations of the geothermal gradient at depths exceeding 100 m (and commonly 300 m). Data obtained at shallow depths are normally neglected; these gradients may now be used to demonstrate the extent of any cultural impact on temperatures at the surface.
T = T(0) exp(-6z) sin(0)t-€z) (2) where 0)=27T/P, P is the period, 6 = sqrt(W/2 ), and is the thermal diffusivity. The time-dependent term in this equation results in an effective wavelength of sqrt(47T P), approximately equal to 1.0 m for the diurnal wave and 20 m for the seasonal wave (assuming =1.0E-6 m 2 /s) (Fig. 1). The maximum amplitude of the perturbation is governed by the exponential term in equation (2). At a depth of one wavelength the amplitude of the perturbation is reduced by a factor exp(-27T)=0.0019. Consequently perturbations observed at depths greater than 20 m must be attributed to long-term (secular) changes in surface temperature. Changes of this type can be modelled as a series of discrete events at the surface of the Earth, each event being approximated by a step function increase in surface temperature. Carslaw and Jaeger (1959, p.59) have considered the propagation of a step function in the surface temperature giving the solution T = T(0)erf[z/2 7(/Ct)]
Annual Temperature K = 1 .OE-6
(3)
Wave
Depth ( m )
Fig. 1. Variations in temperature at shallow depth demonstrating seasonal periodicity. Major excursions confined to depths < 10m for sinusoidal model corresponding to summer (S), autumn (Au), winter (W), and spring (Sp).
GEOTHERMAL DATA & CLIMATIC CHANGE 53 Results for a unit change in surface temperature are given in Figure 2. In regions of recent glaciation T(0) may be of the order of 10°C (Crain 1968) and significant curvature is observed in the geothermal gradient at depths greater than 1000 m corresponding to equilibration over periods exceeding 10 ka. Consequently, corrections exceeding 20% may be required for any accurate determinations of regional heat flow based on borehole data (Cull 1980). In Australia glacial perturbations to the geothermal gradient are normally neglected. However data for two boreholes near Canberra are consistent with glacier retreat and continual warming in the period 15 ka to 9 ka BP (Cull 1979). Linear geothermal gradients observed elsewhere may be complicated by systematic trends in thermal conductivity (Hyndman & Everett 1968) obscuring equivalent signatures in periglacial regions. A more pronounced curvature has been observed in the geothermal gradient near Kalgoorlie at depths from 0-150 m; this has been attributed to the rapid removal of vegetation and increased insolation following European settlement (Hyndman & Everett 1968). Similarly Howard and Sass (1964) reported a consistent offset between mean air temperatures and borehole values obtained from geothermal gradients extrapolated to the surface in other areas. It is apparent from these models that observations of the geothermal gradient can be used to provide independent estimates for climatic history in areas of simple geology. In particular any major cultural disturbance (including the greenhouse effect) experienced over periods of 10-100 yrs will be evident at depths from 20-200 m (Fig. 2). Assuming a resolution of 0.01°C (using thermistor probes) individual events can be dated with a precision better than 10%. However multiple events defining a complex change in climate may be difficult to identify and some data may then be poorly interpreted using an equivalent step function response.
BOREHOLE DATA The sensitivity of the geothermal technique can be demonstrated using data obtained at Berrigan in New South Wales (Cull 1980). Gradients were measured to depths of 200 m in a borehole penetrating a granite of uniform composition (Fig. 3). Apart from a sinusoidal segment (AB) resulting from seasonal variations in surface temperature there is a pronounced curvature (BC) at depths less than 60 m. This segment can be attributed to a secular increase
Depth
(m)
Fig. 2. Equilibration rates for step function increase in surface temperature propagating in uniform material. Resolution of 0.01°C provides precision better than 10% for single events.
in the surface temperature of approximately 0.5°C in the area of the borehole applied over a period of 16 years. The timing of this event corresponds with the starting date of short-term quarry operations which resulted in the rapid removal of 3 m of surface rock for road fill. Normally the removal of material at the surface is assumed to be equivalent to a rapid decrease in surface temperature (-0.06°C in this case) but no allowance has been made previously for variations in albedo (generating an increase of 0.5°C). The geothermal record of this well-documented cultural event provides an excellent calibration for more detailed models of climatic change. Apart from a long wavelength feature (DE) corresponding to glacier retreat in the Snowy Mountains at about 15 ka BP, there remains some additional curvature (CD) at depths from 80-140 m. This segment indicates a period of rapid cooling at about 100 years BP but with magnitude less than 0.1°C. The results for Berrigan suggest relatively stable surface temperatures in NSW, a result consistent with data from the Antarctic which indicate only minor fluctuations in the
54
J.P. CULL
19-7
Oj
O 6
Q = 73mWm"2
19 6
X = 3-2 Wm^K"1
J
L
16 100
19-4
YEARS
BP
14000
-
19-3 - —
5 Q:
19-2
C u r v a t u r e c a u s e d by i n d i v i d u a l c l i m a t i c event
6 0
Calculated t e m p e r a t u r e s c o r r e s p o n d i n g to i n s e t ' climatic model. Represents sum of i n d i v i d u a l c u r v a t u r e s
DEPTH (m)
1 2 0
Fig. 3. Perturbations in the geothermal gradient obtained at Berrigan (NSW). Borehole penetrates granite of uniform composition giving constant conductivity. Individual segments correspond to inset model for surface temperature combined with seasonal wave for early summer (Dec 1978). Segment BC results from quarry operations in 1962.
.a n c e f ie I d
0
B o re h o Ie
D a t a
1 7.5-
N ID
Nq d
1
1 6.5
0) 1 5.5 4> O3 Tj ('W tr 1 4.5 CL E
DEPTH (m) Fig. 4. Borehole temperatures measured at Lancefield (Vic) showing curvature in the geothermal gradient related to inset model for surface temperature. Seasonal wave for late summer (March 1982) combined with agricultural activity dating from 1920-1930 (segment BC).
GEOTHERMAL DATA & CLIMATIC CHANGE 55 deposition rates of ice core since 11 ka BP (Lorius et based on blackbody radiation. Apart from a loss of al. 1979). The additional variations of 0.1°C at shade, the destruction of ground cover reduces Berrigan are also consistent with observations in New surface roughness and albedo. Consequently, Zealand suggesting excursions with a magnitude of variations in land-use should be considered in parallel 0.5°C and periodicities from 50-100 years (Wilson et with the atmospheric greenhouse effect. More direct al 1979). contact at the air/earth interface and greater wind Similar perturbations in the geothermal gradient velocity may also result in a significant increase in have been noted at Lancefield in Victoria (Cull 1983). wind erosion and evaporation. These conditions Data were obtained in a borehole penetrating a appear to favour higher ground temperatures with uniform granite to a depth of 160 m and the results greater aridity and further loss of vegetation in were corrected for the effects of glacier retreat (CD) marginal areas. and seasonal periodicity (AB) (Fig. 4). Significant curvature remains in the data (BC) at depths from 20-80 m suggesting an increase in the surface REFERENCES temperature of 0.6°C at 50 years BP. Unlike Berrigan, no rock has been removed from BOWLER J.M., HOPE G.S., JENNINGS J.N., SINGH G. & WALKER D. 1976. Late Quaternary climates of Australia and New Guinea. the Lancefield site. However other cultural effects can Quaternary Research 6, 359-394. be readily identified. The event at 50 years BP CARSIAW H A . & JAEGER J.C. 1959. Conduction of Heat in Solids. corresponds to a period of rapid land clearance. The 2nd ed., Oxford University Press, Oxford. property was first occupied in 1865; large eucalypts COUGHLAN M.J. 1978. Changes in Australian rainfall and temperature. In ed. Climatic Change and Variability, 195-199, were removed during early development but ground University Press, Cambridge. cover was preserved with extensive stands of acacia CRAINCambridge I.IC 1968. The glacial effect and the significance of scrub. Improved pastures were established between continental heat flow measurements. Earth and Planetary Letters 4, 69-72. 1920 and 1930 when all scrub was removed by CULLScience J.P. 1979. Climatic corrections to Australian heat flow data. burning (Patterson, land owner, pers. comm.). BMR Journal ofAustralian Geology and Geophysics 4, 303-307. CULL J.P. 1980. Geothermal records of climatic change in New
CONCLUSIONS In general solar heating and global radiation are considered to be the critical factors controlling variations in the mean annual surface temperature in any location. Long term stability is ensured by the greenhouse effect generated by large volumes of water vapour and carbon dioxide contained within the atmosphere (Linacre & Hobbs 1977). However there is concern that this balance may now be altered by industrial and agricultural activity. Variations in the surface temperature can be detected in the geothermal gradient and well-documented cultural events have been recognised in data obtained at Berrigan and Lancefield. There is no evidence in the existing data for other climatic events corresponding to the greenhouse effect associated with recent atmospheric change. However variations in shading and albedo caused by the removal of vegetation may result in greater insolation at the surface of the Earth independent of atmospheric effects. New geothermal data are required to construct baselines for any future study. Offsets in the surface temperature noted by Howard and Sass (1964) suggest that more general revisions are required for boundary layer models
South Wales. Search 11, 201-203.
CULL J.P. 1983. Cultural changes to ground temperature and
geothermal gradients. Search 14, 101-103.
DEACON E.L. 1953. Climatic change in Australia since 1880. Australian Journal of Physics 6, 209-218. GRIBBIN J. 1989. The end of the ice ages? New Scientist 122, 22-26. HOWARD L.E. & SASS J.H. 1964. Terrestrial heat flow in Australia. Journal of Geophysical Research 69, 1617-1626. HYNDMAN R.D. & EVERETT J.E. 1968. Heat flow measurements
in a low radioactivity area of the Western Australia Precambrian shield. Geophysical Journal 14, 479-486. LINACRE E. & HOBBS J. 1977. The Australian Climatic Environment. Wiley and Sons, Brisbane.
LORIUS C., MERLIVAT L., JOUZEL J. & POURCHET M. 1979. A
30000 yr isotope climatic record from Antarctic ice. Nature
280, 644-648. NEWELL. N.E., NEWELL R.E., HSIUNG J. & ZHONGXIANG W. 1989.
Global marine temperature variation and the solar magnetic
cycle. Geophysical Research Letters 16, 311-314. PEARMAN G.I. ed. 1988. Greenhouse: Planning for Climatic Change. C.S.I.R.O., Melbourne.
ROY R.F., BIACKWELL D.D. & DECKER E. 1968. Heat generation
of plutonic rocks and continental heat flow provinces. Earth and Planetary Science Letters 5, 1-12. TUCKER G.B. 1975. Climate: Is Australia's changing? Search 6, 323-328. WILSON A.T., HENDY C.H. & REYNOLDS C.P. 1979. Short term
climate change and New Zealand temperatures during the last millenium. Namre 279, 315-317.
Geological Society of Australia Symposium Proceedings (1990) 1, 57-70.
Greenhouse effects on atoll islands in the South Pacific Peter Roy1 and John Connell2 1
Geological Survey of NSW, Department of Minerals and Energy, c/~ Department of Geography, The University of Sydney Sydney, N.S.W. 2006, Australia department of Geography, The University of Sydney, Sydney, N.S.W. 2006, Australia.
The combination of rising sea level and increased storminess that is expected to accompany changes in global climate due to the greenhouse effect will have severe impacts on low-lying coral islands in tropical oceans. This paper deals principally with the atoll island states of Kiribati, Marshall Islands, Tokelau and Tuvalu which comprise only coral-rubble islands with land rarely rising more than 3m above present sea level. Their combined populations are more than 100,000 people, and since colonial times, island economies have not achieved self-sufficiency. Presently they are dependent on foreign aid and remittances from islanders who work overseas and this situation is worsening. Atoll ecology and the ability to sustain human habitation depend in large part on fresh ground water reserves which are related to island size. Ground water degradation, due to greenhouse-induced coastal erosion and inundation of low-lying ground, will further reduce agricultural productivity and other island resources. The economic and social viability of atoll island states in the future is therefore doubtful; their people may become the first ecological refugees of the greenhouse era. Key words: Greenhouse effects, sea-level change, atoll islands, island economies, groundwater, coastal erosion, environmental refugees.
H
If the greenhouse effect raises sea levels by 1 metre it will virtually do away with KiribatL.if what the scientists say now is going to be true. In 50 or 60 years my country will not be there" (President I. Tabai, Kiribati, September 1988).
INTRODUCTION No environmental issue has captured public and private imaginations throughout the world more than the 'greenhouse effect'. Indeed, perhaps no environmental issue has ever stimulated such global concern and spawned such a variety of popular and academic speculations about the future. There are at least two reasons for this widespread interest: the effects forecast by prophets of doom are cataclysmic and, at the same time, the scientific community is uncertain over actual rates of climatic change and future impacts. However, scientific studies increasingly are drawing important and consistent conclusions about future trends, and pointing to the regions where the greenhouse effect (GE) will cause the most severe problems. In the event of higher sea levels most coastal dwellers have the option of retreating inland to higher ground. Enormous economic and social dislocations can be expected in some countries, especially those
with rich agricultural land and dense populations in low deltaic plains, but the most extreme situation will be faced by small oceanic states occupying low coral islands on atolls. Here high land does not exist and, if sea level continues to rise, whole populations are threatened. The South Pacific atoll states are particularly vulnerable in this regard because the GE is likely to cause substantial social, economic and political problems which may begin to emerge early in the next century. This paper focuses on the four Pacific atoll states of Kiribati, Marshall Islands, Tokelau and Tuvalu, which are entirely composed of low-relief coral islands (Fig. 1). It does not consider, in any detail, the issues that affect atolls when they are part of larger multi-island states that include high islands, such as the Federated States of Micronesia (FSM), French Polynesia or the Cook Islands (Fig. 1). However most of the discussion that follows, and particularly that concerning Kirbati and Tuvalu, is also relevant for the Maldives and Australia's Indian Ocean Territory, the
58 PETER ROY AND JOHN CONNELL
Fig. 1 Island regions in the Pacific that are composed principally of low coral atoll islands are shown here stippled.
Cocos-Keeling Islands (Woodroffe 1989), whose situations are very similar. The paper briefly reviews past developments and problems in the atoll states and speculates on the potential impact of GE on future development strategies. The socio-political repercussions of GE are reviewed in more detail elsewhere (Roy & Connell 1989).
THE GREENHOUSE EFFECT AND SEA LEVEL RISE The build-up of industrial gases in the earth's atmosphere over the past 30 to 40 years is now well documented (Bolin et al 1986; Pittock 1988; Pearman 1988b; Henderson-Sellers & Blong 1989). The resulting GE is expected to lead eventually to a rise in the levels of the world's oceans (Warrick et al. 1988), initially through expansion of surface waters in the oceans and melting of mountain glaciers (Barth & Titus 1984; Bolin et al. 1986). Not until much later will melting of the polar ice sheets significantly augment the ocean volumes (Budd 1988). Tide gauge records from around the world, analysed by a number of researchers (Gornitz et al. 1982; Barnett 1984; Aubrey & Emery 1983; 1986; Emergy & Aubrey 1986; Pirazzoli 1986; Bryant 1988) indicate a small rise in relative sea level (1.0 -1.5 mm
per year) over the past few decades. However, the results are variously interpreted. Questions that remain to be resolved include (i) the extent to which the distribution of the recording stations can be divorced from regional tectonic trends and local earth movements (Bryant et al. 1988); (ii) whether the apparent sea level changes are due to the global greenhouse phenomenon or to local climatic variability (Bryant 1987; 1988); and (iii) to what extent changes in river discharges to the oceans over the past century due to the building of dams, irrigation schemes and land clearing for agriculture have influenced the global hydrological balance (Newman & Fairbridge 1986). At this stage, a causal connection between GE and the tide gauge data is not proven. Because of uncertainty concerning the pattern and extent of future heating of the earth's surface (Henderson-Sellers & Blong 1989) and the rate at which heat will be absorbed by the oceans (Pittock 1988; Tucker 1988), predictions of rates of expansion of the oceans during the next 50 years range from virtually no change in mean sea level to an elevation many metres higher (Barth & Titus 1984; Hoffman 1984; de Robin 1986). To gauge the extent of the impact of possible sea level rise over the next 50 years, a reasonable upper limit of planning timescales, we have adopted as a tentative, convenient scenario a sea level one metre higher than at present
in 50 years time. In this scenario, rates of sea level rise for the future (averaging 20 mm/year) are similar to those documented during the Postglacial Marine Transgression (PMT) from 18 ka to 6 ka BP (Thorn & Roy 1985; Devoy 1987). Geological data from the past thus provide some basis for modelling future trends. The basic effect of a greenhouse-induced rise in sea level is for low-lying lands to be inundated and for coasts to erode. Erosion is most severe on shorelines composed of unconsolidated sediment exposed to storm wave attack on high-energy coasts. Here, a gradual rise of mean sea level will progressively lift the zone of flooding, storm wave set-up and surge effects to new levels, thereby eroding areas hitherto considered safe (Thorn & Roy 1988). The effect of inundation of low-lying coasts can be even more widespread, causing salt intrusion into aquifers and destroying terrestrial ecosystems (Short 1988; Henderson-Sellers & Blong 1989). Human responses will vary depending on the values of the coastal land under threat and the resources available to provide protective measures (Roy & Thom 1987). In Pacific atoll states where resources are very limited, the provision of expensive engineering works will not be a commonly available option.
GREENHOUSE AND CORAL ATOLLS
59
ATOLLS AND ISLANDS Geology and Geomorphology
Fig. 2 (a) During the PMT, corals colonised old limestone surfaces, but in most cases their upward growth lagged behind the rapidly rising sea surface - the "catch-up" situation of Newmann and Macintyre (1985). (b) Shortly after sea level stabilised, coral reefs grew up into shallow depths and rubble accumulated to form planar reef flats in the intertidal zone. (c)In many cases, a slight fall in sea level during the late Holocene promoted the formation of storm rubble mounds that became the nuclei for island growth.
Atolls are accumulations of the remains of calcareous reef-forming organisms usually arranged into a rim around a central lagoon. They are found in tropical ocean waters within 20° latitude of the equator. Reef deposits initially accumulated on the peaks of submerging mid-ocean volcanoes (Darwin 1842; Scott & Rotondo 1983) but in Quaternary times the slow upward growth of the biogenic pile has been Storm ridges and spits of coarse rubble that build interspersed by effects associated with glacio-eustatic above sea level act as nuclei around which small fluctuations in sea level (Stoddart 1973; Steers & islands (motu) grow (Fig. 2c) (Hopley 1982; Stoddart 1977; Bloom 1980). The broad geological Woodroffe 1989). structure of coral atolls comprises a succession of old Radiocarbon dating studies (Davies & Hopley weathered limestones that form an irregular substrate 1983; Hopley 1982; Hopley & Kinsey 1988; Marshall on which the most recent (Holocene) deposits have & Jacobson 1985) show that, in most cases, upward accumulated (Fig. 2a). Intertidal and shallow subtidal reef growth has lagged behind rising sea level during areas that form the atoll rims and reef flats are the PMT (Davies & Montaggioni 1985; Newman & composed mainly of coarse coral detritus (Wheatcraft Macintyre 1985). It was not until one or two millennia & Buddemeier 1981; Davies & Hopley 1983). after sea level stabilised that reef building corals Typically, atoll rims are higher and reef flats are reached shallow sub-tidal depths; here living corals better developed on high-energy, windward coasts due became vulnerable to storm erosion, at least on to storm wave deposition (Wiens 1962) (Fig. 2b). windward coasts. Despite many problems associated
60 PETER ROY AND JOHN CONNELL with precise radiometric dating in these carbonate environments, a large body of data shows that intertidal reef flats typically have radiocarbon ages less than 5 ka BP and coral islands are mostly younger than this age (Fig. 3). Atoll islands are amongst the most recent of geological formations and are also the youngest in terms of human colonisation. Islands on atoll rims vary enormously in size and shape but the piles of coral/algal rubble and calcareous sand rarely rise more than 3 metres above mean sea level (Wiens 1962). Cementation in the intertidal and even supratidal zone (Montaggioni & Pirazzoli 1984) undoubtedly contribute to thenstability. However, the occurrence of exposed and eroding outcrops of beachrock/coral conglomerate on the one hand and newly-formed boulder ridges and sand spits on the other, indicate that islands are constantly changing shape (Wiens 1962; Hopley 1987). Most reef islands in the Marshall Islands, for example, are less than 1000 m long and 500 m wide (Emery et al. 1954), but in other atoll groups, islands are narrow but reach considerable lengths. In Kiribati, islands more than 10 km long are common. A number of still poorly-understood factors influence the size, morphology and position of islands around the atoll rim. Storm patterns control the size and frequency of formation of gravel ridges; tidal currents transport
reef-flat material away from islands and into lagoonal sinks; rainfall affects cementation/dissolution processes within the rubble pile; and biological processes, such as particular coral or algal growth styles, influence the generation of material that eventually forms the islands. The building of atoll superstructures, especially islands, results from a combination of day-to-day processes of small scale erosion and accretion, interspersed with catastrophic changes caused by rare, extremely violent tropical storms. Wiens (1962) and McLean (1980) have documented a number of historical storm events in which waves passed across islands up to 8 m above their land surfaces, hundreds of islanders died and whole island habitats were either washed away or buried in rubble. So, while series of beach ridges and recurved spits indicate net building or accretionary phases at some time during the late Holocene, other features, such as tidal channels intersecting islands and weathered coral ('makatea') surfaces around island margins and on reef flats, indicate contemporary erosion. The ubiquituous problems of dating the transported materials that make up the islands have hindered development of models of island evolution relevant to the present discussion.
Time
i
Approx. tidal range
i Present MSL
Sea level envelope
-8
a Qu
- 10 - 12
14m 10
C age in years BP x 1000 Fig. 3 Radiocarbon dated material from the supra-tidal parts of atoll islands are mostly less than 4 ka old. Here data from a number of sources is shown in relation to the sea level envelope for SE Australia (Thorn & Roy 1985). Data sources: Curry et al. (1970); Hopley (1983); Yonekura etal. (1984); Montaggioni & Pirazzoli (1984); Schofield (1977); Marshall & Jacobson (1985) and Woodroffe (1989). 1 4
GREENHOUSE AND CORAL ATOLLS Patterns of Island Growth In 1967 Cyclone Annie caused severe damage to vegetation on Ontong Java, Solomon Islands, eroding coral from exposed reef fronts and forming largestorm ridges or ramparts of coral rubble on windward reef flats (Bayliss-Smith 1988). In subsequent years parts of the rubble ridges became welded to existing islands thus increasing their size, but the long-term trend was for the ridges to degrade as rubble was broken down and dispersed as a result of intermediate-intensity storms (Baines et al. 1974). Along lagoon shorelines, sandy beaches were initially cut back but then slowly recovered in the post-cyclone period, probably with the addition of the finer breakdown products from the rubble ridges. Very rare and large storms appear to be critical, therefore, in suddenly generating new stores of coral rubble on reef flats which are then redistributed to maintain islands and infill lagoons. These changes can be seen as part of a process of 'dynamic equilibrium' (rather than stages in an evolutionary progression) with periods of island accretion alternating with erosion (Bayliss-Smith 1988; Stoddart et al. 1978). The periodicity of this cycle depends firstly on the 'relaxation time' or rate of recovery of the land form and secondly, on the recurrence interval of major, rubble-generating storms. (Rates of coral regrowth may exert an independent control on rubble production). Individual island configurations may therefore be regarded in terms of sensitively balanced, individual sediment budgets. A state of disequilibrium may arise if environmental conditions, such as relative sea level or storminess, change with time. For example, island morphologies can be expected to differ depending upon whether an atoll is undergoing slow submergence or emergence. The theoretical effect of slow changes in relative sea level can be predicted: falling sea levels tend to promote the accumulation of sediment masses (Hopley 1982, p.354-5) while rises should increase erosion. A slight fall in sea level was, in fact, inferred from many of the early observations of atoll islands (Wiens 1962 p.95). While this trend has been confirmed by C14 dating in some areas (Hopley 1982; 1983; Chappell et al. 1982), and has been predicted by earth rheology models (Nakada & Lambeck 1989), it is disputed in other cases (Newell & Bloom 1970; Bloom 1980; Curry et al. 1970; Montaggioni & Pirazzoli 1984). This uncertainty is mainly due to the radiocarbon dating problems mentioned above, but also because the eustatic changes were so slow (0.1 to 0.2 mm per year) as to
61
be masked or modified by local tectonic trends (Spencer et al. 1987). In a temporal sense, Bayliss-Smith (1988) has suggested that storms in the mid-Holocene were more frequent and intense than at present and, at this time reef islets slowly increased in size. This trend apparently reversed during the late Holocene and islands then slowly reduced in size. Regional studies to document island morphology, size and location on atoll rims and the nature of inter-island channels, reef flats etc. (e.g. Wiens 1962; Stoddart & Seers 1977) need to be initiated to test the above relationships. While the spectre of rising sea level in the future seems to follow inevitably from a greenhouse-induced warming of the atmosphere, there is growing evidence that its impact will not be the same everywhere. Bryant (1988) has shown how past sea level changes have been influenced by local factors both climatic and oceanographic, factors whose variability may change with the GE. In this context it is noteworthy that, for atoll islands, a decrease in the frequency of large storms may cause an increase in coastal erosion. The nature of existing coastlines, whether cliffed, sandy, swampy etc., will also determine the impact of the GE (Short 1988; Thorn & Roy 1988; Cocks et al. 1988).
Ecology Atolls are characterised by limited species diversity, especially in comparison with high islands, with only a few plant and animal types predominating (Wiens 1962; Stoddart & Seers 1977). There seems to be a direct relationship between diversity and island size, and rainfall. The main food crops are coconuts, breadfruit, taro and pandanus. In wetter conditions crops such as bananas are also cultivated. Because of the small size and the low elevation of atoll islands, virtually all plants have some tolerance of salt spray and brackish groundwater conditions. Species such as the coconut and pandanus can withstand quite high levels of salt and even occasional inundation by storm waves. In contrast, swamp taro and Cyrtosperma taro are much more sensitive to salinity changes and grow in low areas, usually manually excavated taro pits in the central parts of islands. Salinity causes a substantial reduction in taro productivity (Levin 1976; Bates & Abbott 1958). Island ecology, in terms of the capacity to support human habitation, is closely tied to the existence of a permanent ground water system (Wiens 1962). Islands above a certain size - about 1.5 ha and 200 m in
62 PETER ROY AND JOHN CONNELL
(b)
(c)
Fig. 4 Ghyben-Herzberg freshwater lenses vary in size under present-day islands (a). These islands will be significantly reduced or even disappear if sea level rises and island shorelines erode (b). Because of the loss of "freeboard", storm overwash of the islands will cause salt intrusion into the groundwater to occur more frequently (c).
diameter (Cloud 1952; Wiens 1962) - contain a permanent lens of fresh water surrounded by salt water (Fig. 4a). The lens-like shape of the fresh water body is roughly governed by the density differences between salt and fresh water - the Ghyben-Herzberg principle. The volume of the lens is proportional to the width and surface area of the island (Fetter 1972). Other factors influencing the character and behaviour of the freshwater lens include annual rainfall, permeability of the rock beneath the island, and salt mixing due to storm or tide-induced pressure gradients (Buddemeier & Holladay 1977; Vacher 1978; Ayers & Vacher 1986; Jacobson & Taylor 1981). During droughts, water tables fall and the ground water may become brackish (Lloyd et al. 1980).
Environmental stress is manifested by trees' loss of leaves, failure to fruit and even death. In Kiribati, where groundwater is the main source of drinking water on most islands, populations have been forced to migrate temporarily to areas with higher rainfall. On small islands especially, ground water reserves are particularly vulnerable to the vagaries of rainfall, storms etc. On Eauripik, an atoll in the FSM, cyclone disruption of groundwater supplies has forced severe water rationing and bathing in salt water (Levin 1976). However, the most severe threat to fresh water supplies is not from atmospheric factors directly, but rather from marine processes that cause coastal erosion and increase the frequency of storm overwash (Fig. 4b, c). Figure 5 shows in generalised form the relationship between the dimensions of the ground
GREENHOUSE AND CORAL ATOLLS
63
Island width (m) 500
Thickness of fresh water lens (m)
1000
Fresh water
Volume of fresh water lens (m)
Fig. 5 The maximum thickness of the Ghyben-Herzberg lens of freshwater beneath atoll islands increases in direct proportion to island width but the volume of freshwater increases semi-exponentially (Fetter 1972). Thus changes in island width due to erosion or accretion have a disproportionately large impact on freshwater reserves.
water lens and island size, measured by island width, and illustrates that a 20% reduction in island width, for example, almost halves the volume of freshwater. Thus any decline in island area has a very dramatic influence on the availability of freshwater supplies.
Economies and Societies Atoll life was always far from that portrayed in images of the supposedly idyllic Pacific islands. Hazard, hunger and disease punctuated periods of well-being, and warfare, abortion and infanticide have also served to reduce and control population numbers. In the past, many atolls have been depopulated and repopulated following natural disasters and migration movements of various kinds (Alkire 1978; Osborne 1966). Islanders often developed cultural ties with those on other atolls so that, during periods of population-resource imbalance, their proximity to each other enabled economic
exchange, personnel mobility and, on the negative side, warfare and raiding (Alkire 1978). Despite the physical similarity of their environments, the four atoll states discussed here are quite different in language, culture and history. They have varying levels of political independence but all are economically dependent on the outside world (Connell 1988a; Roy & Connell 1989). Total populations range from more than 60,000 in the case of Kiribati to less than 2,000 for Tokelau. Population densities average 200-300/km for most atoll states but are an order of magnitude greater on the main islands such as Majuro and South Tarawa. Typically, isolated groups of people live on small islands clustered around the rims of atolls scattered over large areas of ocean; communications are tenuous. Since colonial times populations have expanded and the aspirations of the islanders for a better life style have grown. Despite some areas of increased productivity (copra and fishing), traditional agriculture has generally declined and the internal economies of the atoll states
64 PETER ROY AND JOHN CONNELL have failed to meet their people's expectations. Island countries have become increasingly dependent on imported consumer goods including foodstuffs. In the past, economic pressures were substantially met by temporary (and often reluctant) migration overseas and the remittance of funds back home (Prior 1981; Macdonald 1982; Connell 1986). Hopes of promoting manufacturing and tourism industries to generate foreign exchange have largely been unfulfilled and, in more recent times, foreign aid, welfare funds and subsidies of various kinds have become the bases for island economies. This has led to increasingly centralised administrations and a government employment sector which only partly accommodates an increasingly well-educated workforce that is itself growing (Fairbairn 1976). While out-lying islands have been depopulated, administrative and business centres are experiencing urban crowding with accompanying health and social problems (e.g. Itaia 1987). The need for outside aid is increasing and long-term migration overseas is now seen by many islanders as the best way to satisfy their aspirations (Marshall 1979; Connell 1988b). Community dislocation and cultural decay are the inevitable consequences (Schutz & Tenten 1979). These escalating pressures are forcing foreign nations around the Pacific rim to recognise that an offer of immigration may be the inevitable and necessary response to ailing island economies (Committee to Review the Australian Overseas Aid Programme 1984). For atoll states, dreams of reclaiming past self-sufficiency and control over their destiny are becoming more remote - a sad trend that GE seems likely to exacerbate.
POTENTIAL IMPACTS OF GREENHOUSE WARMING ON ATOLL ISLANDS Although the climatic impacts of the GE will vary temporally and spatially in ways still impossible to predict, especially at a local scale, it would seem likely that they will worsen the present difficulties of achieving development in atoll states. Rises in air and sea temperatures will influence weather patterns, change rainfall and storm frequency and intensity; sea levels may rise and coasts erode. The intertropical covergence zone is likely to shift equatorwards, changing the distribution of zones of upwelling and hence altering the distribution of fish stocks and thus fisheries. Slowly but inexorably there will be critical environmental changes but at unknown rates and impacts. The relatively simple ecosystems of atolls,
however, enable some conclusions to be made with a greater degree of certainty, though nothing can be determined in quantitative terms at this stage. A number of specific changes that affect atolls can be separately distinguished and examined in three principal areas. These are, firstly, the intrusion of saltwater into coastal groundwater supplies; secondly, coastal erosion and inundation of low-lying flat land, and thirdly, storm damage to coastal installations, such as port facilities. Tourism is not a substantial source of income in any of the atoll states, hence the disruption of coastal tourist facilities will be less severe than in other countries, though it will certainly discourage future developments. Figures 4b and 4c illustrate the types of change that might accompany a rise in sea level or increase in storminess. As erosion reduces island size, ground water lenses shrink beneath larger islands, and virtually disappear under smaller ones, causing all except the most hardy vegetation to perish. Sea levels rising at the rates contemplated under future greenhouse conditions, while having little effect on living coral, would outstrip the ability of islands to grow upwards and lead to a reduction in island 'freeboard' (height above mean sea level). Storm overwash would therefore become an increasingly frequent occurrence, causing damage to buildings and vegetation and salination of the ground water lens (Fig. 4c). Conceivably, in the next 50 years or so, greenhouse-induced coastal erosion in the order of 1-2 m/year could reduce the dimensions of some presently inhabited islands to the point where their ground water supplies would no longer support viable ecology or permanent habitation. Probably the most severe situation is likely to occur on what are today the widest and most productive islands. These typically occur at bends in the reef crest where waves approach from two or more directions and series of recurved spits have formed around a central low area (Fig. 6). Low areas are usually swampy and historically have been used to grow swamp taro and Cyrtosperma taro; many islands of this type, such as Kuria in Kiribati and Eauripik (FSM) support relatively high population densities. The effect of a marine incursion on this type of island is illustrated in Figure 6. Not only are productive food areas in the interior of the island destroyed by salt-water flooding, but the ground water lens is greatly reduced as is the productivity of coconut and breadfruit crops. The construction of expensive sea walls to protect low-lying areas would only be effective in the early stages. As sea-level continues to rise, so would the groundwater table until eventually
I
OCEAN
rl MI IT111 rtYrp:::;;'
Fig. 6 Wide islands with relatively large groundwater lenses form where converging waves (large arrows) build gravel ridges and recurved spits (small arrows) at bends in the reef crest. Lower areas in their interiors are agriculturally productive but, if sea level rises, inundation and salt intrusion could destroy their productivity and also the island's groundwater reserves.
the central parts of the island becomes a shallow, and relatively unproductive, lagoon of brackish water. Increased salinity will reduce the potability of groundwater which is of considerable significance for most atolls. Although preference is usually given to rainwater, groundwater is a secondary source and, in drought conditions, access to it on every atoll is
GREENHOUSE AND CORAL ATOLLS 65 crucial. Significantly, freshwater is most scarce after storm surges or tsunamis have swept the sea over islands, salting soils and wells, a situation which is likely to increase under GE (Wiens 1962). On some atolls with reasonably high rainfall, such as Nanumea (Chambers 1984), construction of better cisterns may enable groundwater usage to be minimised or ended. Costs of alternatives such as water purification and desalination are extremely high. On some of the drier atolls, including densely populated urban areas, water supply is already a critical problem. If and when groundwater becomes no longer potable, especially if combined with any long-term decline in rainfall as is possible in some areas, human habitation will effectively be impossible. The intrusion of saltwater into groundwater lenses will have direct effects, therefore, on agriculture and on the supply of potable water. The most obvious effects on agriculture will be through increased salinity in taro pits, lower crop productivity and hence a greater disinclination to continue with this labour-intensive agricultural activity. Even though coconuts, pandanus and breadfruits are relatively salt-resistant, Ealey (1985) has shown that increased salinity in coastal areas of Thailand reduces productivity and kills off palms. No crops will gain from increased salinity. Coastal erosion will both reduce land areas on atoll islands and, because of their minimal elevation, inundation will increase the swampiness and salininty of areas that are presently above sea-level. Especially at risk will be those areas that have previously been reclaimed from the sea, including parts of south Tarawa, and causeways such as those between Betio and Bairiki in Kiribati and in Majuro in the Marshall Islands. This loss of land will directly affect agricultural production, housing, roads, airstrips etc. There will be increased competition for scarce land in urban areas and more disputes over land tenure. (Fortunately the severity of these conflicts is likely to be reduced by the custom in many communities of land tenure being organised by strips across the atoll from lagoon to ocean). The loss of land will lead to a related decline in handicraft materials (wood, pandanus etc) and of firewood, which is already in extremely short supply in urban areas such as Tarawa. Such changes will further threaten the already limited subsistence base and increased demand for expensive imports. Inevitably, attempts will be made to protect coastal areas by building sea walls and other types of engineering works. The diversion of scarce resources, both human and financial, will further strain the
66 PETER ROY AND JOHN CONNELL islands' economies and, as the problems become more widespread, may act as a heavy drain on foreign aid. The GE is likely therefore to lead to a further decline in the few areas in which the atoll states currently demonstrate some degree of self-reliance. These problems will increase over time. One extremely pessimistic scenario even suggests that 'it is conceivable that some baselines for territorial seas and Exclusive Economic Zones would have to be altered, decreasing the area of exclusive rights for marine resources and reducing potential income' (Matos & Tiffin 1988 p.51; cf. Pernetta 1988). Long before this occurs, there will have been many more obvious negative effects. These will occur alongside continued rapid population growth that independently increases pressure on resources. Intensification of the present structure of dependence on metropolitan states seems inevitable. It is likely to encourage further rural-urban migration in search of the 'fast money' of wages and salaries and away from the growing uncertainty of agricultural and fisheries incomes. Atoll development options are naturally constrained by limited land (and sometimes lagoon) areas, and the simplicity of atoll ecosystems. These options have been artificially broadened by the introduction of new plant varieties, fertilizers, technology, and so on, from outside, but they are limited by the fact that many are expensive (and increasingly so) and far from simple to organize and maintain. More recently however, changes in aspirations and altered attitudes to traditional agriculture have resulted in a general decline of food cultivation and led to some loss of skills and knowledge (principally as modern "school" knowledge replaces inherited traditional skills). In the past, these same skills enabled survival and success in environments often threatened by natural hazards; they may be needed again to confront GE.
DISCUSSION AND CONCLUSIONS It is clear that much of what can be currently known about the impact of GE is speculative since the order of magnitude of future physical events cannot be determined, nor is there precedent for what is likely to follow. The causes and consequences are both complex and inter-related, involving changing natural processes and a variety of human adaptations to those changes. In the context of atoll islands, it is likely that degradation of present-day living conditions will come about through local factors: increased El Nino events,
droughts, more storms and higher rates of coastal erosion (Henderson-Sellers & Blong 1989). Impacts will vary from place to place not only because of environmental variability, but also because of inherited geological factors that have produced differences in island morphologies and compositions. Scientific research directions should proceed on at least two parallel fronts. Present-day climates and oceanographic processes in the tropics must be known so as to model future environmental changes likely to be experienced by atoll states. The installation of modern tide gauges, proposed by the Australian Government to the 1988 and 1989 South Pacific Forum Meetings, is an integral part of this research thrust. The other main area of research involves studies of island evolution to predict how particular islands will respond to changed environmental conditions. As suggested above, islands are the result of a precarious balance between gains and losses to piles of sediment on atoll rims - a sediment budget that is controlled by a spectrum of physical and biological processes. There are at least four inter-related topics requiring investigation: 1. Documentation of geological sediment budgets (including biogenic production, cementation, dissolution and erosion phenomena) to measure the history of island growth/decay during the mid and late Holocene. This must involve a large commitment to radiocarbon dating. 2. Air photo interpretation to record the regional diversity of island morphologies so as to establish patterns to correlate with other environmental variables. 3. Determination of storm regimes - frequencies, intensities and directions - from historical records and geological chronologies preserved in the islands themselves. 4. Compilation of relative sea level histories for individual atoll groups and integration of these with earth-rheology models, geological data and climatic variables. Uncertainty over the outcome of the greenhouse phenomenon will continue to restrict Governments' ability and willingness to respond to the problem through policy formulation. Response is least likely in the atoll states where information is minimal and planning offices are small and already over-stretched. Moreover, atoll states and other microstates cannot
GREENHOUSE AND CORAL ATOLLS act individually or collectively to remove or reduce the causes of GE; they can only call upon international organisations to act globally. An international approach is essential but at this level, climatic change is only one element in a complex and integrated set of problems relating to population, resources, economics and environment. A further complication is that not all nations view GE in the same way: for high-latitude countries, global warming may even be beneficial in terms of agricultural production. The GE has now become a United Nations priority and the United Nations Environment Program is working towards an international convention for tackling the problem. However, there is little evidence that present socio-political systems have the capacity or willingness to control global events such as the unique greenhouse 'experiment' (Mercer & Peterson 1988). The majority of the various management options canvassed by Goodman and Jager (1988) recognise the improbability of governments implementing the radical changes needed now to significantly modify GE. Meyer-Abich, in a paper titled 'Chalk on the White Wall - On the Transformation of Climatological Facts into Political Facts' (1980), suggested that there are three options for response: prevention, compensation and adaptation, but concluded somewhat cynically that, from a political point of view, prevention and compensation are much less practical than adaptation. Adaptation allows least action in the present, defers expenses into the future and does not require long-term international cooperation or agreement on long-range goals. If adaptation is the most convenient political option, the climate problem becomes part of development policies in general and tends to fade ('Chalk on the White Wall') compared to the extremely serious problems already confronting developing countries. The extent to which recent demands by third world countries, that they should be compensated for foregoing industrial development, cause the above scenario to be modified, remains to be seen. Perhaps our best hope of effecting social change is through non-government agencies such as Greenpeace orchestrating public pressure on individual governments. If greenhouse produces the type of effects discussed here, atoll island states will be overwhelmed. Conventional measures to reduce vulnerability (eg. transferring populations, infrastructure and economic activities to higher land) are impossible. The construction of dikes and pumping stations is extremely expensive (especially
67
when a small population is spread over a large number of islands), and it does not seem feasible to transport material (sand and gravel) to nourish the islands on the scale that would be required. Even defending the few urban areas, themselves isolated, would be an enormously costly operation. Increased emigration is seen as one response to GE, a response that builds on existing trends but is almost entirely dependent on the policies of metropolitan states. Howlett (1985) has argued, nonetheless, that islanders could ultimately take migration matters into their own hands. Based on the experience of existing migration from the South Pacific to Australia and New Zealand, the bulk of potential migrants from Kiribati and Tuvalu would be young, with some education, and would find some employment reasonably easily; moreover, only a small proportion of the population would initially choose to migrate. Initially there is likely to be significant opposition to concessionary migration although, in time, this may decline when the impact of GE becomes apparent. Concessionary migration schemes may be granted in other potential destinations such as New Zealand or even the United States. They are unlikely within the South Pacific. Long before the implications of the greenhouse phenomenon were recognised, appropriate development strategies for atoll states were cause for concern. Few nations have ever had such limited prospects for development, have gained so little from the technological advances of this century yet have become so dependent on the outside world. Now it is even more crucial for there to be a focus on both scientific and development issues in atoll states. Without further substantial external assistance, there is little doubt that people who were once described as real and potential 'economic refugees' will become, in less than fifty years, a new group of or 'ecological refugees' (Pernetta 1988) or "environmental refugees". It is extremely unlikely that actions taken within the atoll states alone will allay this gloomy forecast. Island groups such as Tuvalu and Tokelau, that were first populated less than a thousand years ago, can anticipate a future of population decline. Some of the most recently populated islands in the world may be depopulated. Some of the most recently formed islands may disappear.
ACKNOWLEDGEMENTS This paper is based on an earlier manuscript which dealt much more fully with the historic and
68 PETER ROY AND JOHN CONNELL contemporary economic, social and political impacts of western culture on atoll island states (Roy & Connell 1989). The collaboration in this paper of authors from different disciplines - geoscience (PSR) and social science (JC) - has led to a degree of speculation about future events. Are we being alarmist? We think not. Environmental changes, as are already occurring on a global scale with the greenhouse experiment, could have severe repercussions for future generations. By the time we have amassed 20 or 30 years of climatic and sea-level data to be scientifically sure, it might be too late to make the necessary economic and political changes. It is not alarmist to sound warnings if danger threatens. The authors benefited from discussions with Jim Charlie and Edgar Frankel. Comments by Bill Clarke, Bruce Thom and Ted Bryant greatly improved the manuscript. REFERENCES ALKIRE, W.H. 1978. Coral Islanders. Arlington Heights, AHM
Publishing Corporation.
AUBREY, D.G. & EMERY, K.O. 1983. Eigen analysis of recent United States sea level. Continental Shelf Research 2, 21-33. AUBREY, D . G . & EMERGY, K . 0 . 1 9 8 6 . Relative sea levels of Japan
from tide-gauge records. Geological Society ofAmerica, Bulletin
97, 194-205. AYERS, J.F. & VACHER, H.L. 1986. Hydrogeology of an Atoll
Island: a conceptual model from detailed study of a Micronesian example. Ground Water 24, 185-198. G. 1988. Environment, traditions and economic development in the Pacific Island. Unpub. paper to Pacific Environmental Conference, Commonwealth Institute, London. BAINES, G.B.IC, BEVERIDGE, PJ. & MARCOS, J.E. 1974. Storms and island building at Funafuti Atoll, Ellice Islands. Proceedings 2nd International Coral Reef Symposium 2, 4 8 5 ^ 9 6 . BARNEIT, T.P. 1984. The estimation of "Global" sea level change: a problem of uniqueness. Journal of Geophysical Research 89, BAINES,
7920-7988. BARTH, M.C. & Trrus eds. 1984. Greenhouse Effect and Sea Level
Rise: a Challenge for this Generation. New York, Van Nostrand Reinhold.
BATES, M . & ABBOTT, D . 1958. Coral Island. Portrait of an Atoll.
New York, Scribners. T.P. 1988. The role of hurricanes in the development of reef islands, Ontong Java Atoll, Solomon Islands. Geographical Journal 154, 377-391. BLOOM, A.L. 1980. Late Quaternary sea level change on south Pacific coasts: a study in tectonic diversity. In Morner, NA. ed. Earth Rheology, Isostasy and Eustacy. pp. 505-515, Chichester, John Wiley. BAYLISS-SMITH,
BOLIN, B., DOOS, B.R., JAGER J. & WARRICK, R A . eds. 1986. The
Greenhouse Effect, Climatic Change and Ecosystems. Scope 20, Chicester, John Wiley.
BRYANT, E., ROY, P.S. & THOM, B.G. 1988. Australia - an
unstable platform for tide-gauge measurements of changing sea level: a discussion. Journal of Geology 96, 635-640.
BRYANT, E. 1988. Sea-level variability and its impact within the
Greenhouse Scenario. In G.I. Pearman ed., op cit, 135-146.
BRYANT, EA. 1987. C02 warning, rising sea-level and retreating
coasts: review and critique. Australian Geographer 18, 110-113.
BUDDEMEIER, R.W. & HOLLODAY, G. 1977. Atoll hydrology:
island groundwater characteristics and their relationships to diagenesis. Proceedings of the Third International Coral Reef Symposium, Miami Florida, 167-173. CHAMBERS, A. 1984. Nanumea. ANU Development Studies Centre, Atoll Economy: Social Change in Kiribati and Tuvalu, Monograph No. 6, Canberra.
CHAPPELL, J., RHODES, E.G., THOM, B.G. & WALLENSKY, E.P.
1982. Hydro-isostasy and the sea-level isobase of 5500 BP in north Queensland. Marine Geology 49, 81-90.
CLOUD, P.E. 1952. Preliminary report on the geology and marine
environments of Onotoa Atoll, Gilbert Islands. Atoll Research Bulletin 12, 1-32.
COCKS, K.D., GILMOUR, AJ. & WOOD, N.H. 1988. Regional
impacts of rising sea-level in coastal Australia. In G.I. Pearman, ed., op cit, 105-120.
COMMITTEE TO REVIEW THE AUSTRALIAN OVERSEAS AID PROGRAM
1984. The Australian Overseas Aid Program. Canberra, Australia Government Publishing Service.
CONNELL, J. 1986. Population, Migration and Problems of Atoll
Development in the South Pacific. Pacific Studies 9, 41-58.
CONNELL, J. 1988a. Sovereignty and Survival. Island Microstates in
the Third World. University of Sydney, Department of Geography, Monograph No.2. CONNELL, J. 1988b. Migration, Employment and Development in the South Pacific. Country Report No. 24. North America, Noumea, South Pacific Commission and International Labour Organisation. CONNELL, J. 1989. Rising tides may sound the death-knell of an island community. Sydney Morning Herald 26 April, 13. CURRY, J.R., SHEPARD, F.P. & VEEH, H.H. 1970. Late Quaternary sea level studies in Micronesia: CARMARSEL Expedition. Geological Society of America Bulletin 81, 1865-1880. DARWIN, C.R. 1842. The Structure and Distribution of Coral Reefs. London, Smith Elder. DAVIES, P J. & HOPLEY, D . 1983. Growth fabrics and growth rates of Holocene reefs in the Great Barrier Reef. BMR Journal of Australian Geology and Geophysics 8, 237-251. DAVIES, P J . & MARSHALL, J.F. 1979. Aspects of Holocene reef growth, substrate age and accretion rate. Search 10, 276-279. DAVIES, P J . & MARSHALL, J.H. 1980. A model of epicontinental reef growth. Nature 287, 37-38. DAVIES, P J. & MONTAGGIONI, L. 1985. Reef growth and sea-level change: the environmental signature. Proceedings 5th International Coral Reef Congress 3, 477-515. DE ROBIN, G. 1986. Changing sea level: Projecting the rise in sea level caused by warming of the atmosphere. In B. Bolin et al.., op cit. DEVOY, RJ.N. ed. 1987. Sea Surface Studies - A Global View. London, Croom Helm. EALEY, E.H.M. 1985. Evaluation of major agricultural problems in Samul Songkhram Province, Thailand. Monash University, Graduate School of Environmental Science Environmental Report, No. 21, Melbourne. EMERY, K.O. & AUBREY, D.G. 1986. Relative sea level changes from tide gauge records of the eastern Asia mainland. Marine Geology 72, 33-46. EMERY, K.O., TRACEY, J.I. & LADD, H.S. 1954. Geology of Bikini and nearby atolls. United States Geological Survey Professional Paper No. 26QA, 1-265. FAIRBAIRN, 1.1976. Employment in the Gilbert and Ellice Islands. Noumea, South Pacific Commission. FETTER, C.W. 1972. Position of the saline water interface beneath Oceanic islands. Water Resources Research 8(5), 1307-1315.
GREENHOUSE AND CORAL ATOLLS GOODMAN, G . T . & JAGER, J. 1988. The development of an
Reefs 3, 29-42.
69
awareness of a need to respond to climatic change. First NAKADA, M. & LAMBECK, K. 1989. Late Pleistocene and Holocene meeting of Expert Group on Climatic Change and Sea Level sea-level change in the Australian region and mantle rheology. Rise, Commonwealth Secretariat, London. Geophysical Journal 96, 497-517. GORNITZ, V., LEBEDEFF, L. & HANSEN, J. 1982. Global sea level NEUMANN, A.C. & MACINTYRE, 1.1985. Reef response to sea level trend in the past century. Science 215, 1611-1614. rise: keep-up catch-up or give-up. Proceedings 5th International HENDERSON-SELLERS, A. & BLONG, R. 1989. The Greenhouse Coral Reef Congress, 5, 105-110. Effect: Living in a Warmer Australia. New South Wales NEWMAN, W.S. & FAIRBRIDGE, R.W. 1986. The management of University Press, Australia, 211. sea-level rise. Nature 320, 319-321. HOFFMAN, J.S. 1984. Estimates of future sea level rise. In Barth NEWELL, N.D. & BLOOM, A.L. 1970. The reef flat and "two-meter M.C. and Titus J.G., op tit, 79-103. eustatic terrace" of some Pacific atolls. Geological Society of HOPLEY, D. AND KINSEY, D.W. 1988. The effect of a rapid America Bulletin 81, 1881-1894. short-term sea level rise on the Great Barrier Reef. In G.I. OSBORNE, D . 1966. The Archaeology of the Palau Islands: an Pearman ed., op tit, 189-201. Intensive Study. Bishop Museum Bulletin No. 230, Honolulu. HOPLEY, D . 1982. Geomorphology of the Great Barrier Reef: PEARMAN, G.I. ed. 1988. Greenhouse: Planning for Climate Change. Quaternary Development of Coral Reef New York, John Wiley. Melbourne, CSIRO Publications, 752pp. HOPLEY, D. 1983. Evidence of 15,000 years of sea level change in PEARMAN, G.I. 1988. Greenhouse gases: evidence for atmospheric tropical Queensland. In Hopley, D. ed., Australian sea levels in changes and anthropogenic causes. In G.I. Pearman ed., op tit., the last 15,000 years: a review. Occasional Paper No. 3, 3-21. Department of Geography, James Cook University of North PERNEITA, J. 1988. Projected climatic change and sea-level rise: a Queensland, Townsville, 93-104. relative impact rating for the countries of the Pacific Basin. In HOWLETT, D. 1985. Australia's Next Boat People? The Need for ASPEI, Potential Impacts of Greenhouse Gas Generated Climatic a Concessionary Migration Policy for Kiribati and Tuvalu. Change and Projected Sea-Level Rise on South Pacific Island Unpub. paper to 20th Institute of Australian Geographers' States of the SPREP Region, 1-10. Conference, Brisbane. PIRAZZOU, PA. & MONTAGGIONI, L.F. 1986. Late Holocene ITAIA, M. 1987. Squatters on South Tarawa, Kiribati. In L. Mason sea-level changes in the northwest Tuamotu Islands, French and P. Hereniko, eds, In Search of a Home. Suva, Institute of Polynesia. Quaternary Research 25, 350-368. Pacific Studies, 206-229. PIRAZZOLI, P A . 1986. Secular trends of relative sea-level (RSL) JACOBSON, G. 1988. Global change, hydrological and ground water changes indicated by tide-gauge records. Journal of Coastal resources. Proceedings, Global Change Symposium, Australian Research, SI 1, 1-26. Academy of Science, Canberra. PrrrocK, A.B. 1988. Actual and anticipated changes in Australia's JACOBSON, G. & TAYLOR, FJ. 1981. Hydrogeology of Tarawa atoll, climate. In Pearman, G.I., ed., op cit, 35-51. Kiribati. Bureau of Mineral Resources, Geology and Geophysics\ PRIOR, I. 1981. The Tokelau Island Migrant Study. A Progress Report 1979. In C. Fleming and I. Prior, eds, Migration, Record 1981/31, Canberra. Adaptation and Health in the Pacific, Wellington Hospital, LEVIN, MJ. 1976. Eauripik Population Structure. Unpub. Ph.D. Wellington, 27-43. thesis, University of Michigan. ROY, P.S. & CONNELL, J. 1989. 'Greenhouse': the impact of LLOYD, J.W., MILES, J.C., CHESSMAN, G . R . & BUGG, S.F. 1980. A sea-level rise on low coral islands in the South Pacific, Research ground water resources study of a Pacific Ocean atoll - Tarawa, Institute for Asia and the Pacific, Occasional Paper No. 6, Gilbert Islands. Water Resources Bulletin 16(4), 646-653. Sydney. LOVE, G. 1987. Cyclone storm surges: pre and post Greenhouse. ROY, P.S. & THOM, B.G. 1987. Sea-level rise - an eminent threat? Greenhouse 87 Conference, Monash University, 1987. 8th Australasian Conference on Coastal and Ocean Engineering. LOVELOCK, J. 1988. The Ages of Gaia: a Biography of our Living The Institution of Engineers, Launceston, 186-190. Earth. Oxford University Press, UK, 252. MACDONALD, B. 1982. Cinderellas of the Empire. Towards a History SCHOFIELD, J.C. 1977(a). Effect of late Holocene sea-level fall on atoll development. New Zealand Journal of Geology and of Kiribati and Tuvalu. Canberra, ANU Press. Geophysics 20(3). MARSHALL, J.F. & JACOBSON, G . 1985. Holocene growth of a SCHOFIELD, J.C. 1977. Late Holocene sea-level, Gilbert and Ellice mid-Pacific atoll: Tarawa, Kiribati. Coral Reefs 4, 11-17. Islands, West Central Pacific Ocean. New Zealand Journal of MARSHALL, M. 1979. Education and Depopulation on a Geology and Geophysics 20, 503-529. Micronesian Atoll. Micronesica 15, 1-11. SCHUTZ, B. & TENTEN, R 1979. Adjustment. Problems of growth MATOS, C. & TIFFIN, D . 1988. Greenhouse Effect. Frightening and change, 1892 to 1944. In A. Talu, et al., Kiribati. Aspects of predictions for atoll nations. Islands Business 14(10), October, History. Suva, Institute of Pacific Studies, 106-127. 46-51. Scorr, GAJ. & ROTONDO, G.M. 1983. A model for the MCLEAN, R.F. 1980. Spatial and temporal variability of external development of types of atolls and volcanic islands on the physical controls on small island ecosystems. In H.C. Brookfield, Pacific lithospheric plate. Atoll Research Bulletin 260, 1-33. ed., Population - Environment Relations in Tropical Islands: the case of Eastern Fiji, 149-175, MAB Technical Notes 13, Paris: SHORT, A.D. 1988. Areas of Australia's coast prone to sea-level inundation. In G.I. Pearman, ed., op cit, 93-104. UNESCO. SPENCER, T., STODDART, D.R & WOODROFFE, C.D. 1987. Island MERCER, D.C. & PETERSON, J A . 1988. Australia and the uplift and lithospheric flexure: observations and cautions from greenhouse effect: the science/policy debate. In G.I. Pearman, the South Pacific. Zeitschrift fur Geomorphologie Supplement ed., op tit, 708-724. Bd.63, 87-102. MEYER-ABICH, K.M. 1980. Chalk on the White Wall? On the transformation of climatological facts into political facts. In STEERS, JA., STODDART, D.R. 1977. The origin of fringing reefs, barrier reefs and atolls. In OA. Jones and R. Endean, eds, JAusubel and A.K. Biswas, eds, Climatic Constraints and Biology and Geology of Coral Reefs, Volume 4, New York, Human Affairs, Pergamon Press, Oxford. Academic Press, 21-57. MONTAGGIONI, L.F. & PIRAZZOU, PA. 1984. The significance of exposed coral conglomerations from French Polynesia (Pacific STODDART, D.R. 1973. Coral reefs - the last two million years. Ocean) as indicators of recent relative sea-level changes. Coral Geography 58, 313-323.
70 PETER ROY AND JOHN CONNELL STODDART, D.R., MCLEAN, R.F., SCOFFIN, T.P., THOM, B.G. & HOPLEY, D. 1978. Evolution of reefs and islands, northern
Great Barrier Reef: synthesis and interpretation. Philosophical Transactions of the Royal Society of London B284, 149-159. THOM, B.G. & ROY, P.S. 1985. Relative sea-levels and coastal sedimentation in southeast Australia in the Holocene. Journal of Sedimentary Petrology 55, 257-264. THOM, B.G. & ROY, P.S. 1988. Sea-level rise and climate: lessons from the Holocene. In G.I. Pearman, ed., op cit, 177-188. THOMAS, W.L. 1963. The variety of physical environments among Pacific islands. In F.R. Fosberg, ed., Man's Place in the Island Ecosystem, Honolulu, Bishop Museum Press, 7-37. TUCKER, G.B. 1988. Climate modelling: how does it work? In G.I. Pearman ed., op cit, 22-34. VACHER, H.L. 1978. Hydrology of small oceanic islands influences of atmospheric pressure on the water table. Ground Water 16, 417-423.
WARRICK, RA., JONES, P.D. & RUSSELL, J.E. 1988. The
Greenhouse Effect, climate change and sea level: an overview. Climate Research Centre, School of Environmental Sciences, University of East Anglia, Norwich. WHEATCRAFT, S.W. & BUDDEMEIER, R.W. 1981. Atoll island hydrology. Ground Water 19, 311-320. WIENS, H J . 1962. Atoll Environment and Ecology. Yale University Press, New Haven and London. WOODROFFE, C. 1989. Maldives and sea-level rise: an environmental perspective. Report on a visit to the Republic of Maldives 31 Jan.-15 Feb. 1989 at the request of the Ministry of Planning and Environment, Dept. of Geography, University of Wollongong, (unpublished). YONEKURA, N., MATUSHIMA, Y., MAEDA, Y. & KAYANNE, H. 1984.
Holocene sea-level changes in the southern Cook Islands. In A. Sugimura, ed., Sea-Level Changes and Tectonics in the Middle Pacific, Department of Earth Sciences, Faculty of Science, Kobe University.
Geological Society of Australia Symposium Proceedings (1990) 1, 71-82
Rainfall and river flow variability in Africa, Australia and East Asia linked to El Nino - Southern Oscillation events Peter Whetton1, Donald Adamson2 and Martin Williams3 formerly Department of Geography, Monash University, Now CSIRO Division of Atmospheric Research, PMB No. 1 Mordialloc, VIC 3195, Australia. 2
School of Biological Sciences and Quaternary Unit Research, Macquarie University, North Ryde, N.S.W. 2109, Australia. 3 Cainozoic Research Unit, Department of Geography & Environmental Science Monash University, Clayton, VIC 3168, Australia.
Rainfall and river flow data for all available years from 1870 show intriguing links between year to year variations in the discharge of the Nile and Senegal rivers in Africa, the Krishna in India, the Darling in Australia, rainfall in China and India, and El Nino-Southern Oscillation (ENSO) events. (Variations in the Southern Oscillation Index (SOI) are used as a measure of ENSO). Statistical analysis revealed that severe droughts in the regions represented have often been synchronous and coincide with times when the SOI is strongly negative. Major flood events also tend to be synchronous and tend to coincide with a strongly positive SOI. Some of the relationships revealed between ENSO and rainfall/discharge are well known from previous regional studies. We emphasise here the significant positive correlation obtained between the SOI and Nile discharge (a relationship noted early this century but subsequently largely neglected) and between the SOI and the rainfall of North China (a relationship we explore here in some detail). Although ENSO is one source of major variability in global rainfall patterns, little is currently known of the role of ENSO events in past and possible future climatic change. Key words: China, climatic change, droughts, Darling River, El Nino, floods, India, Nile, rainfall variability, Southern Oscillation.
INTRODUCTION The geological record contains abundant evidence of episodic or cyclic variations in fluviatile deposition. Although many such changes reflect former tectonic or eustatic controls, or simple shifts in the locus of deposition caused by channel migration, others do not. During the late Cainozoic, global climatic oscillations associated with the waxing and waning of continental ice sheets had a major impact on fluviatile load to discharge ratios at time scales of 103 - 104 years (Adamson et al. 1980). Of more immediate relevance are the inter-annual fluctuations in river flow associated with historic floods and droughts, especially if these can be linked to major fluctuations in global atmospheric and oceanic circulation patterns. Such an actualistic approach is a prerequisite to re-examining the stratigraphic record, and provides the rationale for this paper. It is thoroughly appropriate for Quaternary geologists andfluvialgeomorphologists to ask whether
river response to Quaternary environmental change holds any obvious and useful lessons for the future. However, it is futile, and ultimately destructive of disciplinary credibility, to claim that a knowledge of past geological events will automatically provide planners with a panacea to solve all of our present and future environmental woes. Such a claim rings very hollow at a time when the precise role of climatic fluctuations unrelated to human activities cannot always be clearly distinguished from the impact of those changes which are unequivocally anthropogenic. There are several possible ways around this dilemma, depending upon the questions being asked and the level of detail being sought (De Deckker et al. 1988). One approach is to examine the direct effects upon river behaviour of widespread human modification of the vegetation cover. Examples include the Ethiopian highlands since World War II (Nicol 1971); Nepal since the late 1950s (Junor 1981); and Australia since European settlement (Blong &
72 WHETTON ETAL. Riley 1977; Eyles 1977; Wasson & Galloway 1986). Another approach is to compare theflowresponse of a number of big rivers with changes in the annual or seasonal incidence of rainfall in their headwaters over a long interval, preferably a century or more (Williams et al. 1986; Adamson et al. 1987). Ideally, the record should extend back to well before the onset of the Industrial Revolution, in order to eliminate major anthropogenic influences upon world climate from the analysis. Apart from ice cores and tree rings, few existing data sets possess the necessary resolution. A third and more oblique approach is to compare the alluvial stratigraphies preserved in major river basins like the Nile and the Amazon with the history of environmental change established independently of the fluvial evidence. Examples of some of the achievements as well as some of the pitfalls of this approach are given by Adamson et al. (1980), Williams and Royce (1982) and Williams (1985). In his classic paper entitled "Fining-upwards cycles in alluvial successions," J.R.L. Allen (1965) drew attention to two unresolved problems. One concerned the respective depositional environments of the coarse and fine members of such successions. The other involved the reasons for the repetitive character of such cycles. In speculating about possible causes of this cyclicity, he mentioned three possibilities only. These were channel migration, changes in river base level, and periodic earth movements. Curiously enough, Allen did not refer to the climatic oscillations responsible for the successive glacial-interglacial cycles of the Quaternary. Nor did he allude to the already strong evidence from Quaternary geology that repetitive changes in river behaviour were often a function of repetitive changes in fluviatile load-todischarge ratios directly related to Quaternary climatic fluctuations. Much of this pioneering work still deserves study. Despite eloquent and carefully documented arguments to the contrary (Bowler 1978; Chappell 1985; Wasson & Clark 1987), there is a persistent unwillingness among many geoscientists to try to come to grips with the continuing repercussions of the environmental changes evident in Australian late Cainozoic rivers, lakes and dunes. Part of this resistance to palaeoclimatic research may stem from an acute awareness of how little we know about present-day landscape dynamics, including the nature of the alluvial response to historic fluctuations in climate (Erskine & Warner 1988; Riley 1988). Another factor is the highly variableflowbehaviour of the rivers of Australia (and Southern Africa) relative
to the rest of the world (Finlayson & McMahon 1988). Kuhnel et al. (1989) have recently attributed this variability to the influence of the Southern Oscillation. Two immediate questions spring to mind. How old is the Southern Oscillation? And are certain rivers outside Australia and Southern Africa not also influenced by it, as we believe they are (Adamson et al. 1987)? This paper seeks to offer some answers to this second question. Our aims are to explore possible links between historic fluctuations in river flow and rainfall in certain regions of the globe (including eastern Australia, North Africa, peninsular India and northern China) and those periodic anomalies in global atmospheric and oceanic circulation collectively known as El Nino/Southern Oscillation (ENSO) events. EL NINO-SOUTHERN OSCILLATION EVENTS AND GLOBAL RAINFALL PATTERNS Over sixty years ago, Sir Gilbert Walker crosscorrelated pressure data from stations all around the globe (Walker 1924). He clearly established that atmospheric surface pressure tended to be below normal throughout the central and south Pacific at the same time that it was above normal across Australia, South-East Asia and the Indian Ocean, and conversely. These linked pressure variations, which fluctuate on a time scale of years, Walker termed 'the Southern Oscillation'. Walker also found that rainfall variations showed statistical links (or teleconnections) associated with the Southern Oscillation. He noted that rainfall over India and Java was negatively correlated with atmospheric pressure variations at Darwin in northern Australia. Walker's colleague, E.W. Bliss (1925), demonstrated that variations in Nile discharge, and hence in rainfall over east Africa, were similarly correlated with Darwin pressure. Also around this time, the Australian meteorologist, E. W. Quayle (1929), noted that Darwin pressure variations were strongly negatively correlated with rainfall in south-eastern Australia. Today the Southern Oscillation is widely recognised as a key source of variability in the global atmospheric circulation. Its variation is commonly measured by a Southern Oscillation Index (SOI) most often based on the difference in surface pressure between Tahiti and Darwin. When the SOI is strongly positive, pressure is high in the Pacific, but low over the Australian - Indian Ocean region; when the SOI is negative the opposite pattern prevails. The
ENSO-RELATED FLOODS AND DROUGHTS
73
Fig. 1 An indication of the two key regions of the Southern Oscillation. During an ENSO event (negative SOI), the stippled area shows surface pressure above normal, and the hatched area shows pressure below normal. During an anti-ENSO event the opposite pattern prevails. This figure is adapted from Figure 10 in Berlage (1957), in which the correlation of annual pressure anomalies with pressure in Jakarta was mapped. Here we have indicated only those correlations greater than 0.4 and less than -0.4.
Southern Oscillation is also closely linked with an oceanic event of the eastern equatorial Pacific: El Nino. In an El Nino event unusually warm water appears off the Peruvian coast and stretches into the equatorial central Pacific. El Nino is associated with low atmospheric pressure in the region (negative SOI) and its occurrence is often referred to as an El Nino Southern Oscillation (ENSO) event. Colder than average sea surface temperatures off the coast of Peru coincide with times when the SOI is positive, and such occurrences are called anti-ENSO (or La Nina) events. Variations in the Southern Oscillation and El Nino are linked via a phenomenon known as the 'Walker Circulation'. This is a thermally driven atmospheric cell consisting of an arm of ascending air over the warm seas of the Indonesian region and a descending arm over the usually cool eastern Pacific. The main regions where pressure variations are dominated by the Southern Oscillation are shown in Figure 1. More details on ENSO can be found in one of the many summaries available (e.g. Julian & Chervin 1978; Streten & Zillman 1984; Ramage 1986). For a long time after the early work by Walker, the Southern Oscillation, and its related rainfall anomalies, received little further attention. Perhaps the behaviour of the Southern Oscillation through this time encouraged this neglect. The late 1920s and the 1930s saw few Southern Oscillation fluctuations and
no extreme ones. Hurst (1952) recalculated the correlation of the Nile with Darwin pressure, found it weaker, and questioned the validity of the relationship. Treloar and Grant (1953) re-examined the results of Quayle (1929) for Australian rainfall and arrived at similar conclusions to Hurst. Berlage (1957) extended and updated the global pressure correlations of Walker (1924). He found some weakening of relationships, but the bulk of the evidence clearly demonstrated the existence and importance of the Southern Oscillation. Berlage linked the Southern Oscillation with El Nino, and with the events of high rainfall at central Pacific islands and the Peruvian coast associated with El Nino. From Berlage's day, and in particular following the work of Troup (1965) and Bjerknes (1966, 1969) on the Walker circulation, the research focus has remained largely on the Pacific and on El Nino Southern Oscillation events. Further research on rainfall variability in the region has demonstrated that, in addition to Peruvian flooding (Caviedes 1975, 1984), ENSO events bring drought to north-eastern Brazil (Caviedes 1973), and weaker precipitation responses are present elsewhere in the South American continent (Pittock 1980; Aceituno 1988). For North America a weak ENSO signal in rainfall has been found (Ropelewski & Halpert 1987).
74 WHETTON ETAL. For the Australian - Indian Ocean side of the Southern Oscillation (the region where pressure is high when the SOI is low) the last decade or so has seen a revival in interest in the link between ENSO and rainfall variability. Pittock (1975), Nicholls and Woodcock (1981) and McBride and Nicholls (1983) re-established the existence of the strong ENSO signal in the rainfall of the Australian continent. In confirmation of the results of Walker (1924), Nicholls (1981) showed an ENSO link with Indonesian rainfall and Pant and Parthasarathy (1981) and Rasmusson and Carpenter (1983) demonstrated the association of ENSO with the Indian monsoon (with drought occurring during ENSO events, just as in Australia and Indonesia). Recent work has also revealed a connection between ENSO events and drought incidence in Papua New Guinea (Allen 1990; Allen et al. 1989). Work on Africa has also demonstrated the tendency for rainfall in certain parts of Africa to be low during ENSO events (Pittock 1984; Folland et al. 1986; Lindesay et al. 1986; Janowiak 1988). Finally, it appears that rainfall in parts of China (Wang & Zhao 1981) is also reduced during ENSO events. This renewed interest in the Indian ocean side of the Southern Oscillation and its associated rainfall anomalies is appropriate. Although this region is well removed from the spectacular oceanic events of El Nino in the eastern Pacific, it is where the Southern Oscillation appears to extend its greatest influence over continental land masses (see Figure 1), and hence it is where ENSO has its greatest impact on human activity. Our knowledge of ENSO-related rainfall variability in the region is not complete. The correlation of Nile discharge with the Southern Oscillation noted by Walker (1924) (but questioned by Hurst (1952)) has remained largely neglected, but if it is still present, this would be of great importance in understanding famine and drought occurrence in north-east Africa. In addition, the link between ENSO and Chinese rainfall is potentially very important given China's population and its susceptibility in the past to catastrophic drought and famine, and it deserves a more thorough investigation than it has received to date. The aim of this paper, therefore, is to re-examine the links between ENSO events, and rainfall and river discharge variations in east Africa, India, China and Australia. In addition to drawing together the results of recent regional studies, we aim in particular to reevaluate the relationship between Nile flow and the Southern Oscillation, as well as to evaluate possible relationships between Chinese rainfall and the Southern Oscillation.
RAINFALL AND RIVER FLOW DATA To determine flood and drought events we have used annual discharge data for the Nile and Senegal rivers from Africa, the Krishna from India and the Darling from Australia (Fig. 1), and annual rainfall data from China and India. The discharge data for the Senegal river (UNESCO 1971) were measured at Bakel and span the years 1904-1964. The Senegal enters the Atlantic at St Louis (16°N, 17°W), and its discharge is broadly representative of rainfall variability in the Sahel region of West Africa (Palutikof et al. 1981). The Nile flow data span the years 1871-1984 and were obtained from Hurst and Phillips (1933), Shahin (1985), S. Dumitrescu (1987, pers. comm.) and Evans et al. (1987). The discharge is that measured at Aswan before completion of the High Dam in 1964 and at Dongola (which is upstream of the dam) thereafter. Nile flow mainly reflects inputs from the Blue Nile and Atbara rivers which in turn reflect rainfall variability in the Ethiopian highlands (Williams et al. 1986). Data for the Krishna river (UNESCO 1971) were collected at Vijayawada (17°N, 81°E) and span the years 1901-1960. Variations in the discharge of the Krishna also match closely those of the Godavari (UNESCO 1971), and together these rivers drain much of the Indian peninsula. These three rivers (the Senegal, Nile and Krishna) have their peakflowsduring the northern hemisphere summer monsoon (JJA), so that annual discharge values based on the calendar year were appropriate for use here. Monthly data for the Darling river were obtained from the Water Resources Commission of New South Wales and span the years 1884-1984; the measuring station was Wilcannia (32°S, 143°E). The Darling responds to both winter and summer rainfall variability over central eastern Australia and its flow normally peaks twice each year (Whetton & Baxter 1987). In this case the period from June of the nominated year to May of the following year was considered the most appropriate for constructing annual discharge values. Annual discharge for the Darling showed strong positive skewness which was adequately corrected using a fourth-root transform. Major variations in theflowof the Darling are similar to those of the other main rivers of inland eastern and north-eastern Australia, including the Lachlan, Murray and Murrumbidgee (Whetton & Baxter 1987; Erskine & Warner 1988; Riley 1988) and rivers carrying floods to Lake Eyre (Allan 1985). Use was also made of rainfall data from the Chinese Atlas of Floods and Droughts (Anon. 1981).
ENSO-RELATED FLOODS AND DROUGHTS This gives annual rainfall index values ranging from one (extreme wetness) to five (extreme dryness) for each year from 1470 to 1979 for 120 stations. In the Atlas index values are mapped for each year and also given in tabulated form. The data are based mainly on historical information, but records of actual rainfall amount are used where they exist. Here we have used the period 1870-1979, and have inverted the index values so that they may be read as an index of rainfall amount, with a high index corresponding to a high rainfall. We have excluded 37 stations that had frequent (greater than 20% of the total) missing data and have interpolated spatially using the maps given in the atlas to fill gaps in the record for the stations we retained. Two further stations on the edge of the domain (in Taiwan) were rejected because missing values could not be estimated easily. A single index for rainfall over north China was also constructed by averaging data from all of the stations (49 in number) north of the Changjiang (Yangtse) River (which flows from west to east across China around 30°N). We have focussed upon the rainfall of northern China as this is the region of China which shows the strongest ENSO signal in its rainfall (see below). For India we have constructed a rainfall index spanning the years 1871-1985 by averaging monsoonal rainfall totals (given by Parthasarathy et al. 1987) for all Indian districts except those of the northern uplands. The area covered is thus much larger than the catchment of the Krishna, and enabled us to confirm the ability of large rivers to integrate rainfall variability across their catchments. An annual Southern Oscillation index (SOI) was used, constructed by taking the seasonal index of Wright (1975) and averaging for the four seasons beginning in the southern autumn and ending in the southern spring. This index spanned the years 18701973. It was updated to 1986 using a Southern Oscillation index (from the Australian Bureau of Meteorology) based on the pressure difference between Tahiti and Darwin (the correction needed to bring the two series into agreement was determined using linear regression over the overlapping years of 1933-73). An updated version of Wright's SOI in seasonal form was also constructed by similar means. ANALYSIS AND RESULTS Enso and fluctuations in rainfall and river discharge The four river discharge data series, the Indian rainfall series, the north China rainfall index, and the
75
SOI, as described above, were each expressed as standardised anomalies with respect to the reference period 1911-1960. The means and standard deviations used are given in Table 1, and the seven standardised series are graphed in Figure 2. Superimposed on each data series are the corresponding smoothed series constructed using a ten-year Gaussian (Mitchell 1966) together with padding used at the ends of the series (Jones et al. 1986). (A ten year Gaussian suppresses frequencies of less than ten years). The time series for these flood/drought indicators show considerable agreement with each other. Extreme anomalies in one series often coincide with those of like sign in other series but very rarely do opposite extremes coincide. The most notable years for widespread and severe drought and negative SOI are 1877, 1899, 1902, 1941, 1965-66, 1972, and 198283. The severity of weather conditions throughout the globe in 1877 was described recently by Kiladis and Diaz (1986), who noted similarities with the anomalies of 1982-83. However, these authors did not refer to the low flow of the Nile and the extreme drought in northern China seen here. In 1941 all of the series, except the Darling, are at least one standard deviation below normal, and in the extreme year of 1972, the India, Nile and northern China series all show anomalies of more than two standard deviations below normal. These years of widespread drought generally correspond well with the extreme El Nino years documented for the eastern Pacific. However, it is notable that the events of 1891 and 1925-26, which were described as very strong El Nino events by Quinn et al. (1987), had limited impact in the western hemisphere; conversely, the extreme drought years of 1965/66 correspond with the occurrence of only a moderate El Nino (Quinn et al. 1987).
Table 1 Details of the data sets used. The means and standard deviations were calculated for the reference period 1911-1960. To allow for strong positive skewness, Darling annual flow (June to May) was corrected using a fourth-root transform. Data set
Record length
SOI North China Rainfall Index Indian Rainfall Krishna Discharge Senegal Discharge Nile Discharge Darling Discharge
Mean dev.
Std.
1870-1986 0.18
0.79
1870-1979 3.07 1871-1985 992.2 1901-1960 57.1 1904-1964 24.0 1871-1984 84.3 1886-1984 36.3
0.44 82.6 14.5 7.8 12.2 10.7
Unit
-
-
mm 10* Ml 106 Ml 106 Ml (Ml) 7 / 4
76 WHETTON ETAL.
Fig. 2 Time series representation of the seven data sets studied. Each series has been standardised with respect to the means and standard deviations given in Table 1, and each interval on the vertical axis represents two standard deviations. A smoothed version of the time series is shown by the solid curved line.
ENSO-RELATED FLOODS AND DROUGHTS 77 Years of major flooding, and positive SOI, were Table 2 Cross-correlation coefficients for the time series depicted 1887, 1889-90, 1894, 1916-17, 1955-56, 1964, 1975. in Figure 2, with the number of data pairs shown in brackets. Significance levels at 5% and 1% are shown by one and two Perhaps the most remarkable of these was 1956, when asterisks, we have allowed for the reduction in rainfall in Northern China was two standard degrees ofrespectively; freedom due to persistence. Coefficients for SOI, deviations above normal, flow of the Krishna the Chinese and Indian rainfall, and Nile and Darling discharge can greatest in the record, and that of the Darling the be considered representative of the whole study period of 18701986, wheras coefficients using Senegal or Krishna data have no second greatest. The period just passed (1988/89) has more than sixty data points (see text). seen similar conditions with flooding of the Nile in the Sudan (Wright 1988), a strong monsoon over the 0.29** Indian sub-continent with floods in Bangladesh N.ChinaRainf. (Pearce 1988), flooding in eastern China {People's (1879-1979) (110) Rainf. 0.65** 0.35** Daily, 1 and 8 August 1988) and above average Indian rainfall in Australia with widespread flooding in (1871-1985) (115) (109) Krishna 0.47** 0.30** 0.66** March and April 1989. (1901-1960) (60) (60) (60) To quantify these relationships further, correlation Senegal -0.03 0.09 0.00 coefficients were calculated for all possible pairs of (1904-1964) 0.24* (61) (61) (61) (57) series. Significance of correlations was assessed Nile 0.31** 0.38** 0.42** 0.42** allowing for reduction in the degrees of freedom due (1871-1984) 0.35** (114) (109) (114) (60) (61) to persistence (although this was quite small) using Darling 0.33** 0.50** 0.41** 0.18 0.34** the method used by Greenhut (1979), and the results (1886-1984) 0.58** (99) (94) (99) (60) (61) (99) are presented in Table 2. Significant positive SO N.China India Krishna Senegal Nile correlations are present for most pairs, even for Index Rainf. Rainfall (1870- (1870- (1871- (1901- (1904- (1871regions remote from each other. As would be 1986) 1979) 1985) 1960) 1964) 1984) expected the SOI is the best overall indicator of variability in the various series. However, Chinese rainfall correlates better with Indian rainfall and with Darling flow than with the SOI. This may be due to established earlier this century by Bliss (1925). It the failure of the SOI to encapsulate the full range of implies that the south-west monsoon which brings ENSO variability, alternatively, it could indicate the rain to the Ethiopian highlands in July to September existence of regional teleconnections independent of tends to vary coherently with the monsoon of Asia. Presumably, the generally higher than normal ENSO. A strong correlation is present between Indian pressure in the region in ENSO years (see Fig. 1) monsoon rainfall and the SOI, as would be expected suppresses monsoon activity. The weak correlation of given the results of previous research (e.g. Walker the Senegal with the SOI indicates that ENSO events 1924; Rasmusson & Carpenter 1983). Krishna river also have some influence over rainfall variability in flow correlates significantly with Indian monsoon the Sahel generally, a point noted by other workers. rainfall variability demonstrating the ability of big The World Meteorological Organisation summaries of rivers to integrate regional rainfall. The moderate recent relevant research also note that the Senegal correlation between Darling flow and the SOI is shows little correlation with the other series apart consistent with results published previously using from a weak one with the SOI and the Nile (WMO Australian data (e.g. McBride & Nicholls 1983). The 1985,1987). Janowiak (1988) observed that drier than correlation of rainfall in northern China and the SOI normal conditions prevailed during El Nino years in is also consistent with previous work (e.g. Wang & the vicinity of the Ethiopian highlands whereas wetter Zhao 1981). It is a fairly weak relationship (r = 0.29), conditions prevailed to the west. A westward decline but strengthens (r = 0.38) if the SOI for only JJA is in the ENSO signal is also discernible in our results used. This improved correlation is expected if the in that the correlation of the Senegal with the SOI is relationship is real because 80-90% of annual rainfall considerably weaker than that of the Nile. However, in northern China falls in these months (Bao 1982). the Nile and the Senegal correlate with each other moderately well. This suggests that the ENSO influence is stronger over the Blue Nile catchment in ENSO andflowof the Nile and Senegal rivers Ethiopia than it is to the west, but that the Ugandan headwaters of the White Nile, and perhaps the The moderate positive correlation in Table 1 between Ethiopian may also experience rainfall Nile discharge and the SOI confirms the relationship fluctuationshighlands common to the Sahel, generated in the
78 WHETTON ETAL. tropical Atlantic and Gulf of Guinea region, and independent of the Southern Oscillation. Some of this common rainfall variation could be associated with the long term trends present in Sahelian rainfall variation (which may be related to Atlantic seasurface temperature variations, see Folland et al. (1986)). Nile discharge also shows these trends. In particular, Nile discharge has declined markedly since 1960, reflecting a decrease in rainfall throughout the Sahel (Nicholson 1985). This trend may to some extent have masked the correlation of Nile discharge with the SOI. To examine this we removed the long period fluctuations of the Nile depicted in Figure 2 by subtracting the smoothed series from the unsmoothed one, and by correlating the resulting series with the SOI. Indeed, a stronger correlation (r=0.51) of Nile discharge with the SOI was obtained.
of rainfall with the SOI across China. These results are presented and discussed here. Although a number of works in recent years have touched upon or dealt with the association of rainfall variability in China and the SOI (e.g. Wang & Zhao 1981; Diaz & Fu 1987; Kiladis & Van Loon 1988) we are not aware of any previous presentations of the pattern of correlation of the SOI with rainfall over China akin to that to be presented here. Wang and Zhao (1981), for example, presented a rainfall/SOI correlation pattern for China, but filtered the rainfall data to remove quasi-biennial frequencies, thereby removing much variance that could have been due to ENSO forcing. Patterns of rainfall association with the seasonal SOI were obtained by correlating station annual rainfall index data for the 81 stations used with seasonal values of Wright's SOI for 1870-1979. The strongest pattern of correlation was obtained using Other features of time series for rainfall, river flow the SOI for JJA (the season at the height of the and the SOI monsoon) when six stations showed correlations significant at the 1% level (allowing for persistence). Another notable feature in Figure 2 is the abrupt This pattern of correlation (Fig. 3) is still fairly weak, change to lower rainfall and lower discharge around but shows localised areas of significant positive 1895-1898 for the Darling, the Nile and northern correlation on the North China Plain (including the China. Drought frequency in India also increased for area around Beijing) and in the Red Basin (32°N, a couple of decades at this time. The SOI decreased 105°E). These are areas of high population density at this time, but not sufficiently to explain the extent and intensive agriculture which have suffered badly of the sudden change in the other series. Thirty years from drought and famine in the past (e.g. in 1877 ago Kraus (1955a, b) identified this feature in the (Dando 1980)). Consistent with the results we rainfall records for a number of tropical and obtained earlier using the north China index the sign subtropical stations in both hemispheres, and it is also of the correlation is such that low rainfall is detectable in northern hemisphere zonal averages of associated with a negative SOI (El Nino conditions). rainfall in the recent analysis by Bradley et al. (1987). The correlation pattern shows some resemblance to Kraus suggested that it may be associated with a that calculated by Wang and Zhao (1981) although we strengthening of the upper westerlies, but this do not obtain the significant positive correlations in important climatic jump has received little further the south that they obtained, and we find stronger attention and is yet to be adequately explained. One correlations in the north. can also discern in Figure 2 the low variability of the The coherence of the inter-annual rainfall SOI during the 1920s and 1930s (compared, for variability of the North China Plain with that of the example, with the increased activity after 1950), and Red Basin is interesting, and is consistent with the the tendency for floods and droughts to be less coherence the regions show in the seasonal cycle of common. As we remarked in our earlier discussion, rainfall (Lau et al. 1988). Both regions are reasonably this led to a weakening of ENSO teleconnections at well exposed to the south-east but are well sheltered that time. by higher mountains to the west (Fig. 3). This suggests that ENSO events may influence the rainfall of these regions by reducing onshore rain-bearing PATTERN OF RESPONSE OF CHINESE easterly winds during ENSO years, and by enhancing RAINFALL TO ENSO EVENTS them in years of the opposite extreme. There is evidence to support this suggestion. Pan (1987) The decision in the previous analysis to restrict examined variations in atmospheric circulation over attention to rainfall in the north of China was based China and concluded that the monsoonal winds of on the results of examining the pattern of correlation summer tend to be more south-westerly during ENSO
ENSO-RELATED FLOODS AND DROUGHTS
79
Fig. 3 Map of the correlation between annual rainfall index over China and SOI for JJA for the period 1870-1979. Correlation coefficients greater than 0.25 (lightly shaded areas) are significant at the 1% level, after allowing for the reduction in degrees of freedom due to persistence, although this effect is quite small.
(negative SOI) events and more south-easterly under anti-ENSO conditions (positive SOI). Chen (1982) and Li (1988) have observed that to the north of China (in a region centred around 50-60°N and 110130°E) surface pressure, and 700hpa and 500hpa height, are positively correlated with the SOI during JJA. This relationship would induce a westerly flow anomaly over northern China during ENSO events and easterly anomaly for years of the opposite extreme. It is not clear why this pressure anomaly to the north of China exists in association with ENSO, but it may arise as a result of the propagation of Rossby waves into extra-tropical latitudes in response to ENSO-related sea surface temperature anomalies in the western tropical Pacific (see Nitta 1987). In any event, it is clear that a physical mechanism is available to explain the pattern illustrated in Figure 3. This suggests that the pattern is not due to chance, and
represents a real association between ENSO and Chinese rainfall variability. CONCLUDING DISCUSSION We have found that years of severe drought in Ethiopia, India, northern China and eastern Australia have often been synchronous over the past hundred years and have occurred during ENSO events (negative SOI). Similarly, major flood events in these regions also have a tendency to be synchronous, occurring in conjunction with anti-ENSO events (positive SOI). It can be assumed that similar synchronous drought (and flood) events will return in the future. The occurrence of droughts (and floods) in these regions is no insignificant matter. During the great drought of 1877 and its aftermath of famine, around six million people died in India (Seavoy 1986)
80 WHETTON ETAL. and an estimated ten million in China (Walford 1878; Dando 1980). We have demonstrated here that the association between Nile discharge and the Southern Oscillation, recognised by Walker (1924) but subsequently largely neglected, is valid using data updated to 1984. The relationship is more pronounced if long term fluctuations in Nile flow are removed. Thus, in the Ethiopian Highlands, it is individual years of intense drought, rather than long dry periods, that are associated with ENSO events. We have examined in some detail the nature of the ENSO relationship to Chinese rainfall. In particular, we were able to show that the pattern of correlation of the SOI with rainfall over China is consistent with the anomalies in regional atmospheric circulation associated with ENSO. It thus appears that ENSO events do indeed exert some control over Chinese rainfall variability. A tantalising question is whether or not we have seen over the last hundred years or so (essentially the period of the instrumental record) the full range of ENSO behaviour (and that of the related floods and droughts) possible under present climatic conditions. ENSO events, for which we have documentation, have generally lasted one to two years and the associated atmospheric and oceanic anomalies have evolved in a broadly similar manner. However, this is not always the case. The evolution of the extreme 1982/83 event was unusual in many respects (Philander 1983), and through the years 1940-1944 there is evidence of prolonged El Nino conditions in the Pacific (Whysall et al. 1987). In addition, we have noted here the relative absence of extreme events during the late 1920s and 1930s compared to their common occurrence in the 1950s. Does ENSO have modes of variability (such as shifting towards one extreme for an extended period, or changing frequency of extremes) in addition to the mode with which we are most familiar? If it does, this is of immense importance. For example, the non-linear relationship between river discharge in eastern Australia and the SOI (Whetton & Baxter 1987) implies that any increase in the frequency of anti-ENSO conditions (even if accompanied by more frequent ENSO events) would considerably increase mean discharge of the rivers in the area. If ENSO behaviour can change, it may be in response to changing global climatic conditions, such as changing global temperatures. Clearly, the question of how ENSO will respond to global warming triggered by the Greenhouse Effect is very important, but is presently one for which we have no answer (for
a discussion of possible ENSO responses to future Greenhouse changes, see Nicholls (1989)). Knowledge of ENSO-related floods and droughts over a period much longer than that of the instrumental period would provide greater scope for assessing stability in the magnitude and frequency of ENSO events. A five hundred year El Nino chronology for Peru has been compiled (Quinn et al. 1987), and we are presently examining the potential of some data sets of similar length representing rainfall in Ethiopia, China, India and Indonesia. ACKNOWLEDGEMENTS We thank Professor Wang Pinxian (Shanghai) for sending us and Dr. Kuah Khun-Eng for translating into English "Five Hundred Years of Wetness/Dryness in China", the Australian Research Council and the Australian National Fellowships Scheme for support, and H.C. Brookfield, J. Chappell, B.G. Hunt, N. Nicholls, A.B. Pittock, I. Simmonds and RJ. Wasson for constructive comments. Dr. S. Dumitrescu (UNESCO, Paris), kindly gave us access to unpublished Nile flow data, and we are grateful to Professor Gilbert White (USA) and Gerard Dekker (Kenya) for guiding us to additional sources of Nile flow data: ex Africa semper aliquid novi! REFERENCES ACEITUNO P. 1988. On the functioning of the Southern Oscillation
in the South American sector. Part I: Surface climate. Monthly Weather Review 116, 5 0 5 - 5 2 4 . ADAMSON D A . , GASSE F., STREET F A . & WILLIAMS M A J . 1980.
Late Quaternary history of the Nile. Nature 287, 50-55. ADAMSON DA., WILLIAMS MAJ. & BAXTER J . T . 1987. Complex
late Quaternary alluvial history in the Nile, Murray-Darling and Ganges basins: three river systems presently linked to the Southern Oscillation. In Gardiner V. ed. Proceedings of the First International Conference on Geomorphology, Manchester, September 1985, Part II, 875-887, John Wiley & Sons, Chichester. ALLAN RJ. 1985. The Australian summer monsoon, teleconnections, and flooding in the Lake Eyre basin. South Australian Geographical Papers 2, Royal Geographical Society of Australasia (South Australia Branch). ALLEN B. 1990. Frost and drought through time and space, Part I: The climatological record. Mountain Research and Development In press. ALLEN B . , BROOKFIELD H.G. & BYRON Y. 1989. Frost and drought through time and space, Part II: The written, oral and proxy records and their meaning. Mountain Research and Development In press. ALLEN J.R.L. 1965. Fining-upwards cycles in alluvial successions. Geological Journal 4, 2 2 9 - 2 4 6 . ANON. 1981. Five Hundred Years of Wetness/Dryness in China (in Chinese). Meteorological and Scientific Research Institute, Bureau of Meteorology. Cartography Press, Beijing, 333pp. BAO C.L. 1982. Aspects of the Climatology of China. University of
ENSO-RELATED FLOODS AND DROUGHTS 81
Hawaii, Department of Meteorology Report 82-4. BERLAGE H.P. 1957. Fluctuations of the general atmospheric circulation of more than one year, their nature and prognostic value. Mededelingen en Verhandelingen 69, 152. BJERKNES J. 1966. A possible response of the atmospheric Hadley circulation to the equatorial anomalies of ocean temperature. Tellus 28, 820-828. BJERKNES J. 1969. Atmospheric teleconnections from the equatorial Pacific. Monthly Weather Review 97, 163-172. Buss E.W. 1925. The Nile flood and world weather. Memoirs of the Royal Meteorological Society 1, 79-84. BLONG R J . & RILEY SJ. 1977. Effects of forestry practices on the hydrology and erosion of hillsides and channels. Submission to the Senate Standing Committee on Science and the Environment on the Impact on the Australian Environment of the current woodchip industry program (unpubl. MS). BOWLER J.M. 1978. Glacial age aeolian events at high and low latitudes: a southern hemisphere perspective. In van Zinderen Bakker E.M. ed. Antarctic Glacial History and World Palaeoenvironments, pp.149-172, Balkema, Rotterdam. BRADLEY R.S., DIAZ H.F., EISCHEID J.K., JONES P.D., KELLY P.M. & GOODESS C.M. 1987. Precipitation fluctuations over
northern hemisphere land areas since the mid-19th century. Science 237, 171-175. CAVIEDES C.N. 1973. Secas and El Nino: Two simultaneous climatical hazards in South America. Proceedings of the Association ofAmerican Geographers 5, 44-49. CAVIEDES C.N. 1975. El Nino: 1972: Its climatic, ecological, and human implications. Geographical Review 65, 493-509. CAVIEDES C.N. 1984. El Nino 1982-83. Geographical Review 74, 267-290. CHAPPELL J. 1985. Dating the past, and Australia's environmental future. Search 16, 216-219. CHEN W.Y. 1982. Fluctuations in Northern Hemisphere 700mb height field associated with the Southern Oscillation. Monthly Weather Review 110, 808-823. DANDO W A. 1980. The Geography of Famine. Winston and Sons, London. DE DECKKER P., KERSHAW A.P. & WILLIAMS M A J . 1988. Past environmental analogues. In Pearman G.I. ed. Greenhouse: Planning for Climate Change, pp. 473-488, EJ. Brill, Leiden. DIAZ H.F. & Fu C 1987. Regional precipitation and temperature variability and its relationship to the Southern Oscillation. In Ye Duzheng, Fu Congbin, Chao Jiping and Yoshino M. eds. The Climate of China and Global Climate, pp. 213-223. Chian Ocean Press, Beijing. ERSKINE W.D. & WARNER R.F. 1988. Geomorphic effects of alternating flood-and drought-dominated regimes on N.S.W. coastal rivers. In Warner R.F. ed. Fluvial Geomorphology in Australia, pp.223-244, Academic Press Australia, Sydney. EVANS T.E., STUCK A.Y. & NOUR EL-DIN M. 1987. Another and up-to-date look at river Nile flows. Proceedings National Hydrology Symposium, University of Hull, British Hydrological Society, 11, 11.1-11.10. EYLES RJ. 1977. Changes in drainage networks since 1820, Southern Tablelands, N.S.W. Australian Geographer 13, 377386. FINLAYSON B.L. & Mc MAHON TA. 1988. Australia v. the World: A comparative analysis of streamflow characteristics. In Warner R.F. ed. Fluvial Geomorphology of Australia, pp.1740, Academic Press Australia, Sydney. FOLLAND C.K., PALMER T.N. & PARKER D.E. 1986. Sahel rainfall and worldwide sea temperatures, 1901-85. Nature 320, 602607. GREENHUT G.K. 1979. Reply (to Sciremammano). Journal of Physical Oceanography 9, 1298-1299. HURST H.E. 1952. The Nile: A General Account of the River and the
Utilization of its Waters, Constable, London.
HURST H.E. & PHILLIPS P. 1933. The Nile Basin Vol. IV and
Supplement, Physical Department papers Nos. 30 and 31, Government Press, Cairo. JANOWIAK J.E. 1988. An investigation of interannual rainfall variability in Africa. Journal of Climate 1, 240-255. JONES P.D., RAPER S.C.B., BRADLEY R.S., DIAZ H.F., KELLY P.M. & WIGLEY T.M.L. 1986. Northern hemisphere surface air
temperature variations: 1851-1984. Journal of Climate and Applied Meteorology 25, 161-179. JULIAN R.P. & CHERVIN R M . 1978. A study of the Southern Oscillation and Walker Circulation phenomenon. Monthly Weather Review 106, 1433-1451. JUNOR R.S. 1981. Impact of erosion on human activities, Bagmati catchment, Nepal. Journal of Soil Conservation Service ofNew South Wales 37, 41-50. KIIADIS G.N. & DIAZ H.F. 1986. An analysis of the 1877-78 ENSO episode and comparison with 1982-83. Monthly Weather Review 114, 1035-1047. KIIADIS G.N. & VAN LOON H. 1988. The Southern Oscillation. Part VII: Meteorological anomalies over the Indian and Pacific sectors associated with the extremes of the oscillation. Monthly Weather Review 116, 120-136. KRAUS E.B. 1955a. Secular changes of tropical rainfall regimes. Quarterly Journal of the Royal Meteorological Society 81,198210.
KRAUS E.B. 1955b. Secular changes of east-coast rainfall regime.
Quarterly Journal of the Royal Meteorological Society 81, 430439.
KUHNEL I., MCMAHON T A . , FINLAYSON, B.L., HAINES A., WHETION P.H. & GIBSON T.T. 1989. Climatic influences on
streamflow variability: a comparison between southeastern Australia and southeastern United States. Water Resources Research In press. LAU K.M., YANG G J . & SHEN S.H. 1988. Seasonal and intraseasonal climatology of summer monsoon rainfall over east Asia. Monthly Weather Review 116, 19-37. Li C. 1988. Actions of typhoons over the western Pacific (including the South China Sea) and El Nino. Advances in Atmospheric Sciences 5, 107-115. LINDESAY JA., HARRISON M.SJ. & HAFFNER M.P. 1986. The
Southern Oscillation and South African rainfall. South African Journal of Science 82, 196-198.
MCBRIDE J.L. & NICHOLLS N. 1983. Seasonal relationships
between Australian rainfall and the Southern Oscillation.
Monthly Weather Review 111, 1998-2004. MITCHELL J.M. ed. 1966. Climate Change. World Meteorological Organisation Technical Note 79.
NICHOLLS N. 1981. Air-sea interaction and the possibility of long-
range weather prediction in the Indonesian Archipelago. Monthly Weather Review 109, 2435-2443.
NICHOLLS N. 1989. ENSO and the Greenhouse. Submitted to
Climatic Change.
NICHOLLS N. & WOODCOCK F. 1981. Verification of an empirical
long-range weather forecasting technique. Quarterly Journal
of the Royal Meteorological Society 107, 973-976. NICHOLSON S.E. 1985. Sub-Saharan rainfall 1981-84. Journal of Climate and Applied Meteorology 24, 1388-1391.
NICOL C. 1971. From the Roof of Africa, Hodder & Stoughton,
London.
NITTA T. 1987. Convective activities in the tropical western Pacific
and their impact on the northern hemisphere summer circulation. Journal of the Meteorological Society of Japan 65, 373-390. PALUTIKOF J.P., LOUGH J.M. & FARMER G. 1981. Senegal river runoff. Nature 293, 414. PAN Y.H. 1987. Typhoon, monsoon in Asia and sea surface
82 WHETTON ETAL. Australian rainfall. Australian Journal of Agricultural Research temperature in the equatorial Pacific Ocean. In Ye Duzheng, 4, 423-429. Fu Congbin, Chao Jiping & Yoshino, M. eds. The Climate of China and Global Climate, pp.157-166, China Ocean Press, TROUP AJ. 1965. The 'Southern Oscillation'. Quarterly Journal of Beijing. the Royal Meteorological Society 91, 490-506. UNESCO 1971. Discharge of Selected Rivers of the World. U N E S C O , PANT G.B. & PARTHASARATHY B. 1981. Some aspects of an association between the Southern Oscillation and the Indian Paris. summer monsoon. Archxv fur Meteorologie, Geophysik, und WALKER G.T. 1924. Correlation in seasonal variations of weather, Bioklimatologie B29, 245-252. IX. A further study of world weather. Memoirs Indian Meteorological Department 24, 275-332. PARTHASARATHY B. SONTAKKE N A . MONOT A A . & KOTHAWALE D.R. 1987. Droughts/floods in the summer monsoon season WALFORD C. 1878. The famines of the world: Past and present. Journal of the Statistical Society 41, 433-526. over different meteorological subdivisions of India for the period 1871-1984. Journal of Climatology 7, 57-70. WANG S.W. & ZHAO Z.C. 1981. Droughts and floods in China PEARCE F. 1988. Cool oceans caused floods in Bangladesh and 1470-1979. In Wigley T., Ingram MJ. and Farmer G. eds. Sudan. New Scientist 8 September 1988, 31. Climate and History, pp.271-288 Cambridge University Press, Cambridge. PHILANDER S.G.H. 1983. Anomalous El Nino of 1982-83. Nature 305, 16. WASSON RJ. & CLARK R.L. 1987. The Quaternary in Australia PITTOCK A.B. 1975. Climatic change and patterns of variation in past, present and future. In Shelley E.P. ed. Australian Australian rainfall. Search 6, 498-504. Geoscience 1986-87. Bureau Mineral Resources, Geology and PrrrocK A.B. 1980. Patterns of climatic variation in Argentina and Geophysics Report 282, 29-34. Chile - I. Precipitation, 1931-60. Monthly Weather Review 108, WASSON RJ. & GALLOWAY R.W. 1986. Sediment yield in the 1347-1361. Barrier Range before and after European settlement, PrrrocK A.B. 1984. On the reality, stability, and usefulness of Australian Rangelands Journal 8, 79-90. southern hemisphere teleconnections. Australian WHEITON P.H. & BAXTER J.T. 1987. The Southern Oscillation and Meteorological Magazine 32, 75-82. river behaviour in south-eastern Australia. Proceedings of QUAYLE E.T. 1929. Long-range rainfall forecasting from tropical CLIMANZ III Conference, pp.39-43. Melbourne, November (Darwin) air pressures. Proceedings of the Royal Society of 1987. Victoria 41, 160-164. WHYSALL K.D.B., COOPER N.S. & BIGG G.R. 1987. Long-term QUINN W.H., NEAL V.T. & ANTUNEZ DE MAYOLO S.E. 1987. El changes in the tropical Pacific surface wind field. Nature 327, Nino occurrences over the past four and half centuries. 216-219. Journal of Geophysical Research 92, 14449-14461. WILLIAMS M A I 1985. Pleistocene aridity in tropical Africa, RAMAGE C.S. 1986. EL Nino. Scientific American 254, 55-61. Australia and Asia. In Douglas I. & Spencer T. eds. RASMUSSON E.M. & CARPENTER T.H. 1983. The relationship Environmental Change and Tropical Geomorphology, pp.219between eastern equatorial Pacific sea surface temperatures 233. George Allen & Unwin, London. and rainfall over India and Sri Lanka. Monthly Weather Review WILLIAMS M A J . & ROYCE K. 1982. Quaternary geology of the 111, 517-528. middle Son Valley, north central India: implications for RILEY S.J. 1988. Secular change in the annual flow of streams in prehistoric archaeology, Palaeogeography, Palaeoclimatology, the NSW section of the Murray-Darling Basin. In Warner Palaeoecology 38, 138-162. R.F. ed. Fluvial Geomorphology of Australia, pp. 245-266. WILLIAMS MAJ., ADAMSON DA. & BAXTER J.T. 1986. Late Academic Press, Australia. Quaternary environments in the Nile and Darling Basins. ROPELEWSKI C.F. & HALPERT M.S. 1987. Global and regional Australian Geographical Studies 24, 128-144. scale precipitation patterns associated with the El WORLD METEOROLOGICAL ORGANIZATION. 1985. The Global Nino/Southern Oscillation. Monthly Weather Review 115,1606Climate System - a Critical review of the Climate System during 1607. 1982-84. World Climate Data Programme, WMO, Geneva. SEAVOY R.E. 1986. Famine in Peasant Societies. Greenwood Press, WORLD METEOROLOGICAL ORGANIZATION. 1987. The Global New York. Climate System, Autumn 1984 - Spring 1986. World Climate SHAHIN M. 1985. Hydrology of the Nile Basin. Elsevier, Amsterdam. Data Programme, WMO, Geneva. STRETEN N A . & ZILLMAN J.W. 1984. Climate of the South Pacific WRIGHT M. 1988. Mixed blessings of the flooding in Sudan. New Ocean. World Survey of Climatology, vol. 13, Elsevier, Scientist, 22 September 1988, 44-47. Amsterdam. WRIGHT P.B. 1975. An index of the Southern Oscillation. Climatic TRELOAR H.M. & GRANT A.M. 1953. Some correlation studies of Research Unit, University of East Anglia, Norwich.
Geological Society of Australia Symposium Proceedings (1990) 1, 83-92.
Palaeoenvironmental research and global wanning R J . Wasson CSIRO Division of Water Resources, GPO 1666 Canberra, ACT 2601, Australia A unique and important role is often claimed for Quaternary research in current attempts to predict the global warming that is expected to result from rising levels of C0 2 , CU4, and other trace gases. Plausible counter arguments to this role include: the past is never adequately described for any practical use; long-period changes are of no interest for prediction; the past is a chain of unique events which has no predictive value. Each of these arguments is partially correct but, if data are collected in carefully designed ways, they can all be overcome. Examples are given in this paper of how high quality palaeo-environmental data illuminate the global climate system, provide tests independent of global circulation models of the sensitivity of climate to increasing C0 2 , and provide tests for global circulation models. It is found that three radically different ways of estimating climate sensitivity give about the same result, significantly strengthening the argument for global warming, and that climate is changing on relevant timescales by processes other than those associated with greenhouse gases, potentially confounding prediction. Finally, there is dispute about the use of past periods as analogues of future climate. The resolution of this argument largely depends upon better palaeoclimatic reconstructions from the Southern Hemisphere. Key words: palaeoenvironments, Quaternary, climatic change, greenhouse effect, global warming.
INTRODUCTION It has become commonplace to claim for palaeoenvironmental research a unique and vital place in the development of 'earth system science', both as a way of understanding the earth system and as a basis for prediction of the course and effects of global warming resulting from the increase of greenhouse gases. What is not so commonplace is the realisation that counter arguments are relatively easy to find. Some of the arguments are: the time periods over which many stratigraphically detectable changes occur are much longer, and rates of change generally much slower, in the Quaternary than in the likely future; and the history of any geological period is a sequence of unique events from which general laws for prediction cannot be drawn. The existence of these plausible counterarguments, indicating that the Quaternary is merely a storehouse of interesting pieces of history, rather than a source of uniquely important information that can be used in predicting global warming, sheets home to Quaternarists the task of carefully analysing their role in this growing field of research. Are we deceiving ourselves when we offer the Last Interglacial as an analogue of a global future warmer than now by several degrees? Does the fascinating interplay of
Laurentide ice sheet retreat, North Atlantic Bottom Water formation, and atmospheric circulation changes leading to the rapid cooling of the Younger Dryas, inform us about the earth system in a way that actually helps prediction? Does fine resolution pollen analysis actually provide information that ecologists can set beside observed physiological data to model ecosystem response to climate change? These and many other questions must be answered before Quaternarists can claim an important role in research like that envisaged in the International Geosphere and Biosphere Program (IGBP). The greenhouse effect, produced by radiatively active gases in the atmosphere, makes our planet habitable. This statement is not controversial. The ability of these gases to trap long-wave radiation coming from the earth's surface is not in doubt. Uncertainty arises when the climatic effect of increasing trace gases, caused by human activities, is predicted. Prediction of the direction and rate of global climate change, and regional variants, is the first step in making estimates of the effects of global warming on, for example, vegetation and water supplies. The accuracy and precision of these predictions of future climate are obviously of paramount significance. The rest of this essay is therefore concerned with the role
84
R J . WASSON
of palaeoclimate studies in either enhancing or making climatic predictions, potentially the most significant application of Quaternary research.
CLAIMED USES FOR RECONSTRUCTION
PALAEOCLIMATE
There are four classes of uses that are obvious from the literature on this topic.
Illumination of the global system and climate sensitivity Oeschger and Eddy (1989), in a potentially influential planning document for the IGBP, observed that studies of physical, chemical and biological data retrieved from sediments, ice cores and tree rings "more than any other, have been responsible for the dawn of Earth system science" (p.l). Interconnections between physical, chemical and biological processes that are not readily observable can be inferred from the stratigraphic record, and then modelled using an understanding of process (Broecker & Peng 1982). Processes with long internal adjustment times (Bolin 1974) can only be inferred stratigraphically, and the role of orbital geometry in driving the rhythmic glaciations and deglaciations of the globe could not have been discovered without statistical analysis of the isotopic signatures of long deep ocean cores (Hays et al. 1976). Various commentators have made similar observations, and a large number of examples of the uses of palaeoenvironmental studies can now be found. But it is not sufficient to argue for the continuation of this research into, generally, long periods of time simply because it provides information that no other disciplines can achieve. For predictions of global warming, specific uses must be found for the increasingly sophisticated understanding of Quaternary history. Others exist, but one of the most informative examples of such a specific use is provided by Lorius et al. (1990). A doubling of atmospheric C0 2 will heat the planet radiatively by about 4 Wm"2, corresponding to an equilibrium surface temperature change of about 1.2°C. Positive feedbacks in the earth system, such as water vapour, clouds, and sea ice, when incorporated in different General Circulation Models (GCMs) for a doubled C0 2 concentration, result in warming between 2.8 and 5.2°C (Washington & Meehl 1984; Wetherald & Manabe 1986; Wilson & Mitchell 1987; Cess & Potter 1988). The average of
~4°C reflects a climate sensitivity of about three. That is, the feedback effect produces a surface heating about three times the equilibrium temperature calculated from a C 0 2 doubling alone. The testing of this estimate of climate sensitivity is very important because upon it rests much of the basis for climate predictions using GCMs. One way to test it is to use measurements of C 0 2 and estimates of surface temperature for long periods derived from ice cores, the substance of the work by Lorius et al. (1990). In the 160 ka Vostok ice core from the Antarctic, there is a good correlation between atmospheric C0 2 (and probably CH4) and nearsurface temperature derived, respectively, from analysis of air bubbles (Barnola et al. 1987) and the ice deuterium (Jouzel et al. 1987). Lorius et al. (1990) have argued that this correlation is evidence of a causal association between atmospheric C0 2 and climate change over the time period of a glacial-interglacial cycle. C 0 2 concentrations are about 260-280 ppmv during the interglacials and 190-200 ppmv during full glacial conditions. C 0 2 and CH4 increased rapidly as temperature rose from the last full glacial to the Holocene. Similar results have been obtained from other Antarctic cores and from cores taken from Greenland, demonstrating their global significance. Genthon et al. (1987) showed, by means of a correlation analysis, that 90% of the variance in the Vostok temperature record is accounted for by three climatic variables: the radiative heating produced by C0 2 , from the logarithmic relationship of Hansen et al. (1984); local insolation, calculated from orbital parameters; and the ice volume record based on the deep sea 6 l s O signal, representing climatic amplification of solar insolation variations that appear to drive the 100 ka glacial-interglacial cycles. About 50% of the Vostok temperature variance is contributed by greenhouse gases, when the effect of CH4 is added to the analysis of C 0 2 by Genthon et al. (1987). This is the first demonstration that changes of greenhouse gases can play a role in global temperature change, over and above the various feedback processes that might be thought either to dampen or nullify the effect of the gases. This result stands even when other effects are considered, such as atmospheric dust and cloud condensation nuclei. Broccoli and Manabe (1987), using a GCM, showed that about 40% of the glacial-interglacial warming is attributable to greenhouse gases and associated fast feedback processes. Hansen et al. (1984) obtained a contribution of about 50% using the Goddard Institute for Space Science GCM. The
PALAEOENVIRONMENTS AND GLOBAL WARMING notable conclusion is that both models and correlation analyses based on palaeoenvironmental data indicate that about 50% of the post-glacial warming is associated with greenhouse gases. The 3-5°C change attributable to these gases during the post-glacial warming is the same as that predicted by GCM experiments involving a doubling of C0 2 . Lorius et al. (1990) have concluded that these consistent results indicate that the fast feedback processes, involving water vapour, cloud and sea ice, which amplify radiative forcing, are correctly handled in the GCMs. We might therefore have considerable faith in the GCM-based predictions of a warmer earth. There are many unresolved issues in this work. Firstly, the correlation analysis does not necessarily expose a causal relationship between greenhouse gases and temperature during glacial-interglacial transitions (cf. Sundquist 1986), as admitted by Lorius et al. Some ice core data indicate that C0 2 change followed temperature change during the postglacial warming although, as Galloway (1990) points out, chronologic resolution may not allow this conclusion. In the longer 160 ka Vostok record, C0 2 appears to both lead and lag temperature change. The combination of GCM results and ice core data therefore provides much more convincing evidence that the trace gases C0 2 and CH4 have played a role in global warming in the past, and that they could do so in the future.
Budyko et al. (1985) and Budyko (pers. comm.) have argued that the analogue approach provides an estimate of the sign and order of magnitude of climatic change that might accompany increasing C0 2 . Velichko (1987, and pers. comm.) suggested that maps of past temperature and precipitation for the Holocene thermal maximum and the last interglacial can be used as analogues of the regional pattern of future climate. Budyko et al. (1985) and Velichko (1987) have shown that zonal average temperatures during the three analogue periods listed above display very similar latitudinal patterns. In the Northern Hemisphere, zonal average temperatures increased substantially near the pole, and Budyko (pers. comm.) argues that the similarity of these patterns for each time period indicates that the reasons for the warming are not important. A warming by any cause will produce the same latitudinal pattern. Budyko et al. (1985) have also used palaeoenvironmental data to derive an estimate of climate sensitivity to C0 2 changes. Variations with time of atmospheric C0 2 are described by the mass balance dMc =
Analogues of future climate Hydrologists record floods in rivers, determine their best-fit frequency distribution and calculate the return period of events of particular magnitude. From these statistics, and either the knowledge or assumption that the series of measurements is stationary, probabilistic predictions can be made. This is a forecast based on an analogue from the past. If the series changes its variance significantly, the boundary conditions have changed and so the analogue predictions must then be based upon part of the series of measurements that is stationary. Not only must the record of the past be of the same phenomenon as we wish to predict but the boundary conditions of the past must be the same as those for the period of prediction. Flohn (1979), Kellogg (1977, 1978), Kellogg and Schware (1981), Butzer (1980), De Deckker et al. (1988) and Budyko et al. (1985) have all used periods in the palaeoclimatic record, thought to be warmer than now, as analogues of future warmer climate. The
85
preferred periods are the Holocene thermal maximum between 8 and 6 ka BP, the last (Eemian) interglacial about 120 ka BP, and the Pliocene warm interval, 3-4 Ma ago.
Ac - Bc
dT where dM c /dt is the rate of change of C0 2 content in the atmosphere, Ac the flux of C0 2 to the atmosphere (mainly from volcanoes), and Bc is the rate of C0 2 expenditure as carbonate rocks. These authors showed that there is a linear relationship between the mass of carbonate and volcanic rocks at any one time, at least during the Phanerozoic. There is, therefore, a tendency for atmospheric C0 2 to remain approximately constant over long periods, although variations are detectable. These variations are of paramount interest to us, however, because they may correlate with temperature variations. Budyko et al. (1985) showed a log-linear relationship between atmospheric C0 2 and the difference from the present of global temperature (calculated from pollen, macrofossils and 1 8 0/ 1 6 0 of marine organisms) for the period from the Pliocene to the Late Cretaceous. The temperatures used in this
86
R.J. WASSON
relationship are adjusted for albedo and solar constant change, and so too is that part of the total temperature change dependent upon C0 2 change alone. From this relationship, a doubling of C0 2 produces a temperature increase of 2-4°C. This figure is remarkably consistent with the estimates of climate sensitivity previously discussed and derived from GCMs. Moreover, as in the GCMs and the analysis of ice cores for the last 160 ka, about 50% of the unadjusted global temperatures of the last 100 Ma is due to factors other than C0 2 . There are many problems with the methods and data used by Budyko and colleagues. The calculation of global temperatures, the adjustment of temperature for albedo, the estimation of the mass of carbonate and volcanic rocks, are all problems that are not adequately dealt with. Yet the similarity of the calculated climatic sensitivity using radically different methods, while possibly coincidental, suggests that each of the methods is accurate enough for at least the calculation of global temperature dependence on C0 2 concentration. Further, some of the data of Budyko et aL (1985) are very similar to those derived by other methods/models (see Berner et aL 1983, for C0 2 estimates). The log-linear relationship between C0 2 and temperature change for the last 100 Ma, and the interpretation of latitudinal patterns of zonally averaged temperature for part of the Cainozoic, seriously challenge the view that boundary conditions during periods chosen as analogues must be the same as those of the near future before they are useful predictions. By contrast, Webb and Wigley (1985) argued that past climates cannot be analogues of future climates because the causes of past and future climate changes are not known. Flohn (1979) noted the differences between present and Mid-Holocene boundary conditions and rather obliquely inferred that the past is not a reliable analogue of future climate. That large differences in boundary conditions can lead to substantial differences of climate has been demonstrated in many modelling studies (e.g. Hyde & Peltier 1987, who explored ice volume changes in relation to solar radiation changes, the so-called Milankovitch forcing). Small and simple differences in boundary conditions can also lead to substantial and complex climatic responses (e.g. Mitchell et aL 1988). Mitchell (1990) has explicitly explored the problem of palaeoclimatic analogues of future climate using a GCM. He compared a GCM simulation using twice the pre-industrial concentration of C0 2 and
using the earth's orbital parameters of 9 ka BP. The fundamental differences between the two simulations are of course that C 0 2 was not higher than pre-industrial concentrations 9 ka BP, and the global distribution of solar radiation was different. The zonal changes of solar radiation at the top of the atmosphere due to a doubling of C0 2 are 2-4 Wm'2, whereas at 9 ka BP they were -40 to +40 Wm"2. That is, a C0 2 increase warms all latitudes and seasons whereas at 9 ka BP the warming appears to have been largely restricted to the Northern Hemisphere. Mitchell (1990) has argued that the nature of the perturbation that causes the warming will cause different distributions of climate change, a result apparently at variance with that of Budyko. He further argued that, if the British Meteorological Office 11-layer GCM, coupled to a static mixed layer ocean model and simple energy balance sea ice model, produces a realistic response to both a doubling of C0 2 and the orbital geometry of 9 ka BP, then the early Holocene is not a good analogue of future climate because the two simulations are starkly different. This conclusion is dependent in part upon the comparison of the 9 ka BP GCM simulation with palaeoclimatic reconstructions for the two hemispheres. Mitchell has acknowledged substantial discrepancies between the simulation and the palaeoclimatic data for the Southern Hemisphere but still concluded that the warming was substantially in the Northern Hemisphere. More quantitative palaeotemperature reconstructions are needed from the Southern Hemisphere, particularly from regions where there are none at present. Until these are available none of the comparisons between simulations and palaeoclimatic reconstructions can be considered adequate, and their potentially very important implications cannot be considered certain.
Testing GCMs Modelling of past climates is of value to Mitchell (1990) because it provides insights into the causes of climate change, as we saw in the last section, and can aid the interpretation of palaeoclimatic reconstructions. But retrodictive modelling is even more valuable as a way of testing GCMs. A model of the atmosphere must be able to simulate adequately the statistics of modern climate. But a model that can simulate modern climate may not be able to predict climate after a doubling of C 0 2 because of, for example, simplifications resulting from sub-grid scale parameterisations.
PALAEOENVIRONMENTS AND GLOBAL WARMING Mitchell (1990) has given an example of the sensitivity to cloud parameterisations of the Meteorological Office model. The ability of different versions of the model to simulate correctly the climate of 9 ka BP may allow a choice to be made between different cloud parameterisations. For this kind of investigation the period in the past chosen for simulation must have experienced boundary conditions not very different from those of the present and immediate future, so that the uncertainty in specifying these conditions does not obscure the sought-after results. For example, simulations of the last glacial maximum, as a test of GCMs, must properly account for changes in the distribution of ice sheets and sea ice, sea surface temperatures, land albedo, atmospheric aerosols, ocean circulation, as well as atmospheric C0 2 and orbital geometry (Mitchell et al. 1988). Cumulative errors in the reconstruction of each of these features of the past may make comparisons with model simulations of little value. Simulation of the Younger Dryas, a dramatic, rapid and short-lived event apparently ideally suited as a test for GCMs, is very hard to explain because its phase relationship with, for example, atmospheric C0 2 and changes in ocean circulation cannot be determined precisely by current dating. Harvey's (1989) modelling of this dramatic cooling event, 10 to 10.8 ka BP, is based upon four plausible hypothetical explanations, and indicates that palaeoclimatic data could be used to choose between these explanations if seasonal and highly resolved spatial signatures were available. This outcome is the reverse to our expectations. A model has pointed to palaeoclimatic data required to choose between the assumptions upon which the modelling proceeded. The stratigraphic studies and modelling have therefore contributed to our understanding of the causes of climate change and, if one of the explanations can eventually be verified stratigraphically, then further confidence will be gained in the model used by Harvey. Mitchell (1990) set up two criteria that must be met before modelling of past climates can be said to help the prediction of future climate changes. Firstly, the mechanisms producing the past changes must be well established both qualitatively and quantitatively. Secondly, the palaeoclimate data must be widely distributed and quantitatively reliable. At present neither of these criteria is adequately met either globally (especially in the Southern Hemisphere) or in Australia.
87
Records of change before the instrumental period Possibly the most useful palaeoenvironmental record for the current debate of global warming is that depicting changes of atmospheric C0 2 (and CH4) from about 1600 AD to the present (Pearman 1988). This record is based upon analysis of gas in bubbles trapped in Antarctic and Arctic ice for the first few centuries, and air samples taken since monitoring began in the instrumental period. The rapid rise of C0 2 since about 1800 AD (and 1850 AD for CH4) is clear from this record, even though precise measurements of the air samples began only in the 1950s. This is a straightforward example of the benefit of high-resolution palaeoenvironmental records in understanding the current state of a phenomenon (Wasson & Clark 1985). Such data only become useful for prediction after they have been modelled in either a deterministic/explanatory or statistical way. A far less straightforward but equally important benefit arises from trying to determine the causes and course of climatic fluctuations that have immediately preceded the industrial period and may be in progress at the present. The global warming that is apparent for most of this century (Karoly 1989) may be the result of increasing greenhouse gases or may be part of a climatic change with a time-constant longer than the period of instrumental recording but shorter than the major temperature changes of the Holocene. If such a change is demonstrable then it may confound current predictions of climate in the next century. Wigley (1988) has considered solar effects on climate for the past 300 and 10 000 years. Irradiance (luminosity) variations are thought to affect global mean temperature, and this proposition is tested using a box-upwelling-diffusion climate model. It is concluded for the last 300 years that irradiance variations have had a range of 0.3-0.4% with a corresponding range of global mean temperature fluctuations of 0.2-0.3°C, after taking into account ocean damping effects. Jones et al. (1986) showed a warming trend of about 0.05°C per decade from 1900 to 1984, so the typical variation of ±0.1°C due to solar irradiance during the last 300 years may be only a small contributor to the trend of this century. The cyclic perturbation just discussed that may give rise to temperature variations of the order of ±0.1°C has a period of about 80 years. Strong perturbations of solar output also occur over centuries. Variations of 14C concentration in tree rings of known age indicate changes in the solar wind which modulate the rate of 14C production in the upper
88
R.J. WASSON
atmosphere. Documentary and tree ring records show that positive C anomalies occur at times of sunspot minima, for example during the Maunder Minimum and Sporer Minimum (Eddy 1976, 1977) when western Europe, and possibly the entire globe, experienced the Little Ice Age between 1450 and 1850 AD (Grove 1988). Several analyses of the putative link between the C anomalies and palaeoclimate, since Eddy (1977), have failed to show a good correspondence. Recently, Wigley (1988) and Stuiver and Braziunas (1989) have used improved C records and the astonishing climatic record, based on evidence of glacial advances and retreats, compiled by Rothlisberger (1986), to re-examine the link. Both studies concluded, using a variety of statistical techniques, that there is a strong link. Wigley concluded that the global mean temperature perturbation associated with the major Holocene glacial advances was 0.4°C, representing a decline in solar irradiance of about 1 Wm" at the top of the troposphere. Libby (1987) used Fourier transforms of D/H and 0 / 0 in tree rings, U and organic C in rapidly deposited marine sediments, 0 / 0 in Greenland ice, and C in bristlecone pine rings from California to demonstrate a persuasive link between solar activity and global temperatures. Her argument is that variations of the sun cause variations in the temperature of the sea surface, thus causing the isotopic composition of water vapour leaving the sea to vary. This water is then stored in trees and ice. In addition, the solar wind reduces both the cosmic ray 14
14
14
2
18
16
18
16
14
flux to the earth's atmosphere and the production of cosmogenic nuclides like C, as we saw earlier. There is recorded in tree rings an inverse relationship between C content and the activity of the sun. Support for this is found in evidence for lowered sea surface temperatures in the area of El Nino during the Little Ice Age (Enfield 1988). Libby treated U and C in Californian marine sediments as surrogates for sea surface temperature, and also found correlations with her tree ring data. Table 1 shows the ages of the spectral peaks recorded by Libby (1987) and by Stuiver and Braziunas (1989). There is impressive agreement, although a formal non-parametric test of concordance is not possible because all of the peaks are not recorded in each medium. Libby (1987) used the Fourier model to predict a global cooling next century. Landscheidt (1987) used a continuous function of the time rate of change of the torque that drives the sun around the centre of mass of the solar system to describe cycles of solar activity. This function correlates well with the C data and has been used as a statistical basis for a prediction of global cooling next century. Wigley (1988) noted that if another Maunder Minimum event were to begin in the next few decades, as predicted by both Libby and Landscheidt, then the warming due to greenhouse gases would be offset somewhat. The greenhouse-induced warming, nonetheless, would still dominate. 14
14
14
Table 1 Spectral peaks, in years, recorded in a variety of phenomena that relate climate to solar activity. Libby (1987) Cryptomeria Japonica
Stuiver & Braziunas (1989) Santa Barbara marine core
Bristle- Greencone land pine ice core
D/H
180/160
Org.C
U
156 110 97 86 65 58
156 124 97 88 70 55
161 121 95 82 71 55
156 118 95 81 70 53
14C
180/160
162 108
179
-
-
100 78 68 58
X±l<7
Sunspots
Aurorae Tree rings
Years
Number Number
162 ±9 116± 7 97 ± 2 83± 4
90
55 ±2
.
69 ±2
.
22
130 88
.
.
.
Climate x±l a records
14 C
140 127 85-87
.
.
.
.
.
.
Years
Years
143 123 102-104 88
142 ±2 127 ±4 98 ±4 88 ±2
64 ±3
56 ±3
22
PALAEOENVIRONMENTS AND GLOBAL WARMING OBJECTIONS TO THE USE CLIMATE FOR PREDICTION
OF
PALAEO-
This topic is difficult to deal with because the objections have not been articulated in writing. I will therefore rely upon my recollections of conversations and comments made at conferences, with the important exception of the nature of historical sciences about which there is a large literature. I will consider three principal objections.
1. Whatever its use, past climate is not adequately described as quantitative estimates of temperature or rainfall, or adequately represented spatially. The quantitative reconstruction of climate is not simple, involving for the recent past careful statistical and ecological analysis, and for the distant past assumptions about the environmental requirements of taxa that may have subsequently evolved to their modern states. But significant progress has been made, with the analyses of Soviet scientists, for example, said to be accurate to ±1°C (for mean annual and/or summer temperatures) and ±50 mm (for mean annual precipitation) (Velichko 1987). Spatial coverage is a matter of more samples in the better-watered parts of the world, and much more effort in the dry lands like Australia. Kershaw and Nix (1989) have shown what is possible in the humid tropics of Australia, but the arid zone may not yield quantitative estimates of climate from pollen because of the large climatic range of modern genera represented in the pollen of inland sites. Lake level records offer more hope (Street-Perrott & Harris 1984), but not all Quaternary-age phenomena are useful. Future work designed to be of value for prediction must emphasise quantitative palaeoclimatic reconstructions, precise dating, and spatial coverage.
2. Long-period changes are of no interest for prediction. The modelling of changes with periods of 103 years may be of value if such a change has begun to increase temperature recently, so confounding predictions of the effect of greenhouse gases. But such a finding is likely to be very controversial because of the large chronologic uncertainties associated with it. It is much more likely that value will be found in model-based understanding of
89
Maunder Minimum-type events as an adjunct to climatic prediction. Finally, the work of Lorius et al. (1990) and Budyko et al. (1985) show that changes with periods of 104 to 107 years can be of value for climatic prediction.
3. The past is a chain of unique events which has no predictive value, and so geology is not a science. This is the most profound of the objections raised against historical enquiry. The search for natural laws to be used for explanation and prediction, carried out with rigorous tests of falsehood, is the hallmark of what physicists and chemists regard as science. Watson (1969) took up this apparent difference and showed that geology, physics and chemistry are all essentially the same. Geology provides a narrative of the earth's history but it does so by reference to laws (i.e. generalisations) that are ahistorical. For example, a sandstone is always formed by sedimentary process. A particular sandstone may differ from another sandstone because of unique formative conditions, but at the generic level, generalisation is valid. Gould (1988) showed how Hutton and Lyell grasped deep time by use of a vision of time's cycle; that is, time has no direction and the same states repeat infinitely. But this cycle allowed only the nature and approximate rate of formation of rocks to be revealed by comparison with present-day processes. Hutton and Lyell could not distinguish time periods within deep time until the arrow of time (the irreversible sequence of unrepeatable events) represented by fossils was understood. Time's cycle had laid the rocks, which we now interpret by the lawlike generalisations of petrology, and time's arrow provided the tool of biostratigraphy, based on evolutionary change. The unique chain of events in biology is certainly understandable, using modern ideas of evolution, but it may not be predictable. The formation of sandstone is both understandable and predictable, at least probabilistically. The Newtonian view of physics is mechanistic, with the course of every event determined precisely by initial conditions. Classical mechanics is in principle reversible; that is, it is ahistorical in the geological tradition of time's cycle. Classical thermodynamics claimed, however, that the 'machine' of the universe is running down and becoming less organised. Darwin, by contrast, saw the world getting more organised rather than less. Two major branches of physics, and a growing paradigm in biology, were seriously at odds. But Prigogine and Stengers (1984)
90
R J . WASSON
have argued that this view of physics dealt almost exclusively with closed systems and linear relationships. Darwin dealt with aspects of reality well outside the reductionist view of the world upon which the industrial age was built. The new physics emphasises disorder, instability, diversity, disequilibrium and non-linear relationships - all features of climate and Quaternary history. Initial conditions are important, as has been shown for climate (Lorenz 1963) and even for simple chemical systems (Prigogine & Stengers 1984). Each interglacial may be climatically similar during the Brunhes Magnetochron but each has a different flora because of small differences in the intervening periods. This randomness, according to Prigogine and Stengers, allows a difference between past and future, and the irreversibility of time's arrow is born. Such open systems are probably the norm rather than the anomaly. Randomness and openness lead to new order and structure, the basis of chaos theory. Some physicists are beginning to learn what geologists had never abandoned; nature combines both reversible and irreversible time. The avowedly historical science of geology, the basis of Quaternary studies, and the apparently ahistorical sciences of physics and chemistry appear to be converging. Our ability to predict future climate based solely on the past, here ignoring anthropogenic effects, is limited by the relatively small number of repeating cycles of the Holocene, during which we can reasonably argue that the boundary conditions are similar to the future. If the Holocene were three times longer and the I4C record in tree rings of comparable length, then we might be able to derive robust statistical relationships that would allow firmer prediction. Here is a sound empirical reason why prediction in the historical sciences is often not possible. Physicists can usually produce enough subject matter from which to generalise, but interglacials are not common. There is nothing unscientific about natural history, it simply lacks data. We must conclude that only some parts of the Quaternary record are of value for predictions of global warming.
CONCLUSIONS Enthusiastic support for the use of palaeoenvironmental data and reconstruction for climate prediction, without sobre reflection on what data should be used and why, is potentially damaging to the current efforts of Quaternarists. The past is not
the key to the future if past phenomena are poorly known, or were produced by conditions that will not occur within the period for which predictions are sought. In this paper, I have shown how palaeoenvironmental data illuminate the global climate system, do not appear to provide precise analogues of future climate, but provide otherwise unobtainable descriptions and, to some extent, predictions of climate changes that have little or nothing to do with greenhouse gases. The global response to doubling of C0 2 is a rise of mean annual temperature of between 2°C and 5°C. This measure of the climatic sensitivity has been derived from atmospheric models, the Vostok ice core and from reconstructions of Cretaceous and Cainozoic time. The similarity of results from different methods indicates either an extraordinary coincidence or that we should have no doubt that global warming is coming. GCMs appear broadly to agree on future global and zonal averages, but their predictions of regional climates are highly divergent. Different sub-grid scale parameterisations of phenomena such as clouds may explain divergent predictions. Palaeoclimate reconstructions and their modelling therefore have a unique role in helping the modellers to improve regional predictions. Without better predictions, the 'downstream' impacts of climate change cannot be seriously considered. The community of Quaternary scholars faces a unique challenge: to analyse rigorously our own relevance, and to take seriously the role of modelling in an interaction that will lead to both better understanding and prediction. ACKNOWLEDGMENTS I thank Barrie Pittock, Jim Bowler, Andrei Velichko, Mikhail Budyko and John Mitchell for discussions; the Australian Government Department of The Arts, Sport, Environment, Tourism and Territories, for funding to attend meetings in Europe on the use of palaeo-analogues; and Andrei Velichko for the opportunity to spend a thrilling week in the Department of Palaeogeography, USSR Academy of Sciences, Mowcow. REFERENCES BARNOIA J.M., RAYNAUD D . , KOROTKEVICH Y . S . & LORIUS C.
1987. Vostok ice core provides 160 000 year record of atmospheric C0 2 . Nature 329, 408-414.
/
PALAEOENVIRONMENTS AND GLOBAL WARMING BERNER R A . , LASAGA A.C., & GARRELS R.M. 1983. The
carbonate-silicate geochemical cycle and its effect on atmospheric carbon dioxide over the past 110 million years. American Journal of Science 283, 641-683. BOLIN B. 1974. Modelling the climate and its variations. Ambio 3, 180-188.
BROCCOLI A J . & MANABE S. 1987. The influence of continental
ice, atmospheric C0 and land albedo on the climate of the last glacial maximum. Climate Dynamics 1, 87-89. BROECKER W.S. & PENG T-H. 1982. Tracers in the Sea. Lamont-Doherty Geological Observatory, Palisades, N.Y. BUDYKO M.I., RONOV A.B. & YANSHIN A.L. 1985. History of the Earth's Atmosphere. Springer-Verlag, Berlin. BUTZER KLW. 1980. Adaptation to global environmental change. Professional Geographer 32, 269-278. CESS R.D. & POTTER G.L. 1988. A methodology for understanding and intercomparing atmospheric climate feedback processes in general circulation models. Journal of Geophysical Research 93, 8305-8314. DE DECKKER P., KERSHAW A.P. & WILLIAMS MAJ. 1988. Past environmental analogues. In Pearman G.I. ed. Greenhouse: Planning for Climate Change, pp. 473-488, CSIRO, Melbourne. EDDY J A . 1976. The Maunder Minimum. Science 192, 1189. EDDY JA. 1977. Evidence for a changing sun. In Eddy JA. ed. The New Solar Physics, pp. 11-33. Westview Press, Boulder, Colorado. ENFIELD D.B. 1988. Is EL Nino becoming more common? Oceanographic Magazine 1, 23-27, 59. FLOHN H. 1979. Can climate history repeat itself? Possible climatic warming and the case of palaeoclimatic warm phases. In Bach W., Pankrath J. & Kellogg W. eds. Mans Impact on Climate, pp. 15-28, Elsevier, Amsterdam. GALLOWAY, R.W. 1990. Will greenhouse put us in the doghouse? Opportunities and pitfalls in current research. In Bishop P. ed. Lessons for Human Survival: Nature's Record from the Quaternary, pp. 3-7. Geological Society of Australia Symposium Proceedings 1, Sydney, August 1988. 2
GENTHON C., BARNOIA J.M., RAYNAUD D., LORIUS C., JOUZEL J., BARKOV N.I., KOROTKEVICH Y.S. & KOTLYAKOV V.M. 1987.
Vostok ice core: climatic response to C0 and orbital forcing 2
changes over the last climatic cycle. Nature 329, 414-418. GOULD S.J. 1988. Time's Arrow, Time's Cycle. Penguin, London. GROVE J.M. 1988. The Little Ice Age. Methuen, London. HANSEN J., LACIS A., RIND D., RUSSELL G., STONE P., FUNG I., RUEDY R. & LERNER J. 1984. Climate sensitivity and analysis
of feedback mechanisms. In Hansen J. and Takahashi T. eds. Climate Processes and Climate Sensitivity, Geophysical Monograph 29, 130-163. American Geophysical Union, Washington DC. HAYS J.D., IMBRIE J. & SHACKLETON N J . 1976. Variations in the earth's orbit: pacemaker of the Ice Ages. Science 194,1121. HARVEY L.D.D. 1989. Modelling the Younger Dryas. Quaternary Science Reviews 8, 137-149. HYDE W.T. & PELTIER W.R. 1987. Sensitivity experiments with a model of the Ice Age Cycle: the response to Milankovitch Forcing. Journal of the Atmospheric Sciences 44, 1351-1374. JONES P.D., RAPER S.C. & WIGLEY T.M.L. 1986. Southern hemisphere surface air temperature variations: 1851-1984. Journal of Climate and Appled Meteorology 25, 1213-1230.
JOUZEL J., LORIUS C , PETIT J R., GENTHON C., BARKOV N.I., KOTYAKOV V.M. & PETROV V.M. 1987. Vostok ice core: a
continuous isotope temperature record over the last climatic
cycle (160 000 years). Nature 329,403-408. ROLY D J . 1989. Evidence of recent temperature trends in the
southern hemisphere. In Pearman G.I. ed. Greenhouse: Planning for Climate Change, pp. 52-59, CSIRO, Melbourne.
91
KELLOGG W.W. 1977. Effects of human activities on climate.
World Meteorological Organization Technical Note 156 (WMO No. 486), World Meteorological Organization, Geneva, Switzerland. KELLOGG W.W. 1978. Global influences of Mankind on climate. In Gribbin J. ed. Climatic Change, pp. 205-227. Cambridge University Press, Cambridge, U.K. KELLOGG W.W. & SCHWARE R. 1981. Climatic Change and Society. Westview Press, Boulder, Colorado. KERSHAW A.P. & Nix H A . 1989. The use of bioclimatic envelopes for estimation of quantitative palaeoclimate values. In Donnelly T.H. and Wasson RJ. eds. CUMANZ 3, pp. 78-85, CSIRO, Canberra. LANDSCHEIDT T. 1987. Long-range forecasting of solar cycles and climatic change. In Rampino M.R., Sanders J.E., Newman W.S. and Konigsson, L.K. eds. Climatic History, Periodicity and Predictability, pp. 421-425. Van Nostrand and Reinhold, N.Y. LIBBY L.M. 1987. Evolution of historic climate and prediction of near-future climate from stable isotope variations in tree rings. In Rampino M.R., Sanders J.E., Newman W.S. and Konigsson, L.K. eds. Climate-History, Periodicity and Predictability, pp. 81-89, Van Nostrand and Reinhold, N.Y. LORENZ E.N. 1963. Deterministic nonperiodic flow. Journal of the Atmospheric Sciences 20, 130-141. LORIUS G , JOUZEL J., RAYNAUD D., HANSEN J. & LE TREUT H.
1990. Greenhouse warming, climate sensitivity and ice core data. Nature In press.
MITCHELL J.F.B., GRAHAME N.S. & NEEDHAM K.J. 1988. Climate
simulations for 9000 years Before Present: seasonal variations and effect of the Laurentide Ice Sheet. Journal of Geophysical Research 93, 8283-8303. MITCHELL J.F.B. 1990. Greenhouse warming: is the Holocene a good analogue? Journal of Climate In press. OESCHGER H. & EDDY J A . 1989. Global Changes of the Past. IGBP Report 6, IGBP Secretariat, Stockholm. PEARMAN G.I. 1988. Greenhouse gases: evidence for atmospheric changes and anthropogenic causes. In Pearman G.I. ed. Greenhouse: Planning for Climate Change, pp. 3-22, CSIRO, Melbourne. PRIGOGINE I. & STENGERS I. 1984. Order out of Chaos. Flamingo, London. ROTHLISBERGER F. 1986. lOOOOJahre Gletschergeschichte derErde. Aarau, Verlag Sauerlandu. STREET-PERROTT FA. & HARRISON S.P. 1984. Temporal variations in lake levels since 30 000 yr BP - an index of the global hydrological cycle. In Hansen J.E. and Takahashi T. eds. Climate Processes and Climate Sensitivity, Geophysical Monograph 29, American Geophysical Union Maurice Ewing Series Volume 5. STUIVER M. & BRAZIUNAS T.F. 1989. Atmospheric C and century-scale solar oscillations. Nature 338, 405-407. SUNDQUIST E.T. 1986. Geologic analogues: their value and limitations in carbon dioxide research. In Trabalka J.R. and Reichle D.E. eds. The Changing Carbon Cycle: A Global Analysis, pp. 371-402, Springer-Verlag, N.Y. VELICHKO AA. 1987. Relationship of climatic changes in high and low latitudes of the Earth during the Late Pleistocene and Holocene. In ?6cs\ M. and Velichko AA. eds. Palaeogeography and Loess, pp. 9-26. Akaddmiai Kiad6, Budapest. WASHINGTON W.M. & MEEHL J. 1984. Seasonal cycle experiments on the climate sensitivity due to a doubling of C0 with an atmospheric general circulation model. Journal of Geophysical Research 89, 9475-9503. WASSON R.J. & CLARK R.L. 1985. Environmental history for explanation and prediction. Search 16, 258-263. 14
2
92
R.J. WASSON
WATSON R A . 1969. Explanation and prediction in geology. Journal
of Geology 77,488-494.
WIGLEY T.M.L. 1988. The climate of the past 10 000 years and
the role of the sun. In Stephenson F.R. and Wolfendale A.W. eds. Secular Solar and Geomagnetic Variations in the Last 10 about a wanner world. In MacCracken M.C. and Luther 000 Years, pp. 209-224, Kluwer, Dordrecht. F.M. eds. Projecting the Climate Effects of Increasing Carbon WILSON CA. & MITCHELL J.F.B. 1987. A doubled C0 climate Dioxide, pp. 239-257, U.S. Department of Energy, Washinton sensitivity experiment with a global climate model including DC. a simple ocean. Journal of Geophysical Research 92, WETHERALD R/T. & MANABE S. 1986. An investigation of cloud 13315-13343. cover change in response to thermal forcing. Climatic Change
WEBB T. & WIGLEY T.M.L. 1985. What past climates can indicate
2
8, 5-23.
ISBN: 0-909869-73-1