GAS IN AUSTRALIAN COALS
OJ µl
3
O" (D
-, -,
'< ll.> :::J
0.
a
(D
"O (D
-,
en
--.....
(D
0.
en
(0 (0
-..... G) )>
,.
} \
.. ,
~-
(/)
-z
)>
C (/)
-I :Il
Edited by:
)>
r
)>
W.J. BAMBERRY and A.M. DEPERS
z
()
0
)>
r
(/)
~,
GEOLOGICAL SOCIETY OF AUSTRALIA SYMPOSIUM PROCEEDINGS 2 A Symposium on seam gas organised by
ISBN: 0-86418-149-3
the GSA Coal Geology Specialist Group and held at the School of Mines, University of New South Wales, 4-5th. February, 1991
GAS IN AUSTRALIAN COALS
Edited by: W. John Bamberry Coal Geology Branch Department of Minerals and Energy Singleton, N.S. W. 2330 and Aivars M. Depers Department of Geology University of Wollongong Wollongong, N.S. W. 2500
GEOLOGICAL SOCIETY OF AUSTRALIA SYMPOSIUM PROCEEDINGS 2 \£ T A Symposium on seam gas organised by the GSA Coal Geology Specialist Group and held at the School of Mines, University of New South Wales, 4-Sth. February, 1991
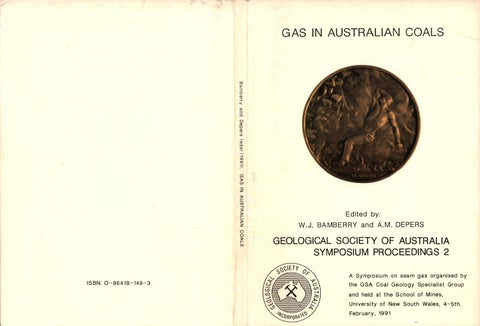
GAS IN AUSTRALIAN COALS GEOLOGICAL SOCIETY OF AUSTRALIA SYMPOSIUM PROCEEDINGS 2 ISBN: O-86418-149-3 Printed at the University of Wollongong Printery, University of Wollongong, P .O.Box 1144, Wollongong, N.S.W. 2500 The front cover shows a mining medal from France, struck approximately 100 years ago, which depicts a gas outburst due to fire damp or pit gas ("Le Grisou"). Reproduced from Westfalia Lunen ·s 1981 ·coinage and Mining· calendar, from the March page "Mining Coinage from France· (used with permission from Westfalia Lunan, Germany).
(iii)
GAS IN AUSTRALIAN COALS
FOREWORD This \IOlurre contains exterrl3d abstr~ fran authors W'X> sp:>ke at a t:.w:)-day syrrp:>Sium in February, 1991 at the Uliversity of New South Wales. 'Ille syrrp:)Sium was organised by the Coal Geology Spec1aJ1st Group of the Geological Society of Australia and was co-spcnsored by the SChool of Mines, lJniversity of N.S.W. Coal Geology Specialist Group to further the researchers in recent developrents in the and enJineers geologists, of kncMled;le studies of coal seem gas, particularly as they aR)ly to Australian coal basins. In carpariSC11 to ca.mtries su::h as the lJnited States of Anerica, the utilisation and awlication of gas drainage technology by the Australian coal industry is in During the cxnferenc:e, we were delighted to have the u.s.A. its infancy. contril7Jtion of Wallace, Ma.la1e and I.ottman-craigg W"X> presented us with valuable insight into the Arrerican irxilstry. We were also pleased to have the Keynote .Address of Dr. Ripi Lana of Ksrt>la Coal and Coke Pty. Ltd., together with cootril7Jtions fran three Australian states. The syrtiX)Sium was initiated by the
Authors subnitted abstracts under the folloo.ng thsres: • assessnent, drainage and ut1 J 1satioo technology; • case studies; • mine safety, procb:ti.al and rutrurst prevention; • coal and gas plq)ert.ies; and • envircmental aspects. n-.enty-aie papers, covering a wide ~ of tq:>ics, were received and are reprocilced here. DJe to tine ccntraints, it was oot IXJSS1ble to fully edit and standardise all the papers. 1he editors, l'never, wish to thank all cootrib.ltors for their prarptness in adhering t.o the tight tine schecille inp.:)sed and for the high quality of the papers received. We w:w.d like to thank the folloo.ng people for their help during the CQll>i Jatial of this \IOlt1re: Barbara ltt"Goldrick (typing and catplter assistance), Mavis Depers (typing), Rozalia Varga (p.rrchasing) and Dave Martin (drafting and layo.lt). 1he use of the facilities at the university of \lollaigcn;;, and N.S.W. Deparonent of Minerals and Energy is gratefully acknc:Mled:Jed. Professor Frank R:llCbaralgh and Dr. Colin Ward are thanked for Dr. their relp in organising the facilities used at the lJniversity of N.s.w. Alan Hargreaves lc:x:ated a suitable Sl.i:>ject for the frcnt cover and Rd:,yne Ayres am Theo wttemeck fran Westfalia Pty. Ltd. (Australia) went out of their way t.o arrange penn:lssioo for us t.o use a facs.imile of the nadal on the froot cover. Westfalia umen (Germany) are thanked for giving pennissioo to use the facs.imile. Finally, Licnel Ransley and staff at the University of Woll~ Printery deserve high praise for their efforts to meet our deadline and for the excellent final result. We trust that yru will find this volune t.o be a foundatioo reference t.o studies of Gas In Australian CoillJI. W. Jdm Barrberry
Aivars M. Depers
(iv)
GAS IN AUSTRALIAN COALS
II. W W and I. RILL: The implications of methane drainage operations for Hew South Wa l es S. BlT!DK): DP.temnation of in situ permeabilitJ to gas for Australian coals
3
11.l. IIOClll6 and C.I. 1111111: The Electricity Caai.ssioo's involvement in coal bed methane, with early results frCD the SJdneJ Basin
13
II.II. Flll and l.C. aD: Influence of coal type, rank and depth on the gas retention capacity of coals in the Southern Coalfield, N.S.W.
19
I. Gil!: Gas frCD Australian coals: where fran and where to?
31
1.6. JVnlt Jr.: Hydraulic fracturing: general principles of design and application to coal.bed methane
41
8. 11-ISllll'.I, P. LDal and I. B!IIIS: Vertical well degassification trial, Central Colliery, German Creek, Queensland
51
a. (<DIS : [)irectional permeability in coal
65
I .D. LIil: lCeynote Address - The need for gas drainage in Australian underground mines and new gas drainage tecbno1ogies
77
L. UWIPTlll!CT'. Application of gassiness predictioo and gas drainage methods for high production loogvall lllining syst~
79
L. U P I ~ .. I.I. IIIBml! md J. IIXI): Practical iJlplication of in situ gas content testin9 methodology for ventilaticm and gas drainage systems design
87
P.I. INDQJ• Appin Colliery Loogval..l 18 -
cross measure bore deforEtion
97
L. PUIISII md r. 1111111: Relative permeability in coal
105
l. USIIU'I: A mathematical IDiel of gas emissioo into developaent beadings
109
I. SULLIYII: Planning issues and iJlplicatiODS of coal gas drainage in the Macarthur South area
117
J.l. ilLLICI, P.6. IIIUIII and L. IDrmt-alII&: The coal seam gas industry in the Oni ted States: teclmology, status and applications to Australian coals
119
C.I. illD, D. aJIII, D. PDICI, 1. CIOOCI, S. saw1.g aad P, OO!D: Assessment of gas Ignition potential by frictional processes frcn rocks in Australian coal mines
121
R.J. mJ,IW: An update on long-bole drilling for mine gas emission control
131
I.J. WTJ,JUM: Carbon dioxide and methane emission at Tatmoor Colliery
141
S. IOI and L.J. mBS: The permeability of coal under various confining stresses
157
J.1. ZJFIRJUJ: The utilisation of coal seam gas as a heavy duty vehicle fuel
163
1
THE IMPLICATIONS OF METHANE DRAINAGE OPERATIONS FOR NEW SOUTH WALES M. Armstrong and M. Hill Department of Minerals and Energy, St. Leonards, N. S. W.
CNer the last three years, there has been a significant increase in interest in the coal seam nethane resa.irces of New south Wales. '!his interest is based on the recent success of surface g a s ~ techniques developed and utilised in the United States of Anerica. seven organisaticns have camenced, or will soon camence, exploratioo and ~cpnent cperaticns in the State with a planned expeooiture of over $4,000,000 <ilrin;J the next tw:> years. SUrface gas technology has yet to be successfully tested in New South Wales. If it is effective, then it will enable future underground mining areas to be drained prior to m:ininJ thus irx:reasiI¥J mine safety and productivity. It will also enable the camercial productiai of large quantities of nethane fran within and ootside the coal min:inJ areas. The Departnent of Minerals
arxi E'nergy has recently
set up a nethane drainage task force . Its pirpose is to assess the State's coal sec.n nethane resources, to assess the µ:>tential of the varia.is production technologies and to establish a basis for future Departl'lental pn::,gI ans am µ:>licies . The task force will investigate a r ~ of issues includin;;J: • the knoolledge currently available atout coal seam nethane resources; *
the status and µ:>tential of produ::tioo technologies;
• the strategies and priorities necessary to en:ourage developrent of the industry; * technology research,
develcprent and derronstratioo priorities;
2
• greenhous e and envirame ntal irlpllcati cns; • IX>tential end use ~catia ,s and gas treaorent and infrastuc ture requi.rare nts; and • land use planning. Several of these issues have vital significa oce if nethane drainage operation s are to develop in the ilmediat.e future. niey i.oclooe:
Lam use planning Iocreasin; 1ly large areas of the Sya-}ey Basin are being covered by the urban expansiC11 of Sydney and Nelicastle . '!here are ctJvia.is prd:)lems reconcili ng urban developte nt with gas produ::tic n and coal miniDJ. careful planning will be necessary to minimise the st.erili.sa ticn of gas and coal resources . ExploratiC11 1here is relativel y little kncw1 at:n.lt rcu::h of the Stat.e's coal basins and about the coal seam nethane resairces . It is i.Jti)erative that gas desorptio n t.esting be introduce d rootinely for sec.ns intersect ed at depths great.er than o-.o hurx:lred netres. It is also 1.nl)erative that a standardi sed system of rreasurere nt and calculati cn be intcdred so that the data, W1eI1 collected , are rreaningfu l. Mine Planning and Develg:JI Blt 1he next generatiC11 of coal mines will be at i.ocreasin gly great.er depths \ltlere the seam gas cC11tents are higher than t:b:)se currently experienc ed. It will be necessary to enable drainage to camence up to 10 years prior to mining so that the gas CC11tents can be significa ntly reduced. Technology Developre nt F\lrther research and devel..cpt ent is required to adapt technolog ies to Australia n carli.ticn s.
the existing overseas
3
DETBRMINATION OF IN SITU PERMEABILITY TO GAS FOR AUSTRALIA N COALS S. Battino BHP Engineering Pty. Ltd . , North Sydney, N. S. W.
ABSTRACT The Australian underground coal mining industry has exhibited an The higher coal increasing capacity for high production operations. gas emission greater much generated turn in have production rates have been systems drainage gas While workings. mine levels in the cycle, production the into integrated y successfull and ly progressive specific the requires parameters drainage of n the optimisatio Of these, the gas knowledge of certain coal seam characteris tics. is of environment in-situ own its in seam the of y permeabilit paramount impartance. This technical paper reviews the field results and computer simulation studies recently undertaken under a NEROOC funded project to determine the in-situ permeabilit y to gas of Australian coals. Underground testing and monitoring were carried out in selected operating collieries in the Sydney and Bowen Basins to determine inseam gas pressures, flowrates and compasitions, as well as the total desorbable gas content and sorption isotherms of each seam. Application of the field data to two computer models gave initial inHowever, situ permeabilit y figures of 0.01 .to 0.30 millidarcy. following drainage, coal permeabilit ies to 2 millidarcie s were This permeabilit y enhancement was explained in terms of obtained. variations in seam_gas content, pressure, coal shrinkage, dewatering and diffusivity . INTRODUCTION The past 20 years have witnessed a significant increase in . methane This increase in methane emissions 1nto underground coal mines. released enhances the danger of formation of explosive mixtures of The prediction of the vollMn&s of gas present in methane and air. coal mines 1s acquiring expec1ally great importance, as it enables an early determinati on of the most efficient expenditure s on ventilation and/or gas drainage systems. In excess of 35 computer models have now been developed to simulate the emission and migration of coal seam gas into mine workings and to assist with appropriate methane extraction methods. However, most of these models rely upan the knowledge of the permeabilit ies of the This is because the gas coal and of the surrounding strata. hydraulic regime of optimal permeabilit y of the source dictates the the underground gas producer.
In solving any problem associated with gas migration in coal seams, it is insufficient to know the gas permeability determined under indicate as a rule, for these data, laboratory conditions, permeabilities which are quite high in relation to the actual coal seam permeability. The in-situ gas permeability of the coal seam is therefore fundamental for accurate gas emission predictions and methane drainage design. RELEVANT BACKGROUND DATA A comprehensive literature search was undertaken of all published experimental work undertaken worldwide on the gas permeability of coal seams in order to devise a reliable and reproducible method of determining the coal permeability in its own in-situ environment. This survey revealed that underground experimentation in this field had taken place as early as the 1960's in the Kuznetsk Basin of the U.S.S.R. These initial studies consisted of drilling a series of vertical boreholes to various depths up to 200 metres in coal seams (Kreinin and Farberov, 1964). Compressed air was then pumped into one of the holes at different pressures and the initial pressure in an adjacent Results plugged hole was monitored together with the air outflow. indicated that the percolation regime in the investigated airflow Analysis of the results showed range was subject to Darcy's Law. that the gas penneabilities of the investigated coal seams decreases Subsequent with depth but increases with high coal seam thickness. experiments in the U.S.S.R. (Krivitskii, 1972) employed a technique This where methane tagged with Carbon 14 was used as a tracer gas. gas was injected into one borehole and monitored at an adjacent Using the relative position and characteristics of the borehole. boreholes as well as gas flow theory, the in-situ coal permeability to gas was calculated. In Australia, experiments to determine the coal seam permeability have been comparatively limited and did not conmence until the late investigations on coal permeability to gas Initial 1970's. concentrated on laboratory testing of coal cores to determine the macropermeability using different gas types (Battino and Hargraves, 1982) as well as coal permeability under confining pressures (Lingard Other permeability experiments were also conducted et al, 1982). with and without NERDDC funding by ACIRL (Gray and Truong, 1983) in These chiefly the northern and central Bowen Basin of Queensland. underground investigations examined differences in both the mode of gas storage and penneability characteristics of the coal seams. LUia (1984) reported on results from gas post drainage investigations at Westcliff Colliery - this included permeability related testing with mixed gases, carried out in the laboratory as well as in the field. The aim of this research was to increase gas drainage efficiency and to lower drilling costs. Finally, technical investigations at Moura, by the Thiess Dampier Mitsui Coal Company reported results indicating to have low permeability and slow desorption Moura coal characteristics (Louvan, 1984).
5
SELECTED FIELD TESTING AND MONITORING PRECEDURE The approach used 1n determining the in-situ coal permeability to gas of Austral1an coals is one very similar to that adopted more recently by some European coal m1ning organisations. It involves the drilling sealing of horizontal in-seam boreholes drilled from the and underground workings into virgin coal and the monitoring of the inThis rate of pressure build-up generates an seam gas pressure rise. exponential curve, the asymptotic value of which yields a measure of The time interval necessary to attain this in-situ permeability. asymptote may vary from a few hours for a h1ghly permeable seam to a few days for a low permeability coal. The actual test configuration used is presented in Fig.1(a). The two outer boreholes are the above-mentioned gas pressure monitoring holes and hydraulic double packers inflated with nitrogen gas are used to When the asymptotic pressure level is provide the desired seal. reached, a third borehole is drilled midway between the first two test holes, as shown in Fig.1(a). A single hydraulic packer is then installed halfway into this central hole and gas flowrates are regularly monitored together with simultaneously decreasing gas Typical pressure-time pressure levels from the adjacent boreholes. and flow-time curves expected during the test period are shown in Fig Other relevant data determined from 1(b) and Fig 1(c) respectively. each test site included the initial total desorbable gas content and composition of the coal seam investigated as well as its sorption isotherm characteristics . COMPUTER MODEL SIMULATION Once the necessary underground test data and seam gas properties have been established, a reliable gas flow computer model is required to type-curve match the theoretical data with the field collected data. A comprehensive review of over 35 models describing methane production from coal seams was undertaken by King and Ertekin (1989). The models are formulated either empirically or analytically and are Of the models solved using both analytical or numerical techniques. general in most the be to found reviewed, the numerical models were boundary sophisticated of use the application because they feature schemes. production methane of conditions which allow for a variety For the purpose of determining the in-situ permeability to gas of Australian coal seams, two separate mathematical models were used. The first is a program originally developed and used at the CERCHAR Institute (France) on mainframe and re-written in Pascal to enable This program, called adaptation to Australian PC requirements. in-situ permeability initial the "SITPRM" allows the assessment of This borehole. sealed a using as input data the pressure rise in seam underground the to applied program has already been successfully and (Saghafi mines coal German gas characteristics in French and Jager, 1984). The time-dependent improvement in the in-situ coal permeability is then analysed using the program "HOLE", originally developed at CERCHAR and adapted for Australian conditions in studies undertaken by this Institute and the Australian Coal Industries Research
6
/rrll1•
p•clc •r
011ta 1•
;:,•clc •r
gro11 ted
~ t/
"- /
\. ,/
--r -- I
---
--- ..-
Double Packe r
60n,
Single Packer
i - - - - - 10 m ----◄
- - - 10,,, - - - - - 1
COAL
R/8
starr dtJlp •
FLOW METER
·1Lo ?RESSURE
1~GAU GES
~
O N1
SOTTLE
i l ME
Figur e
TIME
TEST CON FIGU RAT ION FOR PRESSURE ANO FLOW MEA SUR EME NTS IN COAL SEAM
7
A description of the physical Laboratories (ACIRL) since 1985. concepts in the computer model "HOLE " can be found in a technical paper by A. Saghafi (1989). The second mathematical model was developed at the Centre for The Petroleum Engineering at the University of New South Wales. numerical al "SIMED " program is a rigorous, two-phase, three-dimension The seam is simulator for water and gas flows in coal seams. represented is cleat modelled as a dual porosity system in which the gas and two-phase by a macropore or fractured network which allows of terms in modelled Flow is water flows to the degassing wells. gas for correction type Darcy's Law with allowance for a Klinkenberg Both permeability and porosity may be specified as slippage. A description of the concepts and functions of seam stress. formulation of this model are included in a technical paper by Spencer et al (1987). FIELD TEST RESULTS AND ASSESSMENT Underground testing and monitoring were carried out using the aforementioned field technique at four operating Australian collieries: Cordeaux and (German Creek) Central Tat:vnoor, Metropolitan, time versus pressure gas the of simulations Computer Collieries. in-situ initial generated seams coal investigated curves in the four permeability values which provided close curve matching with the This simulation is graphically presented in field developed curve. are sulllnarised in Table 1. results Figs. 2 to 5 and the TABLE 1 SUMMARY OF INITIAL IN-SITU COAL PERMEABILITIES Colliery Metropolitan Tahmoor Centra 1 German Creek Cordeaux
iCH4
IC02
Initial In-situ Permeability (mi 11 idarcy)
Bulli Sul 11
25 75
75 25
0.010 - 0.030 0.014 - 0.018
German Ck Bulli
97 99
3 1
o.2e5 - o.3oo
Seam
Mean Gas Composition
0.078 - 0.091
The above table shows clearly that the seam gas type has a very marked influence on the in-situ permeability of the coal seams. This variation can be explained by the fact that the carbon dioxide molecule is much larger than the methane molecule, has a higher sorptive for coal than methane and a much lower diffusivity than CH•, A range of initial in-situ permeability on a same coal seam basis. figures has been given rather than a single figure because slight occur depending upon the computer simulation model variations applied. The "SITPRM " program, (developed by ACIRL/CERCHAR), i s based on the fact that seam gas pressure variation has both a mechanical and a gas The mechanical effect relates to pore transport effect on the seam. closure associated with pressure reduct i on , while the gas transport
8
fJressure Rise Test (Australia)
Fig. 2
'M' seam, borehole 10 , - - - - - - - - - - - - - - - - - - - - - - - - - - - - - - - ~
9 8 -
7 ·
,-..
u n. L
6
a 0
·j
" II L
:,
•• • C\ L
k = 18.3 µ-dorcy
2
0--t------.------,------"T"""'-----"T"""'--------i 20
0 - --
Fig. 3
40
Time (hours) + Mt:a:surcsd values
Simuloted
ln-situ Permeability Determination Tahmoor Colliery, 400 Panel
900 - - - - - - - - - - - - - - - - - - - - - - - - - - - - - - - - - - - , 800
700 k- 19 µ - dorcy
600 ,-.. 0
n.
-"
..
500
~
:,
••~
400
a.
300
200 -
100
0
0
20
40
60
100
80
120
Tim• elopHd (houra)
a
Measured pressure
+
Simulated preaaur•
140
160
Fig. 4
ln - situ Permeab ility Det erminatio n Germon Creek, 304 Pan el, 20 C/T
1.5 I 4
-
I J
1. 2 I I I
.. ., ..,
U ,-..
n
C •~" u
.. 0
'~° t-;C
II
Ill
Ill
09
a - s - -B
0 8 -
" u
.
-
0 .7
-
Ob
-
(J 5
0 .4
-
k
~
90.5 11 - dorcy
0 .3
02 0 I
0
Time elapsed (hour s)
a
+
Measured pressure
Simulat ed pressure
Fig. 5 In-Situ Permeab ility Determin ation Cordeaux Colliery, Hlndmorah Panel
- - - - - --- - - - - - -- - - - -- 0 .9
.A--
~
0.IS -
,.._ D
Q.
0.7 -
JI. ....,,
..
0C ,.._
•
.
a--a---°
-
- - - - - - - - - - - - ,EJ
o.e -
u 1J e C
- D D • '] • 0 L
C
•- t I':,
•• I!
0 .4 O.l -
B.
0 .2 0 .1 0 •
0
. - -,~- ~ - ~ - ~ -~ -
0.2
0 .4
0 .6
, - - ~ -~ - ~ - ~ - ~ -~ - . - -, - -
1.2
0 .8
Tlme olopeed (houre) ll
t.loo•urod proeeuro
+
Slmuloted proHuro
1.4
1.6
10
effect is related to gas slippage along the capillaries during the This "slipping" effect is accounted for by gas desorption process. as the Klinkenberg coefficient) in the (known factor a i ntroducing parameters built into the SITPRM important Other simulation program. for shrinkage in the coal account to coefficients include simulator The SIMED diffusivity. and dewatering drainage), gas (following Gas concept. porosity dual the on based model numerical a program 1s Langmuir using modelled is matrix coal the from desorption equilibrium desorption isotherms and diffusion of desorbed gas fr0111 Porosity and permeability of the characteristic microspheres. macropore system are assumed to be stress dependent, as described by the relationships developed by McKee et al, in the United States. The model allows for simultaneous gas and water flow in the macropore fracture system and 1s three dimensional to permit simulation of actual field applications. Applications of the gas pressure/flowra te data together with seam gas content, composition and sorption isotherms in the aforementioned simulators gave the following drainage dependent in-situ permeability results: seam
Co 11 iery
Metropolitan Tahmoor Central Cordeaux
Bulli Bulli German Creek Bulli
In-situ Permeabljty {mill idarcy) 0. 10 - 0.60 0. 10 - 0.50 0.20 - 1.00 0.40 - 2.00
On the basis of the in-situ permeability results presented in the above table, the following important points can be noted: Seam gas drainage can provide a substantial improvement in the 1. initial in-situ coal permeability to gas. seams with predominantly pure methane as their gas Coal 2. constituent exhibit a higher in-situ permeability than those with mixed gas components. Differences in assumptions made during the construction of the 3. computer simulation models used to determine in-situ permeability values have resulted in characteristic variations in output data. It is noteworthy however, that the ranges of in-situ permeability figures reported above do not differ by orders of magnitude and these values will therefore provide reliable results in gas drainage design applications. The computer models used in this project still require further 4. development and fine-tuning, particularly in coal seams with mixed gas constituents. POTENTIAL FOR SHORT TERM INDUSTRIAL APPLICATIONS As the permeability of a particular coal seam is a measure of its ability to transmit the gas under its existing pressure gradient, insitu coal permeability figures will play a major role in any study of the gas migration and emission control into underground workings. The experimentally measured data and subsequent computer simulation to determine in-situ permeabilities as reported herein have irmiediate application potential in the following aspects of the coal mining • operations:
11
a) Production of gas emissions levels in heading development and at working faces, b) Optimisatio n of gas drainage parameters for design of in-seam drainage patterns, c) Estimation of gas production from the mined and adjoining coal seams, subject to knowledge of mining advance rates, d) Design of hydrofractu re stimulation of coal seams from vertical wells drilled from the surface. ACKNOWLEDGEMENTS Seamgas Enterprises gratefully acknowledges the support of the NERDDC organisatio n for its contributio n to the investigatio ns into the determinati on of in-situ coal permeabilit y to gas in Australia. Sincere thanks are extended to Dr. A. Saghafi (ACIRL and CSIRO) for his continuing help in the selection and setting up of all field subsequent co 11 action of • fie 1d data and testing equipment, Particular credit is development of the coal permeabilit y models. also paid to the management and staff of ACIRL's Gas Research and Ventilation Group, Metropolita n Colliery, Tahmoor Colliery, Central Colliery (German Creek) and Cordeaux Colliery for assistance in site Fruitful discussions selection, field testing and data monitoring. with and contributio ns by Professor V. Pinczewski and Mr M. Somers (Centre of Petroleum Engineering at the University of N.S.W.), Dr Ray (GeoGas) and Dr Les Lunarzewski (Lunagas) are also Williams gratefully acknowledged. REFERENCES KREININ, E.V. and FARBEROV, I.L.,1964, Experiinental studies of the gas permeabilit y of virgin coal beds in the Kiselevsk-Prokopyevsk region of the Kuznetsk Basin, Gazifikatsi ya I Piroliz Topliv, Sbornik Statei, pp 184-187.
KRIVITSKII, M.D.,, KRIGMAN, R.N., KUZNETSOV, s.v., NEDVIGA, S.N. and POLISHCHUK, V.L., 1972, Use of radioactive isotope to determine the filtration characteris tics of a coal seam, Soviet Mining Science,Vol 8, No. 4, pp378-382. BATTINO, s. and HARGRAVES, A.J., 1982, Seam gas drainage experiments in some collieries of B.H.P., Aus, I.M.M. Symposium on Seam gas drainage with particular reference to the working seam, Wollongong, pp 157-171. LINGARD, P.S. PHILLIPS, H.R., and DOIG, I.D., 1984, Laboratory studies on methane desorption and diffusion in deep coal seams, NERDDP report EG/84/276, Canberra. GRAY, I. and TRUONG, D., 1983, Methods and Equipment used in outburst and gas drainage research, Australian Coal Industry Research Laboratorie s, Report of Investigatio ns. R.D., 1984, Improving the efficiency of underground gas drainage systems, NERDOC Project No. 574, Kembla Coal and Coke Pty Ltd, Wollongong, 55p. LAMA,
12
KING, G.R. and ERTEKIN, T., 1989, State-of-the-Art in modelling of unconventional gas recovery, SPE Joint Rocky Mountain Regional/Low permeability reservoirs Symposium and Exhibition, Denver, Colorado, March. SAGHAFI, A., and JEGER, c., 1984, Comparison of methods and results of in-situ permeability detemination of coal seams, CERCHAR Report 71.1062/2, France. SPENCER, S.J., SOMERS, M.L., DOIG, I.D. and PINCZEWSKI, w.v., 1987, Numerical simulation of gas drainage from coal seams, SPE 62nd Annual Technical Conference and Exhibition, Dallas, Texas, September. McKEE, C.R., and BUMB, A.C., 1985, Flow-testing coalbed methane production wells in the presence of water and gas, SPE 14447, paper presented at the 60th Annual Technical Conference and Exhibition of the Soc. of Pet. Eng. held in Las Vegas, NV, September.
13
THB KLBCTBICITY CONNJSSION'S IMVOLVBIIBNT IN COAL BBD IIBTIIANB, lfITH EARLY RESULTS FROM THE SYDNEY BASIN M.A. Bocking and C.R. Weber Electricity Commission of New South Wales, Sydney, N . S. W.
INTRODUCTION In its strategic plan the Electricity Commission of New South Wales (ECNSW) has recognised the need for a significant component of gas fired power generation in the optimum operation of the New South Wales power supply system over the next 30 years. Under the plan it is proposed to actively encourage the competitive sourcing of fuel supplies, including gas. The plan provides for investigation of the potential to extract and use coal bed methane for generating power. The development of a viable coal bed methane industry in New South Wales will benefit not only the ECNSW but the state as a whole. In addition to directing its own studies the ECNSW seeks opportunities to support others in this innovative enterprise.
HISTORY A decade ago the ECNSW was exploring the coal resources of A255 near Wyong, an area previously "set aside• for domestic power generation and was presence of coal seam gas. The proposal to concerned by the possible supply coal from this area to a new Central Coast power station by Lake Tuggerah necessitated increasing the depth of mining from the 350m, experienced at the deepest Newcastle coalfield mines further north, to up to 600m, south west of Wyong, over the life of the proposed power station. At that time the conventional wisdom was that coal seam gas contents increased with depth and that where a history of igneous activity existed the coal seam gas was likely to consist predominantly of carbon dioxide. Furthermore it was recognised that coal rich in carbon dioxide appeared more outburst prone than coal rich in methane. Contemporary studies by Shepherd et al (1981) indicated that outbursts could occur at depths in excess of 180m where the rank of the coal exceeded a vitrinite reflectance of 1.01 and sufficient gas existed. Williams and Giedl (1983) observed that gas outbursts could occur where the gas content exceeded 5 cubic metres per It was known from the first tonne at Collinsville in Queensland. exploration progranme that depths up to 600m could be expected but that . the rank was unlikely to exceed 0.951. However whilst our conventional exploration approach covered the first two criteria it was considered prudent to conunence trial gas desorption testing in the second exploration programme (ETD 26-45). The USBM' s "direct method-" had recently been described by Diamond and Levine (1981) and it was decided to apply this to samples of Wallarah, Great Northern and Fassifern coal. Inexperience led to the first two tests being terminated prematurely when either the temperature fell or the back pressure in the gas collection apparatus rose sufficiently to inhibit the desorption of gas from the coal. Early recognition of these problems and the implementation of the necessary changes gave successful tests thereafter.
14
It was found however that the desorption process experienced with coal from the Newcastle Coal Measures was substantially different to that evident with Illawarra Coals from the South Coalfield in that:* the desorbable gas contents were much lower at the same depth. * the desorption times were longer. * the residual gas contents were proportionally higher. * the desorption curves were somewhat flatter and markedly less asymptotic. Also, of significance to our current initiatives:* the seam gas consisted almost entirely of methane. * the gas content increased with depth (see Table 1). * the highest value (9 cu.m/t) occurred in a fracture zone. The exact implications for mining were not clear. Whilst the gas contents (about 5 cu .m/t) indicated a low probability of outbursts occuring, the reluctance of the gas to drain from the coal suggested the available literature was considering a different type of coal. Concerns for the safety of impending mining evaporated when the power station and deep mining proposal was abandoned. In 1987 a call for expressions of interest in gas supplies to the power industry resulted in presentations of the then recent successes in the use of hydraulically fractured vertical boreholes to extract coal bed methane. No longer restrained by the apparent need to utilise mine headings or shafts to access coal from which gas could be drained using long horizontal boreholes, investigations into the resource potential of coal bed methane in tne Sydney Basin were commenced. Despite earlier studies including the excellent series of boreholes, Bootleg DOH 1-12, undertaken by AGL, it was soon found that some of the most relevant data was not available. Consequently estimates of likely production rates and costs were not possible. Determined to evaluate the significance of coal bed methane, the ECNSW undertook to perform an active role in the investigation, research and development of coal bed methane.
CURRENT INITIATIVES The ECNSW's current coal bed methane initiatives are threefold:* To acquire, investigate and, if appropriate, develope gas resources for power generation. * To properly research the controlling parameters that dictate the producibility (and therefore the economics) of coal bed methane and develope or transfer the technology required for production. *To encourage the activities of private enterprise in the development of gas resources in New South Wales. The research and development initiative is a four stage project to establish the likely cost of coal bed methane as fuel for power generation.To be spread over a period of some five years, this project consists of:* Stage l - The preliminary evaluation by US consultants, of more than 20 coal bearing areas of New South Wales (completed July 1989). * Stage 2 - The detailed evaluation of the most promising of these areas by the completion of detailed research boreholes to
15
--
--
•-1100111
PEL 278 HUNTER
I '
EMA 47 - 53
+.
'
ELECOM HUNTER RANDWICK PARK
+t
ELECOM HUNTER UANILLO
I!
'
HAWKESBURY
I!
D '
WOLLONGONG
I
~ Scala
!
.....
•
,_a.a111a1 ........ Matras
--
+--.....----.--- -.-~-.----.----. --..----.----.--- -.---.--.----.--- -.-~-----.--..-- ......---.----.-- ---4-
·-
.00011
weelZIIII
Figure 1. Location of ECNSW coal bed methane investigations.
I I !
~
18
content, gas of properties critical the investigate 1990). Sept (commenced stress situ in and permeability * Stage 3 - Based on the findings of Stage 2 the conduct of be will fracturing hydraulic trial monitored carefully undertaken at appropriate sites. * Stage 4 - A trial field is to be constructed at the most to establish gas production promising location available, economics.
PROGRESS Initially the ECNSW applied for PEL's over significant coal bearing areas in the Hunter Valley and along the New South Wales coast north and south of the Hawkesbury River. These PEL's 278 and 279 respectively were granted in April 1990 and it is intended to rigorously assess the coal bed methane potential of these areas in conjunction with the research and development initiative.
PERMEABILITY
programmes exploration coal recent most our with conjunction In techniques. of variety a utilising undertaken been has testing permeability Using the methods currently in use in the United States (slug testing) together with the most sophisticated techniques being developed by the CSIRO, the results have been most encouraging. The results which are summarised in Table 1 indicate coal seam permeabilities of 1 to 10 millidarcies at· depths of 100 to 500 metres. Such values are 100 to 1000 times greater than those indicated for the same seams by the high volume injection testing usually used in groundwater studies. The results are similar to those obtained from slug testing in the Warrior Basin, Alabama, where permeabilities of 1 to 10 millidarcies are typical at depths of 300 to 1000 metres (McKee et al 1986).
IN SITU STRESS
In situ stress determinations are becoming more commonplace in the Sydney Basin but tend to be concentrated in a number of particular areas so that the regional pattern is not well delineated. Recognising that stress is a possible controlling parameter in situ stress determinations are being made as part of the ECNSW coal bed methane investigations. Given the high stress levels in the Sydney Basin and the depths of interest with coal bed methane we are operating at the forefront of the technology. Recent determinations at Lithgow required 52 MPa to initiate fractures at 450 metres whereas similar work on the central coast required only 25 MPa.
HUNTER VALLEY INVESTIGATION BOREHOLES
The drilling of the first two investigation holes in PEL 278 commenced in January 1991. Elecom Hunter Llanillo and ' Randwick Park are fully cored boreholes designed to test the prospectivity of the Wittingham Coal Measures in the Calool Syncline between Singleton and Denman where up to 60 metres of coal seams occur in a 700 metre interval. Earlier work in the Elecom Mount Arthur DOH 47-53 programme revealed interesting patterns of coal seam gas distribution. Some of the findings are shown in Table 1. In general east of the syncline no gas was recorded at depths up to 380 metres but two holes in the central part of the Calool Syncline yielded gas from within 87 and 177 metres of the surface. The gas contents were not high, reaching only 6 or 7 cu.m/t, and the new holes have been located deeper in the syncline and on its western flank to delineate the regional distribution.
17
AREA
BOREHOLE
CENTRAL COAST
ETD33 ET03' ET036 ET037 ETD38 ETD39
.
ET042 ET043
.
EMA48 EMA50
HUNTER VALLEY
. . . . . .
.. .
EMA52
.
WESTERN COALFIELD
. .
ELN84
SEAM
DEPTH metres
GAS CONTENT cc/g ladb)
Fasaitem
756.1 697.5 373.4 531 .0 725.4 457.4 523.9 559.7 409.1 412.1
0.16 0.67 2.2 3.4 3.2 5.2 4.8 9.0 4.0 4.4
380.1 87.7 204.5 223.5 241 .8 400.9
0.0 1.0 1.7 7.8 4.2 6.4 3.3 3.4 0.0 1.2
Wallanlh - GrNI Nor1hern Wllarah - GrNI Nor1ham Wallatah - Great Nor1hern Faasilern Wallatah - Greal Nonhern Fasaitern Wallatah - Great Nonhern
Wallarah Great Nor1hern Edlnglasale GlenMno Anowfield Ba,deld (intruded)
Warkwor1h Bayswater Bengalla Edlnglas&ie Glen Munro Bowfield Piercefield Bayswater Edinglas&ie Middle River lrondale Uthgow
460.9 502.5 83.0 1n.o 323.0 398.0 499.0 308.0 387.0 413.0
2.1
0.0 0.0 0.0
.
PERMEABILITY RANGE md
1.2 • 15.7 0.2 • 1.0 1.1 • 14 1.0 • 12 1.8 • 22 1.5 1.5 4.0 • 6.0
• Range given by different 18St methods.
TABLE 1
Results of Early ECNSW Coal Bed Methane Investigations
18
Twenty two seams were tested in EMA OOH 50. All seams, including a number of seams intruded by igneous material, yielded methane with only minor amounts of carbon dioxide. Of interest is the gas distribution profile of the bore which shows gas contents peaking at 200 to 400 metres and decreasing above Ans;l below. (Note the results given are not corrected for ash content but were all approximately 15-20% ash.) It is too early to predict the likely prospects for coal bed methane in the Hunter Valley but given the great thickness of coal present even moderate gas contents may prove economic. It is hoped that an understanding of the regional distribution of gas will indicate areas of higher gas contents. Some Hunter Valley coals are similar to coals at Moura in Queensland where much higher . gas contents occur.
OTHER ACTIVITIES
As part of its obligation to PEL 279 the ECNSW is undertaking the modelling of the coal measures extending south from the Newcastle Coalfield into the Sydney Basin. In this area where drilling opportunities are limited, seam gas information limited to non existentand information on the coal seams sketchy, a thorough review of the available information whilst time consuming is considered prudent. It is hoped a detailed coal measure model wi l l lead to the optimum locations for further work.
ACKNOWLEDGMENT The authors acknowledge with thanks the permission Cormu.ssion of New South Wales to present this paper.
of
the
Electricity
REFERENCES DIAMOND,W . P . and LEVINE,J . R.,1981: Direct Method Determination of the Gas Content of Coal Seams, Procedures and Results USBM Report of Investigations liU_.
and REVERAND,J.M. KOENIG,R.A., WAY,S . C., BUMB, A. C . , MCKEE, C . R. , BRANDENBURG,C.F., 1986: Using Permeability -vs- Depth Correlations to Assess the Potential for Producing Gas from Coal Seams, Ouart,Rev,of Methane from coal seam;, Tech.Vol 4 Nol, pp 15-26. SHEPERO,J., Structures
RIXON,L.J. Coal in
and GRIFFITHS,J . 1981: Outbursts and Geological ~A._....J.R~e~v~i~·e~w.::..r.,_ _.I~n~t--.,,,;,J........,~R~o~c~k,___,M~e~c.....,h~,~M~i~n~,~S~c~i~·~·~' Mines:
Geomech,Ahstr.vo11a 00267-283. WILLIAMS,J.R.and GIEDL,J., 1983 : Geological Parameters Affecting Seam Gas Content and Composition in the Collinsville Coal Measures, Collinsville, Queensland, in Advances in the Study of the Sydney Basin, Proceeding of the seventeenth Symposium. Uni of Newcastle Dept. of Geol,Pubn.No.246,
19
INFLUENCE OF COAL TYPE, RANK AND DEPTH ON THE GAS RETENTION CAPACITY OF COALS IN THE SOUTHERN COALFIELD, N. S. W. 2 1 M.M. Faiz and A.C. Cook 1 Department of Geology, University of Wollongong, Wollongong, .N. S. W.
2 Keiraville Konsultants Pty. Ltd., Keiraville, N. S. W. 1. IHTRa)UCTlON Tne Southern Coalfield lies in the southern part of the Sydney Basin and covers an area of approximately 8,600 square kilometers .. The sedimentary ::-.equence in the basin was deposited in shallow marine to . fluvio-deltaic The maj:or coal bearing environments during the Permian and Triassic. in a fluvio-deltaic deposited was Ullit , the Illawarra Coal Measures, (Fig.1). Permian environment during the Late Coal seams of the Illawarra Coal Measures vary in rank from high volatile bituminous in the southern and the western parts to medium to low volatile bituminous in the northern and eastern parts of the Coalfield. These coals contain variable amounts of gas, mainly methane and carbon dioxide. The occurrence of large amounts of gas causes numerous problems during coal As a result, many detailed studies mining, especially in deep mines. concerning the gas sorption and desorption properties of coals in the However, the reasons for the variations in the region have been made. i'iJTIOUnt of gas stored in coal are not yet clearly understood. Thus, no !"eliable method of predicting the gassiness of coals in the region has been developed. The amount of gas res.ervoired in a coal seam is controlled by many geological factors including coal composition, porosity, rank, depth of It is, therefore, cover, burial history and the geological structure. respect to the with neces sary to evaluate each of these factors distribution of coal seam gases. 1t has become routine practice for many coal companies to measure coal seam gas contents in their exploration bore holes by desorption techniques. This paper seeks to evaluate measured gas content data with respect to coal composition, rank and stratigraphic position of the seam. 2. GAS RETENTION IN COALS
The mode of gas storage within coal has been a topic of study since the aarl y part of the nineteenth century, but it is still a controversial i ssue. G~s can be stored in coals in three ways: 1. as sorbed molecules on pore surfaces; 2. as free gas held within the matrix porosity (macro- and micro-porosity); and J. as gas dissolved in groundwater within the coal seam (Rightmire, 1984).
20
SOUTHERN
COALFIELD
STRATIGRAPHIC
COLUMN
roRMATIONS
MEMBERS
BULLI CO.C.L (/)
w er
8ol9own1t Cool Mcmbtr
::::>
lo••tnce Sono,1ont Mtmbtr
Cl.
(/)
::, 0
<t
w
a:
:::I:
C>
a,
Coe, Horn Coal Mtmbt, (CK(RSL(Y fOIIM.l TION
Hororovt Coo r Member
::,
.,, Woronoro Cool M t mbtr
..-o ... ,c, Sandstone Member wONG.lWllLI COAL
_,
K(MBL.l SA .. OSTON(
<t 0
u
AllAOj5 CR((K
AM.,•con Cretll. Cool Mtmc,,
I
ro11 U.l TIO" Oor1u F'o,,11
►
..,
&PPIN
Mtmt>4r
fOAM.l TIOH
80190
z 0
.,, ►
Sond11ont
c,a,.,,~ Mtmbcr
TO,.G&RII& COI.L
W 1lTO.., ro11 .. AT I ON
-, e o n ona Coc 1 Mtmbtr
I
<t
er
a:
[l\ oHS Vi-L[
<t
0
~
_, ..,
""_,
_,
-
z C
a:
Q.
::,
10111.. &1 10,
0
a:
C)
I• Qt rt t
Cool Member
a,
2 ::,
u
ID
::, .,,
PHfASA,.TS ll(ST fORMI.T oO!f Ul'IOl"IC:trro Cool Mtff'lt)tr
--".- -'
Pig. 1
I
I -
Stratigraphy of the Illawarra Coal Measures in the Southern Coalfield (from Standing Committee for Coalfield Geology in N.S.W., 1971)
21
The first of these mechanisms, gas sorption, is considered to be the main mode · of gas retention in coals. Experimental investigations have shown that approximately 90-95% of the total gas contained in coals is held in the sorbed state (Barker-Read, 1984). The amount of gas sorbed within coal is mainly a function of its surface area, gas pressure and temperature. The surface area of coal is closely related to its internal structure which, in turn, is dependent upon coal type and rank. Coal type is determined by the type of organic constituents deposited in the peat swamp and the degree of alteration they underwent in This alteration includes the influence of biochemical the peat stage. activity as well as physical and chemical processes of breakdown of biopolymers, repolymerizatio n and gelification. The three maceral groups which determine coal type (vitrinite, inertinite and liptinite) each possess different internal structures, porosities and pore size distributions (Harris and Yust, 1976). These differences could influence the gas sorption capacity of coals. Ettinger et '31. ( 1958 and 1961) showed that fusinite can absorb more methane than vitrinite per unit volume of coal at medium rank coals, whereas at higher ranks both of these macerals can absorb similar amounts of gas. Coal rank is a function of the extent of physico-chemic al changes that have occurred in coal due to increases in temperature and pressure. These changes include a second phase of gelification (Teichmilller, 1982), dewater i ng, compaction and the loss of functional groups together with i ncreasing aromaticity. The internal surface area and the gas sorption capacity of coal is greatly influenced by rank (Gan et al., 1972; Kim, Coal rank is usually assessed by chemical 1978; Boxho et al., 1980). parameters determined by proximate analyses or by optical methods, most corranonly vitrinite reflectance. It has been shown by several workers that coal seam gas content is more closely correlated with progressive increase i n optically determined rank, vitrinite reflectance, as compared with chemical measures of rank (Close and Erwin, 1989; Ulery, 1984). The influence of hydrostatic pressure and temperature on gas sorption in coals i s well documented. (Lama and Bartosiewicz, 1980, Lama, 1988; It is well established that a coal's gas Meissner, 1984; Kim, 1978). s torage capacity increases with increasing pressure and decreases with increasing temperature.
3. VARIATIOR OF SEAM GAS CORTENT WITH COAL COMPOSITIOR, RANK ARD DEPTH A set of gas content data for 44 coal samples (mainly from the Bulli, Balgownie, Cape Horn and Wongawilli Seams) has been measured by desorption techniques and these data are used in this study. Relationships have been investigated for the gas desorption data in relation to the petrographic composition, rank and depth of cover of the respective coals using bivariate and multivariate statistical methods. ) is used Tn this study, the mean maximum reflectance of vitrinite (R composed studie~,i~ coals the of majority The rank. coal of .a s a measure contents Liptinite inertinite. and vitrinite of mixture a of exclusively report as zero or as negligible amounts due to the moderately high rank of lhe coals. Therefore, in the statistical analyses inertinite was taken as the variable representing coal type.
22
* *
12.0+
**2 * * * * 2*
GAS CONT-
(a3/t) 9.0+
2***
* *
*
*
6.0+
*
*
*
*
*
*
*
*
+---------+---------+-- -------+---------+----- ----+------M%
so
40
30
20
10
0
The regression 3equation is Gas Content (m /t) = 9.82 - 0.0919 · M% Fig. 2 Plot of in situ gas content versus mineral content (volume%)
* 12.0+
* *2 *
*
GAS CONT3 (m /l} 9 . 0+
*
*
*
**
2
*
*
*
* *
*
*
6.0+
*
3
2
*
*
*
------ --+---------+--------- +- - -------+---------+----- ---!%
12 Fig . 3
24
36
48
60
Plot of in situ gas content versus inertinite content (volume%)
23
* *
12 .0+ GAS CONT3 _ ( m /t)
* 2
*
*
* *
*
* *
9.0+ *
*
*
* *
*
*
***
*
6.0+
*
*
* *
**
-
------+-- -------+- --------+ ---------+ ---------+ ---------+ RV,max 1.120
Fig. 4
1.520
1. 440
1.360
1. 280
1. 200
Plot of in situ gas content versus vitrinite reflectan ce
* *
12 .0+
(m /t) 9.0+
*
2 *
GAS CONT3
*
* *
*
*
*
* *
*
**
*
*
2
*
* * * * *
*
6.0+ *
*
------+--- ------+--- ------+--- ------+--- ------+--- ------+DE PTH 425
Fig. 5
Plot of
450
475
500
in situ gas content versus depth
525
550
(m)
24
Both in situ and normalized gas contents have been used in the correlations. In situ gas content is the total amount of gas directly desorbed from the raw coal. The conversion of gas contents to an ash free basis gives the normalized gas content. The idea of using normalized gas contents is to look at the influence of the coal type, rank and pressure on the organic constituents only, that is, on a minerals free basis. The jmportance of using normalized gas contents in the correlations will be shown in the following section.
3.1 Variations in the in situ gas content ~lots of gas content against the mineral content, inertini te content, RV and depth of cover are shown in Figures 2,3,4 and 5 respectively. F1~~ 2 indicates that the in situ gas content tends to decrease progressively with increasing mineral content in coal. In contrast, the inertinite content shows a positive correlation with in situ gas content (Fig. 3). Depth of cover and¾ do not show any direct relationship with in situ gas content. ,max The amount of gas stored in a coal seam is controlled by several factors and, therefore, it is not possible to describe it successfully using a simple bivariate relationship. In order to overcome this problem, a multiple regression equation incorporating depth of cover, coal composition and rank as independent variables was computed using the least squares fit method (equation 1). 3
Gas content( ■ /t) = -19.4 + 0.0383 Depth(m) + 0.0292 I\ - 0.153 M\ + 7.63
¾
: ~ ...... l
1 - inertinite
PI = mineral content
Th is equation accounts for approximately 65% of the variation in the in s.i. tu gas content for the data set studied. This is not a very high correlation but enables interpretation of a majority of the variation. A l arge component of the remainder of the variation is likely to be due to measurement errors, especially gas content measurements. The Z-scores (standardized residuals) of the independent variables indicate that the mineral content and the depth of burial exert a greater inf!uence on the value of gas content than the inertinite content and R --v ,max (equation 2). 3
(Z)Gas content (m /t) = 0.538(Z)Depth (m) + 0.226(Z)I\ - l.04(Z)M\ + 0.274(Z)R-
V,max
. .. . ...... 2
Levine (1987} showed a similar relationship for the variation of in situ gas contents of some coals in the Cahaba Basin, central Alabama, U.S.A. The predicted gas content using the above equation shows that at 100% mineral content the gas content is very small (nearly zero). This implies that the amount of gas retained within the minerals of coals is very small or negligible. The role of inorganic matter in diluting the amount of gas stored in coal has been previously reported in other parts of the world (Levine, 1987; Barker-Read and Radchenko, 1989).
25
--0.2A87 --0.0717 0.1054 0.2824 0.4594 0.6364 --0.3J72 --0.16)2 0.OlfiB 0.1939 0.J7CB 0.5479 0.7211..9 DEPTH(ml GAS CONTENT (m3/tl CH4%
Rv,max
--0.3J72 --0.16)2 O.0lfi8 0.1939 0.J7CB 0.5479 0.72A9 --0. 2A87 --0. CJ717 0 .1054 0. 2824 0. 4594 0. 6361
Fig. 6 R-mode cluster analysis, dendogram I%= inertinite% (mineral free basis) V% = vitrinite% (mineral free basis)
*
GAS CONT(ash free)3 -
,.
,.
,.
,.
2*
,.
2
*
**
*
,. *
,.
*
**
* 2
,.,. ,. *
**
* *
* *
(m /t) 14 _0 +
10. 5+
*
,.
17.5+
*
,.
•
* • *
* *
------+---------+---------+---------+---------+---------+DEPTH 420
Fig. 7
450
480
510
Plot of normalized gas content versus depth
540
570
(m)
26
3.2 Varia tions in the norma lized gas conten t the storag e of only As shown above, miner als in coal are respon sible for is stored in the gas the very small amoun ts of gas and almos t all of gas conten t ( ash lized There fore, correl ation of norma organi c matte r. and depth is rank free basis) with the macer al compo sition of coal, prope rties of on necess ary to invest igate their influe nce on the gas sorpti coal. shown in Figure 6 The R-mode cluste r analys is dendog ram for the data set icant simila rity indica tes that depth is the only variab le showin g a signif correl ation (produ ct-mom ent the gas conten t in variat ions to the t depth agains t The plot of norma lized gas conten coeffi cient of . 69). ssivel y progre coal clearl y indica tes that the volume of gas stored in t nor conten nite increa ses with depth of cover (Fig. 7). Neithe r the inerti t. conten any interp retabl e direct relatio nship with gas R -v ,max shows using the Z-scor es of the A multip le regres sion equati on was compu ted ve , inerti nite conten t and depth to look at their relati variab les ~, large a has depth This equati on indica tes that influe nces ( ~~~ti on 3). t. The inerti n~te conten t has a much lower conten gas the influe nce on is neglig ible over the positi ve influe nce while the influe nce of RV ,max range of rank examin ed. 3
-
(Z)Gas content (ash free; m /t) = 0.799{Z)Deptb( ■) + 0.227(Z)I\ - 0.094(Z)R V,max ... ........ .. . 3
4. DISCUSSION of cover has an rhe set of data analyz ed in this study indica tes that depth contri bution of the and coal of ity overri ding effect on gas retent ion capac coals tend to ich nite-r inerti er, Howev coal type appear s to be second ary. observ ation This coals. ch ite-ri vitrin retain higher amoun ts of gas than ite was vitrin over nite inerti of of higher gas sorpti on capac ity 58). experi menta lly shown by Etting er et al.(19
does not show any The coal rank measu red by vitrin ite reflec tance cowor kers' (1980) and Boxho t. in t erpret able effect on the gas conten bitumi nous coals, le volati medium labora tory studie s also showed that in with small rank y icantl signif t he gas sorpti ve capac ity does not change study. t presen the variat ions, and this is the case in The pressu re. Depth of cover is direct ly propo rtiona l to the hydro static shows depth and t conten gas lized norma high positi ve correl ation betwee n increa ses with the that the gas storag e capac ity of coal progre ssivel y seams occurr ing coal study, t presen the hydro static pressu re. Accord ing to small amoun ts only n contai meters 300 al depths of approx imatel y less than of sorbed gas. found at relati vely Abnorm ally high gas conten ts in coals could also be latera l stress high where eld coalfi shallo w depths in some parts of the The nicatio n). commu al person idge, regime s occur (P. Lamb, and D. Tither be to ed presum is areas such in occurr ence of high strata pressu res coals. these in stored gas of ity respon sible for increa sing the quant
27
In f;itu gas contents of the coal seams are more closely related to its mineral content. The gassiness of a coal seam decreases with increasing mineral content. In addition, gas contents do increase with increasing inertinite content of coal. Both the Bulli and Wongawilli seams show a This negative correlation between inertinite and mineral contents. additional correlation means that the effects of inertinite content on gas sorption may be masked or enhanced by changes in mineral content. The Bulli and Balgownie seams (both with high inertinite and low mineral contents) should contain higher amounts of gas than the Wongawilli and Tongarra seams (higher mineral contents, and in the case of the Wongawilli seam, a low content of inertinite). Incorporation of all these variables into a multiple regression model enables the prediction of coal seam gas content for a majority of the data set used in this study. It is, however, not suggested that this model will necessarily be able to predict the coal seam gassiness for the whole population. If such a statistical model, which could predict the coal seam gas content for the whole coalfield, is to be investigated it would be necessary to have a much larger data set. Increasing the size of the data set may also eliminate some of the problems encountered due to the difficulty in obtaining accurate gas desorption data on all samples. 5. SUMMARY Depth of cover and the mineral content are controlling the amount of gas stored in coal.
the
two
major
factors
The gas sorptive capacity shows rectilinear increases with depth. In turn, The gas these increases are proportional to the hydrostatic pressure. content of a coal is also inversely proportional to its mineral content. No significant gas sorption takes place in the non-carbonaceous phase of coal. Therefore, at a given depth the gassiness of a coal is significantly d~termined by its mineral content. However, The influence of maceral composition is of lesser importance. inertinite-rich coals tend to store relatively more gas than vitrinite-rich coals. Coal rank, as assessed by vitrinite reflectance, does not exert any noteworthy effect on the gas sorptive capacity over the rank range studied. ACKNOIILEDEMENTS
The authors wish to thank the Australian Gas and Light Ltd, BHP Steel International, Collieries Division (Illawarra) and Kembla Coal and Coke Pty. Ltd. for providing gas data and some of the petrographic data used in this study. Special thc1nks are due to MESSRS Peter Lamb, Ian Stone and David Titheridge of KCC, MESSRS Barry Clark, John Hanes and Paul Maddocks of BHP, and the staff of Geology Department, University of Wollongong for their continuous support throughout this research project. The assistance of Mr. Chairul Nas with some of the computing work and the support of Mr. Ai vars Depers and Mrs. Barbara McGoldr ick are greatly appreciated.
28
RBl'IRDCB8 Barker-Re ad, G.R., 1984 - The gas dynamic behaviour of Coal Measures strata with particula r reference to West Wales outburst- prone seams. Ph.D. Thesis, Universit y of Wales, Cardiff. Barker-Re ad, G.R. and Radchenko , S.A., 1989 - The relations hip between the pore structure of coal and gas dynamic behaviour of coal seam. Mining Science Technolog y, 8, 109-131.
Boruco, J., Stassen, P., Mucke G., Noack K., Jeger, C., Lescher, L., and Morris, I.H., 1980 - Firedamp Drainage. Browning, E.J., Dunmore , R. A Handbook for the Coal Mining Industry in the European Convnunity . Coal Directora te of the Corranissio n of the European Corranunit ies, Verlag Gluckauf GmbH., Essen, 415p. Significa nce and determina tion of gas Close,J.C . and Erwin, T.M., 1989 content data as related to coalbed methane reservoir evaluatio n and productio n implicati ons; in Proceedin gs of the 1989 Coalbed Methane Symposium , The Universit y of Alabama, Tuscaloos a, Alabama, U.S.A., 37-55. Ettinger, I. L., Lidin, G.D., Dimitiev, A.M. and Shaupach ina,E.S., 1958 Systemati c handbook for the determina tion of the methane content of coal seams from the seam gas pressure and the methane capacity of the coal. Institute of Mining, Academy of Sciences, U.S.S.R., U.S. Bureau of Mines Translati on No. 1501. Ettinger, I.L., Lindin, G. and Eremin, I., 1967 - Natural factors affecting coal sorption propertie s - II, gas capacity of coals found in weatherin g zones of coal deposits. , Fuel, 45, 277-282. Gan, H., Nandi, S.P. and Walker, P.L., 1972 - Nature of the porosity in American coals. Fuel, 51, 272-277. Scanning 1976 and Yust, C.S., Harris, L.A. observati on of porosity in coal. Fuel, 55, 233-236.
electron
microscop e
Kim, A.G., 1978 - Methane drainage from coal beds: research and utilizatio n in methane gas from coalbeds developme nt, productio n and utilizatio n; in U.S. Departmen t of Energy, Morgantow n Energy Research Center, SP-78/1, 13-17. Lama, R. D., 1988 - Adsorptio n and desorptio n of mixed gases on coal and their implicati ons in mine ventilati on; in Proceedin gs of the 4th. Internati onal Mine Ventilati on Congress, Brisbane, QUeenslan d, 161-174. Lama, R.D. and Bartosiew icz, H., 1980 - Determina tion of gas content of coal seams; in Proceedin gs of the Aus IMM Symposium On Seam Gas Drainage with Particula r Reference to the Working Seam, Wollongon g, New South Wales, 1-14. Levine, J. R., 1987 - Influence of coal compositi on on the generatio n and retention of coalbed natural gas; in - Proceedin gs of the 1987 Coalbed Methane Symposium , Tuscaloos a, Alabama, U.S.A., 15-17.
29
Meissner, F.F., 1984 - Cretaceous and Lower Tertiary coals as sources for gas accumulations in the Rocky Mountain area; in Source Rocks of the Rocky Mountain Region, 1~4 Guidebook, Rocky Mountain Association of Geologists, 401-431. Rightmire, C~T., 1984 - Coalbed methane resource; in Coalbed Methane American Association of Petroleum Resouces of the United States, Geologists, Studies in Geology No.17, 1-13. Standing Corrrnittee for Coalfield Geology in N.S.W., 1971 - Report of Combined Subcomnittees for Southern and Southwestern Coalfields. Records New South Wale~ Geological Survey, 13, 443 - 447. Teichrnilller, M., 1982 - Origin of the petrographic constituents of coal; in, Stach, E. Mackowsky, M - Th., TeichmUller, M., Taylor, G.H., Chandra, D. and TeichmUller, R. (eds), Stach's Textbook of Coal Petrology; third revised and enlarged edition. Gebriider Borntraeger, Berlin, 219 - 294. Ulery, J. P., 1984 - Effects of petrographic characteristics on coalbed gas content; in U.S. Bureau of Mines, Special Publication 2-84, 15-16.
31
GAS FROM AUSTRALIAN COALS: 1fBBRB FROM AND WBBRB TOT
I. Gray Department of Resource Industries, Brisbane, Queensland
ABSTRACT This paper reviews the history and future of efforts to remove gas from Australian Coals. Parallels may be drawn between the early efforts to drain gas to prevent outbursts and current attempts to drain gas commercially. The conclusions arrived at indicate that Australia has developed its own drainage technology to reduce methane in mines and prevent outbursts. Australia will now have to embark on further home developments to extract gas for commercial use from its coals.
HISTORICAL REVIEW OF GAS EXTRACTION FROM COALS The first reported (Hargraves, 1982) extraction of gas from coal seams was at Balmain Colliery where a shaft was sunk at the turn of the century. Subsequent drilling in the shaft bottom lead to commercial gas production from 1942 to 1950. Since then the interest in gas in coals has been quite cyclical. The explosion hazard posed by methane in coal mines was until the last decade negated solely by supplying adequate ventilation air for dilution purposes. The next reason for interest in gas in coal next grew with outburst problems (the expulsion of gas and coal from the working face). outbursts causing fatalities occurred at Metropolitan Colliery ( 1925, 1954), Collinsville State Mine (1954) and Leichhardt Colliery (1979). The cause of these was recognised at an early stage by miners as being gas and attempts were made to relieve the problem. In seam drilling was tried extensively but was restricted by the inability to drill much more than 40 m. The problem with drilling was not so much one of lack of drill thrust or torque but rather lack of directional control. Typically, a mining cycle in outburst prone areas in the 1950 1 s through to the 1970 1 s using drainage involved drilling one to ten 43 mm holes in the face 30 m long. Mining followed directly which would take two or three days to reach the extent of the holes. The process would then be repeated. This operation was combined with face testing for the gas emission of cuttings as a control on its effectiveness. High emissions meant more holes and slower mining. This type of procedure met with mixed success but still did not eliminate outbursts. Clearly drainage was occurring too slowly for this sort of operation and alternatives were tried in the 1960's and 1970's to speed up the process. These were the use of large diameter drilling and pulsed infusion shotfiring. Large diameter
32
drilling was effective where substantial failure occurred around the holes. Presumably this failure was a function of effective stress (total stress in the coal minus gas pressure) and the fact that a substantial void existed into which the broken coal could collapse. Problems with maintaining hole alignment and the delay caused to mining brought about by this sort of drilling led to the use of pulsed inducer shotfiring. This involved the use of submarine explosive in boreholes sealed with a packer and pressurised with water. The purpose of the water was to extend the shattering effect around the hole. In the mid 1970' s Houston Oil and Minerals displayed an interest in the commercial development of methane gas from coal. This took the form of exploration drilling and in 1976 a trial production well at Moura. This well was not a success, with an unstimulated flow of 200 cu.m/day which was raised to 2500 cu.m/day following hydrofracture. The company's interest in the commercial exploitation of the gas seemed to wane then in favour of coal mining. In 1979 to 1983 the study of gas in Australian coals received an enormous impetus. This came about initially because of the need to deal with outbursts, which occurred at Leichhardt Colliery near Blackwater, Bowen No 2 mine at Collinsville and Westcliff Colliery near Wollongong. Funding for research work was facilitated by the National Energy Research Development and Demonstration Committee (NERDDC) and also strongly supported by coal mining companies riding on the crest of a coal boom. Slightly lagging the study of outbursting was the perceived need to reduce gas in the ventilation system of mines, especially in the Wollongong Area. Such events as the fatalities in the Leichhardt Colliery outburst, and the Appin Colliery explosion, emphasised the need to work on controlling gas in coals. Initially the outburst work focused on understanding the outbursts. This took two forms, firstly examining outburst sites and relating the outburst to geological structures. These were in many cases filled with fault gouge material. This was not universally the case though with some structures only being detectable when mining had revealed them. In the case of Leichhardt Colliery structures often did not exist at all. The second area of study was to locate the source of energy driving the outburst. Theoretical studies (Gray, 1980) confirmed the existing belief that gas was the main contributing factor to the energy release, being significantly larger than that from rock strain energy release, even in the case of the apparently brittle failures at Leichhardt Colliery. The results of energy release studies turned part of the thrust of outburst research to gas drainage studies while other work continued on structural geology and the location of such structures. Gas drainage studies conducted in the Bowen Basin for outburst research showed the importance of several factors, notably the cleat controlled highly directional nature of permeability in the coals (Gray 1982), and the increasing effective permeability with drainage. This increase
33
in permeability was greater than could be attributed to water removal and Gray (1983 and 1987) attributed the effect to reductions in effective stress brought about by shrinkage of the coal. Whatever the mechanism the changes in permeability were so great ( 10 - 1000 fold at Moura and Leichhardt) that were meaningless. The effect short term drainage operations of degassing on preventing outburst problems was also graphically demonstrated at Leichhardt as all outburst problems disappeared in the drained southern development but reappeared when seam pressures at the face reached 2.5 MPa. Gas drainage studies were simultaneously under way at Westcliff Colliery (Marshall, et al 1982) with a view to degassing blocks to be extracted and hopefully alleviating outbursting. These were facilitated by a drill (Craelius Diamec 250) that could repeatedly achieve 150 m hole lengths in seam. Outburst alleviation was apparently achieved by this program. The work conducted at Collinsville, Leichhardt, Moura and indicated that Collieries during this period Westcliff drainage at 12 to 20 m borehole spacings took months to achieve not the days permitted in the past. This time lag had to be built into mine plans. Augmenting this short hole work was long hole drilling program undertaken by Australian Coal Industry Research Laboratories Ltd (ACIRL) (Hebblewhite et al 1982). This involved the import of an Acker Big John Drill from the USA. This machine used thrust and rotational speed variations to control the dip of the hole and keep it in seam. No control of azimuth was however possible with boreholes sometimes changing direction by up to a right angle. Despite reaching over 800 m with this equipment the lack of control of drilling direction meant the system was not practical for mine drainage. In the midst of the underground drilling activity in 1980 BHP drilled from surface, and hydrofractured four wells on the Appin Colliery lease area, and the same number at the Leichhardt Colliery lease area. The wells in question produced less well than a l00m in-seam borehole. This was inadequate for the project to be continued. Horner and Enever (1989) attribute this poor performance to inadequate fracture design Almost certainly the and to unfavourable stress fields. fractures at Leichhardt were horizontal while the fracture at Appin 1 well could not be detected in later mining. The need for post drainage of strata following panel extraction by longwall or continuous mining grew. This work started in the Wollongong area and is described by Battino and Regan (1982) for Appin Colliery. It involved drainage through surface holes and holes drilled from underground workings into strata surrounding the seam, notably the usually unmined Wongawilli seam. Drainage of this nature has closely followed European practice by using vacuum to draw gas out of the fractures.
34
in recession and industry was By mid 1983 the coal developments slowed. The gas in the Bowen Basin coal deposits was valueless while the use of methane in NSW was essentially limited to the mines' own power generation. With the exception of continuing research work into alleviating outburst by gas drainage at Bowen No 2 mine at Collinsville, gas drainage was primarily a production operation to support mining operations in the Wollongong area. This was very much the pattern for the next five years with two notable exceptions. The first of these was that ACIRL continued to develop underground drilling funded by NERDDC grants. This funding allowed ACIRL to get downhole motors into the mines and the use of directional drilling grew. ACIRL took this technology into the mines on a teaching and contract basis. They tested a cableless measurement while drilling tool (MWD) and returned to using single shot tools. The other interesting development was that Methane Drainage Pty Ltd. This subsidiary of AGL Co Pty Ltd attempted to drain gas by extending the Tower Colliery workings to the Wongawilli In seam drilling was planned for commercial gas seam. extraction. Unfortunately this interesting operation came to an end with the loss of the drill string and associated equipment. Had this operation succeeded its sequel would have been uncertain because of the lack of convenient shafts to drill from. coal most recent phase in the extraction of gas from started in late 1987 to early 1988 when CB Resources Ltd in Townsville and Seam Gas Enterprises (part of BHP) Both commercially. coal from gas extract to decided enterprises chose to import expertise from the USA to support their operations which used hydrofracture. CB Resources, now known as North Queensland Energy Pty Ltd, chose to develop the Broadmeadow site near Moranbah. This venture was not the success it was hoped, with very variable but generally low flows from hydrofractured wells. This site along with NQE's northern lease has now changed hands to Mitsubishi Chemicals and NQE's attention has now turned to the Dawson River site on its Southern lease. Seam Gas Enterprises completed a single hydrofracture at Central Colliery German Creek Mine in early 1989. It is a great pity that no production took place from this hole due to pump problems. The
seams
Simultaneously
with
the
hydrofracture
Central
German
Creek
Mine undertook a very successful underground in seam methane
drainage operation involving drilling to 250 musing down hole motors.
THE PRESENT SITUATION DRAINAGE OF VIRGIN AREAS FROM UNDERGROUND
Currently Australia has a number of mines involved in seam gas drainage using conventional rotary and down the hole motor directional drilling for in-seam methane drainage drilling. Drilling distances are typically across a longwall block plus road additional distance to cover the next gate some
35
to need 250 m. In addition there is a ie development, are ahead of new development. Here there pre-drain Long hole drilling can currently only reach limitations. rod friction and survey delays m when 900 approximately is less than the This process. the stop effectively drilling underground current panel. longwall a of length m per 50 approximately of rate drilling a permit techniques shift. Despite the enormous effort that has gone into the development of drainage simulators the exact reservoir mechanics of coal seams are elusive and the seams themselves very variable on a hole to hole basis. For this reason the choice of drainage largely come out of borehole spacings has and times experience. Despite the individual hole variations the overall average flows over substantial numbers of holes are reasonably Measuring initial gas seams. individual consistent for contents and monitoring the quantity of gas drained so that material balances can be calculated is the key to successful gas drainage in practice. In addition to drilling in the working seam, there is some cross measure drilling to pre-drain adjacent seams. This becomes more important as a post-drainage exercise after extraction. Drained gas is collected into underground pipe lines which are connected to surface. Usually there is a liquid ring vacuum pump on surface to assist gas flow in the pipework.
GOAF AND RELAXED STRATA DRAINAGE
Drainage from the goaf is accomplished in a number of mines. Underground this is performed by vacuum drainage through stoppings and via boreholes drilled at an angle above and below the goaf. Vacuum perceived to be necessary to induce flow because the gas pressure in the opened fractures is low. Some gas drainage is conducted through vertical holes into the goaf. Design is by experience.
VIRGIN DRAINAGE FROM SURFACE
is the only work at draining gas from surf ace currently, Seam involved, firms The extraction. commercial to view with a Gas Enterprises, and North Queensland Energy seem to have a totally different philosophy though both are using similar extraction technology, namely hydrofracture. One is operating of to mine sites (which facilitates the assessment close to exploration in engaged is other The effectiveness). its locate the best site (adequate gas and high try and permeability) and to subsequently develop it. Exploration involves looking on a prospect wide basis at gas contents, geological structures and stress levels and on an individual site basis at the location of individual boreholes so that they may intersect the most permeable structures. Drill stem permeability tests conducted in different holes on the same seam at the same site show wide permeability variations consistent with the occasional intersection of vertical holes with sub vertical structures. They also give no indication of the nature of directional permeability.
36
THE FUTURE OF GAS EXTRACTION FROM COALS IN AUSTRALIA The histor y of gas extra ction from Austr alian Coals has been tied to three aspec ts: The need to remov e the gas An adequ ate under standi ng of the reserv oir mecha nics The extrac tion techno logy (drill ing, hydro fractu re) These
three facto rs will be just as impor tant in the
future .
THE GAS
THE NEED TO DRAIN The need to drain gas from our underg round mines will . grow with increa sing depth and the develo pment of gassy seams The most signi fican t new growth area though will be broug ht about d by the comm ercial pressu re to develo p this often well locate the by seen gas resou rce. The comm ercial intere st can be increa sing numbe r of compa nies becom ing involv ed. THE RESERVOIRS ly While the reserv oir behav iour of coal seams can be readi and holes assess ed from underg round mines by drilli ng trial from param eters reserv oir estab lishin g them, monit oring tial essen is surfac e is much more compl ex. Furth er develo pment es mistak sive expen and embar rassin g preve nt to here partic ularly in the area of comm ercial draina ge. Austr alian reserv oirs need to be define d. This means that the seams , their struct ure, gas conte nts, hydro geolo gical regim es and the fluid pressu res need to be quant ified. Perme ability and stress inform ation needs to be gathe red where ver possi ble as should indica tions of direc tiona l perme abilit y. On a site speci fic basis there is a need for the same be inform ation but in more detai l. Stress measu remen ts need to the in level condu cted with speci fic atten tion to the stress coal seams which can be expec ted to be differ ent from the surrou nding rocks . Direc tional perme ability testin g needs to be under taken. The effec t of perme ability chang es during draina ge needs to be assess ed both at the core level (Harp alani, 1979) and at the cleat level (Gray, 1987) . The key to succe ssful gas extra ction is monit oring, eithe r on the mining lease or for comm ercial extrac tion. The most valua ble form of monit oring is long pressu re measu remen t at locati ons separ ated from the produ ction sourc e. To date this monit oring has been sadly lackin g in most attem pts at draina ge from surfac e to date princ ipally becau se of cost. Techn ology can and must be to reduce the cost of such monit oring develo ped. Develo pment s which are centre d on mining opera tions are likely to benef it great ly becau se of the wealth of inform ation availa ble from that opera tion. Choos ing the right techno logy to extra ct the gas from the coal For seam will depend heavi ly on the reserv oir param eters. only our as re fractu hydro on depend not examp le, we should produ ction option away from coal mines . It would be unsui table
37
if for example the fracture orientation is unfavourable, say horizontal or down the cleat in a seam with very little across cleat permeability.
EXTRACTION TECHNOLOGY
The extraction technology has traditionally been the tap that controls the removal of gas from coal. To date drilling has been the principal technology augmented by as yet unsuccessful attempts at hydrofracture. As drilling improvements have become available they have been adopted by the mining industry without delay. The development of this extraction technology is the key to draining our mines of dangerous gas and enabling the exploitation of Australia's enormous reserves of gas from coal. The development of bigger (longer) and better (better propped) hydro fractures continues. However, the inability to control direction of fracture is a major disadvantage to this the While the technique may be ideal for some locations system. there are good indications that this may not be the case for areas, including large sections of the Bowen significant stresses will lead to either horizontal Here Basin. fractures that run down the cleat fractures, or vertical parallel to the direction of major permeability. In fact the serious as the latter as the former case is probably not as provided it is made large frac can be made to produce, enough, and provided it occurs in- seam. The great advantage multiple seam completions of hydro fracture is the fact that can be achieved in the same borehole. We must monitor the hydrofractures from surf ace by direction and extent of our where possible examine them in seismic or other means and subsequent mining. Despite the continuing development of hydrofracture in the oil the development of drilling is on industry, and gas specifically horizontal drilling completion from resurgence, wells. Coal mining already has a lot of that vertical technology developed in the last decade. The potential exists exploration drilling equipment for a medium radius to use 300 m) borehole to the seam using petroleum (100 to would be followed in seam drilling using expertise. This This approach has the expertise. current underground in seam can be controlled. The advantage that the direction technique cannot be used for multiple seam completion but it can potentially be used to create multiple branches in seam. Separating water from gas and pumping out the water becomes a such horizontal holes as neither significant exercise in mono pumps are suitable. Such a sucker rod nor shaft drive program is proposed for German Creek mine. For vertical to in seam holes and underground in seam drilling to increase in range and drilling rate several problems associated with directional control need to be addressed. Improved borehole survey equipment needs to be obtained. Single shot survey tools slow up the operation too much.
38
Downhole aurvey equipment will become essential and measurement while drilling (MWD) tools may be needed. These may either use cable connection or pulsed information. Acoustic transmission seems to have substantial problems in the underground situation due to noise from gas bubbles. This would not be the case in a water or mud filled hole drilled from surface because the bubbles would be suppressed. Boreholes drilled using the current directional drilling technology involve a bent housing near the bit. This bend permits direction changes to keep the hole in seam. It also means that the hole changes direction all the time. To keep the hole on target multiple corrections need to be made to the orientation of the bend. This leads to a hole which is not straight and has rod friction problems which restrict drilling range. Improved surveying tools and hence survey frequency will lead to the ability to correct deviations more often. It is however highly desirable that methods be developed to permit straight drilling until a structural feature in the seam forces a change in orientation. Then there is a need to change the drilling procedure to facilitate a correction without withdrawing the drill rods. Such a concept may be thought of as a bend that may be adjusted down the hole. In fact this development may not be so far away. A third very axci ting alternative to hydrofracture or rotary drilling is water jet drilling. This has recently been used to drill to 120 m in seam at German Creek mine. At this distance the process was halted by a lack of drill rods. This technique uses high pressure water jets (600 bar) to break up the coal and drill the hole. Rear facing jets make the equipment largely self advancing. It has the potential to be used for in seam drilling from underground and surface. In the latter case it may be used for the in-seam part of a medium radius program, or it may form the basis of a very short radius lateral completion alternative for vertical wells. Longer drillholes are likely and will represent a considerable investment especially where they are drilled from surface. There will be a growing need to protect this investment against collapse. To do this economic screening will need to be developed, a particular challenge in branched holes.
CONCLUSIONS Methane gas drainage in Australian coal mines is reaching the stage of maturity after significant local development. There are an adequate number of people who understand the process and who are continuing to apply it to individual mines that it will continue to develop. current experience from mining oper.ations has shown that the best approach to drainage is comprehensive drillhole coverage of the area to be drained followed by adequate monitoring. Using these techniques outbursts and gas makes can be controlled in our mines.
Gas drainage of virgin seams from surface for mine or more particularly commercial purposes is in its infancy. Attempts to date in Australia used hydrofracture technology imported
39
directly from the USA. To date these have not be·e n successfu l. Our condition s seem to dictate the need to amend this technolog y to suit Australia n condition s, or to develop alternativ es. Failing this we will restrict the · use of our extensive and very large reserves of gas to pockets where Based on the existing technolog y operates satisfact orily. drilling seam in s operation nd undergrou our performan ce of • from surface may be a more favourabl e option. To use it or other alternativ es some more home grown technolog y will be needed. We should not be reticent in developin g it.
REFERENCES Battino S and Hargraves A J ( 1982) . Seam Gas Pre-Drain age at 2 No Moura and Metropoli tan Leichhard t Cook, Appin, r Particula with Drainage Gas seam Symposium on collierie s. Branch, Illawarra Southern seam. Working the Reference to AusIMM. May 1982, Wollongon g, pp 157-171. 'I,
(1980). The Mechanism of, and Energy Release Gray Ian Outbursts in Coal Mines, Symposium on the with d Associate occurrenc e, Predictio n and control of outbursts in coal Mines. Southern Queenslan d Branch, AusIMM. Sept 1:-9-80, Brisbane. pp 111-125. Gray Ian (1982). Gas Drainage Studies in Queenslan d. Symposium on Seam Gas Drainage with Particula r Reference to the Working Seam. southern Illawarra Branch, AusIMM. May 1982, Wollongon g, pp 218-229. Gray Ian (1983). Factors Influencin g outburstin g and Gas Drainage in Undergrou nd Coal Mines. Doctoral Thesis submitted to the Universit y of New South Wales, School of Applied Geology, 348p. Gray Ian (1987). Reservoir Engineerin g in Coal Seams, Part 1: The Physical Process of Gas Storage and Movement in Coal society of Petroleum Engineers Reservoir Engineeri ng, seams. February 1987. SPE Paper No.12514. Hargraves A J (1982). Keynote Address. Symposium on Seam Gas Drainage with Particula r Reference to the Working seam. Southern Illawarra Branch, AusIMM. May 1982, Wollongon g, pp 21-35.
Hebblewhi te B Richmond A J and Allan J (1982). Australia n Experienc e in Longhole In-Seam Drilling Technolog y for Seam Gas Drainage. Symposium on seam Gas Drainage with Particula r Reference to the Working seam. southern Illawarra Branch, AusIMM. May 1982, Wollongon g, pp 202-217. Harpalani S (1989). Permeabil ity Changes Resulting from Gas Desorptio n. Quarterly Review of Methane from Coal seams Technolog y, V6, Nos 2 and 3, June 1989.
40
Horner D Mand Enever J R (1989). In-Situ Stresses: A Critical in Performance Fracture Hydraulic Influencing Factor 'b e--=d _P_r_o_c_e_e_d...,i.....n...g...,s....._.....o"""'f....._....t ....h""'e....._.....1....9.....8....9___-c....o....a=l"'"... Austra 1 ian coal Basins. of university The symposium. Drainage Methane Alabama/Tuscaloosa , 1989. Marshall P Lama R and Tomlinson E (1982) Experiences with Pre-Drainage of Gas at West Cliff Colliery. Symposium on seam Gas Drainage with Particular Reference to the working seam. Southern Illawarra Branch, AusIMM. May 1982, Wollongong, pp 141-171.
41
HYDRAULIC PllACTUllIHG: GBNBBAL PRINCIPLES OF DESIGN AND APPLICATION TO COALBKD IIBTHANB R.G. Jeffrey Jr. CSIRO Division of Geomechanics, Mount Waverley, N. S. W.
INTRODUCTION Hydraulic fracturing is a way of stimulating a well in order to increase its production rate. Hydraulic fracturing is accomplished by pumping a fluid into the well so that the wellbore pressure inaea.ses to a level sufficient to initiate a tensile fracture along the borehole wall. Continued injection then causes the fracturing fluid to enter and extend this fracture. A well-rounded sand or other proppant material is added to the fluid being injected during the later pa.rt of the stimulation. This proppant is carried by the fluid into the fracture and serves to prop the fracture open after pumping is stopped. The hydraulic fracture thus formed provides both new reservoir surface area, through which reservoir fluids can be produced, and a highly conductive channel connecting this surface area with the wellbore. The rate at which the reservoir fluid can be produced from a fractured well will, thus, depend upon reservoir properties such as permeability, pressure and thickness, and on the penetration and conductivity of the hydraulic fracture created in the reservoir. EFFECT OF STIMULATION ON PRODUCTION
For the purpose of illustrating the effect that hydraulic fracturing can have on production, the McGuire and Sikora (1960) plot shown in Figure 1 is often used. The curves in this figure give the ratio of fractured to unfractured productivity indices, as a function of relative fracture conductivity, for fractures that penetrate a fraction L/re of the reservoir size. Note that the productivity index is defined as: q
J=---
(1)
P-PwJ
All symbola uaed in this paper are defined in the nomenclature section. Hydraulic fractures must have sufficient conductivity (controlled by the propped fracture width and the permeability of the proppant) and must extend into the reservoir for sufficient distance (the fracture half-length) compared to the permeability of the reservoir and to the reservoir size, if an effective fracture treatment of the well is to be obtained. According to the McGuire and Sikora curves, a fracture that fully penetrates a reservoir can, if it has sufficient conductivity, increase the productivity of a well by up to a factor of thirteen. These curves were developed for a vertical fracture in a homogeneous reservoir and are for production under single-phase flow conditions. Today, numerical reservoir simulators or type curves constructed from numerical simulations are often used to make predictions, for a particular set of well and reservoir conditions, concerning the effect a hydraulic fracture stimulation might have on production. Once an optimum for fracture size and conductivity is selected, the task of designing a pumping schedule that will create such a fracture begins.
42
DESIGN OF HYDRAULIC FRACTURE TREATMENTS The pumping schedule for a hydraulic fracture treatment is arrived at by selecting the injection rates, fracturing fluids and proppant loading in the fluid that will produce the optimal fracture, ta.king into account the cost of the treatment and the increase in production rate (and the value of the reservoir fluid produced) for that stimulation. Current practice is to conaider several fracture treatments and, by use of reservoir and fracture simulators, to select the optimal design based on maximizing the treatment's net present value (Meng, 1987; Veatch and Moschovidis, 1986). The optimization process requires that predictions concerning the size of a hydraulic fracture and resulting production from the reservoir can be made. Hydraulic fracturing in coal is not well enough understood at this time for fracture size and conductivity to be predicted with enough confidence to use in an optimization process. The design of the hydraulic fracture treatment is most often performed using numerical hydraulic fracture simulators. These fracturing models require input data, such as rock, reservoir and fracturing fluid properties, that are often difficult to measure accurately at an appropriate scale or under conditions representative of those that will be encountered during the hydraulic fracturing operation. In addition, the design models idealize the processes that occur during hydraulic fracturing and, especially in modeling fracture propagation in coal, do not even contain some of the processes involved. The difficulty in obtaining representative data means, by itself, that the fracture design must be approached as a data-limited problem (Starfield and Cundall, 1988). A data-limited problem is one for which all the data required to solve the problem are not available or can only be measured within fairly broad limits of accuracy. The user of models of data-limited problems should be aware of the limitations of the models and apply them as a tool to guide the design and to suggest which data the problem is senaitive to and which can be approximated. Mismatches between model prediction and observed result can indicate that more refined data &re needed or that an important process is missing from the model. Once an interval or payzone has been selected for stimulation, the rock and reservoir properties that enter into a fracture design must be measured as input data for the design. These data are essentially fixed but, because the values of these parameters cannot be accurately measured, they are often varied during the design process. The designer only has control over the type and volume of fluid to be injected, including additives to the fluid, and the rate at which it is to be pumped into the well. The models used range from analytical solutions obtained for idealized conditions to two-dimenaional (2D) and thr~dimensional (3D) numerical models (Mendelsohn, 1984a; 1984b ). After establishing the reservoir and rock properties that will affect the way the fracture grows, a treatment schedule that consists of volumes (or stages) of treating fluids and the injection rates for each is developed that will, according to the model, produce a fracture of the desired sw.e. LEAKQFF Of the total fluid volume injected, part is stored in the fracture and part is lost to the formation as a result of leakoff which is driven by the pressure gradient between the fluid pressure in the fracture and the reservoir fluid pressure. The leakoff process is approximated as being one-dimensional, and the rate is calculated using a laboratory- or
43
field-measured leakoff coefficient, C. The lea.koff rate per unit fracture surface a.rea. is then given by:
q,
C
~ = yt-T
(2)
where T is a function that gives the time of first exposure of the unit a.rea to the fracturing fluid and depends on the rate of fracture growth. Analytical solutions can be found for rate of fracture propagation that include leakoff for constant width fractures (Carter, 1957) and for fractures extending under conditions where leakoff is high and dominates extension. Under high leakoff conditions, fracture extension occurs because the leakoff rate per unit area decreases as 1/~, where at is the time since that area. was exposed to the fluid. This reduction in lea.koff rate makes available additional fluid volume that acts to extend the fracture. The equation for fracture length under leakoff-dominated conditions is the same for both KGD and PKN fractures (two types of 2D hydraulic fracture models) and is (Nolte and Economides, 1987): (3) Q t 1l 2 21rHC Note that during fracturing, assuming incompressible fluids, the following volumetric balance must hold: L=
VtaCGI = VieuolJ
+ VJradure
(4)
and the efficiency, 'I, of the fluid is defined as: (5) Geertsma and Haafkens (1979) and Nordgren (1972) discuss inclusion of the effect of leakoff into hydraulic fracturing models. The analytical solutions do not completely couple the fluid flow and elastic deformation processes. In addition, they impose limiting assumptions about fluid loss to the formation and do not provide for proppant transport calculations, heat transfer between the formation and the fracturing fluid, non-Newtonian fluid rheology, or growth of the fracture in height.
RHEOLOGY Of FRACTURING FLUIDS The fluid injected during hydraulic fracturing treatments ranges from water and gas, which may be treated as Newtonian fluids, to foams, gels, and crosslinked gels, which are non-Newtonian. Characterizing the rheology of many of these fracturing fluids is very difficult. Fracturing models assume that the fluid fits a pseudoplastic, power-law rheology model, which includes Newtonian behaviour as a limiting case. The power-law rheology model rel&tes the shear stress in the fluid to the shear rate by (Constien, 1987): Tf =
K l•n "(
1
(6)
44
A Newtonian fluid has n' = 1 and K' = µ. The parameter K' is the consistency index and n' is the flow behaviour index of the fluid. An apparent viscosity is sometimes reported along with values of n' and K'. The app&rent viscosity is defined as:
(7) and represents the viscosity a Newtonian fluid would possess to give rise to the shear stress at the same she&r rate. Nolte and Economides (1987) give the time dependence of net pressure and fracture extent, for the three classical models, when a power-law fluid is used to propagate them. The net pressure and extent are proportional to time raised to a power that depends on the value of n'. (8) ll.P ex t" 1 L ex t"'2 (9) Table 1 suJllIIl&rizea these relationships as given for fractures with zero leakoff. Table 1 - Time Dependence of Pressure and Extent of Fractures. I Model I
01
PKN
t2ta,+3
KGD Radial
I
02
t~:,u
I
~ tn+:a
I
ta~ .. +I
t- ,.P+:a r ,.P+2
I
A log-log plot of pressure versus time will, therefore, plot as a straight line, and the slope of the plot can be used to infer something about the growth mode of the hydraulic fracture (Nolte and Smith, 1981). For example, if the log-log plot displays a positive slope, the fracture is inferred to be contained in height and extending in length in a mode similar to that predicted by a PKN-type geometry. H the plot displays a negative slope, the fracture may be growing in height with an approxim&te radial geometry (or a radial, horizontal fracture may be forming) or slip at the interfaces between the coal and the bounding rock may produce a fracture that grows in a manner similar to the KGD model.
HEIGHT GROWTH The primary reaaon 2D models often prove to be inadequate in design work is that vertical fractures grow in height as well as length during a treatment. Height growth is, in general, not desirable, but it occurs to some degree in nearly all treatments. A number of factors present in the formation can act to control or limit height growth. Contrast in minimum horiwntal stress, between the payzone and the over- and underlying rock layers, is the most important single factor (provided the layers are relatively thick) that affects height growth of the fracture. H the rock layers above and below the paywne contain higher stress levels, acting across the plane of the fracture, fracture extension into these layers will be reduced. Simonson, Abou Sayed, and Clifton (1978) provide expressions for height growth limited by stress contrasts, based on fracture mechanics considerations. Other factors, such as elastic modulus contrasts, permeability contrasts and fracture toughness contrasts, can also act to limit fracture height growth (Simonson
45
et a.I., 1978; Ben-Naceur, 1987).
PsEuDo-3D MODELS Pseudo-t~dimensiona.l (P3D) models are based on the PKN model premise; vertical sections through the fracture can be treated as 2D plane strain fractures a.nd the flow is predominant down the length direction of the fracture. Height growth of each section is allowed to occur in P3D models based on growth criteria such as those developed by Simonson et al. Alternatively, a vertical fluid flow component is incorporated into some P3D models a.nd viscous friction is accounted for in the height-growth formulation (Settari a.nd Cleary, 1982). P3D models allow for better predictions to be made concerning growth of vertical fractures, but the modelled fracture should grow such that its length-to-height aspect ratio is greater tha.n a.bout three. THREE-DIMENSIONAL MODELS Nu.merical models that discretiu the fracture sudace, using either boundary elements or, sometimes, finite elements, and that allow the fracture to propagate in one pla.ne but with arbitrary shape, are called thr~dimensional models. Clifton and Abou Sayed21 developed the first workable 3D model, a.nd since then about half a dozen others have been developed. These models usually allow for general two-dimensional fluid flow (though sometimes limited to a Newtonia.n fluid) within the fracture a.nd ca.n consider problems with multiple stress and sometimes elastic property contrasts. Thr~dimensional models are notorious for being difficult to use a.nd maintain, and they require significant computer resources to run. They are useful for special problems that cannot be analyzed by simpler models a.nd as research tools to aid in the development of simpler models.
HYDRAULIC FRACTURING OF COAL Hydraulic fracture stimulation of coal seams is designed to create a fracture that is long enough and conductive enough to efficiently drain water a.nd gas from the seam. However, although some stimulation is almost always achieved, reservoir testing a.nd mineback results often show that the fracture created by the treatment penetrated only a fraction of the design distance into the coal seam. In addition, high treating pressures a.nd premature screenout near the wellbore present problems for successfully completing the treatment as designed. PRQBLQIS WITH COAL TREATMENTS The problems of high treating pressures, proppant screenout a.nd shorter tha.n designed fracture penetration are serious limitations to the reliable stimulation of coal seams by hydraulic fracturing. A number of processes have been suggested as causes of these problems; some of them have been shown to be causes while others remain hypothetical. At the same time, modifications to conventional fracture designs have been developed that reduce or eliminate some of the problems, but why these modifications work remains a point of speculation.
Mineba.ck work has shown that multiple strands and complex fracture geometries sometimes form near the wellbore. These multiple fractures interact a.nd compete for width with one another. Consequently, a wellbore screenout or a sudden increase in treating pressure may occur when proppa.nt is introduced. In addition, the interaction among the
48
multiple fractures cauaes a large pressure drop near the well, requiring increased overa.11 treating pressures to extend the fracture. Introducing a fine-mesh sand into the fluid before the proppant stages results in a reduction in fracturing pressure and a lessening of the risk of a wellbore screenout upon starting proppant. The fine-mesh sand may enter and plug some of the sma.11, secondary fractures around the wellbore, diverting the fluid from these fractures into a main fracture path (Palmer, Davids, and Jeu, 1989). Fracture propagation in coal tends to be guided, to some extent, by the pre-existing cleat fracture system. The hydraulic fracture path then contains many steps and offsets. These offsets increase fracturing-fluid friction loeses and the possibility of local bridging of proppant (Jeffrey, Vandamme and Roegiers, 1987; Palmer, Davids and Jeu, 1989). With a better understanding of the process involved in forming such offsets, ways of reducing their occurrence may be devised. Poroelastic swelling of the coal is associated with the infusion of fluid from the hydraulic fracture into the surrounding coal during the fracturing process. The resulting timedependent increase in stress acting a.cross the fracture may contribute to high treating pressures (Jeffrey, Hinkel, Nimerick and McLennan, 1989). Any fluid that is lost from the fracture into the surrounding coal is not, then, available to extend the fracture further or to transport proppant within the hydraulic fracture. Fluid loss rates in coal a.re believed to be high and are felt to be a major limiting factor in attempting to create the long hydraulic fractures in coal seams required for effective stimulation. Fine-grained sand is often used as a fluid loss control additive, but its function in limiting fluid loss into crosscutting cleat fractures is not well understood.
DISCUSSION AND CONCLUSIONS Reeves and O'Neill {1989) summarize several fracturing treatments done in the Bowen Basin as part of a pilot project to investigate the commercial feasibility of producing methane from coal sea.ms in Australia. The trend over the years has been to move toward larger treatments performed at higher rates. Higher injection rates serve to improve the efficiency of the treatment by reducing the exposure time of the fracture surface to the fracturing fluid. Larger treatments serve to create more fracture surface area than is possible with sma.ller volumes. However, there are limits to treatment sizes and rates that can be a.fforded. A better understanding of processes controlling hydraulic fracture extension in coal should lead to improved performance of the technology. The application of conventional hydraulic fracture design principles to fracture design for coal seam treatments results in significant differences between design and result. Problems often encountered in executing a fracture treatment in coal, such as high treating pressures and proppant screenout, are indicative of processes that are not included in the models used to make the designs. Over the past several years, practical methods of overcoming these problems have been incrementally developed. However, much remains to be gained if the process of hydraulic fracturing in coal can be better quantified and understood.
47
NOMENCLATURE RoMAN NOMENCLATURE
Size of reservoir (well spacing in acres). Lea.koff coefficient. Barrels per minute. Net pressure. Elastic shear modulus of rock. Fracture height. - Productivity index of fractured well. - Productivity index of unfractured well. - Permeability of reservoir. - Consistency index of power-law fluid. - Permeability of propped fracture. - Khristianovic-Geertsma-DeKlerk. - Ha.If-length of fracture. - Liters per minute. - Flow behaviour index of power-law fluid. - Perkins-Kern-Nordgren. - Pressure in flowing well. Average reservoir pressure. p - Flow rate from well. q - Volumetric injection rate. Q - Volumetric rate of fluid loss per unit of fracq, ture surface area. Reservoir extent (radius from well to reserre voir boundary). - Radius of well bore. r"' Volume of fluid in fracture. v,,.Cldwe v,...o/I - Volume of fluid that has leaked off. - Total volume of fluid injected. Vcotol - Average propped width of fracture (inches). w - Time. t GREEK NOMENCLATURE Shea.r rate in fluid. i' - Fluid efficiency. TJ - Dynamic viscosity. µ µ 11 - Apparent viscosity of fluid. T - Time of first exposure to fluid leaking off. Tf - Shear stress in fluid.
A C bpm t!iP G H J lo k K' kI KGD L 1pm n' PKN Pw/
-
REFERENCES Ben-Naceur, K., 1987 - Modeling of Hydraulic Fractures, in Economides, M.J. and Nolte, K.G. (eds), Reservoir Stimulation, Schlumberger Educational Services, Houston, 31-3-31.
41
Carter, R.D., 1957 - Derivation of the General Equ&tion for Estimating the Extent of the Fractured Area, Appendix to: Optimum fluid Ch&racteristics for Fracture Extension, by Howa.rd, G.C. and Fast, C.R. Drilling and Production Practice, API, 261-270. Clifton, R.J., and Abou S&yed, A.S., 1981 - A Variational Approach to the Prediction of the Three-Dimensional Geometry of Hydraulic Fractures, paper SPE 9879 presented at the 1981 SPE/DOE Low Perme&bility Gas Reservoirs Symposium, Denver. Constien, V.G., 1987 - Fracturing Fluid and Proppant Characterization, in Economides, M.J. and Nolte, K.G. (eds), Reservoir Stimulation, Schlumberger Educational Services, Houston, 5-1-5-23. Geertsma., J., and Haa.fkens, R., 1979 - A Comparison of the. Theories for Predicting Width and Extent of Vertical Hydraulically Induced Fractures, Journal of Energy Resources Technology, 101, 8-19. Jeffrey, R.G ., Hinkel, J.J., Nimerick, K.H., and McLennan, J.D., 1989 - Hydraulic Fracturing to Enhance Production of Methane from Coal Seams, paper 8992 presented at the 1989 Coalbed Methane Symposium, Tuscaloosa, 385-394. Jeffrey, R.G., Vandamme, L., and Roegiers, J.-C., 1987 - Mechanical Interactions in Branched or Subpa.rallel Hydraulic Fractures, paper SPE 16422 presented at the 1987 Low Permeability Reservoir Symposium, Denver, 333-341. McGuire, W.J., and Sikora, V.J., 1960 - The Effect of Vertical Fractures on Well Productivity, Transactions, AIME, 219, 401-403. Mendelsohn, D.A., 1984 - A Review of Hydraulic Fracture Modeling-Part I: General Concepts, 2D Models, Motivation for 3D Modeling, Journal of Energy Resources Technology, Sept. 1984, 106, 369-376. Mendelsohn, D.A., 1984 - A Review of Hydraulic Fracture Modeling- II: 3D Modeling and Vertical Growth in Layered Rock, Journal of Energy Resources Technology, Dec. 1984, 106, 543-553. Meng, H.-Z., 1987 - Design of Propped Fracture Treatments, Reservoir Stimulation, in Ec.onomides, M.J. and Nolte, K.G. (eds), Reservoir Stimulation, Schlumberger Educational Services, Houston, 8-1-8-28. Nolte, K.G. and Economides, M.J., 1987 - Fracturing Di&gnosis Using Pressure Analysis, in Economides, M.J. and Nolte, K.G. (eds), Reservoir Stimulation, Schlumberger Educational Services, Houston, 7-1-7-17. Nolte, K.G. and Smith, M.B., 1981 - Interpretation of Fracturing Pressures, Journal of Petroleum Technology, Sept. 1981, 1767-1775. Nordgren, R.P., 1972 - Propagation of a Vertical Hydraulic Fracture, Society of Petroleum Engineers Journal, 12, 306-314. Palmer, I.D., Davids, M.W., Jeu, S.J., 1989 - Analysis of Unconventional Behavior Observed During Coalbed Fracturing Treatments, paper 8993 presented at the 1989 Coalbed Methane Symposium, Tuscaloosa, 395-415.
41
Reeves, S.R., and O'Neill, P.J., 1989 - Preliminary Results from the Broadmea.dow Pilot Project Bowen Basin, Australia, paper 8974 presented at the 1989 Coalbed Methane Sympoeium, Tuscaloosa, 273-291. Settari, A., and Cleary, M.P., 1982 - Development and Testing of a Pseudo-Three-Dimensional Model of Hydraulic Fracture Geometry, paper SPE 10505 presented at the 1982 SPE Reservoir Simulation Symposium, New Orleans. Simonson, E.R., Abou Sayed, A.S. and Clifton, R.J., 1978 - Containment of Massive Hydraulic Fractures, Society of Petroleum Engineers Journal, 18, 27-32. Starfield, A.M., and Cundall, P.A., 1988 - Towards a Methodology for Rocle Mechanics Modelling, International Journal of Rock Mechanics and Mining Science & Geomechanics Abstracts, 25, No. 3, 99-106. Veatch, R.W., and Moschovidis, Z.A., 1986 - An Overview of Recent Advances in Hydraulic Fracturing Technology, paper SPE 14085 presented at the SPE 1986 International Meeting on Petroleum Engineering, Beijing, 421-454.
14
12 10
(J/ Jo
7.13
8
ln0.472 r.
6
r.
4
2 0 102
103
10 4
Relative Conductivity
10 5
10 6
wk, {40
kVA
Figure 1: The McGuire-Sikora curves that give the ratio of productivity indexes of a fractured to an unfractured well as a function of the relative conductivity of the fracture to the reservoir.
51
VERTICAL 1fBLL DBGASSIPICATIOJI TKIAL, CBNTBAL COJJ,JBRY, GBBIIAJI CllDK, QUBBNSLAlfD
G. Klenowski, P. Lynch and R. Byrnes Capricorn Coal Management Pty. Ltd. , Middlemoun t, Queensland
SUMMARY Hydrofracci ng is the process of pu■ping fluid at a high rate, under high pressure into a sequence of strata to induce and propagate fracturing. A test hydrofrac was perfor ■ed at Central Colliery, German Creek in March 1989. The objective was to de ■onstrate the physical effects of hydraulic stimulation and obtain infor ■ ation on the potential of hydrofracci ng as a tool in the predrainage of coal sea■ gas. A well hole was drilled to 242.7 ■, which was 20.46 ■ below the 2.54 ■ thick The Ger■an Creek Sea■ , and steel and fibreglass casing were grouted in place. sea■ coal the at charges explosive by perforated fibreglass casing was Dowell Schlumberge r was contracted to perfor■ the actual intersection . 302,000 litres of gelled fluid were prepared and pu ■ ped with hydrofrac. increasing quantities of sand into the coal sea■ . The fractures induced by the fluid are kept open after pumping stops by the sand. Che ■ icals contained in the fluid break down the gel in the 24 hours following the frac leaving watery liquid and sand. A co ■■ ercial size frac, both horizontal and vertical in orientation was Partial dewatering of the coal sea■ was achieved and ■ axi ■u ■ obtained. 3 recorded ■ethane flow rate prior to ■ ine-back was 35 ■ /hour.
52
INTRODUCTION A hydrofracture trial of the Ger ■an Creek Sea■ was co ■ pleted on 21 March, 1989 in 305 Panel at Central Colliery, Ger■ an Creek Mines. The drill hole, ECC90, was located about 50.0 ■ updip of the future 305 panel belt road fro ■ 7 cutthrough (Figure 1). Drilling and casing of the hydrofrac hole were co ■pleted by Strata Drilling. casing and hydrofraccing of the hole were done by Dowell Two Sea■gas Enterprises consultants on site during the trial were s.w. Lubert of Taurus Exploration, Alaba■a, and D.J. Ling of BHP Engineering, Wollongong. Ce ■enting of Schlu ■ berger.
GEOLOGICAL AND GEQTECHNICAL CONDITIONS The depth to the Ger ■ an Creek Seu in drill hole ECC90 is 219. 70 ■. A geotechnical log of the Ger■ an Creek Seaa and i ■■ediate roof and floor strata is included in Figure 2. Downhole geophysical logs were co■pleted by Century Geophysical. Logs included calliper, natural gu■a, long space density, bedding resolution density, coal quality, neutron-neutron, sonic, detailed sonic, SP, resistivity and verticality. Rock types overlying the Ger■an Creek Seaa are predo■ inantly la■ inites ranging in strength fro ■ 50 to 70 MPa. The Ger ■an Creek Seaa is a weak, friable coal with an average co ■pressive strength of 10 MPa. Thin stone bands occur within the coal. There is a ■ id-sea■ shear zone co■prising pulverised coal, and an upper puggy ■ udstone band near the top of the seu. In 305 tailgate there is a pro ■ inent north-easterly trending joint set in the roof rock, along which water seepage occurs. North-easterly trending cleat is co ■■on in the Ger ■an Creek Sea■ . The floor rock is siltstone with an average strength of 70 MPa. The principal horizontal stress (o1) direction is north-northeast and is 2.5 ti ■ es overburden stress. 02 stress is 1.75 ti ■es overburden stress (03), The expected sea■ gas content (desorbable) in this region is 6 to 7 ■ 3 /tonne. This value has been derived fro■ the existing gas content with depth relationship, for a depth of 220 ■.
DESIGN PARAMETERS Design parueters for the hydrofrac trial were determined by Seamgas Enterprises. The well design is shown in Figure 3. The hole was drilled to a depth of 242.7 ■. Fibreglass casing was used in the Ger ■an Creek Sea■ zone and the casing was selectively perforated to initiate preferential fractures away fro ■ the upper puggy ■udstone band. Perforations were spaced at 8 per 0.305 ■ and were for■ed by shooting bullets through the casing. [t was decided to only perforate the lower 1.83 ■ of the Ger■an Creek Seu in order to initiate fractures away fro ■ the upper puggy ■udstone band. Details of hydrofrac equip■ent and fluid are described later.
I I
,., .I S c/o 19 ell
\ \
:'I '"
\
304 PANEL
/ 11
+ I
.
7 >.,.
("
) C /I
1/ t
J
UI
w
IIOIH,
EB
I
305 PANEL
I
\
7
)O ' " '
FUTURE 305
I
_j_ ,..,,,.
_j_ IOO
0
e
FIGURE 1.
SCAU
lOO
I
_j_ , ... 11,
CENTRAL COLLIERY METHANE DRAINAGE HYDROFRAC TRIAL AREA
GEOTECHNICAL LOG
CO • ORDINATES
HOLE
N•
ECC_ 90 __(_HYDROFRAC HOlE) MtTIU
DESCRIPTION OF CORE I OCl nr, . COlOUl , GIAtN sou. ru, .. ,. MINHAL CO~TIOH.
.......... .. ,...,. ..,....
E .. 662 _'95 ·88 m
,
POINT
~
_ LOG
f:.:
l
:
6-i! ~ f S . IIOOeNO. ~ftHi , UAMS. STlfNGT h
~
;;;
SUR FACE ELEVATION 181 • 21 LOCAT ION CENTRAL COLLIERY 305 PANEL
N _74t,3 717 ·91 m STRUCTURES
1:1•-~IUIHIIO IOHU. fAUUI.
l OAD
ROCK STRENGTH INDEX
R. Q . 0
so
I hi SOI )
FRAC TURES PER METRE SO
IOO
DEGREE OF WEATHERING
IOO
............ ...,..
111 -
.
~~!I!•
SLAKIN G POTENTIAL 0
lON MIO
"'°"
-
.... .,.,
211 -
111-
21J -
11J -
114 JU -
1 .. -
1 .. -
117 -
111 -
111 -
-
.... ................. ...._ ... ...... ..,..,._
AfflT'IINI,
, ,
IUl"I W CM& Ul· IH• f • " • ..... ft 14t•le t
ns J» 127-
121 UI -
C) C
u,-
129 -
nn
IDO
:,0
m
DATE DRILLED 11 3 IC?.... LOGGED G. KLENOWSKI SHEET .... 1 ... Of .. . 1· - · - -
EXPLANATION
~
WEATHERING
CAN NOT H OfTUMINIO - I l l HO
CW
COIi WAS HCOYfllO , Ol NOi AmlCAlll IN UNCOHSOLIOATfO MATUIAU
Hw
HIGHU W(ATHf:11!0
SW • f, SI •
SllGHTlT WIATHUIO flESH WIIH LIMOHtTf STAINfO JOINTS
MW
MOOIIAfllT WIATHIHO
f,
IUSH
•
COMrUTILY WIATHftfO
55
l
I
~
G. L.
~
. .• ) ~ .'-"·•.----SURFAC E CASING 10¥4°' 0 .0.
.
14m
BOTTOM OF SURFACE CASING
. i
1
to11'------PROO UCTION CASING 5 1&"00.
l
216m
TOP OF FIBREGLASS CASING
i: _ _ _ _ FIBIEGLASS CASING. 5~•00 Non. ._., T0P0F SEAM
219•,0m f
GERMAN CREEK SEAM
' I
BOTTOM Of SEAM 222·24ffl
' -~~ , TOP Of SEAM BOTTOM a,, HAM
TOTAL DEPTH
~"' 225m
... f.
- - ~_" ·T~ - - - - - 221•1ffl ____ 221·6tn -
2A?•7m
BOTTOM Of FIBREGLASS CASING GEIMAN CREEK LOWER SEAM
"1 .... ~ ~
...... It'
I
FIGURE 3 : SCHEMATIC OF TRIAL HYDROFRAC BOREHOLE
58
COSTING Total cost for the hydrofrac trial including drilling, casing, ce ■enting, fracturing and support staff was $218,500.00. For a ■ultihole operation total hydrofracture costs would probably be reduced to about $150,000.00 per hole.
PERMEABILITY TESTING Per ■eability values were deter■ ined using packer tests. In packer testing a section of hole is isolated with a single {downstage testing) or double (upstage testing) packer arrange■ent. Packers are either inflated hydraulically or pneumatically. Water is then pu ■ped down the hole within drill rods and the flow rate and pressure are recorded. Five consecutive tests, each of ten ■ inutes duration are nor ■ ally done for each stage, with the f i rs t three tests being done at increasing pressures and the last two tests done a t decreasing pressures. Per■eability values can then be interpreted in ter•s of la■ inar flow, turbulent flow, dilation, wash-out and void filling {Refe rence 1). Currently used head pressures are 500, 750, 1000, 750 and 500 kPa . There are indications that these pressures are too high resulting in frac turing of the coal sea■, It is reco ■■ended that the test pressure for per ■ eability testing should be no greater than the colu■ n pressure fro ■ the surface to the coal sea■ which gives an active pressure equal to the head difference between the surface and the standing water level.
Prior to deter■ ining per■eability values, the differential head values need to be corrected for friction losses in the syste ■, which include flow ■eter, packer and rods. The for ■ulae for deter ■ ining per■eability fro ■ the packer test (Reference 2) are: (1)
k =
_L..
21tLH (2)
k = _L.. 211:LH
where:
lo~
L
where Li lOr
r
sinh·l 1 2r
where lOr > L ~ r
is per ■eability in ■/sec is constant flow rate into hole in ■ 3 /sec L is length of test section in ■etres H is corrected differential head of water in ■ etres r is radius of hole tested in ■etres is natural logarith■ loge sinh· 1 is arc hyperbolic sine
k Q
Considerable difficulty was experienced in setting packers below a depth of 200 ■. In future it is recouended that wireline packers be used for per ■eability tests in deep holes.
57
Hole DDH80 is an Water pressure test results are given in Table 1. observation hole drilled about 100 ■ south of the hydrofrac hole ECC90 (Figure The high per ■ eabi li ty values obtained for the German Creek Sea■ are 1). Prior to probably partially due to the high water injection pressure. hydrofraccing per ■eabilities of 31 to 41 millidarcies were measured in hole DDH80 . After the ■ inifrac, hole ECC90 gave permeability values of 58 to 73 No water flow occurred into the coal below a surface pressure ■ illidarcies. o f 500 kPa. Holes DDH80 and ECC90 were tested after the frac. Proper testing could not be done in hole DDH80 because of packer inflation problems. A total water take of 10216 litres was recorded during post-frac testing in Testing of this hole (Table 1) indicates that fraccing and hole ECC90. propping achieved the formation of significant open voids in the German Creek Sea ■ ,
TABLE 1 -
llol e No.
0080
SUMMARY OF NATER PRESSURE TEST RESULTS
S. N.L . Te ■ t Pl"e•sul"e Watel" Puaeabillty Te•t lnlel"Yal Take (a) (a) (kra) (a/ ■ ec) (1/10 ■ in Tut)
Pel" ■eabi li
ty
Coa ■ents
(Milliducy11)
500 750 1000 750 500
41.4 40.3 77.8 48.7 35 ..4
3.97 X 10 ·I 2.98 X 10 ·I 4,21 X 10 ., 3, 60 X 10 ., 3.40 X 10 .,
31 44 37 35
33.0
500 750 1000 750 500
79.0 115.o• 112.0 81.0 83.0
7 . 06 X 10 ·; 7. 90 X 10 • 6,25 x 10 ·I 5. 57 X 10 ·I 5. 63 X 10 .f
73 82 65 58 59
Tested aftel" ■ inifrac. No flow into coal below 500 kPa sul"face pl"essul"e. • Leakage at sub.
32.0
100 200 300 500 100 250 500 750 1000 750 500 250
833 . 0 847.0 660 . 0 658.0 633.0 460 . 0 390 . 0 448.0 498 . 0 262.0 130.0 Ho flow
1.52 X 10 ·I 1. 25 x 10 ·I 8, 21 X 10 ·I 6.21 X 10 ·I l.15xtO ·I 6, 21 X 10 ·I 3, 68 X 10 ·I 3.25 x 10 ·I 2. 93 x 10 ·I 1.90 X 10 ·I 1.23 X 10 •I 0
1578 1302 854 646 1199 646 383 338 305 198 128 0
Tested aftel" hydl"ofl"ac. Testa 1 to 4 done on 1/4/ 89. Testa 5 to 12 done on 2/4/89. Teets 1 to 4 could not get above 500 kPa pres ■ ul"e, Total water quantity puaped into hole 10 216 litres.
220.60 227.85
33.fi
£CC90 219. 70 222.24
ECC90 219 . 70 222 . 54
41
Teated pl"iol" to hydl"ofl"ac . Could not te ■ t aftel" hydl"ofrac due to packel" sealin• pl"oble ■a .
51
HYDROFRAC EQUIPMENT A sche ■atic diagraa or the surface !raccing equip■ent is shown in Figure 4.
WATER/FLUID STORAGE
During the actual traccing process a large quantity of fluid is consu ■ed in a short period ot ti ■e. A fluid storage facility was a vital part of the site Fraccing fluids were prepared and stored in 6 x 70,000 litre equip■ent. tanks.
BLENDING MACHINE
The blender was used to blend and ■ ix the hydrofraccing fluid both prior to and during the hydrofrac process. The blender has a diesel-powered agitator and pu ■ p syste ■ . During pre-frac ■ ixing, fluid was pu ■ped fro ■ the outlet of a tank through the agitator and back into the tank. During fraccing the blender pu ■ ped fluids fro ■ the tanks into its agitator where sand was ■ ixed with the fluid before being pu ■ped to the three frac pu ■ ps.
CAT FRAC PUMPS
Once ■ ixed the hydrofrac fluids were fed into a bank of three Caterpillar These pu ■ps were connected in parallel fro■ the blender outlets by pu ■ps. low pressure rubber hoses. Each Cat frac pu ■p was powered by an 850 hp Vl2 The pu ■ps were triple piston "Triplex" positive Caterpillar Diesel. displace ■ent pu ■ ps.
CAT FRAC TO WELL HEAD EQUIPMENT
Each !rac pu■p was connected into a ■anifold with two high pressure steel The pipe syste■ fro■ the ■anifold to the well head was all high pipes. pressure steel piping. Along the pipe syste ■ were three different sensors which fed infor■ation about the flowrate, density and pressure of the fraccing fluid back to the control van. Flowrate was ■easured using an electro ■ agnetic flow ■eter reeding into a flow ■eter control syste■, then to the control van. The density of the fluid was ■easured using a Texas nuclear sensor operating on Caesiu ■ 137. Pressure was registered close to the well head by a Dynisco pressure transducer. All data was fed through a PACR frequency su■■ation box (4 inputs:1 outlet). The well head was equipped with a valve before feeding into the 5 1/2" inner dia■eter down hole casing.
ACTIVATOR PUMP
A s ■all hydraulically driven pu■p was used to add activator and breaker aid to the traccing fluid on the discharge side of the blender. A s ■all diesel driven hydraulic ■otor was provided to power the pu ■ p.
HYDRQFRAC CHEMICALS Much of the ti ■e involved in the hydrofrac process was consu ■ed in preparation. The hydrofrac fluids the■selves took the best part of a day to ■ ix and prepare.
51
FLUID SUPPLY DEFROTHER 0047 BACTERIACIDE M 76 SURFACE TENSION REDUCER F75 REDIFRAC J 154 BREAKER J 218 CROSSLINKER L 10
6 >< 70,000 ltr.
20/40 SANO
ACTIVATOR & BREAKER AID
PUMP
J 221 J 318
BLENDER
CAT FRAC
CAT FRAC
CAT FRAC
ELECTROMAGNETIC FLOWRATE SENSOR TEXAS NUCLEAR DENSITY SENSOR
JOOhp. PUMP 6 BARREL ACID SPEAR
DYNISCO PRESSURE TRANSDUCER
FIGURE 4 : SCHEMATIC DIAGRAM • SURFACE EQUIPMENT
10
Firstly the water was prepared in the six large tanks. This involved the addition of a detrother - 0047, a bacteriacide - M76, and a surface tension reducer F75. Once the water was considered suitable it was ■ ixed with a gelling agent, Dowell-Redifrac J154 at a rate of 40 lb/1000 U.S. gal. At the sue ti ■e a breaker J218 was added at 1 lb/1000 gals and a cross linker LlO at 1.2 lbs/1000 gals. The tanks were agitated to ■ ix in the· che ■ icals and a quantity of pink fluorescent paint was added as a ■arker. The fluid soon becue a gel-like consistency at which stage the agitation was stopped. The breaker is needed to break down the gel-like consistency of the fluids once in place in the fracture. During the hydrofrac process an activator and a breaker aid were added at the discharge side of the blender. The activator was a caustic solution J221, added at a rate of 10 gal/1000 gal of fluid. The activator raises the pH to around 9 - 10 at which level the cross linker LlO begins bonding the separate The breaker aid is J318, poly ■er chains in the linear fluid of the tank. added at 1 gal/1000 gals. The breaker aid is necessary as the breaker J218 only works well at te■peratures over 125 degrees F.
HYDRQFMC PROCEDURE The first stage of the fraccing process was to clear the perforated zone of the cased well. This involved pu ■ping 250 U.S. gal 15% HCL acid spear. It was during this process that the well head fractured, acid escaped and the Little of the acid was lost in the failure, progra■ was te ■porarily halted. allowing the progru to be restarted once the head flange was repaired. Stage one of the fraccing was the pu■ping of 5,000 U.S. gal of linear pre-pad fluid to initiate fractures in the coal (Table 2). This fluid was to re■ain at the head of all following fluid, hence propagating the fractures. All fraccing fluids were pu ■ped at 30 barrels/■ in (4,769 li tres/■ in) with a ■axi ■u ■ allowable pressure of 2000 psi (13.78 MPa).
11
TABLI 2 -
PUMPING SCHEDULE
Fluid
Slurry
Fluid
Volu ■e
Volu ■e
Type
(Gal)
(Gal)
250
250
15% HCL
Clear perforations
5 000
5 000
Linear
Pre-pad
39 000
39 000
Cross-Linked
Pad
6 000
6 272
Cross-Linked
1 pound sand per gallon
10 000
10 906
Cross-Linked
2 pounds sand per gallon
15 000
17 039
Cross-Linked
3 pounds sand per gallon
10 000
11 812
Cross-Linked
4 pounds sand per gallon
Co■■ent
Proposed pu■p rate 30 BBL/■ in. down casing A cross-linked pad fluid of 39,000 gals followed the pre-pad. Being crossFollowing the pad fluid the linked the pad fluid was far ■ore viscous. pu ■ping schedule set down increasing densities of sand/fluid ■ ixtures. There were four levels starting at 1 pound/gal, up to 4 pounds/gal. The sand chosen needed to be well rounded, fine grained and consistently sized. During the later stages of the fraccing process the density of the slurry was increased fro■ 4 lbs/gal to 5 lbs/gal. This was ai ■ed at using as ■uch of the sand up as possible. It beca■e obvious that fluid levels were getting too low to support the usage of the re■aining sand at a rate of 4 lbs/gal. During the frac the pressure at the well head hovered around 850 to 950 psi but when the density of the slurry was increased to 5 lbs/gal a pressure spike was encountered juaping to 1500 psi. With further pu ■ping the pressure level showed no signa of decreasing, rather increasing with volu■e. The frac was halted at thia stage. The frac was planned to consu■e 80,000 gal (302,800 litres) of cross-linked fluid and 111,000 pounds (50.35 tonnes) of sand.
12
DISCUSSION OF RESULTS : The initial high pressure peak (1900 psi) prior to fraccing was probably due to the stress regi ■e and the high percentage of fines in the Ger ■an Creek Sea■. Fraccing proceeded at an average pressure of 900 psi. Horizontal fracture growth occurs when the pressure in the fracture exceeds the vertical stress. Where the vertical stress is the ■ ini ■u ■ principal stress, fractures will preferentially orient and propagate horizontally. Fracture in the trial appeared to have propagated horizontally, possibly with so ■e vertical co ■ponent along northeasterly trending cleat and joints. Mapping of develop■ent roads through the area downdip of the hydrofrac hole shows that the ■ain influence was offset in the direction of the principal coal cleat which trends at 040°. The hydrofrac hole produced vertical and horizontal fractures. The ■ ain ■ode of injection of sand and gel was along the contact between the soft brown ■ udstone and the harder grey ■udstone at the top of the sea■, This sandfilled horizon extends at least 125 ■ north-east fro■ the frac hole, with an approxi ■ ate width of 45 ■. The sand-filled fracture has generally been opened approxi ■ately 3 ■■, but is as thick as 20u. This ■ain sand horizon intersects a near vertical joint down which sand has been injected. In one exposure of this joint, the sand has been injected to a depth of 0.30 ■ fro ■ the roof down the joint. Gel has been injected down ■oat of the joint. North of this ■ain joint, a sand-filled fracture appears inter■ ittently at the base of the sea■, suggesting that this or another similar trending joint has translated the sand and gel to the floor of the sea.a. 12 ■ and 25 ■ to the south, two open fractures occur at the top of the sea■, Neither of these contained sand or gel. They both produced large a■ounts of gas and water, when initially ■ ined through, and were evidently opened by the hydrofrac process. One of these fractures continued down to the ■ id-sea■ shear zone.
An inspection ■ade along 304 ■aingate fro ■ 4 c/t to 10 c/t, after the frac, indicated that there was possibly greater water seepage than that prior to testing. Spongy, gelatinous ■aterial was found extruding fro■ the upper contact of the Geraan Creek Seu and northeasterly trending joints in the roof at 10 c/t + 40.0■ in 304 ■aingate (370■ fro ■ the hydrofrac hole), after the frac. A suple of this ■aterial was tested and found to be clay. More infor■ ation on the influence of the hydrofrac will be provided as 305 longwall retreats through the hydrofrac area. Two proble■ s which occurred during the hydrofrac were bursting of the weld on the well head flange and failure of the densi to■eter, which necessitated ■anual ■etering of sand flow. Delays caused by these proble ■ s resulted in so ■e deterioration of the frac fluid.
83
During the frac 83 600 gala of fluid were pu■ ped into the coal at an average About 82 400 lbs of sand were consu ■ed. flow rate of 30 barrels/■ in. A screen-out, the clogging of the Approxi ■ately 28 600 lbs of sand re■ained. fracture pathway by sand, occurred near the co ■pletion of the test. This probably occurred due to high sand take ( 5 lbs/gal) as the fluid levels rapidly dropped in the storage tanks.
POST-rue WELL DEVELOPMENT The frac hole was air-lift cleaned prior to installation of an electric The su ■p was cleaned out sub■ersible pu■p and surface ■onitoring equip■ent. to a depth of 242.7 ■. After air-lift cleaning of the hydrofrac hole, free outflow of ■ethane occurred. Well head valves and ■onitoring equip■ent were installed. Gas desorption pressure calculated by dewatering was 1450 kPa which is approxi ■ately equal to hydrostatic pressure. To date 25 290 litres of water have been pu■ped fro■ the frac hole. Maxi ■u ■ recorded gas outflow rate was 35 ■ 3 /hour. The flow rate has decreased as develop■ent ■ ining progressed past the hole.
CONCLUSIONS The hydrofrac trial was successfully co■pleted and a co ■■ercial size frac, both horizontal and vertical in orientation was obtained. Proble■ s can be avoided in future by reassessing well head flange design and by requesting a back up densito■eter for accurate sand discharge ■etering. The total water storage capacity of 90,000 gala, was not sufficient to allow full consu■ ption of sand at a controllable rate. The apparent high investigation.
per■eabil i ty
of the
Ger ■an
Creek
Sea■
requires further
Although test results to date fro ■ the hydrofrac trial are encouraging, considerably ■ore research work is required before vertical well degaseitication can be established as a feasible technique in the Ger■ an Creek area.
ACKNOWLEDGEMENT The authors thank the Shell Co■pany of Australia as ■anagers of the Capricorn Coal Develop■ents Joint Venture for per■ ission to publish this paper.
REFERENCES 1.
Houlsby, A.C., 1976 - Routine interpretation of the lugeon water test. Quarterlx Journal or Engineering Geology. Volu ■e 9, 303-313.
2.
United States Depart ■ent of the Interior, Bureau of Reclamation, 1968 Earth Manual (Denver, Colorado), 541-546.
65
DIRECTIONAL PERMEABILITY IN COAL
R. Koenig CSIRO Division of Geomechani cs, Mount Waverley, Vic.
INIRODUCTION The Rock Creek Methane from Multiple Coal Seams Completion Project conducted a series of multiple-well injection tests. The project is a cooperative effort of the Gas Research Instirute (Chicago, Illinois) and Taurus Exploration Incorporated (Birmingham, Alabama). An early objective of the project was to learn about the geologic, physical, mechanical, and hydrologic qualities of three main groups of coal seams underlying the Rock Creek research site. The purpose of the multiple-well tests was to investigate the degree of directional permeability that may result from the vertical system of fractures known as cleat, which naturally occurs in coal seams. The better developed face cleats conceivably could have higher permeability than the perpendicular butt cleats. This directional trend in permeability could influence the production of water and methane gas from wells completed in coal seams. Well field patterns designed for efficient gas recovery would depend on the orientation and degree of directional permeability. This paper describes the geologic setting at the test site, outlines the multiple-well testing program, and discusses the results of the tests. The three coal seams showed distinctly different behaviour, which correlates well with local geologic fearures that control cleating and jointing of the coal.
Rf.GIONAL AND SITE GEOLOGY The Rock Creek research site is in the Warrior Basin near Birmingham, Alabama, as Figure 1 shows. The site is in the broad. relatively flat Coalbwg Syncline, which strikes northeast along the Appalachian Structural Front 1be coal beds at the site dip about 15 m/km to the south. Gentle folds, normal faulting, mioor reverse faulting, and jointing are common features of the Warrior Basin. The Sequatchie Anticline, which strikes to the northeast, is the largest structural feature near the site. Numerous noltbwest-striking normal faults occur along the anticline. Maximum displacement of individual faults is on the order of 10 to 100 m. A survey of jointing at Rock Creek and vicinity revealed a major joint set striking N 65° W, which coincides with slip traces of slickensided surfaces found in the coring program (Camp and others, 1985). A secondary joint set striking N 45° E, parallel to the Sequatchie Anticline, also is apparent The coal-bearing strata of the Warrior Basin are in the Pottsville Formation of Lower Pennsylvanian age. They consist of sedimentary rocks, predominantly sandstones, shales, and siltstones. Underclay, coal, and marine fo.ml wnes comprise the smaller remainder of the Pottsville strata. The major coal groups (from oldest to youngest) are the Black Creek, Mary Lee, Pratt, and Cobb groups (Figure 2). Although these coal groups appear throughout most of the Warrior Basin, individual seams may split, join, thin, or pinch out within relatively short distances. The three target horizons at Rock Creek are the Pratt group at a depth of about 150 m, the Mary Lee/Blue Creek seams at about 320 m, and the Black Creek group at about 380 to 440 m. Cleats in seams of the Black Creek group are moderately well developed, with the face cleat trending to the northeast parallel to the Sequatcbie Anticline. The major set of joints trending to the northwest intercepts the Black Creek group. The Mary Lee coal seam has fair to excellent cleat development,
68
with the face cleat trending to the nonheast No evidence of structural deformation or jointing appears. The Blue Creek seam, in contrast, shows evidence of structural deformation both at the project site and at the nearby Oak Grove coal mine. This deformation appears as dipping fractures, zones of finely broken coal, or squeezing and rolling of the coal. 1be Blue Creek seam has poor cleat developmem. Cleats in seams of the Pratt group are well developed, with the face cleat trending to the northeast. None of the northwest trending strucniral features appear in the Pratt seams.
0 \
*
25km Normal FalAII RodlCtNIISil9
N
I Figure 1. Regional geologic structure of the southeastem Warrior Basin, Alabama.
INTERFERENCE TEST DESIGN AND PROCEDURES As Figure 3 shows, the test pattern for each of the target horizons has a production well ("P-") and three monitor wells ("M-"). Since the face cleat of the coal seams trends to the northeast in all three horizons, one of the monitor wells is to the nortbeast of the production well. A second monitor well in each horizon is about perpendicular to the face cleat direction. The monitor wells in the face cleat direction are fanher from the production wells in anticipation of greater permeability in that direction. A third monitor well in each horizon is at an intermediate direction and distance from the production well. Preliminary hydrologic tests in wells M-1-A, M-1-B, and M-1-C provided information to select appropriate spacings for the remaining wells. The Pratt group consists of five seams at depths of 145 to 170 m. The upper seams are A (0.76 m thick) and B (0.67 m thick). A sanmtone layer of 5.5-m thickness and significantly smaller permeability separates these two seams. Straddle packers isolated the Upper Pratt A seam in production well P-1-A and the monitor wells M-1-A, M-2-A, and M-3-A for the first test. The Upper Pratt A and B seams taken together comprised the test interval for the second test The Mary Lee group consists of two seams, the Mary Lee seam (0.46 m thick) and the Blue Creek seam (1.4 m thick), at a depth of about 320 m. The test interval for the third test was the Mary Lee and Blue Creek seams taken together.
67
Depth in Meters (Surface) O
Thompson Mill Seam
52
] Cobb Group
146
Pratt Group
320
Mary Lee Group
381
Black Creek Group 439
figure 2. General stratigraphic section of the Rock Creek project site.
Black Creek Group
M1C Pratt Grou p
/
Face Cleat N55°E ■
t
N
Initial well pattern 14
50m ► I
figure 3. Rock Creek interference test pattem lowest seam, Black The Black Creek group consists of five seams at depths of 380 to 440 m. Toe Creek H (0.67 m thick), was the interval for the founh test. ion well for each test. from a constant-head The delivery system was essentially a positive-displacement pump feeding water An elaborate delivery system injected water at a constant rate into the product
68
tank. A programmable data-logger automatically recorded the water level in each of the wells in the test panem The data collection schedule was logarithmic with the sample density decreasing from five points per second initially to two points per day after one week. The data collection system proved to have significant advantages. One person could manage both the systems for water injection and data collection during the tests, which each lasted at least one week. A personal computer received the test data from the logger for manipulation, reduction, and analysis. These automated procedures minimized the risk of human error in handling large volumes of data.
DATA ANALYSIS The following describes the data analysis for the test of the Mary Lee/Blue Creek interval as an example of the analysis procedure for all of the tests. Plots of the data for the production well (P-1-B) and the three monitor wells (M-1-B, M-2-B, and M-3-B) appear in Figures 4-7. Wellbore storage and skin (wellbore damage) influenced the water level responses in many cases. The analysis method of Agarwal and others (1970) applies to the data from the production well (P-1B). The wellbore storage effect appears as a straight line in early time on the log-log plot in Figure 4. The shape of the curve reveals the degree of wellbore damage, or skin This skin effect is equivalent to head loss in the wellbore from an imaginary, thin skin on the well face. In this case the skin is 20, which indicates significant wcllbore damage that can influence the response in the monitor wells.
100 - - - - - - . - - - - - - - - - ~ - - - - ,
10
E.
q 0.114 Vmin
Q.
<l
b
1
2.1 m
k llmd
skin 20
0.1 10
100
1000
10000
100000
Time, mln Figure 4. Mary Lee/Blue Creek interference test (P-1-B). 1lle exponential-integral type-curve method of analysis gave similar values of penneability for monitor wells M-1-B and M-2-B. No match with the exponential-integral type curve gave a similar value of permeability for monitor well M-3-B. Application of the method of Papadopulos (1965) to estimate directional permeability failed therefore. Additional investigation of the response in well M3-B suggested the influence of wellbore storage and damage at the production well and perhaps at the monitor well.
69
10-------------r 36.6 m
k 2.911141 4.9x1e-l •~• 1-
E
a: <l -+----+--+-------t o. 1 - + - - - - -.: •
• 100
1000
10000
100000
Time, mln
Figure 5. Mary Lee/Blue Creek interference test (M-1-B).
10----------------, r 48.8•
1+--
k 3.Jmd
·~t' 5.hle-3
E
a:
<l
0.1 1 - - - - - + - - - - - , t - - - - - - - 1
100
10000 1000 Time, rnln
100000
Figure 6. Mary Lee/Blue Creek interference test (M-2-B).
1be petroleum engineering literature has type-curve methods to treat wellbore storage and damage at the active well or at observation wells in an interference test. Jargon (1976), Chu and others (1980), and Tongpenyai and Raghavan (1981) have all developed such methods. Examples of type curves that apply to this situation appear in Figure 8. The larger the distance of the observation well from the active well, the smaller the influence on the head change from wellbore storage and damage. A deviation of the response from the exponential-integral solution. seen as a sharper rise in head change at early time, comes from the influence of wellbore storage and damage. All of the type curves merge
70
cycles. The method of Chu and others (1980) with the exponential-integral curve after 2 or 3 log M-3-B. In this case, the permeability value is gives a good fit to the test data for observation well wells. similar to the values from the other two observation
100
10 E a.
..
r
24.4 •
k
3.3md 6.W e-3
·~·
<I
1
0.1 ....___......,......,,._.....,a.T""l""'l~t--..,....,r-T"T"'l""l"lri 100000 10000 1000 100 Time, mln
-B). Figure 7. Mary Lee/Blue Creek interference test (M-3 IO
. 00002 ~-, ♦ c,,.,.
•
$,§PC
Z~ ♦ c 1 h
•!
IO
SIONL [II DIITA HU IIATIO OJI Dlll[NS IONL[S S TIii[ TO DUl[N
SOUA l'[O,lo ,,:
r Chu and others, 1980). Figure 8. Interference test analysis type curves (afte h test data to exponential-integral type curves to Personal computer software can automatically matc of developed such software based on the method give directional permeability. In-Siru Inc. has the main inputs for the software. Figure 9 shows Papadopulos (1965). Buildup-versus-time data are on the Black Creek H test In cases where the observati the application of this software to data from
71
wells were close enough to the active well to feel the influence of wellbore storage and damage, the automatic type-curve matching software was inapplicable. The method of Chu and others (1980) gave permeability values for input to a different version of the software that accepts the results of manual type-curve mMdwng to give directional penneability.
100
kaa.;
3.5md
"-• 1.5mcl
"meu
10
2.3mcl
Ratio 2.3:1 Oritntatioa N,-W
E
~ 2.btl"3
c£
<I
1
10
100
1000
10000
100000
Time, mln Figure 9. Automatic type-curve analysis of Black Creek H interference test.
mscuss10N Of THE RESULTS A summary of the results from the data analyses appears in Table 1. The directional permeability values are distinctly different in the four intervals tested. The Upper Pratt A seam is highly anisotropic. The Mary Lee/Blue Creek interval appears isotropic. The Black Creek H seam shows an intermediate degree of anisotropy with a different orientation. The Upper Pratt A and B interval gave no solution for directional permeability, probably because of a local heterogeneity of the coal. 1be heterogeneity appears as a value for permeability in well M-2-A that is 66% less than the values from M-1-A and M-3-A. All three permeability values should be nearly equal to give a valid result from the direc1iooal permeability analysis. Buildup contours for the intervals that gave directional permeability results appear in Figures 10-12. The orientation of the axis of major permeability roughly parallelled the face cleat direction of the coal seams in the Upper Pratt A and Mary Lee/Blue Creek intervals. To the contrary, the orientation of the axis of major permeability aligned with the butt cleat direction or the joint set direction in the Black Creek H seam. These variatiom in directional permeability seem to correlate with the geologic settings of the coal seams as described earlier. The face cleat development of the coal and the jointing that strucnual features imprint are two factors that can govern directional permeability. Prior to testing, conjectures about the outcome of the testing fell into two groups. Some said cleating would dominate the response, and the rest said jointing would dominate. Hydrologic testing of several widely distributed coal seams suggests a tendency of the axis of major permeability to align with the face cleat direction (Stoner, 1981). Coal mining experience in the Warrior Basin suggests that jointing associated with folding influences directional properties of coal seams (Malone, 1986).
72
Oriented coring of the coal in the three target seams supplemented information about cleat structure and orientation derived from mining experience at a nearby coal mine (Boyer and others, 1985). Face cleat directions from oriented core averaged N S7° E to N 69° E. This compares to an average of N 55° E from measurements of the Mary Lee/Blue Creek group at the USX Oak Grove mine. Butt cleat directions were approximately perpendicular to the face cleat directions. Table I. Rock Creek Interference Test Results (Observation Wells). SEAM Well PRATI A I M-1-A M-2-A M-3-A Directional PRATI A&B 1 M-1-A M-2-A M-3-A Directional ML/BC2 M-1-B M-2-B M-3-B Directional BLKCRK H2 M-1-C M-2-C M-3-C Directional
·~·
k (md)
(IMPa)
60 58 58
2.2E-3 2.8E-2 2.6E-2
74 27 84
2.9 3.3 3.3
1.9 2.0 2.9
kmaj (md)
kmin
240
~
(md)
kmean (md)
(IMPa)
14
S8
8.7E-3
No
Solution
Dir
Ratio
N53°E
17:1
1.SE-3 4.lE-3 2.8E-3
4.9E-3 5.2E-3 6.lE-3 3.3
3.0
3.15
5.8E-3
N44°E
1.1: 1
3.5
1.S
2.3
2.9E-3
N7oW
2.3:1
l.SE-3 2.2E-3 S.8E-3
1 Analysis with exponential-integral type curves. 2 Analysis with Chu and others (1980) type curves. A comparison of the interference test results to cleating and jointing appears in Table 2. The Upper Pratt A coal seam is highly anisotropic. The cleat system is well developed and jointing is absent. The axis of major permeability aligns with the face cleat of the coal. Toe different cleating and jointing of the Mary Lee seam and the Blue Creek seam appear to cause opposing directional effects that cancel each other. Similarly, the combination of moderately developed cleats and presence of jointing in the Black Creek H seam appears to cause a response that lies between what each might cause alone. Coal mining experience agrees with these observations (Boyer, 1986). Toe Pittsburgh coal seam in the Northern Appalachian Basin has well developed cleats. High flow rates of gas occur in horiz.ontal boreholes intercepting the face cleats. Much lower flow rates occur in boreholes parallelling the face cleats. In contrast. the Blue Creek seam at the Oak Grove mine in the Warrior Basin has poorly developed cleats. Approximately the same flow rate occurs in horizontal boreholes COOlpleted in any direction.
73
klNiOr =240 md
k.... =14 md k~= 58 md Direction= N53°E ~, =8.7x10...J MPa-
1
Ratio=17
Figure 10. Upper Pratt A interference test buildup contours.
•
M18 2.8m
kma;o, = 3.3 md kmmor = 3.0 md kmean = 3.15 md Direction= N44°E Cl>C, = 5.Sx 10-3 MPa-1 Ratio= 1.1
Figure 11. Mary L«JBlue Cm interference test buildup contours.
74
N7°W N
i M2C 4.15m
P1C kma;o, = 3. 5 md ~ =1.5 md kmean = 2. 3 md
Direction= N7° w ~, =2.9x10-.3 MPa- 1 Ratio= 2.3
Figure 12. Black Creek ff interference test buildup contours. Table 2. Anisotropy versus geologic fearures at Rock Creek site.
Pratt A
lnterbedded shale or sandstone Nooe
Pratt A&B
5.5 m
Mary Lee Blue Creek_
1.2 m
Black. Creek ff
Nooe
Seam
Deats Well developed NE Well developed NE Fair to excellent Poor
Moderate NE
Structural features Absent
Directional Permeability NE
Absent
No solution
Absent Present NW Present NW
NE
N
SUMMARY
An investigation of three coal intervals, isolated from each other by about 150 m of interbedded shales and sandstones, revealed directional permeability that varied from a ratio of 1:1 to 17:1. The differences in anisotropy correlated with the degree of cleat development and the intensity of jointing. The northeast trending face cleat of the Upper Pratt A seam corresponded to directional permeability with the axis of major permeability in the oortbeast direction. A nolthwest trending joint set seemed to balance the influence of face cleat to cause an isotropic response in the Mary Lee/Blue Creek group and to dominate the influence of face cleat in the Black. Creek ff seam to cause a moderately anisotropic response favouring the joint orientation.
A programmable data logger and personal computer software aided the collection, manipulation, and analysis of a large volume of data from the four interference tests. The data logger collected test data on a logarithmic schedule. Well-defined data plots resulted for manual matching or computer
75
matching with type curves appropriate for conditions at each test well Computer software, based type-curve matching methods, generated the directiooal permeability results.
on
ACKNQWJ BQGBMBNI
4-0729), in
The Gas Research Institute of OJicago (Coruract Nos. 5083-214-0847 and 5082-21 d here. cooperation with USX Corporation and Taurus Exploration, Inc., sponsored the work describe
RPPERENCBS storage Agarwal, R.G., Al-Hussainy, R., and Ramey, H.J., Jr., 1970 - An investigation of wellbore 279and skin effect in unsteady liquid flow, I: Analytical treattnent. Soc. Petr, En&e, J,. Sept.,
290.
Stubbs, Boyer, C.M., U, Briscoe, F.H., Camp, B.S., Dobscba, F.X., Malone, P.G., Militzer, M.R., and y P.B., 1985 - Rock Creek Methane from Multiple Coal Seams Completion Project-Quanerl , Report. Nov. 1984-Jan. 1985. GRI Contract No. 5083-214-0847, Gas Rescan:h Institute, Olicago 24-27. Boyer, C.M., n, ICF Lewin Energy Division: Personal communication (1986). from Camp, B.S., Briscoe, F.H., Malone, P.G., and Boyer, C.M., Il, 1985 - Rock Creek Methane GRI Multiple Coal Scams Completion Project--Special data package-Preliminary geologic report. Contract No. 5083-214-0847, Gas Research Institute, Chicago, May. ed Chu, W.C., Garcia-Rivera, J., and Ragbavan, W., 1980 - Analysis of interference test data influenc by wellbore storage and skin at the flowing well. J, Petrol Teclmol,. Jan., 171-178. nce Jargon, J.R., 1976 - Effect of wellbore storage and wellbore damage at the active well on interfere test analysis. J, Petrol, Technol,. Aug., 851-858. Malone, P.G., Geomet Inc.: Personal communication (1986). Sci. Papadopulos, I.S., 1965 - Nonsteady flow to a well in an infinite anisotropic aquifer. lot Assoc. • Hydrol., Symposium of Dubrovnik, 21-31. coal Stoner, J.D., 1981 - Horizontal anisotropy determined by pumping in two Powder River Basin aquifers, Montana. Groopd Water. Vol. 19, No. 1, 34. nce test Tongpenyai, Y., and Ragbavan, R., 1981 - The effect of wellbore storage and skin on interfere data. J, Petrol, Tr,chpol . Jan., 151-160. of Way, S.C., Bumb, AC., Koenig, R.A, McKee, C.R., and Reverand, J.M., 1987 - Review . hydrologic testing in coalbeds. Topical Report, GRI-87,0017, Gas Research Institute, Olicago
77
KBYNOTB ADDRESS
THB NBBD POil GAS DllAINAGB IN AUSTB.ALIAN UNDERGROUND 11INBS AND NBlf GAS DllAINAGB TBCBNOLOGIBS R.D. Lama Kembla Coal and Coke Pty. Ltd. , Wollongo ng, N. S. W.
'Ibe grcwth of the Australia n coal incilstry and Australia 's premier positial as the largest exporter of coal has been achieved basically ciJe to the develcpne nt Nevertheless, underground coal minmJ has maintaine d its of cpen cut mines. tamage lar9ely CU! to deYe.l.cpl ents in lmglell technolog y.
'Ibis, in tum, has
iqx:eed seYere ~ t s en undergrou nd envinnne ntal ccntrols such as dust, ventilati al and gas. U1dergroo nd mines qlerating at depths greater than 400m in New South Wales and 300m in t h e ~ Basin are expected to have higher gas Emissions W'lich canrx:>t
Specific gas emissians in 3 sane mines have already exceeded 4Cm /tame of coal mined and in sane of the 3 new leases, this value may exceed 6Cm /tame. Higher gas caitent of coal seams
be ccntrolle d by ccriventio oal ventilati al
systems.
3 mined is ~ ~ 2Cm /tame. lh'xEr these caxlition s, requireme nts of higher rates of deYe.l.cpl ent of main headings and gate roac'Hlys present problems of gassfn1 of intakes with intake air exceedinJ 0.25%.
Higher gas ccntent uooer geo.1.og1caJJy disturbed CCllditians, higher shears and 1c::,.,er strength of coals gives rise to t h e ~ of ootbursts of gas and coal. 0-Jer a a:,zen mines within Australia have experieoc ed this ~ and a m1rber of mines had to be claled because of these occurrenc es. Alnost 800 ootb.lrst occurrences
have been
reported in
New South
Wales and Q.Jeenslan d.
Th.is prd)l.em becanes nore severe \otel cart:xn dioxide is associate d with the coal sean. The soluticn of this problem, to date, requires pre-drain age of the
coal sec1nS prior to develCpt&'lt of headings. 'Ibe average extractic n rate for Australia n lcngwall operation s is 7,000 Lalgwall tames/da y. Peak values of 25,000 tames/da y have been reIX)rted. m1niDJ systems have the capacity to deliver quantitie s of this magnitude
78
qleratiCl'lal. criteria, such as envircment al control, can be satisfied. In gas-praeni nes, handlin1 of large quantities of gas is not feasible solely by dilutial ventilatial . Post drainage is virtually essential and, under certain circulatanc es, ~ of all the se5tlS affected by
prov.ided other
extractial may be required.
techrx>logy have been rapid and are ilx:reasingl y BR)lied in deeper Australian coal mines.
Develc:pnen ts
in gas
drainage
being
'Ibis keynote acxb:ess reviews the prcblems of gas in mines, the technologic al standards that have b e e n ~ so far and tlx:>Se W'lich are likely to be the coal Ininin;1, as a respoosible standards in future deep mining c:peratials. irrlust.Iy in Australia, is gearing to neet the p:rcdu'.:tivit y challeDJes of the last decade of this centuzy. M::lrea\.'er, it is also ad:rressing the envi.romen tal respoosibil ity to future generatials of this w:>rld by harnessing the energy IX)tential of gasses associated with coal W'lich, in the past, have been let out and wasted, and are envi.ramen tally danaginJ .
79
APPLICATION OF GASSINESS PREDICTION AND GAS DRAINAGE METHODS FOR HIGH PRODUCTION LONGWALL MINING SYSTEMS
L. Lunarzewski Lunagas Pty. Ltd. , The Junction, N. S. W.
INTRODUCTION The N.S.W. Coal Industry is currently producing more than 40% of mined coal from underground mines using mechanised longwall mining systems. A single longwall face recently produced an average of 6,000 t/day over its life span with a maximum production level of 26,000 t/day (McKensey - 1990). Insitu gas content of Australian coals can reach as high as 2Qm3 CH4/t d.a.f. When extracting very gassy seams, using the longwall system with total caving, the total quantity of gas released to the underground workings can be as high as 6,000 litres Cf4/s. To control this environment it is necessary to establish the local geological and gassy conditions as early as possible and preferably during the initial exploration phase. This data will then be used to predict the gas emission levels for development and longwall extraction in order to design the appropriate ventilation and associated gas drainage systems. ESTABLISHMENT OF GEOLOGICAL ANTI GASSY CONDITIONS
GEOLOGICAL FACTORS The geological conditions of the worked and adjacent seams have a considerable influence on methane flow into the underground workings. This flow is known as the gas make. Typical Australian conditions have their working coal seams operating in a reasonably level plane with all their developments driven within the seam. This results in a gas emission level proponional to the insitu gas content, mining, and flowrate conditions. Geological disturbances such as faults, dykes, gas-water pockets, and sudden changes in stratigraphy & strata propenies can, but not always, create unexpected changes in the methane flow into the underground workings. It is important to recognise and identify the existence of geological disturbances because, in many cases, a large difference in insitu gas content values have been measured on either side of a fault or in the vicinity of such geological disturbances (Cybulski, 1973 ). Figure 1 shows variations in insitu gas content in the vicinity of geological disturbances within Macquarie coal mining regions.
D- - - - - - - • FAULTS - - l .... 2, .•...... - ~ - ~ t - • • • • • - - - - - c--•-•-• • • • • •• - • 2.5 • 3.vm- - _ • • • • • • • • ~
I~
ATE 5.0
TAD.,GATE
•
3.5
LONGWALL 9
•
5 ·6
2500m x I 50 m
•
3.3 ? •0
•
3.5 •
Gas Content (m"3 CH4/t d.a.f. )
Fig. I Variations in insitu gas content in I.he vicinity of geological disturbances
80
A strong direct relationship exists between the gas emission rate and the geological factors in association with longwall extraction. The stratigraphic section above and below the worked seam is of great imponance when using longwall systems with total caving. However, the introduction of panial caving during longwall extraction would result in lower gas emission rates into the underground workings. A considerable proportion of methane entering the underground workings originates from surrounding coal seams and gas bearing sources. The number and positioJ1 of adjacent coal seams, and total coal thickness, is of vital significance. The quantity of gas, which is stored originally in the coaly material, can gradually desorb from the gas sources at a rate which depends upon the existing conditions in the adjacent strata. The underground activities, mainly longwall extraction, disturb the adjacent strata and consequently upsets the equilibrium of the gas sorbed. Relaxation and the resultant fracturing of the strata opens flow paths for the gas to migrate into the underground workings. Only desorbed gas can lead to horizontal and/or vertical migration into the mine workings. However, in non-coaly material the contribution of free gas depends substantially on gas bearing rock properties (mainly porosity), degree of strata relaxation, and existing differential pressure between insitu gas pressure and atmospheric mine air pressure. Relaxation of the roof and floor strata allows gas to flow from adjacent gas sources to the underground workings including goaf areas. Intensity of gas flow depends on the degree of strata relaxation and subsequently the type and strength of the rocks in the adjacent strata. For this reason accurate borehole logs, of coal seams and significant sandstone bodies, are essential for the application of any gassiness prediction method, or model of gas emission to the underground workings. A reasonably accurate prediction of gassiness can be made, using world wide methods, when mining in situations of reasonable homogeneous stratigraphy, provided sufficient geological and gassy data are made available. However, unpredicted and unexpected changes in the level of gassiness can occur when mining in areas of significant changes in geological conditions (Lunarzewski, 1988 ). A detailed knowledge of geological factors is the key point for the estimation of sudden gas-outs or increases in methane emission into the mine workings. It is proposed that geological strata modelling should be included as an integral pan of the methodology used in the prediction of overall gassiness (Lunarzewski, 1988). Such a model was designed and used to provide explanations for the unusual strata behaviour and unexpected high gas emission from sandstone layers and strata gas sources in relation to longwall mining at Pacific Colliery in the Macquarie coal mining region (Wood, 1988).
L SITU GAS CONTENT AND GASSY CONDITIONS.
An accurate value of the insitu gas content of worked and adjacent coal seams is of prime imponance for any gas prediction techniques. For unknown areas the Indirect Method of determining the insitu gas content is recommended in order to establish insitu gas pressure, sorption isotherms of the coal, and residual gas content. For comparison purposes the Direct ~ethod - Australian Standard (originally US Bureau of Mines method) can be applied, which involves the direct sampling of coal from a fresh coal face followed by the measurements of initial desorption, in the field and laboratory, as well as applying the appropriate crushing technique (Mahoney, 1989). For both methods, a minimum of two samples should be taken to give an average result which is representative of the coal seam tested and to insure against any sampling failures. Coal
81
properties of the coal seam and all samples tested should be established to determine ash , moisture, volalile matter, relmive density and coal rank. The latest investigations carried out in the Macquarie coal mining region, Australia, confirmed previous findings in Europe (Grebski, 1981 & Treskow, 1985) that the insitu gas content value can increase or decrease with depth. Fig. 2 shows the results achieved in Germany; and Fig. 3 show s the relationship between insitu gas content and depth established for a medium gassy mine in the Macquarie coal mining region , Australia. Therefore, for prediction purposes, insitu gas content values should be established individually for each coal seam and/or selected sections of the seam (Lunarzewski, 1990). The insitu gas content magnitude depends on coal properties, geology, and pressure-temperature conditions within the strata. 0
5
. • .
200
•
•0 0
•
-5
i l
41
-100
-
a
a
••
n
-600
C
rJl
-
I-5
.
c.
~,
-20 0
0
. •• •
•
~
-JOO •
1000 5
.t
l
•
j
••• l
CJ
J
•
i
a
· 800
.
~C C
0.
0"'
0
• 10• & -
7
9
11
1.5
13
25
3.5
Gas Content (m"3 CH4/t)
Gas Content (m"3 CH4/t)
Fig. 2 Treskow - West Germany
Fig. 3 Lunagas - Macquarie region, Australia
GASSINESS PREDICTION, The available techniques used for the prediction of gassiness during development drivage and longwall extraction have been established by research organisations world wide relevant to their own mining and geological conditions. Most of the methods adopt the same basic parameters, however the accuracy of the final results depends substantially on specific factors and coefficients established for local mining and geological conditions. The results of the comparative tests, using various methods, have shown that large errors are possible in all methods tested, within the range of -64% to + 105% (Dunmore, 1979). Figs. 4 & 5 show flow charts for development drivage and longwall extraction respectively, using a gassiness prediction method developed for Australian conditions. The various assumptions made in each of the prediction methods are analysed, together with a comprehensive study of the local mining and geological environment, to form a model which is adaptable to specific Australian conditions. Particular attention was directed towards the empirical relationship between gas emission and the factors listed below.
82
PILLAR GEOMETRY
HEADISG GEOMETRY
COAL FACE Ol:TPUT
ADVA~CE RATE
SD1BER OF MISERS
e
TIME DECAY COEFFICIENT
INSITU GAS COSTEST
RIB EMISSION
@
FACE EMISSIOS
COEFFICIENT
(CH4/11tha/m "l)
ISTAKE EMISSIOS
@
e
TOTAL GAS MAKE
(llun CH4/sec)
Fig. 4 Flow chart of development gassiness prediction
THICKSESS (Coal O■ IT)
THICKSESS (Coal O■ lr)
THICKSESS (Corrected )
LOSGWALL FACE LESGTH
DISTASCE FllOM WORKED SEAM
DIST Al'iCE FROM WORKED SEAM
DESORIAILE Gu COlllnl
Corrt<ltd luita G.. Co■ tt■ I or Frtt G.. Cakalatio■ s
DtsOIIAILE lulu G• CHtc■I
l ■sil ■
GAS EMlSSJOS FllOM WOIUD SE.AM
(';:;,.C1
\;;,;/
DEGREE OF GAS EMISSIOS
DEGREE OF GAS EMISSIOS
GAS EMISSION FROM ADJACENT SEAMS
GAS EMISSION FROM GAS BEARING STRATA
SPECTFIC GAS EMISSIO!"' (a•J CH4/l aiaff coal)
SPECmC GAS !MJSSIOS (a •3 CH4/t aiac<I cNI)
TOTAL GAS MAKE (litra CH4/wc)
MUN COAL FACE Ot:TPUT (1/Wftt A 11•1>
Fig. 5 Flow chart of longwall gassiness prediction - Lunagas method
@ (';':\CS \:;;;,/
83
DEVELOPMENT C1 -
rib emission co-efficient, {"unit" emission - litres/sec*m"2} (takes into account insitu gas content and flowrate conditions).
C2 -
time decay co-efficient
C3 -
face emission contribution, (mined coal gassiness).
C4 -
intake contribution, mine contamination and cutthrough leakages).
LONQWALL EXTRACTION.
Cs-6 - gas emission zone co-efficient, (contribution of adjacent coal seams & gas bearing strata
emission versus mining system and geological conditions). C1 -
face emission co-efficient
Cs -
coal output emission co-efficients, (empirical relationship between Specific Gas Emission, daily and long-term weekly coal production levels).
The co-efficients have been empirically developed for high production longwall systems used in Australia and are unique for local conditions, longwall face lengths of 100m to 200m, and output levels from individual longwall blocks. The correlation of gassiness prediction figures with actual gas emission is within 15%. As more data becomes available, the accuracy of the gassiness predictions are continually modified and up-dated. It seems that the assessment of all anomalous conditions existing within the zone of gas emission is impossible to be standardised. Only practical experience, including individual analysis of statistical results, can lead to the best possible gas emission prediction for the local environment. GAS DRAINAGE. In many cases the quantity of gas entering coal mine workings is so high that the available quantity of air is not sufficient to dilute the gas to acceptable levels. In such a situation, other methods in addition to the ventilation system should be planned and introduced during different phases of coal mining activities. The most effective additional method is the introduction of various GAS DRAINAGE techniques.The classification of gas drainage methods is based on the phase during which de-gassification is performed in relation to the coal extraction. Five basic methods are used: 1. 2.
3. 4. 5.
Pre-drainage by boreholes drilled from the surface Pre-drainage by in-seam headings Pre-drainage by horizontal holes drilled from development headings Post drainage of relaxed strata using inclined holes drilled into the overlying and underlying gas sources, and by vertical wells drilled from the surface Post drainage of old goafs or sealed areas
The term 'Pre-drainage' refers to a particular gas drainage technique. It deals with seam gas drainage from gas sources, before coal extraction, under conditions of their virgin gas content
84
and insitu pressure. The ability of the drainage system to capture gas in the pre-drainage phase depends substantially on the permeability of the coal measures and adjacent strata, their gas migration properties, and the provision of sufficient lead time. The term "Post-drainage" refers to another gas drainage technique which is concerned with the relaxed strata during and after coal extraction. In post-drainage methods, advantage is taken of the phenomenon of increased strata permeability, mainly coal, due to stress relaxation of the roof and floor rocks which occurs as a consequence of coal extraction. The term "Goaf drainage system" refers to an independent gas drainage technique spe_cialising in capturing a high percentage of gas from underground sealed goaf areas. In order to operate an efficient goaf drainage system, the goaf area must be effectively sealed and an equilibrium be maintained between gas desorption rate and quantity of gas captured. Very high coal production levels create high gas flows into the underground workings. Subsequent serious gas problems, including gas-outs, can only be successfully controlled if an adequate and flexible underground ventilation system is used in association with various gas drainage techniques. Figure 6 shows the logical and necessary steps required to design gas drainage systems for a colliery, taking into account the colliery's predicted gas emission level (Lunarzewski, 1988).
TOT AL ABSOLUTE GASSINESS PREDICTED
GAS DILUTED BY VENTILATION SYSTEM
GAS CAPTURED BY DRAINAGE SYSTEM
HEADINGS OR INSEAM HOLES
PRE DRAINAGE
SURFACE BOREHOLES
CROSS-MEASURE HOLES
POST DRAINAGE
SURFACE BOREHOLES
GOAF DRAINAGE
DRAINAGE FROM SEALED AREAS
Fig. 6 Steps required for designing gas drainage system
85
CONCLUSIONS An experimental investigation was carried out to determine changes of gas emission to the underground workings with particular respect to high production longwall mining in selected gassy mines in New South Wales. A strong direct relationship exist between the gas emission rate and the geological factors in association with longwall extraction. A detailed knowJedge of geological factors and geological strata modelling should be included as an integral part of the methodology used in the prediction of overall gassiness. An accurate value of insitu gas content of worked and adjacent seams is of prime importance for any gassiness prediction calculation. For the longwall conditions the insitu gas content value can increase or decrease with depth. A reasonably accurate prediction of the gassiness during development and longwall extraction can be made in situation of reasonably homogeneous stratigraphy, provided, the coefficients have been empirically developed for local mining and geological conditions. For very high longwall coal production levels, some combinations of ventilation and gas drainage systems are indispensable. For a colliery requiring gas control, requires an individually designed combination of underground ventilation networks and gas drainage systems to meet the needs and demands of each and every case.
ACKNOWLEDGEl\1ENTS The investigations relating to gassiness levels and insitu gas content testing, during drivage of development and longwall extraction at Macquarie and Illawara collieries, were carried out by Lunagas Proprietary Limited with the cooperation of The Broken Hill Proprietary Company Limited, F AI Mining Limited, Elcom Collieries Proprietary Limited and BHP Central Research Laboratories. The views expressed are those of the author and not necessarily those of the companies.
88
REFERENCES 1.
Cybulski, W; Kozlowski, B; Myszor, H; Sobala J. 1973 - Complex Classification of Coal Seams in Respect of Firedamp Hazard. Przeglad Gorniczy, Vol. 29, No. 7 - 8, p. 322 - 330 (Jui-Aug 1973) SMRE Translation 6423.
2.
Dunmore, R. 1979 - Towards a Method of Prediction of Firedamp Emission for British Coalmines. Second International Mine Ventilation Congress, Held in Reno, Nevada, 4 to 8 November 1979.
3.
Grebski, Z; Cias, Z; Lunarzewski, L. 1981 - Effectivity of Predrainage in Dependence on The Depth of Mining. /Cl - 5 Institute of Coal Mining Under The Condition of Natural Hazards, Rybnik Poland.
4.
McKenzey, B.R. 1990 - An Overview of Mechanised Longwalls in Australian Mines. 1990 lntern•ational Coal Engineering Conference, Sydney 19-21 June 1990, p. 159 - 163.
5.
Lunarzewski, L; Wood, J; Kerkhoff, G. 1988 - Unpredictable Gassiness Changes During Longwall Extraction. Fourth International Mine Ventilation Congress, Brisbane, Queensland, July 1988, p. 183 - 189.
6.
Lunarzewski, L; Mahoney, M; Wood, J. - Practical Implication of Insitu Gas Content Testing Methcxiology for Ventilation and Gas Drainage Systems Design. Submission for Gas in Australasian Coals Symposium 4 - 5 February, 1991.
7.
Mahoney, M.R. 1989 -The Rapid Estimation of The Total Gas Content of a Coal Seam. Central Research Laboratories Technical Note CRl./fN/1/89.
8.
Treskow, A. 1985 - The Relationships Between Gas Content and Geology in the Ruhr District Gluckauf, 1985 (23), 121, p. 1747 - 1755.
9.
Wood. J. 1987 - Structure Contours, Thickness Contours and, selected cross sections. B.H.P. Collieries Division, Internal Report, July (unpublished).
87
PRACTICAL IIIPLICATION OF IN SITU GAS CONTENT TESTING IIBTBOOOLOGY FOR VENTILATION AND GAS DRAINAGE SYSTBIIS DESIGN 3 2 1 L. Lunarzewski , M.R. Mahoney and J. Wood 1 Lunagas Pty. Ltd., The Junction, N. S. W. 2 BHP Research - Newcastle Laboratories, Shortland, N. S. W. 3 BHP Steel International Group- Collieries Division, Mt. Keira West, N.S.W. INiroCUCTIOO
Coal seams contain gas, principally methane arrl carbon dioxide, adsorbed on the surface of the coal arrl also carpressed in the pores arrl fissures (1). For safe un:iergrourrl coal mi..nin:J this gas nrust be reroc,ved frcm the mine either by the ventilation system or the gas drainage systems. An aa::urate value of the insitu gas content of the coal seams arrl adjacent strata is of prime irrportance for gas emission prediction techniques arrl for ventilation arrl drainage planning [ 2) . Methods for measuring the insitu gas content of a seam may be classified in two broad ways - direct methods arrl i..rrlirect methods. Direct measurement techniques (based on the US Bureau of Mines methcxi) are camonly errployed in Australia for determining the gas content of a coal seam, arrl are covered by a draft Australian stan:Jard. 'Ihis methcxi requires a sanple of coal to be obtained frcm the seam arrl allCMed to desorb the gas it contains. 'Ihe direct technique is experimentally silrple, however, the information it can provide is limited in a number of ways. Particularly i.np::>rtant is how arrl where the sarcple is collected, how the lost gas is calculated arrl how the gas desorption is performed, i.e. , is the gas desorbed until the coal is in equilibrium with 1 atin seam gas pressure or is all the gas renoved by desorbing against a vacuum ( 2] .
methods of determining the gas content of a seam rely on knowing in-situ gas pressure arrl the adsorption isothenn of the coal (2). 'Ihese methcds provide a rrore carplete description of how the gas content varies with the gas pressure tmdergrourrl but are coal of the experimentally rrore difficult. Nevertheless they are becaning rrore widely used internationally for characterising the gas content of a seam because of their usefulness in gas emission prediction nodels. Imirect
the
'Ihis paper examines in greater detail the direct methcxi in corranon use in Australia. It also discusses some carpramises that may be used to obtain data of practical use for ventilation arrl drainage planning without incurring excessive costs. DIRECT' ME:IHOC6 OF MFA5URING 'IHE INSI'IU GAS CDNTENT OF A Cl)AL SF.AM
Direct methods of measuring the insitu gas content of a coal seam rely on measuring the volume of gas released frcm a fresh sarcple of coal taken fran the seam. 'Ihis measurement is traditionally made in Australia by water displacement frcm an inverted measuring cyliroer arrl is a labour intensive prcx::::ess. 'Ihe liquid level in the cyliroer nust be manually recorded on a regular basis, arrl the equiµnent must be continually rronitored to guarantee that not all the water has been displaced frcm the cylirxier. 'Ihis methcx:i results in the coal desorbing until it is in equilibrium with awroxirnately 1 atrn pressure of seam gas arrl therefore does not provide any in::tication of the anount of gas still present in the
88
coal at 1 atrn partia l pressu re of seam gas. Some of this gas can be expecte d to be release d into the urrlergr ourxi mine environ ment since the ventila tion arrl drainag e systern. 5 keep the seam gas pressu re in the expose d areas below 1 atrn. 'Ihe direct techniq ue has a m.nnber of experim ental diffic ulties asscx:::iated. with the samplin g arrl measurement proced ure. Two are of rrajor concern Firstly , to obtain the sample the coal must be removed from the seam. rling Once exposed the coal is no longer in equilib ritnn with the surrour Some gas. seam ed gas arrl it imnedi ately cx::mnences to desorb the adsorb can t conten gas gas is therefo re lost before the measurement of the seam by ted estima be ccmnence. 'Ihis lost gas cannot be ~ but can tion desorp gas of extrap olation of the earlie st possib le measur ements rates. If there is a signifi cant delay in camnencing the measur ements of gas desorp ti on this introdu ces uncert ainty into the extrap olation . '!his problem is aggrav ated if only the expose d coal at the surfac e of a face i s sample d. More sopu.s ticated techniq ues for obtain ing coal sample s from behirrl. the face may need to be develop ed. Usually the effect of lost gas on the gas conten t measurements iss minimis ed by only selecti ng 11..IITp (plus 50 mm) coal sample s. '!his create associ ated with direct gas conten t major difficu lty secorrl the measur ernents . The prcx::ess of gas desorp tion by 11..IITp coal is very slow. Table 1 shows calcula ted times for coal partic les of differe nt diamet ers t o desorb 90% of the adsorbe d gas conten t (1). To reduce the impact of this slow desorp tion on the measurernent severa l approa ches are possib le; reduce the manpower the maasurernent prcx::edure arrl (1) autana te reduce the cost arrl inconv enience of a so arrl require ments measur enent. le size after ( 2) increas e the rate of desorp tion by reducin g the partic t the loss of withou done the sample has been collec ted. '!his must be any gas. collec tion of (3) use altern ate sarrplin g proced ures that allow the rapid gas loses keep to rapid be srna.lle r diamet er coal partic les. 'Ihis must to a minimum. Of these option s (1) arrl (2) have been succes sfully i.Irpl emented arrl option (3) is being examined in conjun ction with samplin g uooergrou.rrl behirrl the expose d face. SAMPLING FOR DIRECI' GAS CDN1'ENI' MFA5lJRlliENI'S t rneasurernents are 'Iwo major source s of coal sample s for direct gas conten
sarrple s frorn explor ation ooreco res arrl sample s collec ted from the J:xx:,m of miner during develop ment of new headin gs or other continu ous a operat ions. In ooth cases, the correc t design of equipm ent greatly sinpli fies proced ures (partic ularly urrlergr ourrl) arrl reduce s the quanti ty of lost gas by reducin g the time before measurernents can cornrnence. 'Ihe lost gas can be estima ted by extrap olation of gas desorp tion measurernents perform ed soon after freeing the coal frorn the seam. Camon ly the lost gas is determ ined by linearl y extrap olating to zerot time a graµ1 of the measur ed volume of gas desorb ed by the coal agains the square root of the time since the coal c:anrnenced desorb ing gas. Ha.vever, experie nce elsewh ere (1,2) has shown that the expone nt may vary to a betwee n 0.3 arrl 0.5. '!his uncert ainty in the expone nt leads gas. lost the of value corresp orrling uncert ainty in the extrap olated tteoc:e, minimi sing the time for gas losses is irrport ant in obtaini ng reliab le values of the gas conten t of a coal sanple . uncert ainty in the lost gas is furthe r in::reas ed by the difficu lty in When determ ining the instan t that the coal ccmnences desorb ing gas.
'1he
89
Table 1 Theoretical time re·quired for coal particles of different diameters to desorb 90% of the adsorbed methane (1]. Particle diameter (mm) . ·0.001 i : 0.010 I II 0.100 1.0 10 1000 I I
Desorption time ---·
4.6 s 10 min 13 hours 1 month 15 years
'
I
I I
: 1
150,000 years i
Table 2 Quantity of gas in typical rocks (1]. Gas volumes expressed at 298 Kand 101.3 kPa. Equilibrium gas pressure 2500 kPa.
' Coal 1 Porous sandstone Shale 1. Depends on coal properties
Free gas (m 3/t) 0.45 0.68 0.05
Adsorbed gas (m 3/t) 12 to 25 1
90
sanpling frc::m an exposed coal face then the time the coal sanple is cut by the continuous miner is a suitable initial time. However, to reduce the aJOOUilt of gas lost by the coal when it is in place in the face rni.nirq should have been prcceedi.n:;J during the previous two shifts without significant interruptions. When obtaining a sample from an exploration borehole, the time when the core has been raised halfway to the surface to be a suitable starting point. Obviously with the proved has difficulties in estimating the time when the coal starts to desorb gas arrl the uncertainty in the actual exponent, it is desirable to minimise between sanpli.rq arrl corrmenci.rq desorption interval time the i:ooasurenents. Well designed sanple containers that may be rapidly sealed are therefore essential. sanple containers have been constructed from quick coupling units normally used in harrlli.rq petroleum products. 'Ihese coupli.rqs use a cam ann to force a polished surface against a soft gasket. Containers constructed fran these couplings may be sealed in a matter of secorrls ccnpared with several minutes for conventional containers with bolted '!he containers can be prepared fran materials suitable for lids. un:iergrourrl use with an open:ID3' diameter up to 150 mm an:i have been pressure tested to 500 kPa gas pressure. '!he containers can therefore be used for collecti.rq lt.nnp coal sanples, an:i un:iergrourrl, considerably reduce the time between cutti.rq the coal sanple an:i carrmencing desorption rneasurenents. Because of the time required to recover a borecore the use of these containers has a small effect on the quantity of gas lost when retrieving a borecore sample. '!he other aspect of sampling that needs to be considered is ''WHAT SUB--SAMPI.E OF 'IliE SF.AM SHCOI.D BE SEI.ECI'ED FOR GAS CX:>N1'ENl' ANALYSIS?". '!his is particularly relevant in two situations; (1) sampling un:iergrourrl fran the boan of the continuous miner, when selected coal lurrps can be obtained, an:i (2) selecti.rq a sub-sample of an exploration borecore for crushing. In cross-section of the entire seam is available for a general laboratory gas desorption measurements. HCh/ever, since the core is valuable for the other infonnation it contains, usually only a small sub-section can be selected for crushing to release the gas m::>re quickly. '!his crushing step is necessary since it is usually not feasible to wait several ironths for the entire core to cx:mplete desorbing gas. Extensive experierx:::e ( 1 J has shown that the vast majority of seam gas is adsorbed on the organic cx:xrponents of the coal. Very little seam gas is present in the inorganic material. Table 2 gives sane typical values. '!he estimate of the gas content of a seam rrust therefore concentrate on the organic coal material in the seam. '!his was investigated further by a preliminary stlrly of the desorption of nethane by a coal sample an:i a carbonaceous shale sanple collected fran an adjacent position. '!he two sanples we.re equilibrated with methane am the gas content detennined. When expressed on a dry ash free basis the two samples had similar gas contents (within 20%). With the data currently available, selection of sanples should concentrate an sub-sections of the seam cxmtaining principally organic coal matter since for a given sanple mass this will give the maxinum total volurre of released gas. '!he results should then be expressed on a dry ash free basis. However, further research is required to fully define any differerres that may exist between the gas sorption • capacity of different carbonaceous sed:inents. lcx:ation of the coal sanple within the seam may also be significant. If the seam is divided by an iltpmneable rock layer then sanples for gas content analysis need to be taken frcm eadl side of the ilrpenooable
'!he
91
layer. However, if the seam is relatively thin and harogeneous then a small Sllb-san'ple may represent the whole seam. I.AOORA'IORY MFA5UREMENI' OF DESORBED GA.S After sanpli..rg and initial measurements made on site to estimate the lost gas, the sanple is taken to the laboratory for lon:Jer term desorption measurements. 'Ihe diffia.ll.ty in perfonning these measurements is that the rate of gas desorption can vary over a wide rarqe. Gas flows 05 interest can rarqe from several litres in a few minutes to 10 an per day. Further, the measurement of the quantity of gas desorbed must be performed without causi..rg a significant back pressure that may affect the desorption of gas fran the coal. 'Ihis severely limits the rarqe of techniques that may be used for gas content measurements. 'Ihe sirrplest measurement technique is by collecti..rg the gas by water displacemen t fran an inverted cylirrler. As noted previously this is a consistent with the draft Techniques, intensive prcx::ess. labour Australian starrlard, have therefore been developed to autanate the measurement procedure [ 3 J . Figure 1 shows the equipnent developed and currently bei..rg evaluated. It consists of two interconnec ted chambers that water may flow between. 'Ihe coal sanple desorbi.n] gas is connected to the inlet of the gas chamber. 'Ihe gas desorbed by the sanple forces water into the float chamber where the position of the float is continually rronitored usi..rg a proximity sensor. When the float reaches the limit of the sensor's measurement rarqe the inlet valve is close::i, the position of the float recorded and the exhaust valve opened. Gas flows out of the gas chamber and the float descerxls. When the float reaches the other limit of the sensor's measuri.n] rarqe the exhaust is close::i, the float position recorded and the inlet valve opened. 'Ihe cycle then continues. 'Ihe maxinn.nn back pressure developed in the system is 14 Ittn of water. 'Ihe autanated procedure can be evaluated by connecti.n] the exhaust from the equipnent to the inlet of a traditional inverted cylirrler (Figure 2). Because of the srna.11 pressure head in the system care nust be taken to control the pressure at the inlet to the cylirrler. Figure 3 shows a canparison of the results fran the automated equipnent with manual measurements in such a serial experiment. Alternative ly the equipnent can be evaluated by measuri.n] the gas content of two coal sanples collected at the same place and time. one saq>le is measured usi.n:J the autanated equipnent and the other sanple measured manually usi.n] an inverted cylirrler in a parallel experiment (Table 3). Both types of experiments gcxxi agreement between the automated measurement and the shown results are for a si.n]le carp1ter 'Ihese technique. traditional c:ontrolli.n] one tank. F.quipnent is currently bei.n] evaluated where a si.n]le c::arp.1ter can control multiple tanks. Both the automated equipnent and the inverted glass cylirrler technique result in the desorption measurement terminati.n] when the coal has equilibrate d with an approxilrate ly 1 atrn partial pressure of seam gas. 'Ihe autanated equipnent significant ly reduces the manpower requirement s for the measurement and provides a continuous rronitori..rg of the outp.lt fran the sanple. It also produces the data in a form readily suitable for further data manip..tlation by a catp.1ter. Once the autanated equipnent has been proved in the field it shoold make a significant contributio n to si.Irplifyi.n] direct gas content measurements. Other factors which should be considered in the design of laboratory equipnent for ireasuri.n] gas desorption by coal include corrections for
92
:---------! I
'
Temperature And
~
Comput er
1- _________ Pressure Sensors
-----
''
'
Proximity Sensor Vent Gas Chambe r
Float Chambe r Float
Gas Exhaust .-AcidLfied Water
X
Solenoid Valves
Figure1 Equipment for the automatic measurement of gas desorbed by a coal sample.
Proxrrnny S.n10r
Qu ,n . .
--
Figure 2 Serial experiment for testing the automated equipment.
93
a..
I/J)
jij
1000
E
a,
E :, 0 > a, >
-~ 'S
500
E :,
u
4
2
0
Elapsed time / days Automated measurement
+
Manual measurement
Figure 3 Comparison of results from manual and automated measurements of the gas desorbed by a coal in a serial experiment.
Table 3 Gas content of coal samples measured in parrallel experiments. I Sample I Automated measurement Manual measurement ' J ml/g(daf) , ml/g(daf) 5.0 2
1.2
5.4 1.1
94
ant>ient pressure arrl tenperature charges. 'Ihe si.Irplest system is to correct for the expansion of gas in the connectin:J lines, free space in the sanple container arrl in the gas collection dlant:ler. 'Ibis correction is depen:lent on the equiµnent design arrl shcw.d be carefully considered in each case. It is suggested that the results be corrected to a tercperature arrl pressure typical of the con::ti.tions urrler which the coal is desorbin:J gas. It is suggested that 20°c arrl 1 atm are suitable reference corrlitions. Dissolution of the gas bein:J collected in the water is also a potential problem. Researd1 is continu.i.n;J to firrl a liquid that does J'X)t dissolve significant annmts of methane or carbon dioxide. RIDJCING TI-fE TIME RmJIREl) FOR DIRECT GA.5 CX>NI'ENl' MFA5UREMENI'S
Once the rate of gas desorption of the coal has sla.ved to a negligible level over a pericxi of about one hour, the sanple container may be opened arrl a sub-sanple of · coal renoved. Usually this can be achieved in less than a week after the coal was collected. 'Ihe sub-sanple can be selected usin:J the principles described earlier. 'Ihe sub-sarrple can be transferred to a gas tight crushin:J mill an:i then crushed to a fine particle size to increase the rate of gas desorption. 'lwo mills have been successfull y errployed for this 'Nerk: (1) Ball/rcxi mill. 'Ibis mill can harrlle relatively large sarrple masses (1 to 2 kg). l-Ic1,,Jever even when IOOdified to continuousl y rerrove fines from the lunp the mill is relatively inefficient in crushin:J the sanple. (2) Siebtechnik mill. 'Ibis mill uses smaller sanple masses (150 to 300 g) but crushes the coal :rrore efficient arrl is nuch easier to use. • 'Ihe two mills give the same result (within 10%) when used to crush two sub-sanples of the same coal sanple. After crushin:J the majority of the coal (>95%) is reduced to minus 0.250nm an:i the remai.ni.n;J gas is desorbed within one hour. cn:e again the desorption is cx:rapleted when the coal has equilibrate d with ar:proximate ly 1 atm partial pressure of seam gas. '!he actual partial pressure deperos on the volume of gas released compared to the original volume of the container. Within experimenta l arrl sarnplin:J uncertainty (aoout 10%) experiments have shc:,..m that crushi..n;J a coal sanple after only a short desorption pericxi gives the same total gas content as was ootained by lettin:J the sanple desorb gas for an exten::ied pericxi before crushin:J (Table 4) . '!he gas content of the coal can be reliably arrl rapidly determined by this crushin:J tedmique. of coal in a gas tight mill is feasible on a coal sanple to 2000g arrl greatly reduces the time that is required for 150 of mass on of the gas content of a coal seam. '!he major detenninati direct the revolve aroun:i ensurin:J leaks do not technique the in s difficultie the gas to CXXJl to ambient all01Nin:J arrl crushin:J durin:J develop tenperature before measurin:J the volume of gas released. 'Ihe crushi..n;J generally heats the container arrl gas arrl so time Jtl.lSt be alla.ved for the gas to return to ambient corrlitions.
'Ihe
crushin:J
ClJNCWSIONS 1.
'Ihe direct method of d e ~ the insitu gas content of a coal seam
has limitations associated with sanple collection difficultie s, accuracy and the time required for perform.in:;J the measurements. Sare methcxis of minimisin:J the effects of these limitations have been discusserl in this paper. 2. Autanated equipnent for the lalx>ratory measureren t of the gas desorbed by coal sanples has been designa:i am is urxiergoin:J evaluation. '!be awaratus sinplifies the measurement am reduces manp::,wer requirement s.
95
3. c:rushi..rq of the coal sanple reduces the time taken for the direct determination of the insitu gas content of a coal seam. 4 • 'Ihe selection of a coal sanple for direct gas content measurements should be made with careful consideration for the stratigraphy and geological properties of the coal seams and adjacent strata. Selection of sub-sanples of this coal for crushirq should also consider these factors. 5. further research is necessary to fully define the gas desorption properties of carbonaceous sediments and their e ffect on insitu gas content testirq and the practical i.rrplernentation of the results in colliery operations 6. Coal sarrple collection problems and some principles for the practical of final insitu gas content data should be further determination developed and adjusted to Australian mining and geological corrlitions. the equiprent required for direct insitu gas content Because 7. measurements is relatively sint:>le, the direct rrethod will continue to be used mainly for determini..rq the relative c:han;Jes in gassy corrlitions as mining operations rrove into new areas. 8. 'Ihe direct rrethod cannot provide a full description of coal behaviour towards seam gas. A better un::ierstan::ti.ng of coal ~as properties can be achieved if the sorption isothenn and insitu gas pressure is determined within the seam. 'Ihis is the in:lirect rrethod of insitu gas content determination. REFERENCES
Boxho, J., et al, 1980 - Firedamp Drainage. Verlag Gluckauf GmbH, F..ssen. 1978 - Methane Prediction In Coal Mines. Report rn.unber ( 2] C\lrl, S.J., I CTIS/ 'IR 04 December 1978. I.Drrlon, IEA Coal Research. (3] Mahoney, M.R., Gordon, P., and I.unarzewski, L., 1990 - 'Ihe Autanatic Measurement Of 'Ihe Gas Desorbed By A Coal Sample. Proceedings Southern and Western Coalfields of the sydney Basin Workshop, Wollongong 1990. (l ]
Table 4 The total gas content of duplicate coal samples crushed after different periods of desorption. Coal 1
Coal 2
Desorption period / days
12
143
27
98
Total gas content / m3/t(daf)I
4.3
4.1
11.7
11.5 ,
Difference
5%
2%
Coal 3 8
147
15.0
13.4
11%
97
APPIN COLLIERY LONGlfALL 18 -
CROSS MEASURE BORE DEFORMATION
P. I. Maddocks BHP Steel International Group -
Collieries Division, Mt. Keira West, N.S.W.
INTRODUCTION BHP Collieries Division is conducting research into the mechanisms and sources of intermittent gas flows into longwall extraction panels and into methods to improve the efficiency of gas capture. Considerable time is lost due to high gas emission on longwall faces in Australia's deep gassy mines. On the Southern Coalfield of NSW, the source of gas causing many gas outs is the seams underlying the working seam. Extraction of a longwall typically involves approximately 600 m of cross measure drilling per 50 m of longwall to drain the underlying seams. Gas flows from cross measure holes typically vary dramatically from very low volumes (<30 Vs) to high volumes (>500 Vs). To reduce the number of gas outs on longwall faces, gas capture efficiency including that from cross measure boreholes, must be improved. This paper summarises the results of one aspect of the investigations conducted to date at one of the Collieries involved in the project. Although the research is in its early days, BHP believes it is of benefit to the Coal Industry in general to communicate early promising results and to stimulate discussion of the hypothesis for gas emission. Appin Colliery is located in the Southern Coalfield of NSW 45 km north west of Wollongong. Extraction is in the Bulli seam, the uppermost seam in the Illawarra Coal Measures. The Bulli seam at Appin is considered to be a "gassy" seam by world standards. Gas content is around 15 m3/tonne. An extensive methane drainage system has developed that is now an integral part of colliery operations (Watson, 1990). Gas drainage can be categorised based on whether the gas is captured ahead of the mine development or following extraction. Gas from the Bulli seam is successfully controlled by pre-drainage. Gas in underlying strata is released mainly by longwall extraction. It poses a problem in that given the current level of technology, it is difficult to drain ahead of the face. Gas is drained from beneath the longwall blocks. Drainage of gas in underlying strata is achieved by boring holes angled beneath the longwall blocks. They are grouped in sets of five or six holes drilled in a fan pattern from each pillar centre in the return heading. Below Longwall 18 holes have been drilled with declinations of 15°, 20° and 24°. Azimuths range at intervals between 294° and 347°. Gas production commences after the longwall face passes each site. The majority of hole sets below Longwall 18 give flows of between I 00 I/sec to 150 I/sec. Similar flows have been observed on previous walls. Occasional sets produce flows in excess of 500 Vsec. Studies of individual hole performance (Williams, 1990), supported by reports from colliery officials, show that it is generally a single hole in such sets which is producing the high flow. High flowing inbye sets which have stopped producing sometimes reactivate when high flowing sets start producing at the longwall face.
98
High flowing holes have been regarded as exceptional occurrences and randomly distributed. If the locations of these bores could be predicted and the mechanism of gas release understood the benefit to the drainage operation would be obvious. In a preliminary investigation of Longwall 18 cross measure bores (Maddocks, 1990) it was hypothesised that low gas flows were caused by floor movement behind the longwall truncating the bores. To determine if this was the case a limited number of bores were probed with a string of joined lengths of electrical conduit. It was found that most bores were closed at about 50 m down the hole. Closure points in the bores appeared also to define a pattern which ran from hole set to hole set. These findings were unexpected and encouraging to the point that the study was expanded to cover all cross measure bores drilled below Longwall 18. PROJECTAIM Gas delays on Longwall 18 totalled 21 days . The research project aim is to reduce delays on future longwalls. Increasing the amount of gas captured in cross measure bores will further this aim. To achieve this we must know where the gas is coming from and understand the mechanism of release into the bores. The highest flowing boreholes are open to the Wongawilli seam. Nearly all boreholes are open to the Balgownie seam. When a high flowing bore is probed with electrical conduit the gas flow is observed from the Wongawilli Horizon. The rate of flow can be in excess of 500 I/sec. A bore open to the Balgownie seam usually has a flow rate of between 10 I/sec and 50 I/sec. This study focussed upon the mechanism of gas release from coal seams beneath Longwall 18. The aim was to: (i) (ii)
(iii) (iv) (v)
Probe every borehole drilled below the block, Measure declination at which the hole was drilled, Determine if bore closures define a fracture pattern, Determine if bore closure can be related to gas flow, and Develop a model which can be used to improve the flow from cross measures bores.
ME1JiOO All cross measure bores are drilled to the base of the Wongawilli seam , drilling conditions permitting. The base of the Wongawilli seam is about 40 m vertically below the Bulli seam and so most bores are initially 100 m to 120 m long. After the longwall had passed, the open length of the bore was measured with joined lengths of 16 mm electrical conduit. Bore declination was measured on the stand-pipe.
OBSERVATIONS AND RESULTS 126 cross measure bores were probed to determine the length of undisturbed hole after the longwall face had passed each site. 14 remained open to the top of the Wongawilli seam 27 m below the Bulli seam. Only 2 bores remained open to the base of the Wongawilli seam. The hole sets of which these two bores are members, produced flows in excess of 500 I/sec. Relationship between Declination and Azimuth and Qosure Declination and Closure Closure is the point at which the borehole is closed to the passage of 16 mm diameter electrical conduit. Declination is a measure of the borehole dip in the vertical plane. Declination angle is compared with vertical depth to the closure (v) rather than the open length of the bore. It has been found that as the declination angle is increased, v also increases but the increase is small. On average a hole drilled at 24° is only 5 m deeper than a 15° hole. 60% of boreholes are closed less than 16 m below the Bulli seam. Nearly half of the bores are closed between 12 m and 14 mat the Balgownie seam.
99
Azimuth and Closure To determine if one drilling direction is better than another bore azimuth in relation to closure points was examined. The distance from the bore closure to the rib line (h) was measured for 126 bores. The average of h at each drilling azimuth is shown on Figure 1, also the average h for those bores closed at the Balgownie seam. Distributions are similar. Bores drilled at 324° on average extend f unher beneath the longwall block. This direction is near perpendicular to the rib-line. As the drilling azimuth is stepped in either direction away from 324° bores close progressively closer to the rib-line. The distributions shown on Figure I indicate the best drilling direction. Holes drilled with azimuths of 324° show the largest average distance to closure. But because most holes close at the Balgownie seam there is little advantage in drilling all holes at this azimuth. Any gain is outweighed by the practicalities of drilling a fan pattern.
Bore Closure Figure 2 shows bore closure points below the Bulli seam along Longwall 18. The points define a line which appears consistently about 16 m below the floor. A second poorly defined line lies 10 m to 15 m beneath this. Mid-way along the longwall block the closure points can be correlated with a cored bore hole. Closures occurring about 15 m below the Bulli seam floor coincide with the coalesced Balgownie/Cape Hom seams. At 28 m closures lie at the top of the Wongawilli Coal. Failure in the bores reflects floor stratigraphy. Closures most commonly occur at a coal seam. Nearly 40% of closures fall within the Balgownie to Cape Horn interval. Closure in the cross measure bores is not due simply to the collapse of the coal intersections. if this were happening either all bores would stop at the first seam or closures would be randomly distributed between all seams. Closures can be correlated from bore to bore horizontally, they also define a pattern. Together, these observations can be better explained by bedding plane shear. On Figure 1 the uniform decrease in h can be explained in terms of hole geometry and horizontal movement The shape of an angled bore on a bedding plane is elliptical. If sufficient movement occurs across the plane (the lower bed moves relative to the upper bed) the bore will obviously close. But if movement is in the same direction as the bore azimuth then there must be more movement to close the bore than if it were moved from side to side. This information is significant. Bore closures record the direction of the last bedding shear, i.e. perpendicular to the rib-line at 324°. This is most probably the principal direction of shearing below the longwall. Figure 3 represents a hypothetical section through strata underlying the Bulli seam behind the longwall. As the longwall advances vertical stress is redistributed over the pillars. The floor beneath the goaf heaves during unloading. Less competent bedding interfaces shear as beds move in response to upward arching of the floor strata. Strata movement decreases with depth below the extracted horizon. Heave is greatest away from the confinement of the ribs and face. As a bed lifts there is some extension in length to compensate for curvature. Extension parallel to the longwall face, but decreasing with depth will produce bedding separation. Any such separation will be continuous laterally beneath the goaf providing a potential gas conduit between any bores that intersect it. Figure 3 summarises the mechanisms involved in floor heave. It shows the relative bed extension per unit length which produces shear at bedding interfaces. Alternatively if extension
100
were· accommodated by vertical fracturing, fractures would form parallel to the maingate rib with associated vertical dislocation. Such fractures are not encountered in cross measure bores, but if present a continuous venical conduit to gas from underlying seams would exist. High flows would be expected in any bores that intersect the fracture. It is expected that most bores would be in a position to intersect a continuous fracture below the maingate rib and give high flows. This does not occur. The confining stress below the pillar on Figure 3 can equally be representative of loading at the longwall face. Flexure on individual beds occurs where uplift exceeds the confining stress. If a plane (A-Al Figure 3) is drawn through this region and taken as the boundary to the relaxed volume below the goaf then it can be seen that the boundary extends out from the longwall with depth below the pillar. This provides the potential for interconnection between relaxed zones below successive longwalls. A relaxed zone extending beneath the gateroad pillar centreline is supponed by bore closures measured to within 20 m of the hole collar. The terminus of each cross measure bore is at a dislocation postulated as a bedding plane shear. If the end point of each bore is considered as a discrete data point, successive points align extending from the maingate rib in the direction of longwall extraction (Figure 4).
Cyclic Pattern The alignment of closures exhibits a pattern which is repeated on a frequency of about 40 m (primary cycle). If the baseline for each cycle is in the vicinity of the Maingate rib, each cycle has an amplitude of 30 m to 35 m. If amplitude is considered relative to that of the subsequent cycle a direct relationship exists between amplitude and longwall face gas outs. Prior to each gas out the amplitude of the closure cycle increases by more than 10 m relative to the adjacent cycles. This pattern is repeated down the longwall block face at gas-outs, but the frequency of this secondary pattern appears to be variable.
Figure 4 shows the pattern of bore closures at cut-throughs 8, 9 and 10 which is repeated the length of the longwall block. Sections A-A to C-C illustrate the contraction of the strained volume away from the gateroad as tracked by closure points 1 to 4. For each bore the open length above the closure is unstrained. On sections A-A to C-C this length progressively increases probably reflecting stress accumulation in the unstrained section. On section D-D the strained volume is larger indicating stress relief. The strained volume below the longwall reflects the effect of stress relief in the underlying strata as the face advances. As the longwall face proceeds, the floor accumulates stress to the point of failure (strain) at which time it heaves with resulting bedding plane shear. This is generally at the least coherent bedding interfaces such as at coal. Closure in most bores occurs at the Balgownie seam. If for whatever reason the sequence does not fail, perhaps due to more competent regions in the sequence or a change in Bulli seam extraction, boreholes remain open to greater depth. Where strain has not occurred stress accumulates. Mechanism of Failure The cyclic pattern of bore closure (Figure 4) reflects stress relief below the longwall. The aligned closure points define an interface between stress accumulation and stress relief (strain). In the floor this operates as a continuous mechanism of stress build up followed by failure as the longwall face advances. As closure points in each cycle move away from the rib-line the effective straining decreases. The next cycle commences as the closure point returns to the baseline, from A to B on Figure 4a. For the cyclic pattern of dislocations there must be an increase in stress along the dislocation interface as it extends from the rib line. At the point that a cycle achieves the maximum distance from the rib line and then recommences a strain volume is juxtaposed with a
101
stressed volume. In this region to accommodate the strain the floor must heave in two directions, parallel and perpendicular to the face line. This occurs over an advance distance of only several metres. It is likely that here, at the end of a cycle, vertical fracturing occurs. Because the base line for the primary cyclic break is near the Balgownie seam little free gas is released into venical fractures and gas outs do not occur. During gas-outs the strained volume has contracted to the Wongawilli horizon, secondary cycle (Figure 4e). The bore remains open and is a high producer of gas. As the face advances and the cyclic break is reinitiated, stress is relieved from this horizon C-D Figure 4) vertically through the sequence and allows the migration of large volumes of free gas to the face resulting in a gas out.
CONCLUSIONS Gas delays on Longwall 18 caused 21 days lost production. Delay duration ranged from 10 minutes to several days. There are a number of reasons for the short delays but a major "push" appears to be caused by gas originating at the Wongawilli Coal. This study has shown that of the cross measure bores drilled below Longwall 18 few remain open to the Wongawilli Coal. Bores are closed at strata susceptible to bedding plane shear, primarily coal seams. As the longwall advances a strained volume forms in the floor at the Wongawilli Coal horizon. Here gas desorbs from the coal into laterally continuous partings controlled by bedding separation. Because most bores are truncated in the overlying strata this free gas reservoir remains undrained. To reduce delays from Wongawilli gas, bores must be modified so that they remain open after the longwall passes. Cross measure bores have been drilled at most practical azimuths and declinations since post drainage was introduced at Appin Colliery. Unfortunately the pattern of face gas outs is the same on Longwall 18 as it was on Longwall 9. Measurements on 126 bores drilled below Longwall 18 indicate no real improvement in gas capture can be made by changing bore declination or azimuth. A different approach must be taken. A bore can be held open with casing. For the cross measure bores casing strength must withstand bedding plane shear. A trial of two fully cased holes was completed on Longwall 20. The bores were cased with scrap BQ drill rods to the upper part of the Wongawilli Coal. The bonom 40 m of rods were slotted to allow gas in. Flow from each of these bores was in excess of 100 Vsec and one peaked at more than 250 Vsec. When the holes were probed with electrical conduit there did not appear to be any appreciable deformation of the casing. BQ drill rods are rather expensive to be used for casing boreholes. The research programme will continue by investigating the use of less expensive disposable casing and optimisation of slot location and density. Higher gas flows are expected by casing to the base of the Wongawilli seam.
ACKNOWLEDGEMENTS BHP Collieries Division has permitted publication of this paper to assist early communication of research progress and to facilitate industry discussion of the hypothesis outlined. Measurements were carried out in uncomfortable conditions with the invaluable assistance of Geologist, Rod Doyle and the cooperation of Methane Drainage Engineer, Bernie Gray-Spence. Senior Geoscientist, Jeff Wood and Geological Services Manager, John Hanes assisted with dialogue, critique and repon preparation.
REFERENCES Maddocks, P.I. (1990). App in Colliery, Longwall 18. Results of Deformation and Gas Flow Evaluations from Cross Measure Drainage Bores between 16 and 12 Lines as at 11th April 1990. BHP Company Report, Unpublished.
102
Watson, W. (1990). Appin Colliery. Methane Position Paper. BHP Company Repon, Unpublished. Williams, R.J. (1990). Interim Report on Down Hole Flow and Shut in Pressure Measurements Longwall 18, Appin Colliery. BHP Company Repon, Unpublished.
103
APPIN COLLIERY - LONGWALL 18 Bore Azimuth and Extension below Block
~ :~l---· ·--· --44
•
(/')
.Q
o
42 + ·- · -- - · -·
•
. .. - ··-·· ···· ·· ···---
B 40 - · ···-- -·····- ---· • -·- - · - - - - - -· .o ·.:::: E 38 · -·· --··--··--··-·-·--··-·····•- - - - + ······------- - - - - - ·---- ---------- ········- -·-- -· _g 36
··-· ····
•·
·• ··
+ __ _ _ ............... .... · ............................... + u, 34 - ··-- - · --······· + -._.. _ __ ·+ ·•·
oo. 32+- -
- - -- - -- - - -· ···-·-··---··-··- ·········-··-···-········· ········•···•
a3 30- - - - - - -- - - - - - -- - -··· -·· - ·-····-·-·--·······-··-····· 28+--+'---~--~-----.---~ -- ~ - - 290 300 310 330 340 350 320
a..
Azimuth
•
Avg. hall bores
+
Avg. h at Balgownie j Figure 1
APPIN COLLIERY - LW 18 Bore Closures (AL Adj) View From M/Gate -240~--------------------, ■
- ' - - - ' - - - ' - ' - + - - --
+
·-+ ·--· -··· ····--·-- -· .. :P.:".~ ..~.~...:tw.l!~ Sum ....-- ·- -
... :-:-~... ::...t ... -t-··"~~ ." M!!.t:bn St
:ft + +-++ v .
+ - ······-··
~
..J
a:
. .... .. .. .. .. ...... .. .. .... .. ......... !~.~~ Coll
~+
-3 oo-1-0
...--- --,-------.---,-----.--"T-"---...-----..--r----,---1-2~0-o--"1
200
400
600
800
1000
Locn. Rei End Line (m)
•
Floor RL
+
C/M Break
Figure 2
104
~
~ , ~ ··- '""'
~ - L O _ ~ _ g : _ : _ L _ L _ ~ _ OIOdlllr
"'" Bro ''''""'°" 10 ,:.::or.ooott ·~ ~ ~
-
BULL J SEAM " LOOR
0K f fOH"\ ~ oec,tf\
Figure 3
FLOOR HEAVE ANO BORE CLOSURES
B·- --~-.1.Q }_4._b ___ ---,-B
--~ .-~ 4 .c)
C - . , - - - - ' = = - - - - - -C
o _ _ _:;?-7_ ·=d~,___-___ 4= --,..o
_
. -~-
Figure 4
PATTERN OF BORE CLOSURES
105
RBLATIVB PDIIBABILITY IN COAL
L. Paterson and K. Meaney CSIRO Division of Geomechanics, Mount Waverley, Vic.
INTRODUCOON Permeability is one of the most important factors controlling the production of coalbed methane. Permeability is the measure of the ability of a porous rock to conduct fluid. Absolute permeability is a property of the solid, not of the fluids, and has units of area. It is defined in Darcy's law, where the specific fluid discharge q is proportional to the gradient of the pressurep:
-k µ
q=-(Vp+pg) where k is the permeability,µ is the viscosity of the fluid, p is the density of the fluid and g is gravitational acceleration. If more then one fluid is present, each fluid experiences an ejfective permeability. The ratio of the effective permeability to the absolute permeability is the relative penneability fer that fluid. Coal is normally treated as a dual porosity porous medium. This means that the porosity is divided between a portion in the fractures or cleats and the remainder in much smaller pores within the coal structure, known as the micropores. Permeability is dominated by flow through the fractures. The resistance to flow through a fracture is very sensitive to the spacing between the surfaces. Phenomena that cause variations in this spacing have significant effects on the permeability. Such phenomena includes external stress, internal pressure, and adsorption of water and gas. By petroleum standards, the literature on the gas or water permeability of coal is limited. Yet, the permeability behaviour of coal is probably far more complex than for any other rock type. Obtaining representative samples for the laboratory is a problem because only the stronger samples are tested: weak samples disintegrate on the way to the laboratory. Thus sample size has a strong effect. The larger the sample, the more chance there is of including a larger fracture.
MEASUREMENTS Of ABSOLUTE PERMEABILITY All the laboratory results reponed here arc from tests done at the CSIRO Division of Gcomechanics on samples from the German Creek Mine in the Bowen Basin, Queensland. We have verified that dry coal imbibes water for a considerable period of time. During this period the absolute permeability decreases, following an exponential decay. This observation has also been reponed by others (for example, Dabbous, Reznik, Taber and Fulton, 1974). Results that demonstrate this behaviour are presented in Fig. 1. Initially this sample had a permeability of 5.5 x t0- 15 m2 [5.5 md], but this reduced by more than half to 2.5 x 10· 15 m2 [2.5 md] after about 2 days. Increases in coal permeability that accompany gas desorption have been reported (Harpalani and Zhao, 1989). We have verified that the permeability to nitrogen decreases following a
108
relationship of the same form as water, although the decrease in pcnncability is less significant and the value stabilizes more rapidly. For example, one sample had a permeability of 2.7 x 1Q•l5 m2 [2.7 md], but this reduced by 37% to 1.7 x 10- 15 m2 [1.7 md] after about 6 hours. Similar behaviour occurs with methane. Shrinkage of the coal occurs when the methane dcsorbs, enhancing the permeability. The permeability of coal samples is extremely sensitive to the overburden pressure, and it is drastically reduced as overburden pressure increases (Durucan and Edwards, 1986). It has been the tradition to simulate overburden pressure in the laboratory by applying an external pressure to the core. It may be important, when there are significant differences in the principal stresses, that a true triaxial stress test has not been done. Hysteresis in the permeability results from cycling the confining pressure. After a stress cycle, the final pcnneability is considerably lower than the initial value at the same overburden pressure. When the mean free path of molecules in a gas is of similar dimensions to the flow conduit, the gas is not stationary at the walls and slip occurs. This effect, known as the Klinkenberg effect, means that the gas permeability of a porous medium is a linear function of the molecular free path. As a result, the permeability of a porous medium to gas varies for each gas and with the mean pressme at which the gas flows through the medium. It is normal to extrapolate these values to infinite mean flow pressure (1/p=O) to remove the Klinkenberg effect.
BEI ATIVE PERMEABUJTY To extend the equation of motion to the simultaneous flow of two or more fluids it is necessary to use the concept of relative permeab{lity. Generally, the approximation that relative permeability depends only on saturation is a good approximation for practical purposes. The water saturation is the fraction of the available pore space that has water in it. Relative pcnneability to water, krw, is defined in the equation
and relative permeability to gas, krg, in
where the subscripts w and g refer to water and gas. Consider first a sample filled with gas. If water is introduced (imbibition), gas permeability decreases because the war.er blocks off flow paths that were available to the gas. If more water is introduced, a point is reached where the remaining gas becomes disconnected, unable to flow and held in by intelfacial tension. This point is the residual gas saturation. Similarly, if gas flows into an initially water-saturated sample (drainage), the permeability to water decreases. The point where the water becomes disconnected is known as the residual, or connatc, water saturation. In coal this is believed to be a large fraction compared to other rocks, and this prevents the effective permeability to gas from obtaining a value close to the absolute permeability of the coal. For example, although we have measured residual water saturations as low as 0.2 in one sample, the relative permeability to gas at this saturation was only 0.6. Surfactants have been proposed as additives that reduce intcrfacial tension, thereby decreasing the residual water saturation and raising the effective permeability to gas. Surfactants can be evaluated in a relative permeability test
107
An example of drainage relative permeability curves for coal is shown in Fig. 2 (based on Reznik et al., 1974). Measurements have shown that relative permeabilities to gas are substantially lower during imbibition than during drainage (Reznik et al., 1974). Hysteresis between drainage and imbibition has also been observed. Percolation theory has been used to explain the mechanisms and the shape of relative permeability curves in sandstone. Invasion percolation provides a model for determining the distribution of the residual droplets of water which impede gas flow. However, relative permeability in a fractured material like coal requires a more complex model. Such a model awaits satisfactory development. Determining water saturation is one of the difficulties in determining relative permeability curves, particularly if the sample is not sufficiently homogeneous, which is often the case with coal. This problem provides motivation for the use of a scanning technique using X-rays, ultrasonics or microwaves to measure the water saturation profiles in the laboratory cores.
CONCLUSIONS Careful interpretation has to be applied to measurements of the permeability of a coal. While relative measurements in the laboratory and in the field can be useful immediately, absolute measurements must be placed in context For instance, the stress state must be specified. Although laboratory measurements of absolute permeability may not be representative because of problems with sample selection, relative permeability measurements can be helpful in deciding among different strategics for development of coal seams. For example, alternative dcwatering strategies or the merits of various surfactants can be usefully compared. Furthermore, despite their limitations, laboratory measurements do have some advantages. In field tests the initial and boundary conditions arc often poorly known. In the laboratory it is possible to fix all the parameters except one, and examine that parameter in isolation. This may not be important for measurements of absolute permeability, but the many parameters involved in making measurements of relative permeability prescribe the need for control.
REFERENCES Dabbous, M.K., Reznik, A.A., Taber, J.J. and Fulton, P.F. 1974. The permeability of coal to gas and water. Society of Petroleum En&i,ncers Journal. 14, 563-572. Durucan, S. and Edwards, J.S. 1986. The effects of stress and fracturing on permeability of coal. Mining Science and Technoloc. 3, 205-216. Harpalani, S. and Zhao, X. 1989. An investigation of the effect of gas desorption on coal permeability. Proceedings, Coalbed Methane Symposium, Tuscaloosa, Alabama, April 17-20. Reznik, A.A., Dabbous, M.K., Fulton, P.F. and Taber, J.J. 1974. Air-water relative permeability studies of Pittsburgh and Pocahontas coals. Society of Petroleum En&jncers Journal. 14, 556-562.
108
0.006
0.005 N
~
~
:; 0.004 Q)
...E
Q)
Q.
0.003
0.002 0
24
48
72
96
Time (hours)
Figure 1. Permeability of coal to water as a function of the exposure time to water. 1.0 - - - - - - - - - - - - - - - - -
0.8 ~
I 0.6 ~
Gas
Q)
Q.
.I 0.4
I
a:
Water Saturation
Figure 2. Relative penneability cwves for coal, based on Pocahontas coal (after Remik, Dabbous, Fulton and Taber, 1974).
109
A MATHF.MATICAL MODEL OF GAS EMISSION INTO DEVELOPMENT HEADINGS
A. Saghafi CSIRO Division of Coal and Energy Technology, North Ryde, N. S. W.
INTRODUCTION During roadway driveage, seam gas is emitted into the heading from freshly exposed face, ribside and cut coal. A significant part of the gas make may be also sourced from strata above and below the mined seam. This depends on the volume of the influenced zone around the roadway as well as the existence of gas in surrounding strata. In this paper a mathematical model called PARTRACE for prediction of gas emission rate into a heading is described. The model calculates the gas emitted into the heading from the mined seam and does not consider other eventual gas sources. Utilization of the program PARTRACE is most appropriate for the calculation of an 'average transient emission' under steady advance rates. This emission is described as the flow rate of gas emitted into the heading smoothed for its fluctuation due to variation in advance rate and cutting cycle. The average emission is therefore more regular and would depend on gas content, an average advance rate and coal permeability. To predict more accurately the dynamic process of the gas emission into a heading during the cutting cycle a complementary model simulating face cut-out cycle emission was also developed and has been presented in a previous paper[l]. Program PARTRACE is written in FORTRAN 77 and is used on PCs. A graphic program is linked to PARTRACE to better represent the output. In the following the basic principles used in program development are explained and then a typical case of heading development simulation is presented. DIF~ERENTIAL EQUATION of GAS TRANSPORT IN COAL SEAM In the case of a heading driveage, because of signifi ~ant size of the opening, gas movement toward the rib can be approximated by Darcy's flow. This means that the transported gas is in the free state (not adsorbed), whereas the adsorbed gas acts as a source and is released instantaneously whenever gas pressure drops. To derive the gas transport equation a differential volume d v within the coal seam and in the vicinity of a heading is considered. The differential equation of gas flow for the volume dv is derived as follows: If at time t the in-seam gas content is c(t), then a volume dv within the coal seam would contain c(t) .dv of gas. This gas volume would vary in time due to gas desorption from the coal. Its variation in time can be expressed as,
6c/6t. dv. dt
(1)
110
By applying the equation of continuity to the volume dv, the above variation should equal at any time the difference between gas volume entering and lea vi ng the volume dv of coal which is, (2)
(.S) .dt.dv
-div
where c is gas flow rate per unit of cross section (gas flux) traversing the volume dv. This yields, div
(.S)
-
-
dc / dt
(3)
On the other hand assuming that the major part of the gas flows as free gas then the Darcy's law can be written
c --k / µ.p.grad(p)
(4)
where k is coal permeability to gas, p is the gas pressure and, µ is gas dynamic viscosity.
If the change in gas pressure produces an inmediate desorption of gas from the coal then the pressure change can be expressed in terms of gas content change, i.e., dp/dt-dp/dc.dc/dt
(5)
Therefore gas pressure changes in (4) can be substituted in terms of gas content changes. The quantity dp/dc depends on sorption properties of coal and can be obtained from a sorption isotherm test. p-fl(c), dp / dc•f2(c)
( 6)
where fl(c) is the sorption isotherm equation and f2(c) is its derivative respective to 9aa content. For a case where the desorption is instantaneous and gas flows mostly in a free state the transport equation is, div[De.grad(c)J-dc/dt
(7)
with De, the equivalent diffusion coefficient, De•k / µ.fl(c) .f2(c )
(8)
If for the sorption isotherm a Langmuir equation of hyperbolic form p C •
cm
(9)
p+pO is considered then it gives, fl•p0.c / (cm-c), f2•cm . p0 / (cm-c ) 2 and C
De• (k / µ ) .cm.po 2 . - - -
(10)
(crn-c ) 3
where cm and pO are the content and pressure constants of the sorption isotherm equation.
111
SOLUTION or GAS FLOW EQUATION Flow Towards a Ribside For a cross section of heading of a small length dl, it can be assumed that flow is mainly uni-directional towards the rib. Equation (7) in one dimensional form may be written as, d(De.dc/dx)/dx-dc/dt
(11)
This differential equation of gas flow is non-linear,i.e., the diffusion coefficient De depends upon the gas content. To solve the gas flow equation an implicit finite different scheme was used. A forward difference was used to approximate the time derivative while the space derivative was approximated by a central difference. To reduce the computation time the time stepping is varied with the gas flow rate, increasing with reduction in gas flow rate. To increase the calculation precision a fixed grid in time is chosen. The grid has a variable space stepping with the finer spacing near the rib and it is progressively enlarged for the point inside the seam. The rule of enlarging for adjacent nodes is as follows, If the spacing between node i-1 and i is hi then the spacing between nodes i and i+l would be f.hi, with f being an enlargement factor (f>l). Therefore, hn - hl*(f)n-l
(12)
where hn is space stepping at node n.
I-·-·
i+l
i
i-1
.
.
hi
•
.
f.hi
rib
rig. 1 - Adopted fixed grid in time
The boundary conditions are as follows. At the ribside desorbable gas content is assumed to be zero for the whole period of emission. If the area is not affected by other heading or drainage borehole the gas content deep inside the seam is kept constant at the initial gas content. If a multiheading development is underway a non-flow boundary condition is forced at half distance between the headings.
Gas Flow Emission Into A Heading If the advance rate of the heading driveage is not varying very much an average advance rate of v can be considered. Then the face position at a regularly spaced time will be at a regularly spaced position. Furthermore if an average initial gas content c0 for the area is considered then it is possible to present the heading as a succession of different aged rib slices of length dl, spaced in time by dt• dl/v
(13)
If the flow rate from rib slice i is qi then the flow rate into the heading is,
112
Q -
~i -
I ~ qi. dl
(14)
wi th L the length of heating at time T.
ql
dt
q2
qn
l--+--+-+--+--+--+--+--,face position --+--~-+--+--+--1--,----, at ti ■e T
dl
Fig. 2 - Heading is partitioned in slices of length dl and age difference dt But because the face position and time are linearly related, then Q can be i dentified as the integral of gas flow from the first slice over the time T from cormnencement of driveage. Q -
l ~ ql (t) . dt
(15)
where ql(t) is the gas flow rate emitted into the heading from the first rib slice at time t .
EVALUATION or EQUIVALENT DIFFUSION COEFFICIENT De The most important parameter in running the simulation program 'PARTRACE' is the estimation of De which regulates the speed at which the gas is released into the heading. Ae i• eeen from equation (10) thie coefficient depends upon, sorption isotherm constants, gas viscosity and, Darcy's permeability
k. The gas viscosity and sorption isotherm constants do not vary appreciably during the drainage and are measurable on a laboratory scale. On the other hand the Darcy permeability would vary during drainage reflecting variation in strata stress change leading to coal fissuration or opening/closure of existing fissures. The release of gas from coal would also contribute to c hange in the coal permeability, the liberation of the surface energy binding gas to coal causes shrinkage of the coal matrix which enlarges the gas path within the coal seam . In program 'PARTRACE', the effect of strata stress and gas pressure is taken into account . PERMEABILITY CHANGE DUE TO MINING
Influenced Zone Due to Heading Driveage Driveage of a development heading creates a progressively relaxed and fissured zone in the vicinity of the heading. The relaxing front reaches its limiting volume after a time t0 independent of the advance rate . The relaxed volume expands rapidly after the face has passed, then the speed of expansion reduces. To mathematically express the strata stress around the heading, a MohrCoulomb failure criterion was used:
113
If the roadway is approximated by a circular opening in a zone with initial stress of o0, and if the failed zone has a radius rp then beyond this failed zone (r>rp) the strata stress O is,
o • arn/r 2 + o0, r>rp while in relaxed zone strata stress is,
o •
am (r/rp)n, r<rp
where mn is the peak abuttment stress. The coefficient n which determines the rate of strese change in the failed zone around the roadway, depends on the angle of friction of failed rock and its reaction to confineme_nt. For a number of overseas coal seams it has been shown [2] that n varies in the range of, l.4<n<3.5 In the simulation program n • 1.5 was used. This corresponds to a smooth stress change in the failed zone. Experience shows that the radius of the failed zone rp is on average around 3 times the equivalent diameter of the opening in a deep mine [3]. For Australian conditions a factor of 2 may be more realistic. Permeability Variation with Strata Stress An increase in strata stress would reduce sharply the coal permeability for the low range of stress (0-5 MPa) and then permeability would reduce at a smaller rate for higher stress. This behaviour has been studied and confirmed through laboratory tests [4}. A bi-exponential expression was used to best express this behaviour,
k • A e
-a.a
+Be -b.O
(16)
where o is the strata stress. The constants a and b which gives the slopes of the permeability curves could be estimated from laboratory tests and depend on coal rank and its mechanical strength. The constants A and B which give the coal permeability at a zero confinement state are measures of coal fissuration and therefore are affected by scale factors. Permeability Variation with Gas Pressure Gas desorption from coal is accompanied by the release of surface energy. This would shrink the coal matrix and increase the void volume. The amount of energy depends on the volume of gas released, which in turn depends on the gas pressure change and the sorption isotherm. It can be shown [5] that if gas pressure varies from an initial pressure pi to pressure p, then the energy change of a gas-solid system is, dU •RT.cm.log( e.:!:£2.) p+pi
( l 7)
with dU >0 coal swelling and, dU <0 coal shrinkage. R is the universal gas constant and T is temperature (K). Depending on coal mechanical properties this energy variation would cause a change in coal grain size. To relate the permeability variation to gas pressure, the coal permeability was derived as a function of width of fissures (for gas flow passage). Then the change in fissure diameter due to
114
energy release was calculated. Finally the equation of permeability change with gas pressure change was derived as, k(p) • k(pi).[f(p)/f(pi)]3
(18)
where pi is gas pressure for which the permeability k(pi) function f(p) is given by
is known, the
f(p) • l+ks . log(l+~)
(19)
where p0 is the pressure constant of sorption isotherm, ks is a coefficient depending on the mechanical and physical properties of coal.
APPLICATION
Program 'PARTRACE' was run for a heading of 5 m width driven into a seam of 3 m height with an advance rate of 10 m/day. Due to roadway driveage strata stress was modified. A peak abuttment stress of 6.5 MPa was considered to develop at 12 m from rib whereas the initial strata stress prior to mining was 1. 5 MPa. The assumed coal properties are as follows, - gas content 9 m3/t, - sorption isotherm constants cm• 12 m3/t, pO • 12 atm. (1200 !CPa),
100 ["" I
90 tI -
r-
80 ;_ ,... .c.
Gaa Emlaalon lnto Headln9 O.velopment Gaa content• 9 "'3lt. advance rate• 10 m/day -
Simulated value•
70~
' sol 'i ..... I
~
• soh
~
0
L
3
-
-40
I
0
~
30
::t 0
0
I -----------------~L-----...~~-1 J_J 3 6 9 12 15 18 21 24 27 30 T1 ... (day)
Fig. 3 - Simulated gas flow rate into heading
115
The Darcy permeability stress parameters are, - A• 9.9 mili-darcy, B • 0.09 mili-darcy - a • 0 . 73 MP a -l , b • 0.13 MPa-l The Darcy permeability shrinkage parameters are, - ks•l, pi• 0 atm., k(0)• 3.3 mili-darcy The program was run for a simulated time of 20 days while the total length of simulated heading was 150 m being accomplished in 15 days. Fig. 3 shows the graphic output for flow rate. The decay part of the emission curve corresponds to stopping of the development . In Fig. 4 the simulated in-seam gas content versus distance from the rib is shown. This corresponds to the entrance section of the heading. The computational time for this simulation was 30 seconds on a COMPAQ 386/20e PC.
S.-. Ga. Content. Heodlna O.vetop. .nt Goe content• 9 -3/t • advance rate• 10 m/day
14
Simulated value■
-
-.' 'i .... ., .,i iu
12 10
,-
8 6
J 4L 2
0
0
8
16
24
32
40
56
48
Dlatance ~ro,n rlb
72
80
<•>
rig. 4 - Simulated gas content vs distance from rib CONCLUSION A simple program for prediction of gas emission into a development heading was described. The program was run on a PC and is linked to a graphic routine for output. The computation time is optimized so that the results can be obtained in order of a few minutes. The most important program inputs are the advance rate, initial gas content and parameters describing an equivalent diffusion coefficient. Program outputs are the emission rate during heading advance with its decay when the development stops and the in-
116
seam gas content profile with respect to distance from the rib . The model is only valid when the gas is sourced from the mined seam and it does not consider the gas intake from strata above and below the mined seam. In developing the program PARTARCE special attention has been paid to make it accessible to other potential users. ACKNOWLEDGMENT The author wishes to thank Mr. Christian Jeger (former Deputy Manager of Mining Department, CERCKAR of France and currently Mining Consultant), for his valuable contribution and precious advice in developing the gas simulation program PARTRACE. REFERENCES
1. Saghafi A., 1989 - A study into face gas emission during heading development. 23rd Int. Con£. of Safety in Mines Research Institutes. Washington, DC 2. Piguet J. P., 1983 - La modelisation en mecanique des terrins et son application a !'exploitation minien These Docteur Es Science, Nancy, France 3. Jeger C., 1978 - Detente et fissuration des terrains auteur d'un Tracage. Griaou, Grisoumetrie et Aneometrie, CERCKAR, France 4. Gunther J., 1964 - Etude de la liaison gas-charbon. CERCHAR, Report A.3369, France
5. Saghafi A., Jeger c., 1986 - Etude d'ecoulement du Grisou dans lea veines du charbon. CERCKAR Report 131/86, France
117
PLANNING ISSUBS AND IIIPLICATIONS OF COAL GAS DRAINAGE IN THB IIACARTBUR SOUTH ABBA
K. Sullivan Department of Planning, Wollongong , N. S. W.
PLANNING ISSUES AND THE IMPLICATIONS OF COAL GAS DRAINAGE IN THE MACARTHUR SOUTH AREA Abstract Macarthur south is a future urban sector in south-wes tern Sydney which is being investiga ted to accommoda te some of Sydney's future populatio n growth. The issues associated with the long term interests of coal mining in the Southern Coalfield s are being examined in developin g the strategy for future urban developme nt. The need to accommoda te populatio n growth in the short to medium term is counterba lanced by the need to protect the longer term interest s of the coal industry and those associate d with the draining of gas from the coal seams and surroundin g strata. Associate d with the long term interests of the coal industry are a number of significa nt issues, environme ntal constrain ts, conflictin g land use requireme nts and differing time scales that need to be dealt with in plans for future urban developme nt. One of the philosop hies for the planning exercise for Macarthur South is the developme nt of a strategy that will al low for the extractio n of coal and coal seam gas in conjunctio n with plans for future urban developme nt. Coal gas drainage from undergrou nd coal mines is recognised as being necessary to the future of the coal industry in the It is also apparent that there may be a potential for area. commercia l exploitati on and utilisatio n of coal gas. The concern for the Greenhous e effect heightens the need to address the issues about the collection and utilisatio n of This is especiall y significa nt as the drainage and coal gas. collection of coal gas raises a number of particula r issues affecting plans for future urban developme nt.
118
The current techniques of surface drainage of coal ~eam gas practised in the Southern Coalfields and elsewhere pose real Current constraints upon future urban development proposals. techniques will need to be refined and new techniques will need to be developed to allow coal gas extraction for mining in the long term and in association with urban development. For the commercial exploitation of coal seam gas separate to coal mining there is a need for further research and proving If up of the resource potential in the Southern Coalfields. the in this type of commercial exploitation is to proceed Macarthur South area it will need to be done within the framework of a strategy that ties in with plans for mining and urban development in the area.
119
THE COAL SEAM GAS INDUSTRY IN THE UNITED STATES: TECHNOLOGY, STATUS AND APPLICATIONS TO AUSTRALIAN COALS
2 2 1 J.A. Wallace , P.G. Malone and L. Lottman-Craigg 1 Taurus Exploration Inc., Alabama, U. S.A. 2 Seam Gas Enterprises Pty. Ltd. , Virginia, U.S. A.
Natural gas
fran coal
several coal
basins
secmis
within
is a major SOJree of pipeline quality gas the
lhited States
of
Anerica
in
and w::>rlc>dde.
Historically, coal seam gas, or nethane, has been considered a safety hazard in nJe to current technology and eccn:rnics it has new undergrcu,d coal mines. becate a significant energy resoorce.
It
is est..iroated that the 16 major coal
basins t:hrooghout the United States of Anerica ccntain 400 trillion cubic feet 12 3 'Ille majority of the degasification fields has (or 11. 32xl0 m ) of nethane. devel~ over the past 10 years and nost of these are located in the Warrior Basin of New Mexico and Coloraoo. To date, 9 3 over 150 billion cubic feet (or 4.25x10 m ) of coal seam gas has been produced fran these o,.o basins. 'Ibis paper will sumnarise the current technology used Basin of Alabama and the San Juan
to develop coal seam gas in the United States of America.
Methane gas fran coal is virtually identical in quality to conventional natural gas that is p:roduced w::>rl.CMide. Coal seams fran Wlich gas is produced occur at the
nuch shalla.-.er depths carpared with caiventiCt'lal gas wells, hence reducing cost of drilling and carpleting a "1ell. Since coal has unique IilYsical
and
net.hods
for
chemical
properties
Wlich
gas-sandstcne reservoirs
conventional
make
ineffective,
production
specialised net.hods
have
evolved
to
to reduce gas
Initially, it was extracted fran underground coal mines emissions, thereby inproving mine safety, reducing ventilation
requirarents
and
produce coal seam gas.
alloo..ng
faster
mine
crlvance.
As
natural
gas
prices
Once increased, the gas Wlich was originally vented was collected and sold. production of gas in ccnjuncticn with mining proved econanically viable, degasification projects
carpletely
ilrlependent of
mining were
established.
Several ccrnpanies fx,..l drill into coal seams solely to collect and sell the without producing arrt coal.
gas
120
The majority of me~ is collected utilising vertical ~lls drilled and carpleted in the coal seams. '1w:> other met:mds of extracting gas, both used in conjunctiCl'l with undergroond mining, are goat and horizcntal holes. Once gathered and ca1p1essed, the coal seam gas enters ccmnercial gas pi:pelines. Although all of the large-scale degasificaticn fields are currently located
in the United States of America, coal basins w::>rloo.de have potential for similar projects. In Australia, several coal basins contain significant quantities of gassy coal seams, nost notably the Sydney Basin of New south Wales and the Bcwen Basin of Q.Jeensland. As shallc:w coals Wlich are recovered utilising open pit met:mds becane depleted, DDre undergroond mining of gassier seams will occur . As coal extracticn occurs at progressively greater depths, coal seam gas extracticn in advance of mining becanes increasingly necessary. Proper awlicaticns of the degasificaticn technology can yield coal carpanies i.rrproved mine safety and increased profits by selling or utilising the recovered gas. F.cananically successful projects will depend \.IIXX1 local conditions such as the presence of favourable geological caxti.ticns, available gathering systems and local narkets for the pn:xt red gas. DJe to the unique nature and narket of Australian coals, exploraticn met:mds and technologies developed in the United States of Anerica will need to be rrodified. If the technology is pro:perly awlied in Australian coalfields W'lich contain optiimJm geological conditions, degasification projects can provide a safer mine envi.rcnrent and a reliable, clean source of energy.
121
ASSESSIIBNT OP GAS IGNITION POTENTIAL BY FRICTIONAL PBOCBSSKS PBOII ROCU IN AUSTRALIAN COAL IIINBS 2 1 Crouch a, S. Schaller b C.R. Ward1, D. Cohen1, D. Panich2, and P. Dutta
11c
1 Department of Applied Geology 2 Department of Mining Engineering University of N. S. W., Kensington, N. S. W. Present address: a Coal Compensation Board of N. S. W. , Surrey Hills, N. S. W. b Papua New Guinea University of Technology, Lae, PNG c Department of Geography and Geology, Indiana State University, Indiana, U.S.A. ABSTRACT Using a laboratory test rig constructed for the study, a method has been developed for categorising the potential of different rocks from Australian collieries to ignite methane in air under rock-on-rock friction The five-point ignition potential categorization (IGCAT value) conditions. is based on the occurrence of ignitions or non-ignitions using the rig under a 7% methane atmosphere as a sample of the rock is pressed with a constant load against a rotating wheel of the same material at contact speeds of 2.2, 3.0 and 5.5 metres per second. Statistical assessment of the relationship between the IGCAT values obtained from this procedure and other properties of the rocks concerned has shown that a high frictional ignition category is associated with the abundance of quartz, lithic fragments and feldspar, but that incendivity is Evaluation reduced by the presence of carbonates, mica and clay minerals. of incendivity based only on the percentage of quartz was found to give relatively poor correlations, irrespective of the method used to determine the quartz content . INTRODUCTION With the decline of ignitions from other sources, such as naked flames, electrical equipment and shotfiring, frictional ignitions have displayed a marked increase in annual rate of occurrence in Australia, Britain and the U.S.A. since the 1960s (Ramsay et al., 1965; Ward et al., 1990), and friction is now regarded as the most common ignition trigger in Despite advances in coal recovery methods, underground coal mines. flame for procedures and standards safety techniques, ventilation and lives to threat constant suppression, frictional ignitions remain a Wales South New in many as equipment in those underground collieries, such and Queensland, where significant quantities of flammable gases may be present within or around the worked coal seam. Most frictional ignitions arise from metal-on-rock and occasionally including the 1982; Powell, 1990), (Byrnes, metal-on-metal interactions Several impact of continuous miner components on hard roof strata. incidents have also been reported, however, which suggest the additional possibility of gas ignition from rock-on-rock friction associated with roof falls (Stirling and Cadman, 1912; Hartmann, 1955; Nagy and Kawenski, 1960; Because gas does not necessarily accumulate only in coal Anon., 1961) . mines (McMahon, 1988), potential also exists for frictional ignitions to take place in some civil engineering tunnels and other types of industrial installations.
122
and theoretical from identified been have rocks Quartz-rich experimental studies as having a high potential to generate frictional ignitions (Burgess and Wheeler, 1928; Wynn, 1952; Nagy and Kawenski, 1960; 1975; and Billinge, Powell 1969; Powell, 1964; Rae, 1963; Datey, Blickensderfer, 1975), and quartz content has been used by the National Coal Board (now British Coal) as the basis of its widely-used classification of Little rocks in terms of their incendive temperature potential (Table 1). is known, however, of the role of other components in rocks associated with coal seams, particularly the constituents of the abundant lithic sanstones in Australian coal measure strata, to ignite explosive gas mixtures from frictional effects.
Table 1
Incendivity Temperature Potential criteria used by the National Coal Board (National Coal Board, 1974)
Percentage of quartz in rock less than 30 30 to 50 greater than 50
Incendive temperature potential ( ITP) low moderate high
The present project arose partly as an outcome of the inquiry into particularly the 1987), (Lynn et al., the 1986 explosion at Moura recommendation that: "the necessary funds be made available to enable continued research The and experimentation into the phenomenon of frictional ignition. standard a establish ultimately to purpose of this research should be whereby all strata rocks found in Queensland can be classified according to their degree of incendivity." Research has been directed towards establishing the extent to which the lithological features of Australian coal mine rocks determine energy levels during frictional heating, and whether the energy levels during rockon-rock or metal-on-rock friction are sufficient to ignite explosive gases The ultimate object was to develop in the surrounding mine atmosphere rocks from Australian coal strata of potential tests to rank the incendivity of the particular rocks properties other to and to relate this potential concerned . SAMPLE COLLECTION AND ROCK CHARACTERIZATION Sampling was aimed at providing a representative suite of lithologies associated with the commercial coal seams in the main mining districts of Slabs of minimum size both the Sydney and Bowen Basins (Table 2). such as joints, discontinuities major of 20x20xl0cm were collected, free series of more supplementary A planes. fractures or unusually weak bedding including sources, other from diverse "reference" rocks was also collected to help larvikite, feldspar-rich a_ materials such as marble, quartzite and ignition frictional on minerals determine the effects of individual characteristics.
123
Table 2
List of coal mines sampled.
Basin
Coalfield or District
Deposit or Mine
Sydney
Hunter Hunter Newcastle Newcastle Southern Southern Southern Southern Southern Western Western Western Western
Wambo Warkworth Munmorah Newvale No. 2 Appin Cordeaux South Bulli Tower West Cliff Clarence Cullen Bullen Angus Place (Kerosene Vale) Western Main
Bowen
Baralaba Blackwater Blackwater German Creek German Creek Collinsvill e
Moura South Blackwater Cook Curragh German Creek Collinsvill e
Thin sections were prepared of each rock sample and mineral Textural elements, percentages determined by point count techniques. tics, sorting characteris contact grain shape, grain including grain size, further rock provide to ly qualitative noted and porosity were also in the lithic quartz including content, quartz Total characteriz ation data. from x-ray determined also was components, matrix fragments and the (1977). Ward of method the diffraction data using The majority of samples collected were sandstones, but conglomerat es, siltstones and mudstones were also represented along with tuffacceous The sandstones cherts, sideritic concretions and igneous intrusive rocks. feldspar, quartz, of proportions varying with , composition in were diverse or carbonate by bonded and/or matrix clay a in set fragments mica and lithic quartzose more the of some but ed, well-cement were Most secondary silica. sandstones were held together by relatively incompetent , clay-rich matrices that permitted easy plucking of the grains in subsequent frictional tests. The rocks were also subjected to a chemical analysis program, with determinati on of major oxide concentrati ons (by x-ray fluorescenc e), moisture content, acid-solubl e (mainly carbonate) fraction, and loss-onThe data obtained from these analyses ignition after heating at 1oso 0 c. for each sample by allocating mineralogy normative a were used to estimate developed specificall y for method a following minerals oxides to particular of characteriz ation to means alternative an provided This the project. "actual" mineralogic al than rather l" "theoretica giving point counting, sample. rock individual percentages for each
124
Although the need to conserve material for the main frictional ignition experimental program limited the extent of geomechanical testing, data were obtained for a number of samples on unconfined compressive strength and Young's modulus by standard techniques, and on rock cuttability and abrasivity indices using methods specially developed within the UNSW Department of Mining Engineering. FRICTIONAL IGNITION TESTS frictional ignition test rig was designed and built especially for the project, based on a 150mm cylindrical wheel of the rock sample (Figure 1) rotating against another piece (or "slider") of the same rock, or a continuous miner pick in some cases, in a gas-filled explosion chamber. Tests were performed with sliders of 25 to 30mm in cross-section in an atmosphere of 7% methane, at a normal load of 20kg and with wheel speeds of This gave contact speeds at the · wheel periphery of 300, 500 and 700rpm. 1 2.2, 3.0 and 5.5 m.sec- . The visible effects of frictional contact and the time required to ignite the gas mixture (if any ignition in fact occurred) were evaluated mainly from videotape records of each individual test run. A
MeTHANI-AIII
~QIEL
MMPU
MIXTURE
THIN PLASTIC MEMBRANE
~ IGNITION
~
TEST SLIDER VARIABLE DRIVE MOTOR
....,.,. Hm8HT
ADJUSTIIDT
riqur• 1
Schematic view of gas-chamber test rig
Substantial amounts of dust or rock debris were liberated during some experimental runs, but this did not necessarily prevent ignitions occurring. In many cases, a combination of hot spot, heat trail and spark shower was developed for up to tens of seconds prior to the actual gas ignition, but in other cases ignitions occurred in the absence of sparks and before development of a strong heat trail. Some samples in fact did not ignite the methane at the highest speed (700 rpm) despite development of extensive heat trails and spark displays. There was strong abrasion and some fracturing of the slider in nearly all tests, while in some samples both slider and wheel developed a frictional glaze due to melting and associated smearing of minerals over the Repeated tests using identical slider and wheel positions rubbing surface. display an overall decrease in times-to-igniti on, and to tended usually and re-positioned on the wheel frequently during replaced were sliders hence the test program.
125
IGNITION CATEGORIZATION A semi-quant itative method for categorizin g the frictional ignition potential of the samples was developed, based on whether or not ignition A 5-point scale (IGCAT) was developed occurred at the three test speeds. from these criteria (Figure 2), although in cases where a series of fast ignitions was grouped with one or two slow ignitions or with non-ignitio ns at a given speed some half values were also allotted. Velocity (m/aec)
5 4
Ignition Category
3
2
Ignition
** * * ** * ** •
1
-· {1o
Figure 2
•
•
•
•
•
TNt Condltlonl
~ No
5
3.5
2
7.0'1 Metll-/Alr w.....01... 140alll
•
20III
Loed
Ignition category classificat ion for rock-on-roc k friction
IGCAT values obtained this way ranged between 1 and 5 for the sample The carbonate suite (Figure 3), with the majority in the range of 3 to 4 . and the ignition) no (i.e. 1 rocks all displayed IGCAT values of rocks sedimentary d The finer-graine conglomerat es had values of 3 to 4. to tending values IGCAT had more extended IGCAT ranges, with the mean decrease with decreasing particle size).
Key
mex.
B
3rd
quartll• median
I
1at
quartlle
I
O Mucle....
min.
Sandi... 811tetoM
~
Cont....,_
lgneoue
Aoc:111)"
Distributio n of IGCAT values for the different rock types
128
Ignitions were also produced in several instances where tungsten carbide tipped continuous miner picks were forced to cut into selected sandatone, siltstone and conglomerate samples at speeds of 300 and S00rpm. Ignitions did not occur, however, with a mud.stone wheel used in this particular study, nor with a polycrystalline diamond tipped miner pick. Although a full categorization program for pick-on-rock friction was not attempted, the ignitions that did occur involving picks required substantially longer times than rock-on-rock ignitions with the same material under equivalent test conditions. SPARK SHOWER TESTS In a separate series of tests, small pieces of the individual rock samples used in the main test program were held by hand against a mediumgrained synthetic corundum wheel of diameter 200 mm, rotating at 2850 rpm (i.e. with a peripheral speed of 28 ms- 1 ) on a workshop bench grinder. The hot spot and spark shower developed for each rock were photographed in a darkened room using high-speed colour transparency film and a 2 second time exposure. A range of responses was noted, from samples that barely produced a hot spot at all to those that produced bright heat trails and prolific showers of incandescent particles. The rocks were graded from the photographs on a ten-point scale (referred to as the grinder category or GCAT) based on the hot spot or heat trail and spark shower characteristics Table 3) . Actual gas ignition was not involved in these tests, although particles from one experiment did ignite paper in a bin some two metres away.
Table 3
Grinder category (GCAT) selection criteria
GCAT
Classification Criteria
0 l
No visible hot spot in photograph Hot spot at point of contact but no spark shower or heat trail developed Hot spot at point of contact with heat trail extending up to 20° arc around wheel More intense hot spot and heat trail Heat trail extended up to 90°, with visible sparks up to 10cm from contact point Heat trail extended up to 90° with visible sparks greater than 10cm from contact point Heat trail extends full 360° around wheel with minor sparks Heat trail extends full 360° around wheel with continuous flow of sparks Increased intensity of heat trail and spark shower Further increase in intensity of spark shower White-hot zone extends out from hot spot
2 3 4 5 6 7 8 9 10
127
CORRELATION OF IGCAT TO OTHER ROCK PROPERTIES A comprehensive statistical analysis was carried out of the relationships between the data obtained from frictional ignition testing and This other characteristics of the individual rocks in the sample suite. included simple bivariate correlation between parameters, particularly the various compositional parameters and IGCAT, with determination of the relevant correlation coefficients in each case. R-mode cluster analysis and factor analysis were also used to establish the combinations of parameters that appeared to affect most strongly the ignition category, and step-wise multiple regression was used to develop and test a range of formulae relating IGCAT to other rock properties. A general increase in IGCAT was observed with increasing quartz content (Figure 4a), regardless of whether quartz was determined by point However, a large spread of data points was counting or by XRD analysis. noted; the quartz contents of the nine samples having an ignition category Positive correlations were of 4, for example, ranged between 10 and 95%. also found between IGCAT and total (chemically-det ermined) silica, and between IGCAT and the normative quartz content.
a., . Mica (a....U ,..,
au.tz (ao-aD) , .., 100
Q
Q Q
70 Q
eo IO
eo
Q
eo Q
I
40 20
0 0
0 0
Q
2
1
Q Q
Q
3
.__c... ,ce,
Q
Q
30
B
Q
Q
40 Q
I
Q Q
20
Q
0
Q
10
Q Q
Q
Q
Q
5
4
0
0
10
100
I
5
2
3
4
Q
Q
Q
0
Q
I 0
10 0
......
0
•
• •
Q
0 0
Q
4
a
0
0
Q
Q
Q
1 2
...... Q
Q
Q
Q
a 0
i
Clmdarc.lllClll'J
C....(fJ
0.1
Q Q
B Q
1
2
3
...... Call . . 11
rigw:e,
4
•
0 0
3 2 tgntllanCaaeorY
Plots of IGCAT against selected rock properties.
a a
0
a 4
5
128
A weak negative correlation was found between IGCAT and the percentage of Al2O3, but no direct correlation was observed between IGCAT There did and the percentages of feldspar, matrix or rock fragments. a given for value IGCAT the to limit maximum appear, however, to be a sediments. coarser-grained the in least at 4b), clay+mica content (Figure A very strong negative correlation was noted between IGCAT and the log of the point count carbonate content, although the igneous rocks were There was also a clearly outliers in this partiular case (Figure 4c) . moderate negative correlation between IGCAT and total loss-on-ignition (LOI), a parameter which reflects carbonate plus high-temperature water loss Plots of rock strength and Young' s modulus showed no from clay minerals. particular correlations with IGCAT, but weak correlations were observed between IGCAT and abrasivity and cuttability indices.
Weak positive correlations were noted between the grinder category (GCAT) derived from the spark-shower tests and the percentages of clay and feldspar in the rocks, and weak negative correlations between GCAT and LOI, With the acid soluble component, and the quartz content by the XRD method. the exception of LOI and the acid-soluble fraction, these correlations run Plots of IGCAT versus counter to those established for the IGCAT values. (correlation near-perfect non-correlation showed a 4d) (Figure GCAT suggesting that the frictional heating effects coefficient of zero), indicated by the gas chamber and the spark-shower tests are completely unrelated. A series of triangular diagrams was constructed (Figure 5), based on the associations identified from the statistical procedures, to illustrate These are the relationships between IGCAT and other geological parameters. The relation between the discussed more fully by Ward et al. (1990). different mineralogical components and IGCAT was found to be more complicated than that implied by corelations based solely on quartz content, partly because quartz is not the only type of hard framework particle involved and partly because the other components, carbonate and clay+mica, each depress the ignition category (IGCAT) value to a different extent. Further work is required to widen the database, however, partly to refine these correlations and test procedures and partly to delineate the relation between IGCAT values from laboratory testing and frictional ignitions in actual mining operations.
0-.(XN))
•
........
C.IIIOrY
•
I
I
0 4•4.1 • 1·1.1 0 2-2.1
0 4•4.1 ■ 1-a.1 0 2-1.1
.'
LOI
l'iqu~ 5
IGCAT of plots diagram Triangular mineralogical and chemical parameters.
against
principal
129
ACKNOWLEDGEMENTS This project was conducted with financial support under the National Energy Research, Development and Demonstrati on Program, administere d by the Considerabl e Coll'ltlonwealt h Department of Primary Industries and Energy. advice was provided at different stages of the work by numerous people, including Frank Powell, Graham Hardie, John Brady, Ian Poppitt, Peter Golledge, Ripu Lama, Rolf Schrader, Frank Roxborough and Leon Thomas, as well as a number other people in the Australian coal industry. The test facility used for the project was designed and constructed in the workshops of the Faculty of Applied Science at the University of New South Wales, and Liao Quan Bao, Jian Feng Xu, Irene Wainwright, Jim Haddon and Rad Flossman assisted with different phases of the experimenta l work. A large number of colliery companies and individuals also assisted in providing rock samples and other material for the testing program. REFERENCES HM Chief Inspector of Mines and Quarries Inquiry into the Six Anon, 1961. Bells Colliery explosion. Iron and Coal (Feb. 3, 1961): 257. Methane ignition by frictional impact heating. Combustion and Flame, 25(2): 143-52.
Blickensder fer, R.,
1975.
Burgess, M.J. and Wheeler, R.V., 1928. The ignition of firedamp by the heat of impact of rocks. Safety in Mines Research Board Paper 46. Byrnes,
Compiled information on the frictional ignition of J .G., 1982. Geological Survey of New South Wales, N.S.W. Department of methane. GS1982/413 82/45, Report Petrologica l Resources, Mineral (unpublbhed )
Datey,
u.w., 1963.
A study of incendivity of frictional sparks from rubbing contact between rock and steel. MSc thesis, University of Birmingham (unpublished ) . Frictional ignition of gas by mining machines. Bureau of Hines Information Circular 7727.
Hartmann,
I.,
1955.
U.S.
Report on an accident at Moura No. 4 underground Lynn, K.P. et al., 1987. mine on Wednesday, 16th July,1986: Queensland Government Warden's Inquiry, Government Printer, Brisbane. its consequence s to The Abbey.stead disaster: 1988. McMahon, M.D., AUCTA strata. Basin Sydney within n constructio underground 24-162. pp.l Sydney, 1988, July symposium,
Nagy, J. and Kawenski, E.M., 1960. Frictional ignition of gas during a roof fall. U.S. Bureau of Hines Report of Investigatio ns 5548. Geological assessment of faces and headings to National Coal Board, 1974. NCB temperature potential of rocks. incendive determine the Instruction PI/1974/4.
Powell,
Ignition of gases and Engineering Chemistry, 61(12): 29-37. F.,
1969.
vapours.
Industrial
and
130
Powell, F., 1990. Ignitions of firedamp by machine picks: a review. Health and Safety Executive, Buxton, U.K. File SMP69/373/101, 59pp (unpublished) .
Powell,
F.
and
Billinge,
K.,
1975.
associated with colliery rocks.
The frictional ignition hazard The Mining Engineer, July 1975: 527-
33.
Rae,
D., 1964. The role of quartz in the ignition of methane by the friction of rocks. Safety in Mines Research Establishment Research Report 223.
Ra~ey, H.T., Wass, C.A. and Hartwell, F.J., 1965. manner
mines.
A summary account of the of ignition of firedamp in British coal The Mining Engineer, September 1965: 728-44.
and the
frequency
Stirling, ·J.T. and Cad.man, J., 1912. The Bellevue explosions, Alberta, Canada: an account of, and subsequent investigation concerning, three explosions produced by sparks from falls of roof. Transactions of the Institution of Mining Engineers, London, 44: 740-70.
Ward, C.R., 1977.
Mineral matter in the Harrisburg-Springfield (No. 5) Coal Member of the Carbondale Formation, Illinois Basin. Illinois State Geological Survey Circular 498: 35pp.
Ward, C.R., Cohen,
D., Panich, D, Crouch, A., Schaller, S. and Dutta, P., 1990. Assessment of gas ignitability potential by frictional effects from Australian coal mine rocks. End of Grant Report, Project 1083,
National Energy Research Development Program, Commonwealth Department of Primary Industries and Energy, Canberrra: 216pp. Wynn, A.H.A.,
1952.
The ignition of firedamp by friction.
Research Establishment Research Report 42.
Safety in Mines
131
AN UPDATE ON LONG-HOLE DRILLING FOR MINB GAS EMISSION CONTROL R . J. Williams
GeoGAS Pty. Ltd., Wollongong, N. S. W.
SmtKARY Given the high level of gassiness of a nuaber of Australian collieries, and the trend toward increasing production levels, aore effective aethods of gas capture and drainaee are required. Long-hole, directional drilling aay significantly contribute to overcoaing the proble•. Evaluation of the cost effectiveness of long-hole drilling is co ■plex and difficult to generalise. To aid this process, GeoGAS has developed a "Drilling and Drainage Hodel" which can co■ pare short-hole rotary drilling with various long-hole drilling approaches. The advantages of cableless electronic surveying over pump down single shot surveying are quantifiable using the model. As an indication, the cableless electronic survey tool gave an increasing ■ etreage rate over the pu■p down tool, of between 251 to 601 per shift. The opti ■um hole depth for the pump down survey tool for the scenario aodelled was 400 m to 500 •· These i ■proveaents in aetreaee rates can translate into savings of between 151 and 30% on the cost of drainage per tonne of coal to be mined . The •ain advantaees of long-hole drilling for predrainage of the working seaa, are that over 501 less drilling ■etres are required for the sa ■ e drainage effect, a reduction in gateroad drainage ranges and fittings, and there is less coneestion fro■ drilling in the gateroads. There are so ■ e serious li•itations centring around the requireaent to drill accurately controlled holes and the need for holes to re■ ain open for the duration of drainage. Probleas with long-hole drilling in the working sea ■ for South Coast conditions, are largely overcoae in drilling for pre and post drainage of the underlying seaas. The aajority of short, rotary drilled down-holes typically produce low quantities of gas due to almost ubiquitous shearing off of boreholes along the goaf edge . Long-hole cross measure/in-seam drilling has the potential to overcoae the shearing problem and produce more uniform drainage - especially on the tailgate side . Cross ■easure/horizontal drilling has the additional potential application for pre and post drainage in the relaxed strata above the longwall pillar. Successful drilling requires good initial planning , suitable, well aaintained equip•ent.
skilled operators and
132
INTRODUCTION Coal sea ■ s over wide areas of the Bowen Basin and in the Southern Coal District of the Sydney Basin are highly gassy by world standards. A forerunner for events in the Bowen Basin can be gauged fro ■ ■ ining in the Southern Coal District where four collieries are undertaking longwall ■ ining in decidedly gassy conditions. In spite of a high level of in-seam predrainage and a high intensity of post drainage fro■ down-holes, unacceptable levels of down-ti ■ e are being experienced fro■ gas outs. New, ■ ore effective ■ ethods of gas capture and drainage are required. Longhole, directional drilling is one such ■ethod that may form a part of a solution to the problem. The last publication of a general review of long-hole drilling for gas drainage was eiven by Willia ■ s et al., 1986. That paper reviewed progress and listed avenues for further develop■ ent. At that time, rotary drilling was the ■ ain ■ethod used in long-hole drilling. Early trials of down-hole ■ otor drilling had just begun, using a 2 3/8" Dynadril. Problems with the syste ■ were: - Lack of azi ■ uth control on rotary drilled long-holes. Increasing survey ti ■ e with depth using the pump-down survey tool, effectively li ■ iting boreholes to around 400 to 500 metres depth.
- Reliability proble■ s with the 2 3/8" down-hole ■ otor. This paper suuarises the so■ e of the ■ ore i ■portant developments that have occurred in the industry fro ■ 1986, reappraises the role for long-hole drilling in gas drainage and suggests future directions. The drilling ter ■ inology is not explained. The reader is referred to earlier publications (see References). CURREHT STATIJS
A ■ ajor advance in long-hole drilling occurred with the setting up of Methane Drainage Pty. Ltd. (MDPL) in 1984 to commercially exploit coal seam gas reserves . The latest US equip ■ ent was employed in an ambitious project of coal seam gas drainage at Tower Colliery. A Fletcher drill was engaged for Bulli sea ■ drilling using high strength CHD76 rods. Down-hole motor drilling was ■ ade using a high torque 2 7/8" Slimdril powered by a Longyear FMC 6-60 f1 ush PUIIP. The ■ ost i ■portant and expensive equipment item was the Model 24 Cableless Survey Syste ■ (CSS), ■ anufactured by Geoscience Electronics Corporation. The tool was built from the ground up to Australian intrinsic safety require•~nts. For drilling in the Wongawilli seam at Tower Colliery, MDPL purchased a Ke ■ pe K200NQ drill rig . It was custo■ built with a capability of drilling up to 1500 •· In spite of the impressive array of equipment, results were disappointing, with ■ axi ■ u■ hole lengths of just over 800 m being achieved in the Bulli seam and below expectation gas flows. This, plus the loss of a down-hole ■ otor and CSS down-hole unit in the Wongawilli seam is believed to have lead to the winding up of the venture in 1988. It was a sad end for what was a
133
good concept in principle. None-the-less. as a result of this work, the coal industry is better placed to utilise long-hole drilling, with direct benefits realised at Appin Colliery, Tah■oor Colliery and Tower Colliery. A ■ ajor upgrading of research into long-hole drilling was undertaken at Appin Colliery fro ■ 1986 to 1989 (Hungerford et al., 1988a) . Major equipment ite ■ s were a 2 7/8" high torque Sli ■dril down-hole motor, Kempe K200C drill, Longyear FMC 6-60 flush pu■p and an NQ drill string. Proble■ s in acquiring a suitable cableless electronic survey tool were overcome with the aid of MDPL, who hired their Hodel 24 Geoscience tool to the project . Achieve ■ ents
fro• that project (Hungerford et al .• 1988a) were:
- Drilling of the first Australian long-hole to reach 1000 m. long-hole cross the of trial successful and concept. which involved drilling a trunk hole to tangentially intersect the Balgownie sea ■, and proceeding to keep on drilling in-sea ■ to 923 •depth.Gas was captured in post drainage with flows of around 180 1/s (Hungerford et al., 1988b). The
design
■ easure/in-sea ■
- An i ■proved bit design. Experience in down-hole ■ otor drilling enabling a review of scenarios.
with operational statistics
A NERDDP extension to that project sought to translate the technical successes to ■ ine operational practice involving training for a four shift per day operation. In 1989, ACIRL undertook long-hole, in-seam drilling in a NERDDP funded project at Houra No. 2 Hine (Truong at al, 1990) . That work involved use of a Dia ■ ec 260 drill rig, CHD76 drill rods, Sli ■dril 2 7/8" down-hole motor, a Longyear FMC 6-60 flush pu■p and the Du Pont cableless electronic survey tool. In-seam boreholes to depths of 417 • were drilled to predrain gas ahead of develop■ ent. Drilling was at an average rate of 37 ■ /shift, with unplanned delays accounting for 37% of the available ti ■e. A large proportion of the delays were caused by factors external to the drilling (Truong at al, 1990). Colliery use essentially si ■ ilar long-hole drilling equipment comprising a Kempe K200NQ drill, Sli ■ dril 2 7/8" down-hole motors, a Longyear FMC 6-60 flush pu■ p, East ■ an single shot surveying and a CHD76 drill string. The ■ ain application for this equip■ent has been for in-seam exploration and trial cross ■easure/in-seam drilling into the Balgownie and Cape Horn seams. Tah ■ oor
With the aid of this recent long-hole drilling are:
experience,
the main problems emerging with
- A proven reliable, cableless electronic survey tool is not commercially available in Australia, although Du Pont (Australia) Pty. Ltd. appear close in this regard . Drainage effectiveness remains to be adequately tested for sea ■ and cross ■ easure/in-seam techniques .
- Addressing the level of long-hole drilling .
operator
skill
required
both in-
for "production"
134
Long-hole, directional drilling is •ore complex than the current short-hole rotary drilling ■ethods. Whether perseverance is warranted depends upon answers to these typical questions: How does it co■pare with short-hole rotary drilling in terms of cost and drainage effectiveness? Is cableless electronic surveying cost down, single shot surveying?
effective compared
to pump-
How can the required degree of expertise be best developed for multi shift production drilling?
DRILLING AND DRAINAGE MODEL Evaluation of the cost effectiveness of long-hole drilling is co■plex and difficult to generalise. GeoGAS has developed a spreadsheet ■ odel using the pseudo three di ■ ensional spreadsheet program QUATTRO PRO. The ■ ajor ele ■ ents ■ aking up the ■ odel are separate spreadsheet files. Spreadsheet linking is used to consolidate the ■ odel operation and output. The main application is in evaluating in dollar terms, long-hole drilling to particular operating environ ■ ents. up of eight linked files:
the suitability of The ■ odel is made
FILE 1 - The Long-Bole Drilling Model - This file covers scenarios of boreholes up to 1500 • long, cableless or pump down camera surveying, pre and post drainage and coal and stone drilling. Factors taken into account are survey ti ■ e, rod running ti ■ e, set-up ti ■ e, change of penetration rate with depth, borehole branching, the forward ratio, number of shifts worked and unplanned delays. Drilling targets (hole lengths and spacings) co■ e as output fro■ FILE 2 - Develop■ent and Drainage Ti■e. The main file output is ■ etres per shift and drilling duration. File 2 - Develop■ent and Drainage Ti ■e - Development and longwall extraction rates are used to define drainage and drilling times according to the ■ ine plan. Predrainage times for varying hole spacings use equations derived from results of si ■ ulations (e.g. fro■ SIMED - University of NSW) and empirical checks on gas flow data. The option of specifying the degree of gas removal is given. File 3 - Short-Bole Rotary Drilling - Provides basic input on the cycle time for drilling in-sea ■ and down-holes, nu ■ber of drill rigs in operation, nu ■ ber of holes to drill. It obtains geometrical input from File 4 - Panel Layout and outputs data to File 8 - Drilling Costs. File 5 - Labour Rates - A database of labour rates for all categories of labour associated with the drilling. File 6 - Capital - A register of capital ite ■ s, with charges ■ ade up from depreciation, cost of finance and insurance. File 7 - Consu■ables - A register of consumable items. File 8 - Drilling Costs - Provides financial output for both rotary and long-hole drilling options, as total cost, $/tonne of coal drained/affected and $/■etre drilled. This is the ■ ain output spreadsheet and is linked with all others.
135
of a para ■ eter in any one spreadsheet is automatically accounted for throughout the ■ odel. For exa ■ple, the labour, consu■ ables and capital costs are all linked to the size and nature of the job being ■ odelled .
Adjust ■ ent
Historical data are used to ■ ake the ■odel output realistic and relevant . Such things as percentaee of unplanned delays, forward ratio, level of supervision, and equations describing the change in survey ti ■ e and penetration rate with depth are derived fro■ use of down-bole equipment of the type used in the Southern Coalfields collieries.
CABLELESS AID PUMP DOWlf SURVEYING Considerable resources have been expended toward the develop ■ ent and acquisition of a cableless electronic survey tool. In the absence of such a tool, directional drilling is still possible using a single shot ca ■ era, pu■ p down survey tool. In an endeavour to clarify to i ■portance of developing a caelectronic bleless survey tool, co■para scenarios can t i ve be evaluated for both To ■ ethods . survey indicate the potential benefits of the cableless electronic the tool, survey drilling long-hole 30:::J:--.-----,---.-----.----r --.....----r--r------r----t 100 200 300 400 500 100 700 800 100 1000 1100 used to was ■ odel larlhole dlpth (m) drilling co■pare of both perfor ■ ance fig. 1 Drlllng Rate Comparison Using survey types (figure Coblelen and Puii,> Down Sl.rvey Tools 1). for the scenario the ■ odelled, cableless electronic survey tool gave an increasing aetreage rate over the pu■ p down tool, from 251 to 601 per shift . It can be seen that the opti ■ um hole depth for the pu ■p down survey tool in this scenario is 400 • to 500 • · These i ■prove ■ ents in ■ etreage rates can translate into savings of between 151 and 301 on the cost of drainage per tonne of coal to be mined. It is re-e■phasised that cost co■ parisons require the use of input data specific to a particular situation. The ■ ain saving using the cableless electronic survey tool co ■ es through the reduction in labour costs, which still for ■ the bulk of the drilling costs. For ■ost scenarios, the cableless electronic survey tool (performing reliably and to specification) should be cost effective . An additional benefit is the higher survey frequency which enables greater drilling control.
136
GAS DRAINAGE PREDRAINAGE OF TBE WOKING SEAM The ■ ain advantage of long-bole drilling for predrainage of the working seam is the saving on ■etres drilled for the sa ■ e drainage effect. It is possible to predrain two longwall pillars in advance, and use the additional lead For exa ■ple, a one kilo■ etre length ti ■ e to increase the borehole spacing. of longwall typically requires 9500 • of rotary drilling, but only 4000 m of long-bole drilling where drainaee ti ■ es are approxi ■ately 180 days and 450 days respectively. Other savings result fro■ reductions in labour and ■ aterial costs for the eateroad pipe range and associated fittings for each standpipe. Reduced congestion in gateroads is also realised. There are so■ e serious li ■ itations in the use of long-hole drilling for predrainage of the working sea ■ . These centre around the require ■ent to drill accurately controlled holes and the need for holes to re ■ ain open for the duration of drainage. Hore specifically, these are: - The need to ensure that a long-hole does not inadvertently stray across the line of an intended gateroad. Here, drilling control and survey accuracy are i ■portant. - The longer the borehole, the greater are the adverse consequences for gas drainage if a hole beco■ es blocked. Holes should drain in the direction of face retreat, so that while the face is working, so■ e negative pressure can be ■ aintained on the borehole to pull gas away from the face - should an adequate level of drainage not have been achieved. A borehole that blows gas onto the face is potentially far worse than bad the bole not been drilled at all. - Loss of a drill string poses problems on the longwall face. - The effect of branching ■ ay be to cause instability at the point of the branch, and choking the older hole with cuttings. So ■ e evidence for this has been observed at Appin Colliery (B. Gray Spence - pers. co■■.).
- The rotary transverse boreholes readily lend themselves to subsequent water infusion for the reduction of dust on the working face. Longholes drilled transverse to the longwall pillar are not adaptable to water infusion (B. Gray Spence - pers. co■■.}. With longer borehole lengths, need to be acco■■ odated.
increasing gas flows during drilling
- Geological ano ■ alies provide a li ■ itation to hole length, where the likelihood of hole blockage around the ano ■ aly is obviously much greater. These li ■ itations do not preclude the use of long-hole drilling for predrainage of the working sea ■ , but they clearly narrow the range of application. The suitability for long-bole predrainage drilling ■ ust be evaluated according to the prevailing geological and logistical circumstances. Acombination of transverse rotary drilling and long-hole drilling would be co•■ on in ■ any applications.
137
PRE AND POST DRAINAGE OF ADJACENT STRATA The current aethod of transverse rotary down-hole drilling as used on the Southern Coalfield has serious liaitations, and it is here that long-hole drilling probably has the ereatest potential application. In spite of the usually high level of total gas captured from down-holes, it is al ■ ost always the case that the ■ajority of this gas co■ es fro• around 201 of the boreholes, while the reaainder produce little gas at all. Considerable work has been carried out at Tahaoor Colliery on varying the downhole angle. No clear indication of ereater gas flow is apparent for downholes drilled at dips of between 14° and 26°. Holes drilled at shallower aneles tend to be crushed by abut ■ent loads, while those at greater angles run the risk of ■ issing the relaxed zone altoeether. Probing of these transverse down-holes shows that in nearly every case, the holes are sheared off by aoveaents along the pillar edge at hole depths of fro• 40 • to 60 •· The early designs based on intersecting the Wongawilli sea• beneath the centre of the lonewall pillar were scrapped when it was realised that a large proportion of the 120 • of drilling for each hole was wasted. Steeper, shorter holes up to 90 • in length are now drilled at Tahreduction in drilling ■etreage at no penalty to ■oor Colliery giving a 251 the quantity of eas drained. Given the shearing that takes place, their ■ ain effect is presuaably to capture gas as it ■ igrates up this lateral fracture syste ■.
In su■■ ary, the aain probleas with the currently designed down-holes are: pre ■ ature shearing off of the borehole leading to far too ■ any holes being drilled for little effect, and
side of the
the apparent inability to ca~ture gas fro■ the tailgate pillar.
author proposed and designed the concept of long-hole cross drilling (figure 2). It was trialed at Appin Colliery with encouraging results {Hungerford et al., 1988b). When the longwall passed over the boreholes, flows of 180 - 190 1/s resulted. That ■ ethod of drilling and drainage has the following advantages: In 1986,
the
■ easure/in-sea ■
- Drilling below the working sea ■ avoids ■ any of proble■s the associated with predrainage drilling of the working sea•. - The tendency for the borehole to shear off due abut ■ ent to loads is greatly reduced, as the abut ■ ent front constantly is ■ oving and fracturing is not as focused or in-
,,,,.,
MIINM
"-- '-Fig. 2
Post Dro.lno.ge Concept for Long-Hole Cross M•o.sur•/ln-S•o."' Drilling
138
tense as the side abut ■ ent. - Gas capture can be effected fro■ the tailgate side of the face. - It should be possible to drill these boreholes fro• either end of the longwall pillar. - The boreholes can be dewatered and the underlying sea• partially predrained before the area is ■ ined. Such predrainage as proposed by A. Fisher (pers. cou.) re■ains to be tried, but it could be a significant part of a solution to the problea. Progress in further proving the technique has been slow, partially due to difficulties in proving the reliability of a cableless electronic survey tool. At Tah ■ oor Colliery, trial cross ■ easure/in-seaa drilling into the Balgownie sea• was undertaken below Longwall 5 pillar in 1989. Trajectory control proved difficult with two boreholes finishing in the Wongawilli sea• at depths of approxiaately 480 • each. When the longwall retreated back over these boreholes, gas flows of only 50 1/s were recorded while the borehole was in the Woneawilli seaa. These flows decreased to zero when the face caae over the position where the borehole was in the Balgownie sea ■. This seam being only 4-5 • fro• the Bulli sea• (at Tah■ oor Colliery) resulted in the hole being crushed out from the front abut ■ ent. This technique shows proaise, but it reaains to be proven, and design liaitations identified and overcoae. The saae concept could be applied to pre and post drainage from overlying sea ■ s such as in the aulti-sea• environaent of the Hunter Valley (figure 3). The basic requireaent would be to drill in the region of future strata relaxation above the goaf area. Up dip directed boreholes would be self dewatering - an aid to predrainage. In the Southern Coalfield, it aay be feasible to replace the vertical well strata relaxation holes with a single borehole drilled upward and horizontally over the longwall pillar. The obvious advantage of horizontal over vertical boreholes is that a far greater length of the borehole reaains in the zone of interest. Drilling in sandstone would be very slow using current directional drilling botto ■ hole asseablies. Research would be warranted into ■ ethods of faster penetration. Once the borehole has reached its horizontal trajectory, haa■er drilling ■ ay be appropriate. Quantitative cost co ■ parisons of down-hole ■ otor drilling with rotary shorthole drilling can be readily undertaken with the aid of the previously described, drilling and drainage ■ odel. Given the wide nuaber of variables involved, it is inappropriate to give cost coaparisons in this paper, except to say that it can be cost effective in ter ■ s of gas drained per tonne of coal to be ■ ined. The ultiaate assess ■ ent of long-hole drilling potential is in its ability to reduce face down tiae due to gas outs. This remains to be proven.
OPERATOR EXPERTISE Long-hole directional drilling requires considerable additional expertise on the job, a hieher level of pre-drilling planning and ■ ore supervision. It is a specialist job requiring a dedicated drilling tea ■. The team can be ■ ade
139
up of contractors or a eroup fro■ within the ■ ine. The latter is only likely to work if they are able to re■ain dedicated to the drilling, and this requires a sufficiently large internal de■and for this type of service. Planning is critical to success - defining achievable drilling paths, identifying potential difficulties, deciding upon the operational procedure and establishing a budeeted ■ etreaee tareet. For cross- ■ easure/in-sea ■ drilling, a diagra ■ showine the planned trajectory is needed on site, superi ■ posed by eeoloeical infor ■ation - strata types, potentially difficult drilling zones. This diagra ■ is up-dated as drilline proceeds and decisions on changes in trajectory are ■ ade accordine to how the real plotted trajectory relates to the planned trajectory . The operators need to be thorouehly trained in all aspects of the job - understandine how directional drilline is achieved and aspects of nor ■al drilling, surveying, branching and trouble shooting . Training drillers to an experienced level requires ti ■e and exposure to a ranee of activities and proble■ s. The transition fro■ sinele shift to ■ulti-shift drilling is likely to take place over several ■ onths and then with reeular supervision . needs to be adequately ■ aintained. Proble■ s with down-hole ■ otors and cableless electronic survey tools for exa ■ple, are ti ■e consu■ ing to rectif y . Even with a back up on site, it is a ti ■ e consu ■ ing process to rethe borehole, involvine rod running, dismantling of the ■ ove these fro ■ the drill rod holder and rotation unit out of the rotating and box stuffing . way Equip■ ent
CONCLUSIONS Predrainaae of the workine sea ■ by lone-hole drilling has to overco ■ e a of li ■ itations, ■ ainly associated with the level of precision renu■ber and ■ aintaining borehole stability. A target azi ■ uth control for quired depth of 500 • to 600 ■ is probably realistic at this time. Atte ■ pts at routine drilling of in-sea■ boreholes to 1000 ■ + should await results on drainage effectiveness, hole stability and survey accuracy from more moderate leneth holes. In any case, a reliable cableless electronic survey tool is required for the efficient drilling of longer boreholes. Greater potential is seen in the use of long-hole drilling for cross measure/in-sea ■ pre and post drainage. There are severe deficiencies in gas capture fro ■ the short, rotary down-holes drilled transverse to the longwall pillar and this type of long-hole drilling appears well suited to overco■ ing these problems. Apart fro■ the added refine ■ ent of guiding a borehole in a cross ■ easure trajectory to tangentially intersect an underlying sea ■, there is areater latitude for error in directional control. Lack of a reliable cableless electronic survey tool has retarded progress in the application of long-hole drilling under operational conditions. Continued perseverance in develop ■ ent of such a tool is warranted. The i ■ petus for broader i ■ ple■ entation of the technique rests with the gathering of quantifiable data on gas drainage effectiveness. Detailed drilling statistics are essential in planning new work and logically ■ akine i ■ prove better focusing research endeavours . The "Drilling and Drainage ■ents by a fra ■ ework for inteerating this information with output provides Hodel" expressed in dollar ter ■ s .
140
Long-hole drilling should be re2arded as an available alternative to shortbole rotary drillin&. A pre drilling appraisal of a given situation can be undertaken with the aid of the "Drilling and Drainage Hodel" and a clear indication can be given of the ■ost appropriate course of action. A major factor in decidin& on use of long-hole drilling, is available lead time for both drillin& and drainage. Properly set up, it should be possible to drill for two longwall pillars ahead of current ■ ining. Such advance drilling can provide the highly significant bonus of forewarning of potentially adverse 2eological structures with a greater lead tiae to plan for alternatives. Successful drilling is very ■uch dependent upon initial planning, operator skill and well ■aintained equip■ent with appropriate capacity. Successful drainage is the target, so that attention to hole co■pletion is required. Holes should be thoroughly flushed, preferably using a suitable They need to be ■ onitored and checked for blockages. If need ■ud additive. be, the drill rig should be repositioned over the hole to clean it out. A blocked hole is co■pletely wasted, and in predrainage drilling of the working sea ■, can create a worse proble■ than it was designed to overco■e. Long-bole drillin& is a technique that with continued develop■ ent and perseverance, should result in a safer and ■ ore productive working environ■ent.
ACDOWLEDGEMENTS advice on Frank Hungerford of ACIRL is acknowledged for his freely given long-hole drilling. Bernie Gray Spence, Methane Drainage Engineer fro• Appin Colliery provided an authoritative balance on the potential and problems of long-hole drilling and draina2e in the working seam. The author thanks KCC for per ■ ission to refer to unpublished work Colliery.
from Tah-
■oor
REFEREMCES Hungerford, F., Sagbafi, A., Willia ■ s, R.J. and Kelly, M., 1988a - In-seam and cross ■ easure ■ ethane predrainage by long-hole drilling. End of grant rept., NERDDP project 874. Hungerford, F., Saghafi, A., Willia ■s, R.J. and Kelly, M., 1988a - Long-hole drilling for gas e ■ ission control at Appin Colliery NSW, Australia. 4th Int. Hine Vent. Congr., Brisbane. Truong, D., Hungerford, F. and Drahei ■, P., 1990 - Gas drainage by long-hole drilling at Moura No. 2 Mine - an operating experience. Bowen Basin Sy■p., Mackay, 85-90. R.J., Allan, J., Truong, D., Beamish, B.B. and Hungerford, F., An evaluation of sea ■ gas drainage by long-hole drilling. The Coal Jourppl, No. 10, 13-22. Willia ■ s,
1986
-
141
CARBON DIOXIDE AND IIBTBANB BIIISSION AT TABIIOOR COLLIERY R. J. WiUiaros GeoGAS Pty. Ltd. , Wollongong, N. S. W.
SUNMARY This paper describes and analyses the nature of ■ ixed gas ated with longwall ■ ining at Tah■oor Colliery.
eaission associ-
The virein COz and CH• distribution varies both stratigraphically and laterally. The COz generally has its ereatest concentration in and around the Bulli sea ■ (451-851 COz). The underlyine sea ■ s eenerally have a hieher proportion of CH• (101-801 COz). The lateral variations are al ■ost as with areas varying fro ■ do■ inantly COz to do ■ inantly CH• in both extre■ e, the Bulli and Wongawilli sea ■ s. The virgin gas co■positions are reflected in the gas drainage co■positions. In addition, in-sea ■ boreholes have produced a consistent pattern of increasing COz concentration with drainage ti ■e. Down-holes show the opposite trend of increasing CB4 concentration with ti ■e. The doainant process governing the co■position of the resulting borehole gas is the virein stratigraphic and lateral cban1e in co■position. An understandine of this virgin eas content and co■position distribution is the assess ■ ent of future gas e ■ ission conditions and the funda ■ ental to selection of control ■ ethods. There is evidence to indicate C01 e■place ■ ent after (or in association with) the intrusion of dykes and related geoloeical structures. Durine longwall extraction, characteristics:
COz
and cu.
eaission exhibits
the following
The two gases behave independently where rises and falls in eaission do not closely correspond. - COz e■ issions rise ■ ore quickly than CU ◄ when mining commences, and fall ■ ore quickly when ■ ining ceases. The aagnitudes of the rises and falls are ■ uch greater than for CH ◄• COz do ■ inant
is the do■ inant eas in the return gas in the bleeder.
roadway,
whereas CH ◄ is the
- Floor breaks yield CH ◄ rich gas. To better understand the e ■ ission processes and arrive at a means of prean e ■pirical model was created and dicting . e■ issions for future longwalls, tested against the known e■ issions from Longwalls 5 and 6. Back analysis yielded a good fit between actual and calculated return e ■ issions, for the
142
variables of gas capture, air quantity and production rate. Irregularity coefficient s were defined by progressive testing against real data to enable realistic daily ■ axi ■ a concentrati ons for design purposes. A si ■ple qualitative ■odel is proposed that explains the observed characteristics of ■ ixed gas e ■ ission. The difficulty of C02 capture is readily explained using the ■odel. Further advances in controlling C02 emission probably rest with devising ■eans of inducing more C02 into the bleeder. The characteris tics of ■ ixed gas e ■ ission provide perspective on the more e■ ission process. The ■odel proposed for mixed gas emission nor ■ al pure CH4 could well apply to Cff4 e ■ ission, where large quantities of CH4 ■ ay be entering the ventilation strea■ through rapid emission from non coal strata.
INTRODUCTIO:N A characteris tic of Australian coals is the widespread occurrence of relatively high concentrati ons of carbon dioxide (Co2, in the seam gas. While historicall y, the ■ ost notable areas are in the Southern Coal District of the Sydney Basin and at Collinsvill e in northern Bowen Basin, ■ ixed gas (carbon dioxide and ■ ethane) e■ issions have been reported in the Lower Hunter Valley (May and Paul, 1990) and at Gregory South and Moura (Hargraves, 1986) . The region of greatest significanc e for mixed gas emissions is the Southern Coal District . As the ■ ajority of gases encountered in future mining reserves will be ■ ixed gas (55% - Grant and La ■a, 1989) means of understanding and overco■ ing associated problems are required. Tighter ■ argins apply for per ■ issible C02 percentages , where the ■ aximum allowable concentrati ons are 1.25% in New South Wales and 0.5% in Queensland. For return roadways re ■ ote fro■ electrical equip■ ent, methane (Cff4) concentrati ons up to 2% are permitted. Thus for return roadways, restraints on C02 concentrati ons are greater than for CH4. The ai ■ of this paper is to describe and analyse the nature of mixed gas longwall mining. As Tahmoor Colliery is the only e ■ ission associated with longwall ■ ine experiencin g this proble■, it necessarily provides the central focus for this paper. The colliery has also taken a very positive approach in i ■ ple ■ enting what is believed to be the ■ ost extensive routine gas monitoring progra ■ of any ■ ine in Australia. A result fro ■ that effort has been a wealth of data and experience that will undoubtedly assist development of other ■ ines faced with ■ ixed gas emission problems.
TAIIMOOR COLLIERY OVERVIEW Colliery is situated between Tah ■ oor and Bargo, about 80 west of Sydney. The Bulli sea ■ is ■ ined at a depth of 400 •· Tah ■ oor
Infor ■ation
km south-
on geology, gas emission and drilling is given in Table 1.
143
TABLE 1 GAS-RELATED INFORMATION GENERAL TAHHOOR COLLIERY
A, ltKAJIGBAERJ
Fro■
Thickness
Working
(■)
Distance Sea ■
Litholog y
(■)
8-397 0-8 0 BULL! SEAM 0-5.3 5.3-7.6 BALGOWNIE SEAM 7. 6-15.3 CAPE HORN SEAM 15.3-15 .5 15.5-22 22-32 WONGAWILLI SEAM
389 8
2.2 5.3 2.3 7.7 .2 6.5 10
sandston e, so■ e shale beds laainite coal WORKING SEAM sandsto ne/shale carb. shale/■ inor coal clayston e/shale coal carb. shale//c layst. coal, shale/c layst. bands
D, GA§ DRAINAGE DRILLING (typical specific ations) Sea ■ Length (■)
Holes (predrai nage) Down-Holes (post drainage ) In-Sea ■
Spacing Dia ■ eter Design Intersec tion ( ■■) (■)
190
20
65-80
Bulli
95
20
65
Wongawilli
Down-Hole Angles are 18• to 26• dip, angled back toward face at 65• to the gateroad . 'I
li6$ IIIXISIWI
Total Desorba ble Gas Content (■3 /t) Specific e■ ission
(■ 3
/t)
Gas Capture (%) NgU l
Ngte l
COz
cu ..
3.5-7.9
2-4.5
7-11
11-15
10-17
25-30
30-40
60-70
Co■bined
bleeder/ down-ho le figure. It does not include gas re■oved in predrain age. Co ■bined
A sche ■ atic showing the current ■ ethod of longwal l drainage borehole layout is shown in figure 1.
ventilat ion
and gas
A co ■ prehensive review of the operatio nal probleMs associat ed with develop given by Nicholls ■ ent and longwal l extracti on in a ■ ixed gas environ •ent is ■ easures which new of trial sive progres the s (1989). The paper also describe worked face y currentl the on ■ployed have cul ■ inated in the ■ ethods e Longwall 7.
DESORBABLE GAS CONTEHT AifD CONPOSITION DESORPTION CHARACTERISTICS Laboratory and field tests have clearly established that the co■position of COz and CH• is not constant during desorption. The nature of the changes is exe■plified in a study centred upon deter■ ining the gas content fro■ face sa ■ples taken fro■ 400 Panel in Tah ■ oor Colliery (Saghafi et al., 1987). Initial desorption co ■positions were high in COz and beca ■ e progressively richer in CH◄ with ti ■ e (figure 2). The final co■position weighted, gas content was 6.4 ■ 3 /t COz and 2.3
1113/t
rr-:
L
·· ..... I···
••••••••• •••······ .. •• ·············•···· •• ••••••• •••···•···· ••• ••• ·•••·· ·· ·· ··..
-
'cii:ii:ii:ii:ii:ii:ii:i i:ib"
-------· ~---------, .o:.,.,.... ________ _ ;:: --------., ~~ ___ :::::: ., -:....~ --------.,, --:....... --------<:::::::::: I ,
,,
......
~✓--------
~,'""----------
: ,
;/
--------
.• . .
-----------J ----~------~..
Fig. l
lit-MUI hot.ea
ScheMo. tic of Longwo.ll Ventllo. t1on o.nd Go.s Dro.1no.ge Boreholes To.hMoor Colliery
CH ◄•
this work, it beca ■ e clear that care bad to be taken in determining desorbable gas contents by the USBM ■ ethod, by ensuring that gas co■ positions are taken throughout the desorption process, and that the final reported figure is the weighted average of the gas co•positions. Fro ■
Gould and Hargraves (1987) observed essentially similar sa ■ ple desorption in another area of Tah ■ oor Colliery.
behaviour for lump
Work by Lama (1988) on laboratory adsorption/desorption tests produced similar results when assessed over a period of days (an increase in CH ◄ composition with ti ■e). The initial desorption {the first twenty minutes) was very rich in CH◄. Gas contents are routinely ■ easured at Tah■ oor Colliery from both surface borehole and underground face and core samples. The overwhelming behaviour is for COz to desorb ■ ore quickly than CH ◄•
DISTRIBUTION The inherent or virgin COz cally and laterally. The
and CH ◄
distribution varies both stratigraphi-
COz tends to have its greatest concentration in and around the Bulli The underlying sea ■ s generally show an increase in the proportion of CH ◄ in the sea ■ gas. The change can be extreme, fro• almost all COz in the Bulli sea ■ to nearly pure CH ◄ in the Tongarra sea ■ (figure 3). Although sea ■.
145
as areas exist where the Wongawilli sea ■ has a si ■ ilar C02 concen tration ■ sea the Bulli sea ■, the trend of decreas ing C02 with depth below the Bulli is a regiona l trait (Grant and Laaa, 1989) . The lateral variati ons are as extre■ e, with al ■ ost areas varying fro■ do■ i nantly COa to do■ inantly CH4 in both the Bulli and The sea ■s. Wongawilli particu Wongawilli sea ■ in in es ■ extre shows lar , co■position chanees (fieure 4).
Isotop i c studies by S ■ ith et al. (1985), pointed toward an igneous origin for the C02 . Such an origin was postula ted as early as 1963 of basis the on reon intrusi C02/■ ag ■atic (Hargra ves, lations hips 1963). A si ■ ilar COz/in relatio nship has trusion been observe d at West Cliff (H. Franulo vich Collier y pers. co-.). At Collin sville, variati ons in C02 gas conten t and outbur st pronen ess can eenera lly be to proxi ■ ity to related intrusi ons (Wiligneous lia ■ s and Rogis, 1980) .
ao-. --:= ----- ----- ----- ---.
0 0
t IC
.....
75 10
§,5 ·
i1J
j 55 850+- ---r-- ----r- ---,-- -r---- -----l 0
5
Flg. 2
10
15 Tme (da)'t)
25
20
30
Change In Gas CC>r11)0sltlon CA.ring Desorption for USBM Gas Content Tat
o.a - . - - - - - - - - - - - - - - - - - - - - . ..... 0.1
~ 0.1
N
8 0.5
'
80.4 .....
Wongawll NClffl
! 0.3 Cl
CIC 0.2 N
8 D.1 o~--.---.---.--,--,---r---r----r--~
470
480
410
500
510
520
530
440 450 410 distrib ution at Depth from arfaoe (m) Collier y suppor ts Tah ■ oor the existin e evidenc e for Flg. 3 Change In Gas Composition With Depth derived extern ally an source . It appears that the and C02 was eaplace d after (or in associa tion with) the intrusi on of dykes 4 related geoloe ical structu res. The trends of C02 distrib ution in figure are paralle l to these structu res.
The
C02
Hore credenc e is given to this notion upon exa ■ 1n1ng the changes in gas coathe positio n that occur in the gas produce d fro ■ the in-sea ■ boreho les and down-h oles fro ■ Longwalls 4 to 7. For both sets of boreho les, a sudden the change in co■position occurs (figure 5). Happing this change across extenlonewa ll pillars produce s a trend (figure 6) that lines up with the sion of a dyke structu re encoun tered in work i ngs to the south east (figure 4) . Two sets of evidenc e are therefo re produce d, favouri ng the later e■ place ■ent of COz : - The good align■ ent of the co■position change with the project ed geologica l structu re. A si ■ ilar trend for the change occurri ng horizon s .
in differe nt stratig raphic
146
SCALE,
0
,00
1000
CD2 60-~/.
IWV.S
' ',
Bull! Seo."'
'
CD2 10-40¾
... ' ,_
'\
----- -- -- --
Geologico.l structur e <usuo.lly dyke or strike-sl ip fo.ul t)
w'ongo.wllll Seo."'
-- -- -- -- ... _
...... ......
Approx. position of 60% CD2 contour
......
\
\
\ \
\
\
\
\
\
''
CD2 20-:50¾
''
''
''
CD2 60-80X
',,
''
''
', ' & ',' ' ·-' ·· ~
' ' ' ' ··"•. '
'
Genero.l Go.s Col"lpos1t1on D1str1b ut1on In the Bulll o.nd 'w' ongo. will I Seo.Ms o. t T o.hMoor Colliery
~
',,
', ',
''
''
''
'
\
\
\
\
'
\
\
\
'
\
147
FLOWS FROtt DRAINAGE BOREHOLES Gas co•position fro• drainage boreholes varies acthe type of cording to borehole (in-sea• or downhole), its position, and the duration of drainage for any particular borehole. stratigraphic variaThe tions described in the presection are ■ani vious of for ■ the fested in co■positional contrasting differences between in-sea• boreholes and the adjacent, underlying downholes . The in figure 5 exa■ple shown to Lonewall 4, applying illustrates the ■ore CH◄ rich gas co■ ing fro■ the
.J,
0.7
Io.,5
,...
N
0.1
j§:-_j
~0.55
8 0.5
';;0.45
i._ 0.4
80.35 0.3 0.25 + - - " T " " " - - r - - ~ - - r - - - - r - -..........- - - 1 200 400 100 1100 1000 1200 1400 0 OW.... of boNtloll from 700 Panll (m)
Flg. 5 Pre and Post Drainage Compositions Longwall 4 Tcnnoor Coliery
Gives rect1on of 1ncreos1ng CH4. LIM of down-hole COl'lpOSltlon chon~.
/ ✓'
/
0.75 T - - - - - - - - - - = - - - - - - -
F""\---14
Nor-thern edge of ra.pld 1n-seOJ'I COl'lpOSltlOn chonge.
Lww of l'IG><il'IUl'I 1n-seol'I CH4.
r
.· ., Southern edge of ra.pld In-sea."' COl'IPOSltlon cha.nge.
Fig. 6
Lines of Ro.pld Go.s CoMposltlon Cho.nge Longwo.lls 4 to 7 To.hMoor Colliery
148
deeper strata. Si ■ ilar profiles could have been presented for Longwalls 5, 6 and 7 - with one difference. An overall progressive reduction in C02 is evident fro■ Longwalls 4 to 7. The ■ agnitudes are indicated by the progressively reducing levels of COz with each new longwall (refer C02% values in figure 6). Therefore, reflected in the gas drainage of Longwalls 4 to 7 is both the stratigraph ic and lateral change in the virgin gas co■position. In addition to this, are changes in co■ position oc.,, I curring with ti ■e, as u drainage proceeds fro■ each .52 borehole. In-sea ■ borehole ,... ' .5 results have produced a tl.5 N consistent pattern of in"e' J 8 ·" creasing COz concentrati on N ~2.S with ti ■e. An exa■ple using .41 8 2 Longwall 4 data is given 0 M in figure 7. It appears 1.5 that CH◄ flows throu1h coal and into the borehole, o.s-1-----.--r --~-..---T--- r--....---,a ■ore easily than C02. Ac0 IO '° to IO 100 120 1'° cording to Sagbafi (pers. '1ml liapNd ..... cHq (daya) co■■.), Darcy flow favours the less dense and less Flg. 7 Averaged Flow Data, In-Seam Holes viscous CH ◄ ■ olecules. In Longwal 6 Tatmoor Colliery bore core desorption, the process is reversed, with COz favoured under essentially diffusion flow.
----' ~
I
C02 flow
CH-4 flow
----
C02 ratio
!
The pattern of co■position change for down-holes is opposite to that of insea■ holes, with a well established trend of CH ◄ quantities increasing with ti ■ e. This is probably controlled by the gas distributio n in the lower strata, with C02 being depleted fro ■ the strata closer to the Bulli seam in the earlier stages of gas flow, leaving progressive ly ■ ore CH ◄ rich gas to Migrate into the boreholes fro ■ the deeper strata with increasing time. Changes in co■position with ti ■ e create potential difficultie s in establishing true co■ positions . As previously indicated, for gas content desorption tests, a weiehted average of C02 and CH ◄ for the whole desorption process is used to arrive at a final gas content value. The final gas coaposition for each drainage borehole is calculated from the area under the gas flow curves for both C02 and CH◄ (e.g. in arriving at the results for figure 5). The do■ inant process governing the co■ position of the resulting borehole gas is the original, virgin stratigraph ic and lateral change in composition . Changes in 1as co■position with ti ■ e, while obvious, are not of the same order of ■ agnitude as the inherent co■positional values. The main i ■portance is in knowing that these ti ■ e dependent composition al changes do occur, and to account for the■ in data collection and analysis.
EMISSIOM DURIMG LOMGWALL HIKING During longwall extraction, on-line ■ onitoring of air velocity and gas concentration is continuousl y carried out in the longwall return and the bleeder. The COa and CH ◄ e■ ission has exhibited a nu■ber of contrasting characteristics:
149
The gases behave where independent ly falls in rises and e ■ ission do not closely correspond (figure 8) .
C02 ■ ore
e■ issions
quickly
rise
than CH ◄
when ■ ining couences, and fall ■ ore quickly aining ceases. when The aagnitudes of the rises and falls are auch greater than for CH ◄ ( figure 8) .
2500
l
~2000 !1500
f
...,
1000 500 0
01-0.C
0
04-Jan
03~ 02-4'1D Dlltaa to faoe flnllh (m)
Fig. 8 Return Gas Emission Longwal 6 Tcimoor Collery
C02 is the doainant
the return in gas roadway, whereas CH ◄ is the do■ inant gas in bleeder (figure the 9) .
Floor breaks yield rich gas (figure CH ◄ 8) . N While figures 8 and 9 de8 0.3 eaission, scribe Lonewall 6 the sa ■ e pattern of behav0.2 + - - - . . . - - - . . . . - - - " " T " " - - ~ - - ~ - - - 1 1200 1000 SOO 100 400 200 0 iour has occurred for the Dlltcnoe to faoe ftnllh (m) other longwalls . An apparent exception is Longwall Fig. 9 Bleeder and Return Gas Compositions its of 7, where because Longwall 6 Tatmoor Colliery being ained in a auch ■ ore rich environ ■ent, the CH ◄ The relative of has a greater concentratio n roadway return . remain return and bleeder the between co ■ positional differences
A QUANTITATIVE EMPIRICAL MODEL AVERAGE RETURM PERCENTAGES To better understand the e ■ ission processes and arrive at a means of predicting e■ issions for future longwalls, a aodel was created and tested by "predicting " the gas levels that had already occurred in Longwall 6. An added coaplicatio n occurs for Longwall 6 analysis. Following a floor break on the 15th March 1990, high eaission levels were sustained to the end of the longwall (figure 8). This sudden change is believed to be due to abnormal geological structure associated with known co ■ plications in the Bulli sea• in Longwall 7 pillar and the next adjacent longwall pillar . Before and after this date, two separate e111ission levels occur (figure 8).
150
rela t ionship between The production rate and e•ission is provided by the curves in figures 10 and "specific ter ■ The 11. these in used e ■ ission" in correct not is figures the strict sense of the specific Longwall word . emission is defined as the total gas produced fro ■ a the (including longwall tail-down period after ■ in ing is co ■ pleted), divided by the total tonnes produced. It is independent of production. Relating short (one week periods) ter ■ to e ■ ission" "specific production rate e ■pirically delay the incorporates that occurs in gas e ■ ission between when ■ ining occurs and when gas fro ■ the effected strata is released.
22....--- - - -- - - - -- - -- - - - - - - , ~
•
20
r: e
'- 11
t 12
l 10 I I + - -......- - r - - - - . - - - , - - - r - - r - - , - - - - r - - - - 1 20
15
10
•o 35 30 25 WNldy Proa.,atton (tOMII)
•5
50
55
(Thauaandl)
Fig. 10 CO2 Specific Emission/Production Longwall 6 Tahmoor Colliery
35..----- --
-
--------------,
• ••
prior to the 15th March is called "nor ■ al" and "abnor ■ al• e ■ ission, the 15th after e■ ission March. E ■ ission
e•ission, "nor ■ al" For and e■ ission specific production are related by e■ pirical following the equations:
From 15 Wcrch SE = •311 x tOfflll A--0.5•20
From 15 Wcrch st = 200122 x tomNA--0.11011
•• • To 15 Wcrch st = 113187 x tomNA--0. • 5 +---r----r---.----,----,---....--...---,-__,;;·'--t •o •5 50 55 35 30 25 20 15 10 WNldy PrOOJctton {tomN)
Fig. 11
(ThouMnll) CH4 Specific Emission/Production Longwall 6 Tohmoor Colliery
SEco2 = 20265 x t.-o.1z42 SEc ■ 4
= 93687 X t.- 0 -•• ◄ 0
where : SEco1 is the "specific e ■ ission" of C02,
is the "specific eaission" of CH4, and
SEc ■◄
tw is the weekly coal production in tonnes.
For •abnor ■ al" e ■ ission, the following equations apply: SEco1 = 4371 x t.-o.a410 SEc ■ 4
z
200122 X t.-•-•011
The equations relating the total gassiness (specific emission) to the return e ■ ission are:
151
where:
Racoa
= 100 x (1 - Ccoa) x SEcoa x T,/(86400 x Q.)
Rac ■ 4
•
Cc ■ 4)
100 x (1 -
x SEc ■ 4 x T,/(86400 x Q.)
Racoa is the weekly average return C02 percentage, Rac ■ 4 is the weekly averaae return CH4 percentage, Ccoa is the percentage capture of C02, Cc ■ 4 is the percentage capture of CH4, T, is the average daily coal production in tonnes, Q. is the return air quantity in • 3 /s.
To check that these equations describe the processes controlling gas e■ is sion for the Longwall 6 return, actual weekly averrates, air capture aee quantities and production rates were used as inputs. The results in figures 12 and 13 show a good agreethe actual between ■ ent values, calculated and particularl y for C02. The "nor ■ al" e■ ission equations of Longwall 6 were applied to Longwall 5 production rate, capture and air quantity data and gave a good agree■ent. Longwall 7 data are in the process of being evaluated. reasons fit with C01 be:
The
!
f ~
o
200
400
1100
aoo
FCIIII polltlo,, (m from fHlh)
1ooo
1200
F'tg. 12 Prediction of C02 Emission Into Return Back Analysis Longwall 6 Tatmoor Colliery
for a better are likely to
high capture of CH4 . Downrate hole, and to so■ e extent the bleeder e■ is not very sions are sensitive to production changes. The
0
200
400
100
aoo
f'C1111 polltlo,, (m from flnllh)
1000
1200
- The evolution of Cff4 F'tg. 13 Prediction of 0-U Emission Into Rehm the deep floor. fro■ Back Anciysl1 Longwal 6 Tatmoor Col.-y In Longwall 6, this would probably account for the low reading, followed by a peak between 1000 • and 700 • (figure 13) which was probably a floor release occurring after a period of abnor•ally low e■ ission.
152
PEAi RETURM PDCDTAGES 1
Specific ation of required air quantit ies and capture rates for gi ven levels of producti on requires knowled1e of peak 1as e■ ission levels. The next step is therefor e one of converti ng weekly average return gas percepta ges to daily aaxi ■WI (or near ■axi ■u■) percenta 1es. European ■ethods (Boxho et al., 1980) ■ake use of irregula rity coeffici ents which they define as the ratio of the daily ■axi ■ua gas reading divided by the daily average gas readine. For this analysi s, various irregul arity coeffic ients were devised and tested against real data. The best result was obtained using the followin g relationship s: Icoa = Jbecoa1L coa + STDcoa/ 1.7 • 1.46 le ■•• RNc ■ 4/Lc ■ •
where:
+ STDc ■ c/1.2 s 1.43
Icoa is the irregul arity coeffici ent for C02,
is the irregul arity coeffici ent for cu. , RNcoa is the daily ■axi ■u■ return C02 percenta ge, averaged over a week, Le ■ • is the daily ■axi ■u■ return CH• percenta ge, averaged over a week, STDcoa is the standard deviatio n of actual daily C01 ■axi ■a over weekly average C02 percenta ges, STDc ■ c is the standard deviatio n of actual daily ea. ■axi ■ a over weekly average cu. percenta ges. lc ■ c
A QUALITATIVE NODEL The charact eristics of the ■ ixed gas e■ ission have been synthes ised qualitat ive ■ odel that describe s the observed process es.
into a
All evidence points to the C02 being concent rated around the Bulli sea~ the sea■ and surround ing strata. When longwal l ■ ining co ■■ ences, the disturbed zone is only in the iuediat e Bulli sea ■ roof and floor. Here the - even in the bleeder. As the face regases eenerate d are hi&h in C02 into the floor where cu. rich gas deeper treats, the relaxati on zone extends is tapped (fieure 14). The ■ajority of C02 desorbs very quickly , ■ ainly from non coal strata i ■•e diately above and below the Bulli sea ■. As soon as ■ ining occurs, disrupti on of the strata results in iuediat e release of C02 which just as quickly subsides when ■ ining ceases. The ■ ajority of ea. co■ ing fro■ the deeper strata and having ■ ore coal from which to desorb, is conside rably ■ ore delayed in its ■ igration, so ■ uch so, that by the ti ■e it reaches the Bulli sea■ level, it is ■ainly under the influenc e of the bleeder . By contras t, the C02 in being released quickly, l return. ■ ierates to the tailgate end of the face and into the longwal This ■odel explains why the C02 is so difficu lt to capture. It ■ ainly resides in strata above the down-hole influenc e, and is in any case, released lone before the down-ho les are affected by the relaxed zone.
153
Fig . 14
Model For Mixed Ga.s [Mission a. t T a.hMoor Colliery
WBEIE TO NOW? The history of ■ 1n1n2 fro• Lonewalls 3 to 7, has been one of steadily reducint COz quantities reflecting the regional trend of a reduction in COz in that direction. Even so, it is still quite difficult to ■ ine to a 1.25% return concentration. Colliery bas ■ade a nu■ber of significant changes that ■ ake ter placed to tackle the proble■. Two of these are:
Tab■oor
it bet-
- The introduction of bleeders in Longwalls 6 and 7. Couissioning a new fan which in addition to a significant air quantity increase, will enable a higher pressure drop to be generated across the ioaf to draw eases back to the bleeder. ■eans Further considerations relate to deter ■ ining inducing hieher quantities of COz into the bleeder.
of
preferentially
There is a clear need for continuing research of both a practical basic nature . So■ e aspects worthy of study are:
and ■ ore
Investigate the origins of the C02 in greater detail - relationships with igneous intrusions and other structures, the ti ■ ing of e ■place ■ ent relative to other structures, the ■ecbanis• of e■place■ ent . - To directly deter■ ine what quantity of the initial gas in place is released into drainaie holes and the ventilation strea ■, and what proportion of the eas re■ ains . This work is essential to providing a fir■ er basis for e ■pirical ■ odels to calculate specific e■ ission in Australian conditions. - To test the possibility that large rived fro ■ non coal strata.
(do■ inant?)
proportions of gas are de-
- To create a ■ucb ■ore detaile d picture of inheren t gas conten t and co ■po gas sition variati ons. A rapid, low cost and accura te ■ ethod of deter ■ ining conten t is require d. - To define and trial alterna tive techniq ues in &as drainag e (surfac e borehole, lon&-h ole under& round).
COICLUSIOIS ng Hixed eas e■ ission creates consid erable additio nal co■plexity to ■ onitori conand analys is. Greate r care bas to be taken in ■ aking sure that the gas posi tent co■positions reflec t a weiehte d avera&e of the variab le gas co■ tions evolved .
This study has provide d further evidenc e for the extern al deriva tion of COz. The tendenc y is for the COz to be prefer entiall y e■placed around the Bulli in both the Bulli and Wonsea■ level. The lateral variati ons in co■position pre-ex isting geolog ical of ce influen the t &awill i seaas appear to reflec structu res. The strati& raphic and lateral variati ons in co■position have been clearly reflect ed in gas draina2e and airway ventila tion co ■positions. The understandin g of this virgin gas conten t and co■position distrib ution is of basic relevan ce to the assess ■ent of future conditi ons and the selecti on of control ■ethods. The very noticea ble differe nces in eaissio n behavio ur of C01 and cu. during i lonrwa ll extrac tion probab ly reflec t ■ ore the inheren t gas content/co■pos under behave gases the way the in nces tion distrib ution than basic differe equiva lent conditi ons. tely As co■plex as the e■ ission process appears to be, it has been adequa in changes the of bulk the where s, ■ ter tical describ ed in e■pirical ■atheaa return eaissio n are the respons e of three variab les - air quanti ty, gas capof ture and produc tion rate. It reaains to adequa tely deter ■ ine the effect changes in specif ic e ■ ission. terA si ■ple qualita tive ■odel is propose d that explain s the observe d charac exreadily is capture COz of lty difficu The istics of ■ ixed 2as e■ ission . ission e■ COz lling contro in es advanc large plained usine the ■odel. Making probab ly rests with devisin g ■eans of inducin g ■ ore COz into the bleede r. the The charac teristi cs of ■ ixed gas e ■ ission provide added perspe ctive on The ■ odel propose d for ■ ixed e■ ission of in the ■ore nor ■ al, pure CU4 ■ ines. large quanti ties of CH• where ission, e■ cu. to eas e■ ission could well apply strata. coal non ■ fro escape capture throu2h rapid e■ ission ixed The co■■ it ■ ent shown by Tah ■oor Collier y to overco■ ing the proble■ of ■ conand tanding unders in es advanc cant 2as e■ issions has resulte d in si2nifi to trol. The ultiaa te success of their efforts will have direct applica tion aixed eas and pure CH• ■ ines alike.
ACDOWLEDGEMEMTS Coal and Coke Pty. Ltd. are gratefu lly acknowled2ed for access to their data and per ■ ission to publish this paper. The author particu larly ls, acknowled2es assistance/encouraee ■ ent given by Rick Davis, Brian Nichol Stone. Ian Richard Porteou s, David McLean and Ke■bla
155
REFERENCES Boxho, J., Stassen , P., Klicke, G., Noack, K., Jeger, C., Lesche r, L., Browning, E. J . , Dun■ore, R. and Horris , I.H . , 1980 - Fireda ■ p drainag e, Verlag Glucka uf G■bH, Essen . ■ Gould, K.W . and Hargra ves, A.J., 1987 - Variati on in the co ■position of sea 292, Vol .. Hetpll Hip. eases issuing fro■ coal. Bull. Pros, Austrp lps. Inst. No . 5, 69-73 .
Grant , G and La■a, R.D., 1989 - utilisa tion of ■ ine waste gas ■ ixtures Stage I : feasil ibility study . End of arant report, NERDDP projec t No. 888100. Hargraves, A.J ., 1963 - So■ e variati ons in the Bulli sea• . Bull. Proc. Austrplps Inst. Hin. H9tp11 ,, Vol 208, 251-283. Hargraves, A.J., 1986 - Sea ■ gases in ■ ajor Austra lian coalfie lds. 13th CHHI Congress , Singap ore, 103-112 . R.D . , 1988 - Adsorp tion and desorp tion of ■ ixed gases and their i ■pli . cations in ■ ine ventila tion. 4th Int. Kine Vent. Cong . , Brisban e, 161-174
La ■ a,
tion Hay, G. and Paul, A.B. , 1990 - the applica tion of bore core sea ■ desorp of Study the in es Advanc ents. ■ environ ■ ea data to ■ ine plannin g in ■ulti-s the Sydney Basin - proc. of 24th Sy■p., Univer sity of Newcas tle, 62-69. on Nichol s, B., 1989 - Coping with C02 at Tah■ oor Coal Mine . ACIRL se ■ inar . 224-245 , longwa lling in the 1990's , Sydney of Saahaf i, A. , Truona , D. and Willia ■s, R.J . , 1987 - Preli ■ inary evalua tion ished Unpubl g. drillin le long-ho 3 ll longwa gas drainag e effecti veness ACIRL report to Tah ■ oor Collier y. lSaith, J . W. , Gould, K.W. and Hart, G.H., 1985 - Isotopi c studies of Austra ., ian natura l and coal sea ■ gases. Bull. Proc. Austrp las. Inst. Hip. Hetall Vol 290, No. 6, 43-51. R.J. and Rogis, J., 1980 - An analys is of the geolog ical factors on leading to outbur st prone conditi ons at Collin sville, Queens land. Sy•p. AusThe Occurr ence, Predic tion and Contro l of Outbur sts in Coal Mines, tralas. Inst. Hin. Hetall . Southe rn Queens land Branch, 99-109. Willia ■ s,
157
THE PBRIIRABILITY OF COAL UNDER VARIOUS CONFINING STRESSES S. Xue and L.J. Thomas Department of Mining Engineering, University of N. S. W. , Kensington, N. S. W.
INTRODUCTION Due to the increased comminution of coal by mechanized procedures and a trend towards deeper workinas, the emission of seam gases into coal mines has sistnificantly increased. Coal permeability, defined as the abilitf of the coal to alTow the passage of gas when a pressure or concentration gradient of the gas exists across it, is considered by some researchers to be a principal factor controlling gas emission in mine workings (Ramani and Owili-Eger, 1973) although others are less certain, but they have no doubt that the permeability of coal measures and ad~t strata have a considerable effect on the migration and movement of seam gases (Guney, 1975). A large number of measurements of coal ~eability to methane have been made to investigate the effect of stress on permeability. It is agreed by a majority of researchers that coal permeability decreases with increased confining stress. Patchina(1965) reported that for some Canadian coal samples, a reduction in permea6ility of more than three orders of magnitude was observed as confining stress was increased to that which might be the underground stress at a depth ol 900 meters. Lingard et al(1984) did some tests for Australian coal samples, their results showed that the reduction of coal permeability was of two to three orders of magnitude as the confining stress was increased from Oto 90 bars. The research reported in this paper investigates the variation of coal ~eability with confining stress, with ~cular emphasis on the hysteresis effect of coal permeability decreases on every loading cycle. EXPERIMENTAL METHOD
The experimental work was carried out in a five-cell semi-automated triaxial stress test bed in the Department of Mining Engineering at the University of New South Wales. The coal specimens were taken from the Bulli seam in Appin and West Cliff collieries in New South Wales. The test bed consists of five hi~ pressure steel cells in which cores are contained within rubber sheaths and can be subjected to triaxial stresses. Figure 1 shows a cross section through such a cell with details of the gas distribution channels in upper and lower platens. Coal samples were cut from the blocks of coal by a small air flush oorin~ drill machine using a specially d ~ tungsten carbide tip~ calyx bit. After 1t was oored, the sample was cut to a leng!_b slitV1tly greater than the required 25mm using a small arcular diamond saw. Samples were dried in a partially evacuated oven to remove most traces of moisture. The coal samples were carefully slid into the pol~thane sheath and were sealed into the cell with a thin smear of silioon rubber. Separate hydraulic circuits were
158
used to load the sheath rubber to provide the confining stress (F), which could be measured directly, and a vertical load on the platens. The design of the platens fed gas through the plungers and distributed it through a cobwe~sha?! of channels into the coal core. The actual hydraulic pressure applied to each top platen plunger was measured and was converted to an effective vertical stress on the cores. Gas of an appropriate mix of methane and carbon dioxide, or air or nitrogen, was applied from a cylinder through a precision r~ator to the top platen of the pressure cell and collected through the bottom platen. The expenments reported m this paper used methane as a pure gas. EXPERIMENTAL RESULTS AND DISCUSSION
The experimental results were used to investi~te the relationship between coal penneal>ility (I<) and oonfining stress (F) at both constant gas pressure and variable gas pressure. The effect of loading and unloading processes on coal permeability was also studied. Permeabili~ can generally be expected to follow Darcy's law, with modifications for particular fluids and pore types, such as those introdut'ed by Klinkenberg (1941). Table 1 shows the experimental results for change in sample 1 permeability with the variation of confining stress and gas pressure measured for five successive loading cycles (three increasing the gas pressure and two decreasing). Figure 2 shows the relationship between the permeability and confining stress with two gas pressures(2 and 30 atm.) in the process of loading. The regression equations and correlation coefficients are as folfows (subsaipts indicate the gas pressure): Equations
correlation coefficients
K2 = 0.6488 e-0.0287F
0.7733
K30= 0.5089 e-0.031 lF
0.7961
Figure 3 shows the relationship between permeability and its confining stress with two different gas pressures (2 and 30 atm.) in the process of unloading. The regression equations and the correlation coefficients are as follows: Regression equations
correlation coefficients
K2 = 11.3054Fl.3351
0.7626
K30= 11.0559 rl.4050
0.7849
It is obvious that there is an hysteresis effect because coal permeability decreases
on every loading cycle. It is impossible to obtain totally re_peatable results. However, the effect of the loading cycle on coal permeability is limited. Although there is no clear evidence from ffie ~entaf results that the effect of loading cycle on ~eability is ~ e n t , the permeability losses in five successive loading cycle were between 23.73% and 42.5%. The experimental results show that coal J>e!Illeability decreases when the mean gas pressure was inaeased in the first three loading cycles ~as pressures were 10, 20 and 30 atm). As the mean gas pressure was decreased [30, 15 and 2atm), the
159
coal ~eability increased, however, these values of permeabilities were less than the ~bility at the same mean gas pressures during the first three loading cycles. This might be the results of both permeability hysteresis and I<linkenberg's effect. The effect of permeability hysteresis makes ilie size of the cracks in ooal samples smaller, and consequently the coal permeability decreases. Furthermore, this effect d ~ I<linkenberg's effect, this can be seen from the modified Darcy's equation with Klinkenberg's effect: Q = KaCPi-P2)P/v(1+4ca/r) is gas flow rate
Where:
is apparent permeability is upstream pressure is downstream pressure ~ ~ gas pressure
V
r C
a
1&gasV1Sa>s1ty
is assumed capillary radius is pro~onality factor is mean free patn of gas molecules CONCLUSIONS
(1) Permeabilities of the coal specimens were stron~y stress-dependent. Most of the coal s ~ had one to two orders of magnitudl smaller in permeabilities as the confining stress increased from 10 to 150 kg/an . (2) Permeability of coal is v~ stress-history dependent. The permeability decreased on each loading cycle. However, the effect of loading crcles on coal pel'!N!Ability is limited. During the process of loading, the relationship between coal permeability 00 and oonfining stresslFl fitted an exponential function, that is, K=A-ebF Dur_!ns the ~ of ~ the relationship between coal permeability and confining stress fitted a power function, that.is, K=AF'-1 Further experiments on other gases showed similar trends. REFERENCES
Guney, M., 1~ - Investigation of methane in carboniferous rocks.]. Mine Ventil. Soc. South Africa, Vol.28, ~o.7, pp.101-111. IOinkenber1l, LJ., 1941 - The permeability of porous media to liquids and gases.
Drilling t,,u{P,oduction Prlldice. American Petroleum Institute, pp.200-213.
Lingard, PS., Phillips, HR. and Doig, 1.0., 1984 - Laboratory studies of the sorption characteristics and ~bility of triaxially stressed coal samples. Proc. 3rd"Int. Congress on Mine Ventil., Harrogate, pp.143-150, Inst. Min. Metalf. Patching, T.H., 1965 - Variations in the permeability of coal. Proc. Rock Mech. Symp., Toronto, pp.185-204. Ramani, R. V. and Owili-E~, A.S.C., 1973 - En~eering as~s of coal mine ventilation systems. Amer. Chem. Soc., Division of Chemistry, Preprint Vol.37, pp.158-164.
160
Sample 1 Permeabili_ty to ~ane with Constant Vertical Stress of 10 Kg/ an
TABLEl
p
30
20
10
2
15
Loading process No.
F
K
F
K
F
K
F
K
F
K
1•
10
0.601
10
0.59
10
0.56
10
0.58
10
0.80
2
30
0.25
30
0.25
30
0.17
20
0.34
23
0.34
3
so
0.12
60
0.085
so
0.076
64
0.071
53
0.094
4
68
0.076
80
0.050
90
0.027
80
0.036
75
0.050
5
110
0.034
100
0.031
110
0.017
100
0.023
100
0.036
6
150
0.016
140
0.015
130
0.011
145
0.011
148
0.013
Unloading process 7
150
0.016
140
0.015
130
0.011
145
0.011
148
0.013
6
110
0.019
100
0.023
100
0.016
100
0.019
100
0.024
5
80
0.040
63
0.046
66
0.033
64
0.041
62
0.048
4
48
0.082
39
0.094
41
0.062
40
0.084
41
0.087
3
30
0.15
23
0.19
26
0.13
25
0.17
25
0.16
2
15
0.32
15
0.32
17
0.22
15
0.27
15
0.32
1
10
0.42
10
0.45
10
0.37
10
0.40
10
0.46
p = gas pressure, atm. F = effective radial stress on the sheath, kg/cm2 No.= experimental sequential number
181
8
- -~1~A~
GAS SUPPLY
-~j
~~=-- -,-· :
6 32
GAS
STRAIN CONNECTION
2
25 15
2 cell body 1 channel main frame flange 3 main retaining 5&6 gaskets 8 plunger 10&:12 upper and lower gas distribution platens 14 12-pin electrical contact port 15 gasKet 18 keeper plate for plun~ 20 ~lyuret hane rubber sheath 24 platen retaining screws 25 12-pin port retaining saews 26 mam retaining flange bolts 30 sealing ring 29 loca~ pin 31-38 ~nng seals FIGURE 1
Sectional View of Test Cell Showing Gas Lines
162
.
1
-- ---
............_............_
-0
E
~
-:·-0
0.1
-~~
-
*
at gas pressure of 2 atrn.
.
at gas pressure of 30 atm .
-
----. .........._---- ............_
cU
Q)
E [
.
~~*
0.01
0.001
0
20
40
60
80
100
120
140
160
confining stress, kg/ crn 2 FIGURE2
-0
E
~
-
·:.0 cU <1>
E '-'
Q)
a..
1 0.9 0.8 0.7 0.6 0.5 0.4 0.3 0.2 0.1 0 0
20
Relationship between the Permeability of Coal and Confining Stress in the Process of Loading
40
60
80
100
120
140
160
confining stress, kg/ crn2 FIGURE3
Relationship between the Permeability of Coal and Confining Stress in the Process of Unfoading
163
THE UTil.JSATION OF COAL SEAM GAS AS A HEAVY DUTY VEHICLE FUEL J. A. Zingarelli
BHP Engineering Pty. Ltd. , North Sydney, N. S. W.
SUMMARY Only limited use is made in Australia of the methane which is drained from coal mines for reasons of safety and productivity. BHP Engineering is carrying out a pilot project to demonstrate the safe, economic, reliable and convenient use of liquefied coal seam methane as a substitute for automotive diesel fuel in three heavy on-road coal haulage trucks. The project is presently in the engineering and approvals stage with the first vehicle expected in operation on liquefied coal seam methane in May-June l 991. Studies by BHP Engineering suggest that such an application for coal seam methane may be economical at the prices for diesel fuel which prevailed in Australia prior to the Iraqi crisis of August 1990. INTRODUCTION As a by-product of coal formation, methane is produced and trapped in the coal measures or the surrounding strata. During underground mining operations, this methane is released into the mine workings and must be removed to maintain a safe atmosphere in the mine. This can be done by mine ventilation or by a variety of systems for methane drainage ahead of or subsequent to mining. The prior degassing of coal allows significant improvements in productivity to be achieved, especially with the high rates of coal extraction achieved by long wall mining techniques.
164
To date, relatively little use has been made of the methane drained from coal mines in Australia. However, two collieries, Appin and West Cliff both located in the Illawarra region of NSW, presently use coal derived gas to generate power in gas turbines. The desire to obtain some economic benefit from this fuel resource, extracted at considerable cost, has been supplemented by a concern at the environmental effects of venting uncombusted methane, an imponant greenhouse gas, to the atmosphere. These issues provide an incentive to develop economic options for the utilisation of coal derived methane. While power generation has been economic at Appin and West Cliff, it is desirable to develop higher value options which may be more widely applicable. In 1989, BHP Engineering conceived of a project to demonstrate the use of coal derived methane, in liquefied form, as a substitute for automotive diesel fuel (ADF) in road coal haulage trucks. VEHICLES AS A GAS UTILISATION OPTION Vehicles were chosen as a means of using methane for the following reasons. Firstly, it targets a high value market - the substitution of ADF which for on-road use costs around A$13/GJ (pre-Iraqi crisis) to A$17/GJ (post-Iraqi peak). For use in mining, excise rebates reduce these costs to A$6 to I 0/GJ. Secondly, most mines have associated vehicle fleets. Even where coal is carried by rail, trucking fleets are commonly employed to transpon coal from the mine to the rail head or coal washery. In addition, some underground mines operate in tandem with open cut mines where large in pit vehicles represent a sizeable market for fuel. Therefore, the market for the methane is tied back to the source of the fuel, i.e., the coal mining operation. Thirdly, Australia has large reserves of gas, but more limited crude oil reserves. For this reason the Commonwealth Government has encouraged the use of gas as a substitute for liquid transpon fuels, derived from crude oil. This encouragement has taken the form of applying no excise taxes on gas for transpon use and by financially supponing research and demonstration projects in this field. LNG VERSUS CNG In most cases where gas has been substituted for conventional transpon fuels, the gas has been stored as compressed natural gas (CNG) at ambient temperature in high pressure steel cylinders.
165
These cylinders occupy a large volume and involve a significant mass penalty compared to ADF. While for some applications, e.g., buses, these are not major issues, for freight vehicles, the inferior range and reduced payload which result can rapidly erode the financial benefits of a lower fuel cost. The volume and mass penalty can be minimised by using gas in a liquefied rather than compressed form. Table I shows the relative energy density and container mass for ADF, CNG and liquefied natural gas (LNG). Table 1 Comparative Energy Storage Characteristics
ADF LNG CNG
Energy Density MJ (lffiV)/L (actual)
Container Mass kg/L (ADF equiv)
38.5 23.0 8.2
0.1 1.0-1.3 4.0-5.0
While no other fuel matches the high energy density of ADF, LNG allows a reasonable range to be achieved at a modest mass penalty. THE APPIN LNG TRUCK PROJECT OBJECTIVES The Appin LNG Truck Project has two principal objectives: o
To demonstrate a high value use for methane drained from a coal mining operation.
o
To demonstrate the convenient, efficient and economic use of LNG as a substitute for ADF in a heavy duty diesel vehicle.
METHANE DRAINAGE AT APPIN Figure l shows the methane drainage system at the Appin Colliery of BHP Steel, Collieries Division. Holes are drilled from underground into the seam being mined, the Bulli Seam, and adjacent seams. These holes are connected via piping to vacuum pumps located in an exhauster house on the surface. As this gas is withdrawn under vacuum, it becomes contaminated with air, and typical purities are around 65% methane.
166
ped methane. As The Bulgo sandstones which overly the Bulli seam also contain entrap e releasing the fractur the long wall machine collapses the roof behind it, these sandstones les are drilled from gas into the mine workings. To minimise this effect, venical boreho to the atmosphere. y the surface into the sandstones and allow the gas to vent preferentiall This gas, venting under its own pressure, is nearly pure methane. PROJECT SCOPE The project scope is illustrated in schematic form in Figure 2. any entrained water Existing surface boreholes are connected to a separator to knock out and the gas then flows via a buried pipeline to the Appin Colliery site. liquefied in a pilot At a location near the coal loading bins, the gas is compressed and LNG, sufficient to fuel scale LNG plant. This is sized to produce about 2100 litres/day of fast loading system for three coal trucks. The plant includes a storage tank for LNG and a refuelling the trucks. the trucks which are The project also involves developing a dual fuel conversion for the methane and air powered by 400HP turbocharged Volvo engines. In dual fuel mode, d of a spark plug as mixture in the engine is ignited by a small spray of diesel fuel, instea diesel operation in in a gasoline engine. This mode enables the engines to reven to 100% the event of a system fault or a shortage of LNG. ed by a twelve month Initially one truck will be tested for six months. This will be follow nance costs and mainte trial with three trucks to develop reliable results for fuel usage, service. truck productivity. Figure 3 shows a Heggies truck in coal haulage PROJECT STA TIJS As at December 1990, the following milestones had been reached: o
o
Gas supplies of adequate pressure and quality had been identified at surface boreholes.
three existing
r at the AGL A Volvo test engine had been installed on a research dynamomete work had been engine laboratory at Monlake NSW (Figure 4) and the conversion commenced.
o
e and loading Engineering was underway for the on-site liquefaction, storag facilities.
o
Approvals had been sought from a number of statutory authorities and consent had been obtained from the local Council.
development
197
On the present schedule it is expected that the engine conversion work will be completed by January 1991 and the on-site facilities by May 1991 . This would permit commissioning of the first truck on LNG fuel in May or June of 1991. No "show-stopping" problems have been encountered to date. However, progress has been slower than initially anticipated. This has been due to the novelty of the concepts being developed, the need to co-ordinate the large number of organisations involved and the need to liaise with a number of different authorities. ECONOMICS As part of the process of obtaining Commonwealth support for this demonstration project, BHP Engineering carried out an economic case study of a small commercial coal based LNG project. The project studied involved: o
extraction of methane from an Illawarra colliery by vertical well degassing in advance of mining
o
a small LNG plant liquefying 0.5 PJ/a of gas
o
provision of two refuelling stations for coal trucks
o
conversion of a coal truck fleet to dual fuel operation.
The study showed that LNG could be produced for around A$10/GJ. At the then (prelraqi) price for ADF of $0.52/L ($13-14/GJ) this allowed the conversion cost of the trucks to be paid back in two years. One of the imponant results of the study was to identify the strong effect of scale on the project economics. If a larger market for the LNG could be developed, or the plant combined with one for pcakshaving pipeline gas supplies, then the unit cost of producing LNG could be significantly reduced. CONCLUSIONS The substitution of LNG for automotive diesel fuel offers a potential economic use for the methane drained from coal mines which may be more widely applicable than power generation.
168
A pilot project is underway at the Appin Colliery of BHP Steel, Collieries Division to demonstrate that such an application of coal seam methane is not only economic but also safe, reliable and convenient. ACKNOWLEDGMENTS The Appin LNG Project receives significant financial support from the Commonwealth Government through the National Energy Research, Development and Demonstration Program, which is administered by the Department of Primary Industries and Energy. Support for this project has also been provided by: o o o o o o
BHP Steel, Collieries Division BHP Engineering Pty Ltd Heggies Transport Pty Ltd Cryofab Industries Limited Volvo Australia Pty Ltd Sulzer Australia Pty Ltd
APPIN COLLIERY - METHANE onAINAGE PLANT
FIG. 1
Gas comp,essc,s
Downcast shaft
.
.
Fan ins1alla1ioo
Upc.ist shaft
I DRAINAGE SITE ---- • MEntANE ' ·-.........
F.
·-....... ...........
0 Ill Ill
.....
a,
Switchyard
(D
,
Dual intake manifold
-.
. •
UNDERGROUND WORKINGS
Methane ls drawn from the mine for a period of up to nine months before the coal la taken out allowing 80 to 00 per cent of the gas to draln. The gaa ls drawn from the mlne by seven liquid aeal extractor pumps located ln the pwnp house next to the gu turbine. The pwnps have a total capacity of 4500 litres a second. The gas ls compres.sed to 900kPa before lt la fed lnto the turbine. Gas from the surface boreholes ls vented to air.
I
GAS CLEAN UP COMPRESSOR
COLD BOX
LNG PLANT
GAS WELL ('
-- - - .....
: :
: :
,.___ _ _ ________ _____
. - - - - - - - - -- - - - '
'-
CRYOGENIC LNG STORAGE TANK
~
)
□
COAL TRUCK
LNG PUMP
~/.A.BHP ~ , Engineering
FLOW SCHEME COAL BASED NGV
FIG. 2