49 minute read
Control and robotics

4
3D PRINTING
Page 94
The future of manufacturing .............................................................................. 94 1. An introduction to 3D printing........................................................................ 96 2. OpenSCAD .............................................................................................................. 98 3. FreeCAD................................................................................................................... 108 4. Laminator software.............................................................................................. 112
Technology workshop: Design and build traffic lights........................................... 115 Review and practise ............................................................................................................ 118
5
Operating systems, networks, security, applications and the law
Page 120
Secure and user-friendly computing .............................................................. 120 1. Operating systems .............................................................................................. 122 2. Networks ................................................................................................................. 128 3. Security for computer systems ...................................................................... 134 4. Spreadsheets ......................................................................................................... 144 5. Legislation in the information society ......................................................... 151
Technology workshop: Change your router security settings ........................... 154 Review and practise ............................................................................................................ 158
6
WEB Design, development and DISTRIBUTION
Page 160
The evolution of the Web .................................................................................... 160 1. Editing web pages ............................................................................................... 162 2. Cascading style sheets ...................................................................................... 174
Technology workshop. Make a webpage with CSS ................................................180 Review and practise ............................................................................................................ 183
Glossary ................................................................................................................... 184
1
Computer-aided design
Reading and listening
The evolution of computer-aided design
Ever since it was invented in the 20th century, computer programming has been continuously developing and evolving. The first programmers were more like artists than industrial workers. As time went on, they started to discover algorithms and techniques that could be applied over and over, like recipes when cooking. These discoveries had a strong mathematical component, which scared off many who wanted to try to learn how to programme a computer. But today there are environments which make programming easier, so that practically anyone can unleash their creativity when using them. Computer-aided design is now an essential tool in our digital society. It has become a vital medium which we can use to communicate ideas through images, colours and other techniques. We can use it as a tool to give shape to our ideas.
1 Answer the questions about the text. 1 In the past, why did some people feel like they couldn’t do computer programming? 2 What do you think we mean by unleash our creativity? 3 What is computer-aided design useful for? 2 What is computer-aided design being used for here? Can you think of more uses?


Speaking
Computer-aided design was fundamental for creating communication materials for the Sustainable Development Goals: the logo, the colour palette and the icons for each goal.
3 1-2-4 Go to the official website of the United Nations and look at the design of the SDG icons. Talk about the icons with a partner. 1 Do you think that the icons fit the goals that they represent? 2 Are there any that you would improve? 3 Make sketches of your own alternative icons and show another pair of students, explaining why you would change them.


For me this icon sends the right message because…
I think this icon would be better if …
Writing
4 Look at SDGs 9.1 and 9.c. Think about your community, neighbourhood or town: Do you think that everyone can access technology? Write a letter to the mayor with your ideas for closing the digital divide. Include ideas for actions which could be done by the community, as well as those which need money from the LANGUAGE BANKLANGUAGE BANKLANGUAGE BANKLANGUAGE BANKLANGUAGE BANKLANGUAGE BANKLANGUAGE BANK LANGUAGE BANKLANGUAGE BANK LANGUAGE BANKLANGUAGE BANK LANGUAGE BANK 9 local government.
LibreCAD
LibreCAD preferences
When you install LibreCAD for the first time, a black work screen appears with a grid of light coloured dots . It is possible to change the colour of the background and the grids by clicking on the LibreCAD Edit → Preferences menu.
The colours follow the RGB model used in HTML. You can find pages with HTML colour tables by searching online. The drop-down menus offer standard values, but others can be typed directly into the fields. LibreCAD is a free, open-source computer-aided design application for Windows, MacOSX and Linux operating systems. The menu options and the commands are available in various languages.

When you use LibreCAD for the first time, you will be asked to choose the units, the language used in the application and the language for the commands. These values can be changed* later in the LibreCAD Preferences window.
Menu bar
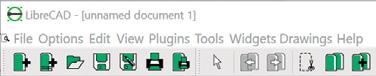
Toolbar


Action tracking
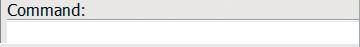
Command line
Coordinates

Selecting and deleting objects
When you are not in drawing mode, you can select individual objects by clicking on them using the cursor. You know when an object is selected because it changes colour from white to a light brown, and the line becomes a dotted line. If you click on the object again, it goes back to its normal state, and is no longer selected. To delete an object, first select it, and then press the Delete key.
ä 1.1 Drawing lines
Any object drawn with LibreCAD is considered a line, whether it is a straight line or a rectangle, an arc, ellipse or even text. You can modify the properties of the lines such as their colour, thickness or size. We will be doing an exercise to practice this. The black canvas work area is marked by white dots spaced 10 mm apart both horizontally and vertically. This is the orthogonal grid. If nothing has been changed in the configuration, there should be a red cross in the work area that marks the reference point of the coordinates. Place the mouse cursor over the red cross and make sure it is at the coordinates (0, 0).
Guided practice
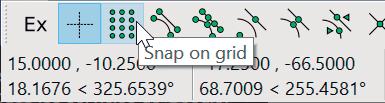
1 On the lower toolbar, click on the Snap on grid icon. This makes it easier to draw straight lines.
2 On the side toolbar, click on the first icon to open a toolbar to draw lines. On the new toolbar, select the 2 points line. You will notice the cursor changes into a cross when you move it over the work area.
The reference in the centre is a red cross that can be moved from one end of the grid to the other using the mouse. This indicates you are in drawing mode.
3 To start drawing a line, place the cursor on the starting point, let’s say (0, 0), and click the left button of the mouse once.
4 Move the cursor to the point where you want to place the other end of the line, such as (50, 0), and click the left button once to lock the end of the line in place. Double click the right button to leave drawing mode.
5 If you accidentally click or double click with the left button, the programme lets you continue drawing lines from that point. It does not leave drawing mode.

6 To save your work, go to File → Save, or, File → Save as… Moving and resizing objects
To move an object: • Select it.
• When the object changes colour, click on it and you can move it around the work area.
• When you have moved the object to the position you want, click on it again to lock it in place. When objects are selected, they have light and dark blue dots. You can resize and relocate objects by clicking on these dots and dragging them with the mouse.
Vector graphics
• Vector drawings are made up of dots, lines, rectangles, arcs, ellipses, etc. • These all have attributes, including the type of line, its thickness, and colour, which can be changed. • You can select, move, copy, cut, rotate, or change their scale.
Focus on English
We often use passive structures when we describe technological processes, for example “These values can be changed later…” We use this structure a lot in English, and it is used when an object receives an action or has something done to it. The structure we use is: the verb to be + past participle
Understand, think, investigate...
1 Using lines, draw a cutout for a cube with 50mm sides.
1 LIBRECAD
Line and rectangle tools.

Circle tools.
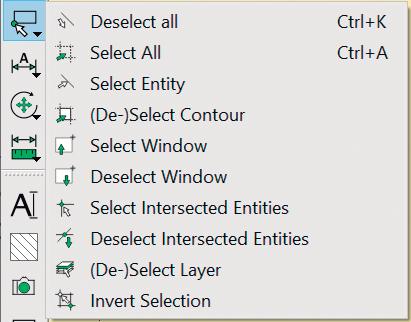
Tools for selecting and de-selecting.
ä 1.2 Rectangles and squares
LibreCAD has a tool for drawing squares and rectangles. ➜ Click on the Line icon on the side toolbar and select Rectangle. ➜ This tool is simpler than the 2 points tool. Click the left mouse button one time to set the initial position of the rectangle, then click it again to set its final position.
ä 1.3 Circles
LibreCAD also has a tool for drawing circles with a variety of options: you can specify the centre point and another point, the centre and radius, two opposite points, or finally you can specify three points. It also has an icon for making concentric circles, and several icons for circles within triangles or circles that are tangent to other circles. ➜ On the side toolbar, click on the Circle icon and then select the
Circle with centre and point. ➜ Click the mouse button once to lock the centre point of the circle.
Then set the circumference by moving the mouse and clicking again.
ä 1.4 Moving entities
If you are going to move or change a single entity like a rectangle, for example, click on it to select it and it will change colour. If you want to work on several entities, you can select them by clicking on each one while holding down the shift key. Or you can hold down the left mouse button to drag a selection rectangle over the entities you want to select. ➜ To move an entity, or a selection of entities, simply click on it and hold down the left mouse button while you drag the selection to its new location. ➜ To lock it in its new position click one more time. ➜ Finally, deselect the entity. As before, you can deselect them one by one or go to the menu: Tools → Select → Deselect all.
Understand, think, investigate...
2 Think and share with a partner. Draw five concentric circles using circle with centre and point. • Give the first circle a radius of 10 mm. • Increase the radius of each of the others, one at a time by 10 mm.
3 Repeat activity 2, but this time join the circles at their highest point.

ä 1.5 Dimensioning objects
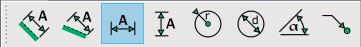
Dimensioning pieces is essential if you want to reproduce them. LibreCAD provides a dimensioning tool that makes this task easier. Choose the kind of dimensioning you want, mark the ends of an edge or click on the arc of circumference to set the dimensions.
ä 1.6 Adding text
The easiest way to add text to your designs is by clicking on the Text icon. A dialogue box will open where you can see different settings: ➜ Font. You can choose the font, the height of the letters and the interlinear spacing. ➜ Alignment. Text is aligned with reference to points on the grid. ➜ Angle. Text can be rotated in relation to the reference axes. ➜ Insert symbol. This has common symbols which can be inserted directly into the text. ➜ Insert Unicode. This is used for inserting different alphabets, musical notes, etc. ➜ Text. This is the text box where you can type your text and insert it into the sheet. The icons let us clear the text box, open a text file, or save the written text in a file, as well as the usual functions of cut, copy and paste. The best way to learn how each of these works is to experiment with them. Try them out and see what you can create.

Understand, think, investigate...
4 Draw the cut-out from activity 1 again to make a cube using squares that are 50mm each side. 5 Ideas pool. Change the document template to isometric (Options → Current drawing preferences → Grid) and draw the following pieces: 6 Open the file with isometric pieces and give them their correct dimensions.
7 Using an orthogonal grid, draw the views of the pieces that you drew in the isometric template.
Give them dimensions.

PROCESSING

ä 2.1 An overview of Processing
Processing is a language and programming environment focused on visual artistic creation. Casey Reas and Ben Fry from MIT started to develop Processing in 2001 and have written books about it, including Getting Started with Processing and Processing: A Programming Handbook for Visual Designers and Artists. Processing is useful for learning programming, but it mainly focuses on graphic design, animations and other features for visual artists who want to experiment with making art using computers. Creating shapes, working with colours and moving objects around the screen is very easy with Processing.
“We created Processing to make programming interactive graphics easier. We were frustrated by how difficult it was to write this kind of software with the programming languages we usually used (C++ and Java), and were inspired by how simple it was to write interesting programmes with the languages of our childhood (Logo and BASIC).” Reas & Fry, Make: Getting Started with Processing, 2015. Processing allows three forms of programming: basic, structured and object-oriented. This way you can gradually progress from a beginner to an advanced level. An interesting feature is the Export to Application. When you click this option, a dialogue box opens with options to make the application run on other operating systems. It is also possible to make the application run in full screen. It is very easy to adjust the size of the execution window, as we will see later.
Run Stop
Processing Environment
File name
Tab manager (files)
Text area for writing code Mode Manager. When you select Add Mode…, the dialogue box below appears with other possible programming modes.

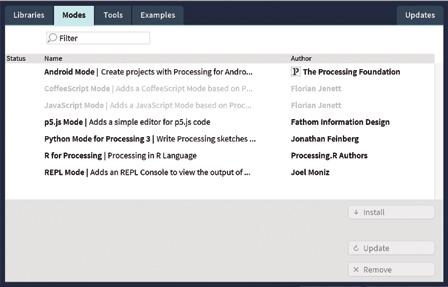
Message area
Text console and error debugging
ä 2.2 Graphic functions
Processing has lots of interesting graphic functions. We are going to see some before we write our first sketch. Unless otherwise* indicated, the unit used is pixels.
Function
size (width, height)
Meaning
Determine the size of the graphic window where the sketch is going to be.
point (x, y) Draw a point on the coordinate (x, y).
line (x1, y1, x2, y2) Draw a line from one coordinate (x1, y1) to another (x2, y2).
triangle (x1, y1, x2, y2, x3, y3)
Draw a triangle by connecting three points (x1, y1), (x2, y2) and (x3, y3).
quad (x1, y1, x2, y2, x3, y3, x4, y4) Draw a quadrilateral with vertices on points (x1, y1), (x2, y2), (x3, y3) and (x4, y4).
rect (x, y, width, height) Draw a rectangle with the top left corner located at (x, y) and dimensions (width, height).
ellipse (x, y, width, height)
arc (x, y, width, height, start, end) Draw an ellipse located at (x, y) and diameters (width, height).
Draw an arc located at (x, y), with dimensions (width, height) and start and stop angles (in a clockwise order) in radians (start, stop).
Guided practice
1 Open Processing and type the following line of code: line(0,0,100,100); 2 Press the Run button.
3 If an error message appears, check the code and make sure you did not forget to type the semi-colon at the end of the expression. Make sure that you did not change a letter in the instruction to a capital letter (or another letter), that the numbers are separated by commas, and the brackets are in the correct place.
4 If everything went well, you should see something similar to the image on the right. You have drawn a line from the starting coordinates (0, 0) to the point (100, 100).
5 Processing has allocated a series of values by default for commonly used elements. It automatically generates a window in which a grey canvas is framed by a light grey border. The line drawn in the window is black with the thickness of one pixel. You can configure all these elements, from the window to the line, however you wish. The syntax of Processing
Every expression must end with a semi-colon “;”. If they do not have a semi-colon, the programme will cause an error when it is executed.
We must be careful when writing upper and lower case letters in the function names.
line() is not the same as Line() or liNE().

Focus on English
otherwise: this connector can be used to state an exception
Understand, think, investigate...
8 Open Processing and then open the File menu. Go to
Examples… , a window will open with different drop-down folders.
Go to Contributed Examples/
Getting Started…/02_Start and open the two examples:
Ex_02_01 and Ex_02_02. Run both applications and, thinking about the code you have loaded, explain in your own words what you think Ex_02_02 does.
2 PROCESSING
Understand, think, investigate...
9 Open Processing and follow these steps: a) line(0,0,100,100); Explain what you see in the window that appears. b) line(0,0,200,200); Check to see if the size of the graphic window changes. c) rect(10,10,80,80); What appears in the graphic window? Has it changed size? d) rect(10,10,180,180); Describe the faults you can see in the graphic window.
10 Look at the table of functions on the previous page and change the size of the graphic window in the first example to 640 x 480 pixels. This is the resolution of old VGA graphic cards. a) Type the code to draw the diagonal line from (0, 0) to the opposite corner. b) Change the code by doubling the value of the final coordinates: line(0,0,1280,960); What happens? c) What happens if you only double the value of one of the two final coordinates? Now try doubling the other one and make a note of your conclusions. 11 Search the Processing reference page on the internet for information on how to use the following functions. Write their meaning and parameters in your notebook: background(), stroke(), line(), noStroke(), strokeWeight(), strokeJoin(), strokeCap(). 12 Practice using the functions you have learnt. a) Type the following code: size(500,400); rect(250,100,150,100); ellipse(250,200,100,100); b) Write an analysis of the three lines of code in your notebook c) Why do you think the figures overlap?

figures
The width and height variables
The width and height variables store the value of the width and height of the graphics window. Here is an example: size(200, 200); smooth(); ellipse(width/2, height/2, width/2, width/2); println(width); println(height); Since the value of the width and height of the graphics view in this case is 200, the sketch draws a circumference at the position of 100,100 with a diameter of 100. The number 200 also appears in the console two times as the width and length values.

ä 2.3 Elements that define a shape
Up until now, we have seen how Processing draws shapes using a black line with a thickness of 1 pixel (the automatic setting), and fills shapes in with white, when possible. Our designs would be much more attractive if we could make them colourful and change the outline of the different geometric shapes. To do this, we have the following functions: ➜ Working with greyscale lines: stroke(gray_level); has a single parameter where 0 is black, and 255 is white. All values in between make up the greyscale* . ➜ Working with coloured lines: stroke(r,g,b); has three parameters: r, g and b, which are the three additive primary colours. We can get other colours by mixing different levels of red, green and blue. Each value of r, g and b varies between 0 and 255. ➜ Changing line thickness: strokeWeight(n); changes the thickness of the line. The value is automatically set at 1. ➜ Filling shapes: fill(gray_level); and fill(r,g,b); fill a shape with grey or colour respectively. The information about greyscale and RGB above applies here too. ➜ Changing the colour of the canvas: background(gray_level); and background(r,g,b); changes the canvas to grey or colour respectively. The information about greyscale and RGB above applies here too.
Before you draw a shape, you must choose its attributes. Choose the colour, line thickness and fill first, then the shape is drawn in the position with the dimensions you want. RGB colours
There are many websites there you can find the RGB colour codes you want to use. Type these keywords into your search engine for example: Wikipedia wiki web colours
Some websites even have a simple app in which you can move a cursor and select the colour you want. The colour value you were searching for is given to you in an adjacent box, usually in decimal and hexadecimal values.

Focus on English
greyscale: a range of grey shades going from white to black
Understand, think, investigate...
Change the values of stroke() to see how the tone of grey changes on the shape outline.
14 Try the code in the width and height variables section on the opposite page. a) Change the code so that the diameter of the circle takes up 2/3 of the width of the window. b) Change the dimensions one at a time and see how the shape adjusts to the shape of the window. 15 Type the following code: size(500,400); stroke(100,180,140); strokeWeight(100); rect(0,0,400,300); a) Explain what happened. b) Now, change the programme to set the line width at 5 pixels, and draw the rectangle at the coordinates (50, 50).
Change the values of stroke() to see how the outline of the rectangle changes. 16 Change the previous code. Give the shape a 5 pixel green outline, a red fill and a blue background. 17 Let’s check. Look at the UN Sustainable
Development Goals website. Try to find the colours of the goal icons by adjusting RGB levels in your colour selector.
2 PROCESSING
Background images

The background (image) function can be used to load a background image. • The size of the image in pixels must be the same as the canvas.

• Processing can accept .gif, .jpg, .png and .tga image formats. • Images can be in 2D or 3D.
strokeJoin() strokeCap()
miter round

bevel

round square
project
ä 2.4 Customised shapes
Processing allows us to create new shapes as well as using the predefined ones. To make a new shape, you need to: ➜ establish the start and end of the instructions that define the shape. ➜ establish the coordinates of each vertex. All this is obtained using beginShape(), endshape() and vertex(x,y). For example, in order to define a four-pointed star:
size(400, 400); beginShape(); vertex(200, 30); vertex(230, 170); vertex(370, 200); vertex(230, 230); vertex(200, 370); vertex(170, 230); vertex(30, 200); vertex(170, 170); endShape(CLOSE);
4 point star
Understand, think, investigate...
18 After inputting the code for the four-point star, try deleting the word CLOSE from the endshape()function. What happens? 19 Create two new figures. For example, an arrow or a star with a different number of points. 20 Practise with the functions: strokeWeight(), strokeJoin() and strokeCap(). Each one allows different parameters, as well as different numbers. Change the code of the figures you created to get similar results to those illustrated below.
21 Create a sketch which combines the two figures you just made.
Fill each one with a different colour and choose another for the outlines. Change the background colour too.
4 point star 4 point star
ä 2.5 Code blocks, variables and data types
We have not needed to divide our programmes into blocks yet, but this is going to change as we go further into the subject. In Processing, code blocks are contained between keys { and }. These blocks can take up several lines. Up until now* we have only assigned numerical values to the parameters between brackets. We haven’t created interactive applications yet. To do this, we need to use variables.
➜ Variables are essential in programming. They contain values that will be used later. We usually associate variables with numbers, but they may also contain characters, text, images, logical values, etc. ➜ We have to name variables. It is best to name them in a way that helps to indicate what they are used for, but without being too long. For example: age, name, etc. ➜ Variables must be of* a certain type: numerical, character or another type. Processing differentiates two types of data: primitive and compound. We will mainly work with the primitive data types, which in alphabetical order are: boolean, byte, char, colour, double, float, int and long. Among the compound data types which are usually used at the start are: array, string and table. For example:
int x; // Declares the integer variable x x = 3; // Assigns a value to the variable x
It is possible to state a value and assign a value to it in a single line of code.
int x = 3; // Declares the integer variable x // and assigns a value
ä 2.6 Operators and mathematical operations
Operators are symbols that apply a mathematical function or logic to operands. We have the following operators: Assignment: Relational operators: = equals sign > greater than Arithmetic operators: >= greater than or equal to + sum < less than - difference <= less than or equal to * product == equal to / division != not equal % remainder of the whole division Logical operators: ++ increase in a unit ! NOT -- decrease in a unit && AND || OR
Focus on English
up until now: from the beginning to this moment in time must be of: when there is an obligation for something to belong to a certain group or have a certain characteristic must be of + noun phrase
Understand, think, investigate...
22 Type the following code: int a=3; int b=5; int c=a+b; print(c); a) Check the text area and explain what has happened. What does the print(c) function do? b) Now, change the variables in the programme to float variables. What happens if you combine int and float variables in the calculation?
Logical operators
It may be easier to understand what the operators !, && and II do by looking at a diagram. These operators represent the logical functions NOT, AND and OR. We will use set notation to make this clearer.
A U
_ A A B A B
_ A = U – A
NOT Logical negation
NOT A
AND Logical product A AND B
OR Logical sum A OR B
A – B A + B
2 PROCESSING
Focus on English
trail: a long line or series of marks that are left by something (or someone) as it moves

ä 2.7 Functions
We have already used functions included in Processing such as line(), size() and stroke(), but we can also write our own functions. Functions are used to set instructions that are going to be executed many times. The use of functions makes programming easier and reduces the chance of having errors in the code. Functions accept parameters and they can return values. The parameters of a function are variables that it uses to operate.
Definition of variables inside and outside of functions
Variables defined inside a function are considered as being local to the function and are not available for other functions of the programme. Variables defined outside a function (normally at the start of the programme) are considered to be global and are available for the whole programme. This may seem like an advantage, but there is a risk that their values may be changed at some point in the programme without us realising it. This may cause unexpected results and mistakes.
The setup and draw functions
There are two particularly interesting functions that are used together in many sketches. These functions are setup() and draw(). Maybe you have noticed these functions if you have tried some of the examples that come with Processing. They are used in the following way: ➜ setup() is typed at the start of a sketch just after the global variables which are going to be used. It is used to start the work environment. For example, in setup(), we can set the size of the graphics window using size() and decide if the edges of the shapes are going to be softened to make them look more realistic using smooth(), or not, with noSmooth(). ➜ draw() creates a loop that repeats automatically. This means if we want our programme to keep running, we just need to type the code inside draw(). Open Processing and go to File → Examples. Then go to Java Examples → Libraries → Getting Started with processing → 02_Start → Ex_02_02. The example is from Getting Started with Processing, by Casey Reas and Ben Fry. This simple example shows how the setup() and draw() functions are used, and also introduces a simple control structure. The sketch shows a trail* of circles that follow the mouse pointer. If we only move the mouse pointer over the window, the circles are filled in with white, but if we hold down the left mouse button, they are filled in with black. You can see the code and the result of running sketch Ex_02_02 on the next page.
Model example
Code for sketch Ex_02_02
void setup() { size(480, 480); // Modified for a square screen smooth(); // Original size (480, 120)
} void draw() { if (mousePressed) { fill(0); } else { fill(255);

} ellipse(mouseX, mouseY, 80, 80);
The ellipse() and ellipseMode() functions
The ellipse() function has four parameters, and the ellipseMode() function changes the mode in which they are interpreted. There are four possibilities:
➜ CENTER. This is the default option. The first two ellipse() parameters are the coordinates of the centre of the ellipse, and the other two are the width and height (the diameters).
➜ RADIUS. The first two ellipse() parameters are the coordinates of the centre of the ellipse, and the other two are half of the width and height (the radii).
➜ CORNER. If the ellipse was placed in a rectangle, the first two ellipse() parameters are the coordinates of the top left corner of the rectangle, and the other two are its width and height.
➜ CORNERS. The first two ellipse() parameters are the coordinates of the top left corner of the rectangle, and the other two parameters are the coordinates of its lower right corner.
The arc() function
There are two ways to use the arc()function:
arc(x, y, width, height, start, stop) arc(x, y, width, height, start, stop, mode)
The second way adds the parameter mode, which allows three shapes:
➜ OPEN (automatic setting). This leaves the arc open.
➜ CHORD. This draws a line from the start to the end of the arc.
➜ PIE. This draws a line from the start of the arc to the centre of the ellipse, and another line from there to the end of the arc.
Exemple 3
The ellipseMode() function
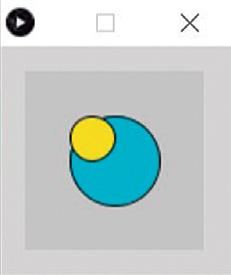
ellipseMode(RADIUS); fill(179,223,31); // Green ellipse(50,50,30,30); ellipseMode(CENTER); fill(199,51,255); // Pink ellipse(50,50,30,30);
ellipseMode(CORNER); fill(31,188,223); // Blue ellipse(25,25,50,50); ellipseMode(CORNERS); fill(228,234,16); // Yellow ellipse(25,25,50,50);

2 PROCESSING
Understand, think, investigate...
Questions bag
23 Type the following code and write an analysis of the function of the programme in your notebook. int widthV=500; int heightV=400; int red=100; int green=180; int blue=140; int thicknessLine=3; size(widthV,heightv); stroke(red,green,blue); strokeWeight(thicknessLine); ellipse(widthV/2,heightV/2,widthV/2,heightV/2);
24 Type the code for a sketch that draws a square window with four concentric circles and a bullseye in the centre, a target. The background should be black, the bullseye should be white and each of the three concentric circles should be in the RGB additive primary colours. Use variables and mathematical operations to calculate the dimensions of the circles. Remember to include comments in the code.

25 Check how the circles change in the previous example by using the noSmooth() function. If there is not an obvious difference, open a new sketch and enter the code below. Try it first with the Smooth() function and then change it for the noSmooth() function.
26 Change the previous Ex_02_02 sketch example to make the background grey, and draw a 20 × 20 pixel square which is green when the mouse button is not pressed, and red when it is pressed. Where would you change the background colour in the code? And where would you change the colour and shape of the object that follows the mouse cursor?
square_series target
smooth()
The smooth() function is already activated automatically, but it is a good habit to add it to the setup() function. The diagram on the left shows a circle with the smooth function, and the one on the right shows the noSmooth() function.
circle

ä 2.8 Control structures. Decisions
If a programme were just a list of instructions to be executed from start to finish, it would be useful but a little simple. There can be circumstances that require our programme to change course. Control structures allow the program to make a decision about which code to execute. Selection and decision structures detect these kinds of situations, and there are two of these structures in Processing: if else and switch case.
if else
if (test) {instructions in case the test evaluates to true} else {instructions in case the test evaluates to false}
Model example
The following sketch shows an ellipse positioned with a mouse pointer. If the pointer is over the left half of the window, the ellipse is filled in with black. If the pointer is placed over the right half of the window, it changes to white. void setup(){ size(300,300); smooth(); } // End setup() void draw(){ background(150) ; // A medium grey if(mouseX<150 ) // The middle of the window {
fill(0); ellipse(mouseX,mouseY,50,50); } // End if mouseX else { fill(255); ellipse(mouseX,mouseY,50,50); } // End else
square_series square_series if else if structures
In the if-else structure, if the test evaluates as true, the instructions enclosed within the if block are executed.
When the test evaluates as false, the else specifies a block of code to execute. We can also add on if else sequences: if (test) {instructions} else if (another test) {more instructions} else {other instructions}
Understand, think, investigate...
27 Type the exact code from the if else example on the left.
What happens if you type the background() function in setup() instead of in draw()? 28 Change the code in the example for the window to have 500 × 200 pixels and imagine it is split into five equal blocks. Imagine that when you move the mouse cursor over the first block, the ellipse is filled in black, the three blocks in the middle are filled in red, green and blue, and the last block is filled in white. Clue: you will have to add a series of if else, and each one has a condition.

2 PROCESSING
Understand, think, investigate...
29 Type the code from the model example for switch case. What happens if you define the variable letter in setup()? And what happens if you define the variable letter outside of both functions setup() and draw()? 30 What do you need to do if you want to leave a trail of coloured ellipses along the graphic window?
31 Change the code from the switch case example so you can change the colour of the ellipse by pressing the numbers from 1 to 5, and the colour of the background by pressing the numbers from 6 to 9.
32 Change the code in the if else example on the previous page so that the window measures 500 x 500 pixels, and imagine it split into four quadrants.
Make the ellipse change to one of the four colours from
Parcheesi (red, green, yellow and blue) when it enters each of the corresponding quadrants.
Make the background change to white by pressing the “W” key, and to black by pressing
“K”, allowing for both lower and upper case letters. switch case
This is used when there are more than two possible values to choose between:
switch (expression) {
case tag_1: instructions; // The keys are not necessary break; case tag_2: other instructions; break; default: instructions if the previous cases are not met;
Model example
This code draws an ellipse where the mouse pointer is positioned. If we press the R, G, or B keys on the keyboard (in capitals or lower case), the fill colour of the ellipse becomes red, green or blue respectively. If we press any other key, the fill changes to white. void setup(){ size(500,200); smooth(); } // End setup() void draw(){ char letter = key; // Read keyboard character background(150); // Medium grey background switch(letter){ case 'r': // If we press ‘r’ or ‘R’ case 'R': fill(255,0,0); // Fill red break; case 'g': // If we press ‘g’ or ‘G’ case 'G': fill(0,255,0); // Fill green break; case 'b': // If we press ‘b’ or ‘B’ case 'B': fill(0,0,255); // Fill blue break; default: fill(255); // If we press other, fill white } // End switch ellipse(mouseX,mouseY,50,50); } // End draw()
ä 2.9 Control structures. Loops
A loop is a structure that contains a series of instructions to be executed again and again under a certain condition. There are two loops in Processing: the while loop and the for loop.
The while loop
The while loop executes a series of instructions continuously while the expression is true. The designers of Processing advise us to use it carefully, as the code inside the loop will be executed until it finds an exit condition. This could cause the mouse and keyboard actions to be outdated and may even block the Processing environment.
while (expression) {
Instructions in the loop are executed while the expression in brackets is true. One of the instructions must change the loop control variable so that the control expression becomes false.
Model example
void setup(){ size(500,200); smooth(); background(150); // Medium grey background noStroke(); // Shapes without borders } // End setup() void draw(){ int i = 50; // Loop control variable // will be used to vary the X coordinate while(i<width-25){ ellipse(i,height/2,25,25); // We draw the // ellipses in the coordinates that mark i and // (height/2) this way they will be vertically // centred i=i+50; // We increase i to exit the loop } // End while } // End draw()

CREATE
Maths
Find out how Processing can be used in mathematics and geometry. Research examples from the Processing Library and see what structures you already know.
Understand, think, investigate...
33 Type the code from the example, analyse the draw() function and answer the following questions: a) What happens if we change the size of the window to 300 x 100? b) What happens if we change the while condition to (i<1000)? c) And what if we change the condition to (i>1)? 34 Change the code in the while example so the height of the ellipses fit to the height of the window.
35 Search for an explanation of while using the keywords: processing org reference while
Input the example that appears there, explain each line and the function of the instructions.
36 Change the example by inputting the following variations: line(30, i, 80-i, i); line(0, i, 80-i, i); line(0, 80+i, 80-i, i); line(0, 80+i, 80, i); 37 Now create two new variations and explain what they do.
2 PROCESSING
The for loop
The for loop executes a series of instructions while it fulfils a specific test condition. Apart from the block of instructions to be repeated, the for loop is made up of three parts which are typed between brackets: initialisation of the control variable, test and update of the control variable. The three parts are separated by semi-colons ;.
for (initialisation; test; update) {
Instructions in the loop are executed while the test in brackets is true. This loop changes the control variable at the end of each iteration automatically, and we decide the increment value (update).
Model example
void draw(){ // The loop control variable // can be stated in brackets for(int i=0;i<width;i=i+10){ fill(i/2); // We use i for a gradient from black to white ellipse(i,i,12,10); // We draw the ellipses forming // a diagonal line
} // End for } // End draw()

diagonal gradients
Understand, think, investigate...
38 Search for the explanation of for on the
Processing language reference page and input the first three sketch examples.
Explain what the difference is between the three versions of the code.
39 Change the code in the second example to make the lines vertical and parallel. 40 Now make the lines appear at a 45° angle like those in the example. Use the setup() and draw() functions to adjust the dimensions of the window, and declare the variables where you think they should be declared.
Guided practice
In this guided practice, we are going to see how we can put one for loop into another (nest* it in another). We’re going to draw a matrix of circles in 3 rows and 5 columns. In each row, the circles will show different tones of one of the primary colours, RGB. We are going to solve each one of the parts for this exercise step by step, and then we will see how it all works together.
1 First of all, we are going to make a row without colour: void setup(){ size(600,100); smooth(); noStroke(); // Shapes without borders } // End setup() void draw(){ // The loop control variable // can be defined in the for brackets for(int i=0;i<5;i=i+1){ fill(255/(i+1)); // We use i for
// a gradient from black to // white ellipse((i+1)*100,50,70,70); // Ellipses } // End for } // End draw()
guided practice
2 The next step is to make three rows. We have to change the size of the window to do this. We can also take advantage of this to use a different colour in each one of the rows.

void setup(){ size(600,300); smooth(); noStroke(); // Shapes without borders } // End setup() void draw(){ // The loop control variable // can be stated in brackets for(int i=0;i<5;i=i+1){ fill(255/(i+1),0,0); // We use i for the //red gradient ellipse((i+1)*100,50,70,70); // Ellipses } // End first for Tutorial videos for Processing
In the following link, you can find several tutorial videos that explain the common levels: beginner, intermediate and advanced. You may find them to be very helpful. https://processing.org/tutorials/

Focus on English
nest: to organise information so that information is recognised as separate, but is included or contained in a larger part of information
2 PROCESSING

Result for Ellipses_colour_for

Result for Ellipses_colour_for_nested
for(int i=0;i<5;i=i+1){ fill(0,255/(i+1),0); // We use i for green // gradient ellipse((i+1)*100,150,70,70); // We draw the // ellipses } // End second for for(int i=0;i<5;i=i+1){ fill(0,0,255/(i+1)); // We use i for the // blue gradient ellipse((i+1)*100,250,70,70); // We draw the // ellipses } // End third for } // End draw()
3 As we can see in the code above, it is possible to re-use the i variable. However, we could have also chosen other names for the control variables for the second and third loops. However, it is easy to notice that we repeated the code in the first loop three times, apart from a few small differences. An alternative is to use two nested loops (a loop within a loop), so that one is responsible for varying coordinate x, and the other is responsible for varying coordinate y. void setup (){ size (600,300); smooth (); noStroke (); // Shapes without borders } // Endsetup()
void draw (){ for (int j=0;j<3;j=j+1){ for (int i=0;i<5;i=i+1){ if (j==0){fill(255/(i+1),0,0);} else if (j==1){fill(0,255/(i+1),0);} else if (j==2){fill(0,0,255/(i+1));} ellipse ((i+1)*100,(j+1)*75,70,70); // We draw the elipses } // End internal for. Controls coordiante x } // End external for. Controls coordinate y } // End draw()
Understand, think, investigate...
41 Change Ellipses_colour_for_nested so that the grey scale appears on the first line. You will also have to change the size of the window. 42 There is a deliberate separation of the axis in the
Ellipses_colour_for_nested example, and it is different to the previous Ellipses_colour_for example. Make any changes that are needed so the result is the same as that of the Ellipses_colour_for. 43 Increase the number of ellipses per line to 10.
You will have to change their diameters. It is also a good idea to change the size of the window so the ellipses fit better and the background colour does not stand out too much.
44 How would you make the size of the ellipses and the spaces between them adjust to the size of the window?
TECHNOLOGY Workshop Fractal drawings
PROJECT PRESENTATION
1st iteration 2nd iteration
3rd iteration
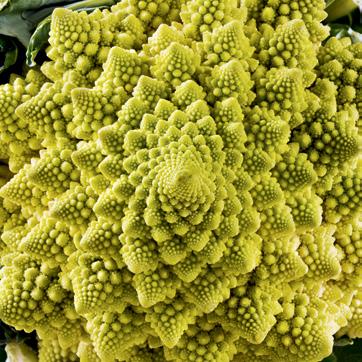
There are many figures in nature made up of fractals. Look at the shape of a Roman cauliflower, for example. Fractals are geometric figures of repeated shapes. Imagine you draw a triangle, then you choose one of its sides to draw the same triangle but smaller. As you are drawing the small triangle, you repeat the process again, and again. Each time you reduce the scale, you make a new iteration. This geometric figure is a Koch Curve. Copy this Processing programme and see the result.

// Fractal diamonds; M.Blazquez, I.Hoyos & J.Santos, 2019 void setup() { size(500, 500); // Screen set at 500x500 pixels
} void draw() { background(220,200,220); // Background colour // violet stroke( 0 , 0 , 200 , 50 ); // Outline colour attributes fill( 0 , 0 , 255 , 70 ); // Fill color attributes translate(width / 2, height / 2); // Move to centre // of canvas draw_fractal(250); // Draw fractal function r=250
} // Start draw fractal function void draw_fractal(float r) { quad(-r,0,0,r,r,0,0,-r); // base diamond if (r < 1) // smallest diamond to have 1-pixel sides return; // diamond matrix moved down pushMatrix(); // create transformation matrix translate(0, r / 4); // move origin down 1/4 of r draw_fractal(r / 2); // recursive call reducing // diamond by 1/2 popMatrix(); // close transformation matrix // repeat the process moving the diamonds up pushMatrix(); translate(0, -r / 4); draw_fractal(r / 2); popMatrix(); // repeat the process moving the diamonds right pushMatrix(); translate(r / 4, 0); draw_fractal(r / 2); popMatrix(); // repeat the process moving the diamonds left pushMatrix(); translate(-r / 4, 0); draw_fractal(r / 2); popMatrix();

The programme represents a simple tree-shaped structure using recursion. The branching angle is calculated based on the horizontal location of the mouse. Any geometric figure can be copied by using a fractal, and Processing lets you implement any curve from simpler shapes. Go to the official Processing website and run the Recursive Tree project by Daniel Shiffman. Move the mouse to the left and right to change the angle. Change the programme code to get different iterations and figures. float theta; void setup() { size(400, 400);
} void draw() { background(0); frameRate(30); stroke(0, 255, 0); strokeWeight (2); // Angle of 0 to 90 degrees according to the position // of the mouse float a = (mouseX / (float) width) * 90f; theta = radians(a); //Convert to radians // Start the tree from the lower area translate(width/2,height); line(0,0,0,-120); // Draw a line of 120 pixels // Move to the end of the line translate(0,-120); // Start the recursive branching branch(120);
} void branch(float h) { stroke(0, 255, 0); h *= 0.66; // Each branch will be two thirds of the // previous one // All the recursive functions must have an exit // condition: length is 2 pixels or less if (h > 2) { pushMatrix(); // Save current state rotate(theta); // Rotate by theta line(0, 0, 0, -h); // Draw branch translate(0, -h); // Move to the end of the branch branch(h); // Generate two new branches popMatrix(); // Restore the state of the matrix // Repeat the same, branching to the left pushMatrix(); rotate(-theta); line(0, 0, 0, -h); // Draw branch translate(0, -h); // Move to the end of the branch branch(h); popMatrix();
review and practise Go to Portfolio in the resource bank at anayaeducacion.es to find information about how to make your portfolio.
LibreCAD
1 Open LibreCad and draw the views of an object the same as below. Then, try to draw this object in perspective view in the same file.
2 The next figure shows an object in cavalier perspective.
Copy it in LibreCad and draw the views of the object next to it.
3 Look at the following piece drawn in LibreCad. It is a square with 90 mm sides and four holes. The centres of the holes coincide with the radii of curvature of the rounded corners. The holes have a diameter of 20 mm, while the rounded corners have an arc with a 40 mm diameter. Copy the shape and take the measurements so you would be able to produce the part.
Processing


4 When you are developing a programme, and you want a certain action to be repeated three times, what type of structure do you have to use? Justify your answer. a) a procedure; b) a function; c) a decision; d) non-conditional loop; e) conditional loop. 5 List four outstanding technical characteristics of
Processing. 6 What is Processing mainly used for? Do you think it can be used in other fields?
7 When applications are developed with Processing, what operating system can you use them in? What tool is used to export applications? 8 What is the graphic window used to draw in
Processing called? 9 Explain the error in this code and how it can be corrected: line(10, 15; 120, 100). 10 What expression lets us close an arc with a straight line? What instruction can you use to trace a line from the beginning of an arc to the centre of the ellipse it comes from, and then from that point to the other end of the arc? (Clue: the final shape will look like a pie slice)
11 How many colours does Processing use? If you work in greyscale, what expression do you have to use and how many values of grey tones can you choose between black and white?
12 When you change the colour of a canvas, you use the instruction: background (a, b, c) where a, b and c are values assigned to the three additive primary colours. What are they? In what position is each of them in the expression? What range of numbers can each one take? Make a quick calculation and indicate the number of different composite colours that can be made.
13 Look at the following code. Change it so that the line will be as thin as possible. size(450,300); stroke(75,90,100); strokeWeight(90); rect(0,0,400,200); 14 Make a program that draws a six-point star on a 500 by 500 sized canvas. 15 Explain how you can insert a comment in a
Processing program when it is: 1 several lines; 2 a single line; 3 several lines and is a documentation comment.
16 The What if. Float type data can be saved in a variable declared as int. What happens with the data that is saved?
17 What disadvantage is there to saving a value that will never have more than 10 different values in a variable declared as long? 18 What’s the difference between a global variable and a local variable?
19 Explain what a simple decision structure is. Write an example in which, depending on the value of an int-type variable, a square or a circle is drawn. 20 Which decision structure is used when there are more than two options? Write an example using comments.
21 What is the function of the expression below? while (condition) { // Action instructions } 22 What difference can you see between these two code blocks which have the same instructions?
Would the same shapes be made?

23 Look at the composition below, it is made on a 500 pixel × 500 pixel canvas and is made up of simple shapes joined at the vertices.
Measure the position of each vertex on the image with a ruler. Then, calculate the position of each vertex as if it were in the Processing environment, so that you could make the same composition.
Hint: all the measurements are multiples of 25.
ex 23
24 Look at the following code. Copy it into Processing and make comments on each line to explain their functions.
void setup(){ size(500,500);
fill(200,25,25); rect(mouseX,mouseY,50,100);
} 25 Look at this code, it simulates the effect of gravity on a ball. Answer the following questions: 1 What type of variables are X and Y? 2 What instruction determines the velocity of the ball? 3 What happens if we change the value of the variable for gravity from the initial value 0.3 to 0.9? 4 What happens to the ball if we change the instruction velocity = velocity*-0.85 for the expression velocity = velocity*-0.25? 5 Write the code in Processing and make comments explaining the functional nature of the programme. //---- Code ---float x = 240; float y = 0; float velocity = 0; float gravity = 0.3;
void setup() { size(480, 480);
void draw() { background(255); fill(0,0,255); stroke(0); ellipseMode(CENTER); ellipse(x, y, 25, 25); y = y + velocity; velocity = velocity + gravity;
if (y > height) { velocity = velocity * -0.85; y = height;
26 Look at the following code: int C=0; void setup() { size(400, 400); smooth();
} void draw() { for (C=0; C<width; C=C+40) { fill(C); ellipse (width/2, width/2, (width-C), (width-C));
1 Indicate what lines correspond to: the block for declaring variables, the general configuration of the programme and to the repeating loop. 2 What are the measurements of the shape’s canvas? 3 What does the variable C mean in the programme? What type is it? 4 Copy the code into Processing and execute it. Write comments that explain what the programme does. 5 How can you make a softer gradient?

Building Blocks is an educational project of Anaya Educación for Secondary Education with the participation of: M. P. Blázquez, I. Hoyos, J. Santos, Danny Latimer, Hannah Peat, Karen Piper, Begoña Fuente Larrazabal, Sara Gascón Martín, and Denise Suárez. The following people have worked on this book:
Editorial team: Karen Piper and Lidia Quiles
Design, technical drawings and maps: Patricia G. Serrano, Juan Carlos Quignon y Julio Vázquez
Illustrations: Pablo Vázquez
Layout: DiScript and Nieves Merino
Proofreading: Gonzalo Vila Rodríguez
CORRECTIONS: Anaya Corrections department
Translation: Montero Language Services
PICTURE EDITING: Olga Sayans
Photographs: Age Fotostock (AMELIE-BENOIST/BSIP, Glowimages RM, JAMES KING HOLMES/SPL, Javier Larrea, Science Museum/SSPL, Science Source, WLADIMIR BULGAR/SPL, Xinhua/POOL/Fabrice COFFRINI), Alamy/Cordon Press (JohanH, ZUMA Press, Inc.), Album Archivo Fotográfico (Granger, NYC), Archivo Anaya (Cosano, P.; Martín, J. A.; Osuna, J.; Peñuela Py, E.), Dreamstime (Fottom, Vladimir Zhupanenko, Zuzana Randlova), Gettyimages (Carol Yepes, Kim Kulish), Intel Corporation, iStock/ Gettyimages (AlexLMX, Besjunior, bigtunaonline, Bogdanhoda, Chiradech, farakos, Grassetto, lucadp, matejmo, Olesia Kononenko, PhanuwatNandee, Pixfly, sarah5, scyther5, solarseven, StockRocket, vectorikart), 123rf (alexlmx, Anake Seenadee, Daniil Peshkov, Dmytro Zinkevych, EDUARD BONNIN TURINA, Ekkasit Keatsirikul, Inna Vlasova, Jacek Nowak, mavoimage, nosua, rawpixel, Renjith Krishnan, scanrail, sergwsq, tovovan, tumsasedgars, valex113, Yulia Kireeva, zmiter, Олександр Федюк)
Academic and Professional Orientation: created in conjunction with Fundación Bertelsmann. Coordinator: Juan José Juárez Calvo. Expert collaborators: Sara Lozano Santiago, Belén Pérez Castro and Pilar Vázquez Hernández
Commitment to Sustainable Development Goals
Our publications contain carefully selected content, illustrations and language to comply with non-discrimination on the grounds of gender, culture or opinion.
Grupo Anaya considers social and environmental responsibility to be one of its fundamental values. For this reason, we are committed to: · continually improving our contents and materials related to the environment. · reducing our carbon emissions. · using natural resources responsibly. · making sure that our activity has no negative consequences for endangered forests. These commitments, among others, mean that 100% of the paper used in our books has the PEFC label.
Important information: The activities proposed in this book should be completed in a separate notebook or on sheets of paper, not in the book itself. The links to webpages which appear in this book have been checked before printing. The publisher cannot be liable for any changes or modifications which occur after the date of publication.
© GRUPO ANAYA, S.A., 2021 - C/ Juan Ignacio Luca de Tena, 15 - 28027 Madrid.
All rights reserved. No part of this publication may be reproduced, stored in a retrieval system, or transmitted, in any form or by any means, electronic, mechanical, photocopying, recording, or otherwise, without the prior permission of the publishers.