
Environmental Impacts of Artificial Intelligence
Authors
Jens Gröger
Felix Behrens
Peter Gailhofer
Inga Hilbert

Öko-Institut Consult GmbH
Borkumstraße 2 13189 Berlin
Kein Geld von Industrie und Staat
Greenpeace arbeitet international und kämpft mit gewaltfreien Aktionen für den Schutz der Lebensgrundlagen. Unser Ziel ist es, Umweltzerstörung zu verhindern, Verhaltensweisen zu ändern und Lösungen durchzusetzen. Greenpeace ist überparteilich und völlig unabhängig von Politik und Wirtschaft. Rund 620.000 Fördermitglieder in Deutschland spenden an Greenpeace und gewährleisten damit unsere tägliche Arbeit zum Schutz der Umwelt, der Völkerverständigung und des Friedens.
Impressum
Greenpeace e. V. Hongkongstraße 10, 20457 Hamburg, T 040 30618-0 Pressestelle T 040 30618-340, F 040 30618-340, presse@greenpeace.de, greenpeace.de Politische Vertretung Berlin Marienstraße 19–20, 10117 Berlin, T 030 308899-0 V.i.S.d.P. Jonathan Niesel Titelfoto © Samuel Golay / picture alliance Stand 05 / 2025
Foreword
Artificial Intelligence (AI) is omnipresent and transforming the world. The increasing use of AI not only brings progress—it also introduces new environmental challenges.
Several examples illustrate the current dynamic:
▶ AI models are becoming larger, more complex, and more energy-hungry.
▷ The number of parameters has risen from 1.5 billion (GPT-2, 2019) to 2 trillion (LLama 4, 2025).
▷ The computational effort required for training doubles approximately every five months. [Epoch AI]
▶ The global electricity demand for AI computing is expected to be about 11 times higher in 2030 than in 2023. [Environmental Impacts of AI, Öko-Institut 2025]
▶ In the U.S., data centers could consume more electricity by 2030 than the entire energy-intensive goods production sector (cement, chemicals, steel) combined. [International Energy Agency (IEA)]
Greenpeace has been advocating for a more environmentally friendly internet and data center infrastructure for years (e.g., benchmarking the energy performance of the IT sector in 2009; Clicking Clean: Who is winning the race to build a green internet in 2017).
But those successes are being undone: instead of decreasing emissions from Google, Microsoft, and AWS, the companies are reporting increasing emissions or only incomplete data on environmental impact. At the same time, they are heavily investing in AI infrastructure to secure market share and future profits. It remains unclear whether and how this aligns with their self-imposed climate goals.
AI can be a useful technology, but its negative environmental impacts must be limited. Greenpeace does not fundamentally reject AI but emphasizes the urgency of taking action now to ensure AI does not further exacerbate the climate crisis.
This report presents, for the first time, a comprehensive overview of AI’s environmental impacts. It is intended as a fact-based, scientific foundation for discussion—one on which we can collectively search for solutions and scale environmentally sustainable approaches. While AI clearly has many social and societal opportunities and risks, this report focuses specifically on its ecological impact.
The report by Greenpeace East Asia shows that accelerating the deployment of renewable energy is possible within the chip production supply chain.
There is also great potential for improved energy efficiency through "Green AI" policies in companies—for example, by choosing smaller models, using pre-trained models, and providing training in green coding. Even with energy-efficient algorithms, electricity consumption from AI applications will continue to rise as more people use AI in both their professional and private lives. As of April 2025, ChatGPT usage set a new global record, doubling to 5.1 billion visits within a year. [Statista]
Technological advances alone will not eliminate the environmental impacts caused by technology: efficiency gains reduce costs, which then increases usage and offsets the savings. This is known as the rebound effect, or Jevons paradox.
Therefore, avoiding environmentally harmful AI use cases must also be part of the solution. For instance, it is not desirable for AI applications to lower the cost of oil extraction, thereby increasing fossil fuel consumption.
Greenpeace calls for the following measures to minimize the environmental impacts of Artificial Intelligence:
1. An energy-efficient AI infrastructure powered 100% by renewable energy. This green power must be additionally generated.
2. AI companies must disclose:
a. How much electricity is used in operating their AI.
b. How much power is consumed by users during their use of AI.
c. The goals under which their models were trained, and which environmental parameters were considered.
3. AI developers must take responsibility for their supply chains. They must contribute to the expansion of renewable energy in line with their growth and ensure that local communities do not suffer negative consequences (e.g., lack of drinking water, higher electricity prices).
This last point is especially critical right now, as UN Secretary-General António Guterres emphasized at the 2025 AI Summit in Paris:
"The power of AI carries immense responsibilities. Today, that power sits in the hands of a few."
Greenpeace views it critically that AI is currently dominated by the same large tech corporations that also control most social media platforms—leading to media monopolies and known issues such as social polarization, hate speech, and fake news. This market power must be limited, and EU digital legislation must be enforced. There are solutions that can make the environmental impacts of AI applications measurable (e.g., AI Energy Score, Green Algorithms). Germany’s Energy Efficiency Act already includes basic measures that must be implemented swiftly and comprehensively (e.g., mandatory use of waste heat).
It is important to find interdisciplinary solutions, implement them within organizations, and strengthen approaches focused on the common good. If we succeed, AI has the potential to accelerate sustainable development.
Karen Paul, Greenpeace Expert for Digital Transformation
Jonathan Niesel, Greenpeace Expert for Artificial Intelligence
Executive Summary
Artificial Intelligence is already an integral part of many areas of life – whether it’s popular applications like ChatGPT or the optimization of industrial processes. But this progress comes at a cost: The infrastructure behind AI consumes vast resources – especially energy, but also water and raw materials such as rare earths. This report, prepared by the Öko-Institut on behalf of Greenpeace Germany, provides the first comprehensive overview of the environmental impacts of artificial intelligence – and provides guidelines for sustainable AI. The authors evaluated more than 95 studies on the topic, condensing a lot of the available literature in a single report. AI is here to stay – and we must find a way to use it in a climate- and environmentally responsible manner.
The first part of the report outlines the economic trajectory of AI and examines the key players in this rapidly growing sector. Tech giants like Google, Microsoft, Amazon, Apple and Meta are investing billions into expanding their AI-powered product portfolios. This development primarily affects the data centre market: They are building new AI-specific data centres and customised AI hardware on a large scale. Accordingly, the share of specialised AI hardware in the energy consumption of data centres (excluding cryptocurrencies) will grow from an estimated 14% in 2023 to 47% by 2030. The newly built, so-called hyperscale data centres have electrical connection capacities of several hundred megawatts and occupy floor space of up to 4 square kilometres.
The second and most comprehensive section of the report focuses on AI’s environmental impacts – particularly regarding energy consumption, greenhouse gas emissions and water use. Electricity consumption is projected to triple within just seven years. By 2030, the power demand of AI data centers is expected to be eleven times higher than it was in 2023. At that point, AI data centers will require as much electricity as conventional data centers do today. In short, AI is not only energy-intensive in itself – it is a key driver of energy demand in the entire data infrastructure sector. Despite the assumption of a carbon-neutral electricity supply by 2040, CO₂ emissions are projected to rise. Within just five years, AI is expected to dominate overall computing demand. The additional electricity required will prolong the operation of fossil fuel power plants, putting climate targets at risk.
In Ireland, data centres already account for more than 20% of total national electricity consumption, and in the capital Dublin, almost 80%. Figures between 30% and 40% can be found in cities like Amsterdam, London or Frankfurt/Main. These developments are pushing local grids to their limits, prompting governments – as in Ireland – to introduce regulations on the expansion of new data centres.
AI’s environmental footprint goes beyond energy. Cooling data centres requires large quantities of water –according to the projections made here, data centres worldwide consumed 175 billion litres of water in 2023. Water consumption is forecast to more than triple by 2030 (664 billion litres in total). This is particularly problematic in water-scarce regions. In addition, indirect water use associated with power generation and chip manufacturing further compounds the issue. The production of AI-specific chips is especially water-intensive and is often located in ecologically vulnerable areas. E-Waste is another problem the report addresses: Large quantities of up to 5 million tonnes of additional electronic waste will be generated by the expansion of data centres and AI capacities until 2030.
The report also addresses the increasing reliance on nuclear energy by major tech firms. Google, Amazon/ AWS, Microsoft and Meta are among the signatories of the EU Climate Neutral Data Centre Pact (CNDCP), which commits them to becoming climate neutral by 2030. In an attempt to meet their massive electricity needs while claiming to be "climate neutral," these companies are investing in nuclear power plants and Small Modular Reactors (SMRs). However, the report warns of the significant and well-established environmental and safety risks of such technologies – including radioactive waste, high water use, and unresolved storage problems.
Beyond these direct impacts, the report explores the systemic and indirect effects of AI – such as rebound effects, where efficiency gains lead to higher overall resource consumption, and increased consumerism through algorithmic recommendation systems. These effects often amplify rather than mitigate environmental pressures. The authors argue that these broader dynamics deserve greater scrutiny in sustainability debates.
To align AI with sustainability goals, the report proposes a five-point framework: AI should only be used when its environmental benefits outweigh its impacts; simpler alternatives should be preferred; lean models must meet real performance needs; efficiency in software, data and hardware use should be continuously improved; and transparency around environmental effects must be ensured. These principles aim to minimise AI’s resource footprint and maximise its contribution to sustainability.
Finally, the report offers concrete policy recommendations. To reduce AI’s environmental footprint, the report calls for clear policy action: mandatory reporting on energy, water and efficiency metrics; efficiency labels for data centres and AI services; better integration with renewable energy and local heating networks; and legal frameworks that go beyond human safety to also address environmental risks. Only with clear regulatory frameworks, international coordination and a sustainability-driven technological agenda can AI contribute to solving environmental challenges – rather than intensifying them.
Environmental Impacts of Artificial Intelligence
Evaluation of current trends and compilation of an overview study for Greenpeace e.V., Hamburg Berlin, 12.05.2025
Authors: Jens Gröger, Felix Behrens, Peter Gailhofer, Inga Hilbert

Oeko-Institut Consult GmbH info@oeko-consult.de oeko-consult.de
Office Freiburg
Merzhauser Straße 173 79100 Freiburg Phone +49 761 45295-0
Office Berlin
Borkumstraße 2 13189 Berlin Phone +49 30 405085-0
Office Darmstadt Rheinstraße 95 64295 Darmstadt Phone +49 6151 8191-0
Acknowledgements and editorial notes
We would like to thank the external experts in particular Sasha Luccioni, Shaolei Ren, Alex de Vries and Christoph Pistner who critically reviewed this study and provided us with valuable suggestions for improving the text
We would also like to thank the Greenpeace team Karen Paul, Jonathan Niesel, Manfred Santen and Joerg Feddern, who commissioned this study, thoroughly reviewed the individual passages, and contributed their feedback to make the study more comprehensive and valuable for readers.
Finally, we would like to thank the artificial intelligence for supporting us in our work: The preparation of this report involved the use of large language model (LLM) based assistants (Claude, ChatGPT, DeepL) for information retrieval, summarization, translations, and linguistic enhancement purposes. The environmental impact of these specific applications cannot be quantified unfortunately, as the providers do not offer any transparency in this regard.

List of Tables
List of Abbreviations
AI Artificial Intelligence
AV Autonomous vehicle
CAGR Compound Annual Growth Rate. Defined as the ratio of the value of the next year to the value of the current year minus one.
CNDCP Climate Neutral Data Centre Pact
CRM Critical Raw Material
CSR Corporate Sustainability Report
DC Data Centre
ERF Energy Reuse Factor, defined in EN 50600-4-6 as the ratio of the reused thermal energy to the total discharged energy. The ratio describes the reuse of waste heat.
GPU Graphic Processing Unit
IoT Internet of Things
IT Information Technology
kg CO2e Kilogram carbon dioxide equivalents
kWh Kilowatt hours = 103 watt hours
LLM Large Language Model
PUE Power Usage Effectiveness, defined in EN 50600-4-2 as the ratio of the energy consumption of the entire data centre and the energy consumption of the IT
RE Renewable Energy
REE Rare Earth Elements
REF Renewable Energy Factor, defined in EN 50600-4-3 as the share of renewable energy in the total energy consumption of a data centre
SMR Small Modular Reactor
SRM Strategic Raw Material
TPU Tensor Processing Unit
TWh Terawatt hours, 1 TWh = 1 billion kilowatt hours = 1012 watt hours
WUE Water Usage Effectiveness, defined in EN 60500-4-9 as a ratio of the water consumption of a data centre and the energy consumption of the IT
Summary
This report describes the environmental impacts of artificial intelligence, in particular through the digital infrastructures required for its training and operation and the associated energy consumption, greenhouse gas emissions, water consumption, resource requirements and electronic waste generation. In addition, the so-called ‘indirect’ and ‘systemic’ effects of AI use are described anecdotally.
Around 100 literature sources and publications were evaluated and summarised for this purpose. Even though no primary data was collected, and no complex calculation models were developed, the report still provides a comprehensive overview of the problems associated with the increasing use of data centres in general and AI-specific data centres in particular. Although some of the compiled data are only rough estimates, important guidelines for action and policy recommendations can already be derived from them.
Current trends in digital infrastructures
The increasing use of artificial intelligence is driving the expansion of digital infrastructures. Large technology companies are investing heavily in this trend. Amazon, Microsoft, Google, Apple and Meta have announced multi-year AI investment commitments in the range of several hundred billion US dollars. These companies are building new AI-specific data centres and customised AI hardware on a large scale. Accordingly, the share of specialised AI hardware in the energy consumption of data centres (excluding cryptocurrencies) will grow from an estimated 14% in 2023 to 47% by 2030. The newly built, so-called hyperscale data centres have electrical connection capacities of several hundred megawatts and occupy floor space of up to 4 square kilometres.
Environmental impacts
AI and the growth of data centres are leading to a very sharp increase in energy consumption. The global electricity demand of data centres (including cryptocurrencies) was around 487 TWh in 2023 and is forecasted to grow at a compound annual growth rate (CAGR) of 16% on average. By 2030, electricity consumption is estimated to reach 1,389 TWh – about three times the 2023 figure. Even a conservative CAGR of 12% results in approximately 1,093 TWh by 2030, and a high-growth scenario of 20% reaches electricity consumption of 1,766 TWh. The main driver is AI-specific data processing: data centre consumption for AI tasks will rise from 50 TWh (2023) to 554 TWh in 2030, representing an 11-fold increase in 7 years.
These trends will lead to a rapid increase in greenhouse gas emissions. Global CO₂ equivalent emissions from data centres will rise from around 212 million tonnes (Mt) in 2023 to 355 Mt in 2030. Here, too, the increase is particularly pronounced in AI-specific data centres, with emissions increasing sixfold from 29 Mt in 2023 to 166 Mt in 2030. AI-specific infrastructure will have overtaken the emissions of traditional data centres by 2030.
Data centres also require enormous amounts of water for cooling. According to the projections made here, data centres worldwide consumed 175 billion litres of water in 2023. Water consumption is estimated to more than triple by 2030 (664 billion litres in total). AI-specialised data centres contribute the most to this: their water consumption will rise from around 30 to 338 billion litres. The average water usage rate (litres per kWh) will increase from 0.36 l/kWh (2023) to 0.48 l/kWh (2030) due to the higher power densities of AI data centres.
In terms of the material footprint of data centres, the study uses rough calculations to determine that this is significant (including 920 kilotons of iron/steel and 200 kt of other metals, as well as critical, strategic or conflict-related raw materials amounting to around 100 kt) – but overall only plays a minor role compared to global production volumes. More problematic, however, are the large
quantities of up to 5 million tonnes of additional electronic waste that will be generated by the expansion of data centres and AI capacities until 2030.
Self-declarations of tech companies
Leading technology companies present their data centre business and AI services as ‘green’, but their latest reports show an absolute increase in emissions. Google, Amazon/AWS, Microsoft and Meta are among the signatories of the EU Climate Neutral Data Centre Pact (CNDCP), which commits them to becoming climate neutral by 2030. The companies have left themselves a loophole by defining nuclear energy as ‘clean energy’, which they intend to use to cover their additional electricity requirements without failing to meet their climate commitments. The study explains why nuclear energy is neither ‘clean’ nor climate-friendly.
Corporate CSR reports often lack transparency and disclosure of absolute figures. For example, total energy and water consumption generally increases even when the efficiency of digital infrastructures improves. When it comes to the use of renewable energies, companies have so far failed to purchase or generate the appropriate amounts of energy to match their hourly consumption.
Sustainable artificial intelligence
Sustainable AI involves the development and use of AI with explicit environmental and social goals. Based on existing frameworks, a five-point plan is outlined that can be used to assess the sustainability of AI projects. First, AI projects should have defined sustainability goals and only be carried out if the ecological benefits justify their environmental impact. Second, developers must question the necessity of AI: if a simpler rule-based or analogue solution can achieve the goal, it should be preferred. Third, they should pay attention to sufficiency by choosing the leanest AI models that meet the actual performance requirements. Fourth, software, data and hardware use in the AI development cycle should be subject to continuous monitoring and efficiency improvements. Fifth, the study proposes various measures to increase the transparency of the environmental impact of AI systems. Taken together, these measures aim to ensure that AI makes a positive contribution to sustainability and does not arbitrarily increase energy and resource consumption.
Policy options
To reduce the environmental footprint of AI, the report recommends various policy measures:
Transparency and accountability. Require comprehensive reporting on the impact of data centres and AI services. This includes collecting and publishing energy, water and efficiency metrics at the data centre level (building on the EU Data Centre Register), introducing an efficiency labelling system for data centres, and AI-service-specific metrics that identify the specific environmental footprint, thereby enabling competition for the most efficient AI services.
Grid integration and adaptation to renewable energies. It must be ensured that data centres do not overload local power grids or force the extended use of fossil or nuclear fuels. When planning data centres, consideration should be given to covering additional loads with clean energy capacities at appropriate times or with their own battery storage systems. When approving new large data centres, a minimum share of waste heat for local heating networks should be mandated.
Regulatory adjustments. Update the legal framework to take into account the environmental impact of AI. The EU's artificial intelligence law is currently very ‘anthropocentric’ (i.e. focused on human safety) and ignores environmental risks. Policymakers should therefore further develop technology laws to explicitly include environmental criteria.
1 Current trends in digital infrastructures
1.1 General trends in digital infrastructures
Digital infrastructures are the technical basis for all digital services. Whether we are watching a streaming video, transferring money, controlling machines remotely, collecting data for a weather forecast or reading the answer of an AI language model, all these digital applications are backed by physical infrastructures that provide us with computing, storage and transmission capacities. Specifically, digital infrastructures consist of digital end devices (e.g. computers, smartphones, IoT devices), transmission networks (mobile communications, copper cables and fibre optics, satellites) and data centres (servers, storage systems, network components and building technology).
All these components have become increasingly powerful in recent years. So powerful, in fact, that they can process complex AI models with a huge amount of data and an enormous computing effort. The mathematical basis for this has existed since the 1950s. And for some applications, such as physical simulations or climate models, there have been specialised high-performance computing centres for the last few decades. What is new, however, is that such computing capacities are now also available to end consumers on a large scale. Automatic translation, speech recognition, chat bots, image and video generators or AI assistants on websites or in office applications: AI can be built into practically any software product.
As a result, hardware and software development are driving each other upwards. The newly created needs are also putting hardware under pressure, with the result that it has to be upgraded more and more. Smartphones are being equipped with AI chips (for example for facial recognition or language processing), transmission networks are transferring increasing amounts of data, and the construction of new data centres is experiencing a real boom. A large proportion of the new server capacities are equipped with specialised AI chips (such as GPUs) and require many times more energy than conventional information technology.
1.2 AI business models and the companies behind
The large tech companies have invested heavily in artificial intelligence in recent years. In the technical infrastructure, in AI models and as well in AI services Strictly speaking, AI as a technology is the broader category that includes machine learning, which includes deep learning, which includes more sophisticated models such as generative, predictive and large language models (LLM). Where possible, we will focus on the environmental impacts of generative, predictive and LLM AI
The services that are based on these advanced models experienced a wide adoption in all sectors during the last years. They are likely to dominate the effects of AI in the broader sense
The digital supply chain conventionally reaches from chip design to a digital service, as depicted in Figure 1-1
Figure 1-1: Digital supply chain, with and without AI
Conventional Data Centre supply chain
Chip design
Chip manufacturing
AI business models
AI Chip design
Chip manufacturing
Leading companies (list not exhaustive)
AWS, Alphabet, Apple, Meta, NVIDIA
TSMC, Samsung, Intel, AMD Device manufacturing
DC + IT operation
Colocation operation IT operation in colocation
Compute resource provision
Platform as a service, Software as a Service
Digital Service
Source: Own compilation
AI device manufacturing
DC + IT operation for AI-training and -inference
Colocation operation IT operation for AI-training and AI-inference
Compute resource provision
Base model design and training
AI service
Dell, HPE, Lenovo, Huawei, IBM
AWS, Microsoft, Alphabet, Meta
Equinix, Digital Realty, NTT
Global, CyrusOne, Telehouse
AWS, Microsoft, Alphabet, Meta
AWS, Microsoft, Alphabet, Meta, Alibaba
Microsoft, OpenAI, Anthropic, DeepSeek
AWS, Microsoft, Alphabet, Meta
Chip and hardware manufacturers such as NVIDIA or Dell feed the whole market with AI specific hardware. Amazon, Meta, Google (Alphabet), Microsoft and Apple design their own chips and servers for AI applications. TSMC (Taiwan Semiconductor Manufacturing Company) is the global market leader of chip manufacturing, both for AI and non-AI. They produce chips for NVIDIA, Intel and other chip-designing companies.
For the largest cloud providers, the colocation business plays only a minor role. Its global turnover was estimated to 34 bn US $ (GlobeNewswire 2025), which is less than Meta’s profits. The cloud providers mainly run their own data centres. Only Apple runs about one fifth of its services in colocation space (Apple, Inc. 2023). Apple consumed 371 GWh in the US and 117 GWh in international colocation facilities, compared to Apple’s total data centre electricity consumption of 2,100 GWh. The cloud operators AWS, Google Cloud, Microsoft Azure provide computing capacity for training and inference of AI models. Base-model providers such as OpenAI, Anthropic or DeepSeek build and train generative, predictive, and large language models with a huge amount of data. These organisations are heavily funded by the cloud operators and benefit from cooperation agreements to use their cloud infrastructure for training. The market of AI models is vibrant, and changes faster than this study can capture. AI services are being integrated in almost any software and are promised to increase interactivity, speed of workflows, amount of processed data and degree of personalization, to name just a few opportunities.
In the current phase, the growth of AI services is on credit and enabled by future profit expectations. As an example, OpenAI is luring customers with no-cost and low-cost offers, while benefiting from discount on Microsoft’s compute capacity. At the same time, Microsoft is the largest investor for OpenAI with over 13 bn. US $. “But OpenAI spends much of that money on Microsoft’s cloud computing systems, which host OpenAI’s products” (Isaac and Griffith 2024) Still, OpenAI has 5 bn. US $ losses while turnover is only 3.7 bn. US $ in year 2024 (Isaac and Griffith 2024). The companies that already profit from this dynamic are the ones that own the digital infrastructure.
The following table shows how the business specifically impacts the company's business figures and who the biggest winners of this trend are. It also shows why our study focuses in chapter 3 on the
five major tech companies. We filtered the Forbes list of the largest companies globally to companies that are involved in the AI business (Murphy and Schifrin 2024). By Forbes list and turnover, Amazon is the largest tech-company. By profit, it’s Apple. By profit to turnover ratio, it’s Taiwan semiconductor and Microsoft.
Table 1. Selection of the largest tech companies in the year 2023 sorted by Forbes list No.
Source: Murphy and Schifrin (2024) (https://www.forbes.com/lists/global2000/) and other sources for announced investments; unknown numbers are left empty
Further down in the Forbes list between 50 and 100, there are companies like Deutsche Telekom, Nippon Telegraph and Telephone (NTT) and IBM, even further down follow Intel, NVIDIA and Dell. Equinix, the largest colocation provider, only ranks on place 718. Digital Reality, the second largest ranks on 804. Huawei and Byte Dance, the company behind TikTok, are a special case. They are not listed in the Forbes list. Publicly available data on Byte Dance’s revenues are contradictory. This might be due to its legal form of a private company that is not listed, unlike the other companies that are limited organizations.
China Mobile and AT&T also operate data centres, but with the primary purpose to provide internet and mobile access. With demand for AI services increasing, also data traffic and the relevance of internet providers will increase. This effect is not directly linked to businesses with AI. Therefore, we neglect internet providers in the following analysis.
If we highlight turnover larger than 300 bn US $, profits larger than 30 bn US $, profit to turnover ratio larger than 20% and annual investments in AI of more than 50 bn. US $. Amazon, Microsoft, Google, Apple, Meta and Taiwan Semiconductor Manufacturing Company (TSMC) each fulfil two or more of these criteria. TSMC, with its chip factories, operates a completely different business model to that of the cloud providers, and so no comparison can be made here. We will only put a spotlight on TSMC as an example for the IT supply chain regarding its electricity consumption in section 2.1.2 More information on energy consumption in chip production can also be found in the report published by Greenpeace East Asia (Vries 2025)
Below, we describe the AI-specific business models of the five largest tech companies:
Google (Alphabet) is one of the leading companies in AI development and uses artificial intelligence for a wide range of commercial activities. For example, Google provides AI models and training hardware in the Google Cloud (Google Cloud 2025). The company uses AI to improve the quality of its search results and the effectiveness of its advertisements. The productivity software provided by Google (e.g. Gmail, Google Docs and Google Photos) uses corresponding AI systems to make the software more convenient.
Microsoft has also integrated artificial intelligence into its product portfolio. Microsoft has so far invested around 14 billion US dollars in OpenAI, the company behind ChatGPT (Novet 2024). Artificial intelligence is included in many of Microsoft's business models. Within the Azure cloud platform, both technical infrastructures for developing custom AI models and AI-supported development tools are offered. AI-based functions are integrated into the business and end consumer software “Microsoft 365” (including Word, PowerPoint and Excel) and specialised enterprise software to increase productivity.
Amazon uses AI in both its warehouse and its online services. Amazon's retail platform makes extensive use of AI to improve product recommendations, warehouse management and pricing. Within its cloud platform Amazon Web Services (AWS), numerous commercial AI tools and services for machine learning and computer-based image and speech processing are offered. Amazon has developed another business model around Alexa by offering voice assistance systems for private and business use. These devices collect data that is used to improve AI algorithms.
Apple is also a leading player in the field of AI, with a strong hardware focus. Apple uses AI in its end devices through specialised chips that are optimized for machine learning. This enables functions such as face and speech recognition and intelligent camera usage. Apple also uses artificial
intelligence for software services such as Siri (voice assistant) and the automatic image analysis of the camera app. In 2024, Apple announced the integration of ChatGPT into its software.
Another important player in the field of artificial intelligence is the company Meta Platforms (formerly Facebook). Meta has made massive investments in AI technologies to expand its social platforms, to integrate chatbots and to deliver personalised advertising on Facebook, Instagram and WhatsApp. Within the virtual reality environment Metaverse, AI is used to create virtual worlds and to interact with users.
1.3 Trends in the data centre market
The boom in artificial intelligence applications is having a massive impact on the data centre market. In addition to existing data centre capacities, specialised high-performance data centres are being built that can process large amounts of data quickly and in parallel. The computing chips required for this are so-called Graphic Processing Units (GPUs) or Tensor Processing Units (TPUs) specially developed by Google, which are installed in the servers in addition to classic Central Processing Units (CPUs). NVIDIA, a company that specialises in GPUs for AI, is currently benefiting from this trend. Its share value has increased almost sevenfold in the last three years (from $20 at the beginning of 2022 to $140 at the beginning of 2025).
The installed electrical capacity of global data centres will grow from 55 gigawatts in 2023 to an estimated 219 gigawatts in 2030 (McKinsey 2024) This corresponds to an annual growth rate of 22% and a doubling of capacity every 4 years.
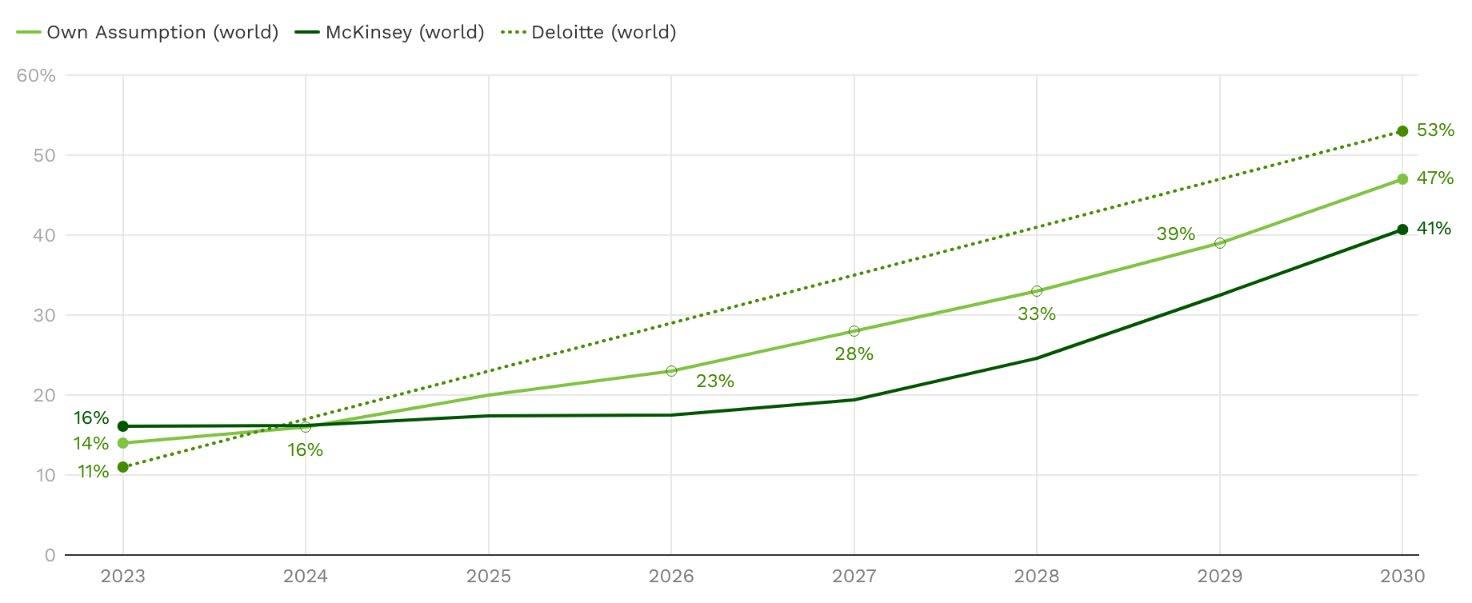
The market research institutes McKinsey (2024) and Deloitte (2024) each provide an estimate of how much of the energy consumed in data centres worldwide is attributable to specialised AI hardware. We have used this to calculate the figure ‘Share of AI specific to total global data centre electricity consumption’, which is shown in Figure 1-2. McKinsey assumes 16% for AI in 2023 and 41% in 2030. Deloitte indicates an expected development of 11% in 2023 and 53% in 2030.
Source: own compilation based on McKinsey (2024), Deloitte (2024) and own assumptions
As our own assumption for the distribution of AI-related energy consumption between 2023 and 2030, we have used a mean curve between these annual values and visualised it in Figure 1-2 The
Figure 1-2: Share of AI specific to total global data centre electricity consumption
share starts at 14% in 2023 and then rises at a compound annual growth rate (CAGR) of 19% to 47% of global data centre electricity consumption in 2030. For the further calculations in this study, we will use these shares to distribute the environmental impacts of data centres (excluding cryptocurrencies) either to traditional data centres or AI-specific data centres.
When looking at this distribution, however, it is important to note that traditional data centre tasks and calculations for artificial intelligence cannot be clearly separated. After an AI model has been trained, it can also be delivered via traditional data centres with CPU servers or the traditional data centre may collect data that can then be made available for AI training. Therefore, AI also has an impact on existing and traditional data centre infrastructures.
Many of the newly constructed data centres are so-called hyperscale data centres, which are installations with a connection capacity of 100 megawatts or more. The server racks in these data centres have a very high-power density of 40 kilowatts or even up to 120 kilowatts per cabinet, the waste heat of which can only be dissipated by liquid cooling (Uptime Institute 2025). The market research institute Synergy Research Group has counted 1000 data centres of this size worldwide for the year 2024 and also assumes that they will double in the next 4 years (Synergy 2024b).
Synergy (2024a) has identified these locations for new hyperscale data centre projects: the United States, with the regions of Virginia, Oregon, Iowa, Ohio, Silicon Valley, Texas and other federal states; China, with Beijing and Shanghai; Europe, with Dublin and Frankfurt; and, in the APAC region, Tokyo and Singapore. The market research institute CBRE (2024) also names the locations London, Amsterdam and Paris in Europe, Hong Kong in China, Sydney in the APAC region and, finally, Querétaro (Mexico), São Paulo (Brazil), Santiago (Chile) and Bogotá (Colombia) for Latin America.
Each of these regions will have to deal with the challenges of new hyperscale data centres. The large investment projects have a power input of several thousand megawatts each. As a comparison: 1000 megawatts correspond, on the generation side, to a large coal-fired power plant with two blocks or the size of a nuclear power plant. On the consumption side, this corresponds to the electricity demand of a city in Europe with 1 million inhabitants. The area occupied by a 1000 megawatt data centre is up to 4 million square metres, which corresponds to the area of 2 x 2 km.
In addition to these large-scale new data centres, the AI trend is also influencing the existing medium-sized data centres and their technical equipment. These data centres need to install new servers with GPUs and AI capabilities in addition to their existing CPU-based servers, as their customers want to operate their own AI models in a private data space.
2 Environmental impacts
2.1 Energy
2.1.1 Global development of electricity consumption
The development of energy consumption in data centres worldwide is a recurring topic in scientific papers and forecasts by market research institutes. The results differ considerably. This is because there are almost no mandatory reporting requirements for data centres and no reliable statistics. In most cases, the results are obtained from sales figures for IT equipment, based on the investment volume of data centre operators, based on surveys conducted by industry associations or by estimating known construction projects. Only since 2024, the Energy Efficiency Directive (European Parliament 2023) introduced the requirement that European data centres with a capacity of 500 kilowatts or more must document their annual consumption in a data centre database. However, no analyses from this database are currently available.
For this study, we have evaluated the market analyses of four trustworthy research institutes. They differ in part in their local focus and in the time periods for which the data is given and to what extent they project into the future.
The outlook study published by the International Energy Agency in April 2025 (IEA 2025) estimates global energy consumption by data centres in 2023 at 361 terawatt hours (excluding cryptocurrencies) and forecasts an increase to at least 669 and at most 1,264 terawatt hours by 2030, with an average compound annual growth rate (CAGR) of between 9 and 20%. In addition, the International Energy Agency estimates that data centres for cryptocurrencies have consumed 126 TWh of electricity in 2023 but does not include this number in its forecast until the year 2030. To fill this gap, the annual increase in energy consumption by cryptocurrencies has been estimated by us at a cautious CAGR of 7%, based on the trend from 2021 to 2024 as documented by Digiconomist (2025) in the “Bitcoin Energy Consumption Index”. However, it should be noted that the energy consumption of cryptocurrencies is directly related to their market value, which is known to be highly volatile. The forecast for cryptocurrencies data centres is therefore subject to considerable uncertainty. In our study, we have assumed that consumption of all data centres in 2023 will be 487 TWh including data centres for cryptocurrencies as the base value, i.e. as the starting point for all further forecasts.
The study by the management consultancy Deloitte (Deloitte 2024) has also taken 2023 as the base year for energy consumption with a value of 382 TWh (probably without cryptocurrencies) and forecasts the development with a CAGR of 14% up to the value of 970 TWh in 2030 and even beyond that to 2050 (3550 TWh).
The market research institute McKinsey (2024) does not look at electricity consumption (TWh) but at the electrical connection capacity of data centres (GW). In 2023 it’s 55 GW (which corresponds to electricity consumption of up to 482 TWh) and will end up with values between 171 GW and 298 GW in 2030 (accordingly up to 1498 and 2610 TWh) There is a linear correlation between connection capacity and electricity consumption, especially for hyperscale data centres that aim for the highest possible utilisation over the entire year. Therefore, annual growth rates calculated for connection capacities (18 to 27%) have an equal effect on electricity consumption.
The most detailed study on this topic comes from the Lawrence Berkeley National Laboratory (LBNL 2024). It describes the dynamics of the data centre market with a detailed look at the various IT and air conditioning technologies. The US study names the year 2023 for the inventory (176 TWh for the US) and makes a forecast until the year 2028 with annual growth rates between 13 and 27%
However, the results of the LBNL study only refer to the US market, which is significant, but only a part of global consumption.
On the basis of these four studies plus the assumptions for cryptocurrencies, we have calculated the compound annual growth rates, both for the average (16% CAGR) and for the respective deviations downwards (12% CAGR) and upwards (20% CAGR). In Figure 2-1, the lower and upper scenarios are shown with solid lines, and the average scenario with bars. The underlying data assumed a continuous increase in the energy efficiency of computer servers due to technical developments Still, all scenarios are associated with a high absolute increase in energy consumption. The efficiency increases are therefore always exceeded by the growth in data centre capacities.
Figure 2-1: Future Scenario of global data centre (DC) electricity consumption
Annual Electricity Consumption in TWh
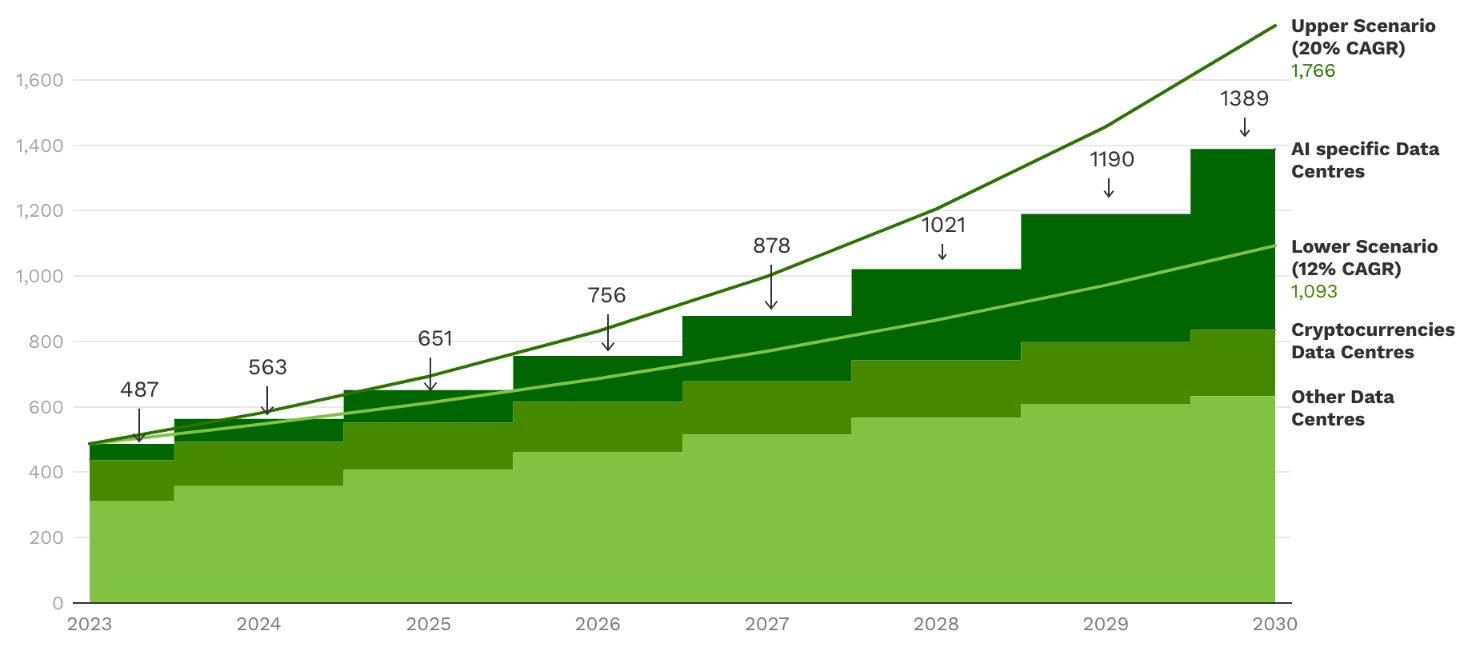
Starting from 487 TWh in 2023, the electricity consumption of data centres worldwide will grow at an annual rate of 16% in the average scenario. In 2028, electricity consumption will have more than doubled to 1,021 TWh and in 2030 it will have almost tripled to 1,389 TWh. Accordingly, data centre electricity consumption will double approximately every five years. This is a significant increase in the annual growth rate compared to historical development. In the past, global data centre electricity consumption has doubled approximately every 10 years (Hintemann and Hinterholzer 2022). The AI trend has led to a reduction of this doubling period to 5 years.
Uncertainties in this forecast are expressed by the two solid curves of the lower and upper scenarios of the total data centre electricity consumption. In the lower scenario with an annual increase of 12% (light green line), doubling occurs after 6 years; in the upper scenario with a CAGR of 20% (dark green line), it occurs after just 4 years.
Figure 2-1 divides the total electricity consumption of data centres into the three areas of AI-specific data centres, cryptocurrencies data centres and all other (traditional) data centres. The breakdown for AI (upper bar) is based on the “Share of AI specific to total global data centre electricity consumption” shown in Figure 1-2. The electricity consumption of AI-specific data centres will rise from 50 TWh in the year 2023 to 554 TWh in 2030, representing an annual growth rate of 41% and equivalent to an elevenfold increase within seven years
Source: own compilation based on IEA 2025; Deloitte 2024; McKinsey 2024; LBNL 2024; Digiconomist 2025
The split for cryptocurrencies (middle bar) is based on the energy consumption of 126 TWh in 2023, as stated in the IEA study (IEA 2025), and the assumption for the annual growth rates of cryptocurrencies electricity consumption of 7%, resulting in a value of 202 TWh in 2030. The energy consumption of traditional data centres (bottom bar) will increase at a compound annual growth rate (CAGR) of 11% from 311 to 633 TWh/a by 2030, reaching approximately twice its initial value by 2030. If you look at the lower and upper scenarios in Figure 2-1, which are represented by solid lines, the electricity consumption of data centres in 2030 will reach a minimum of 1,093 TWh and a maximum of 1,766 TWh.
2.1.2 Local effects on electricity grids
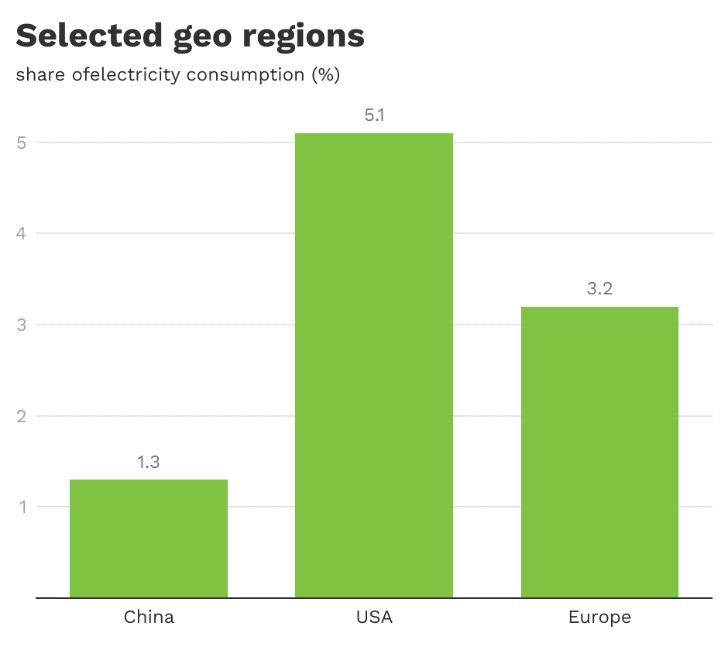
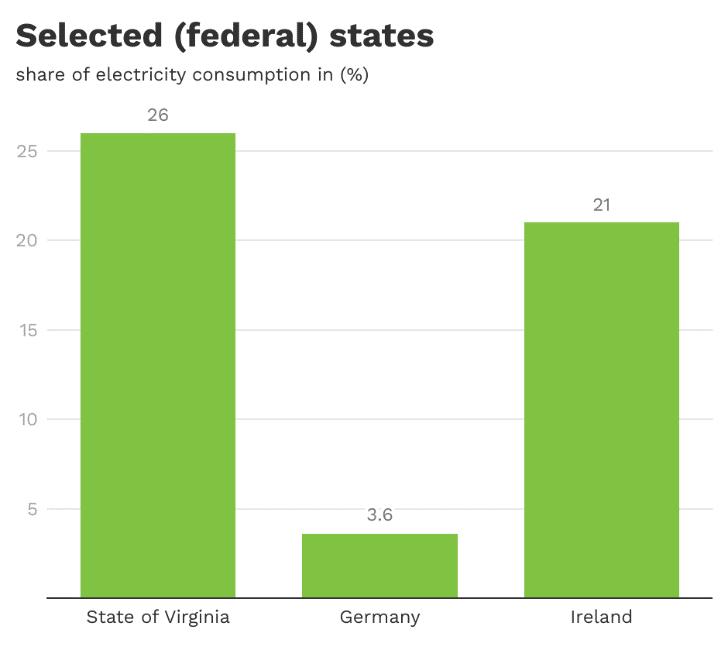
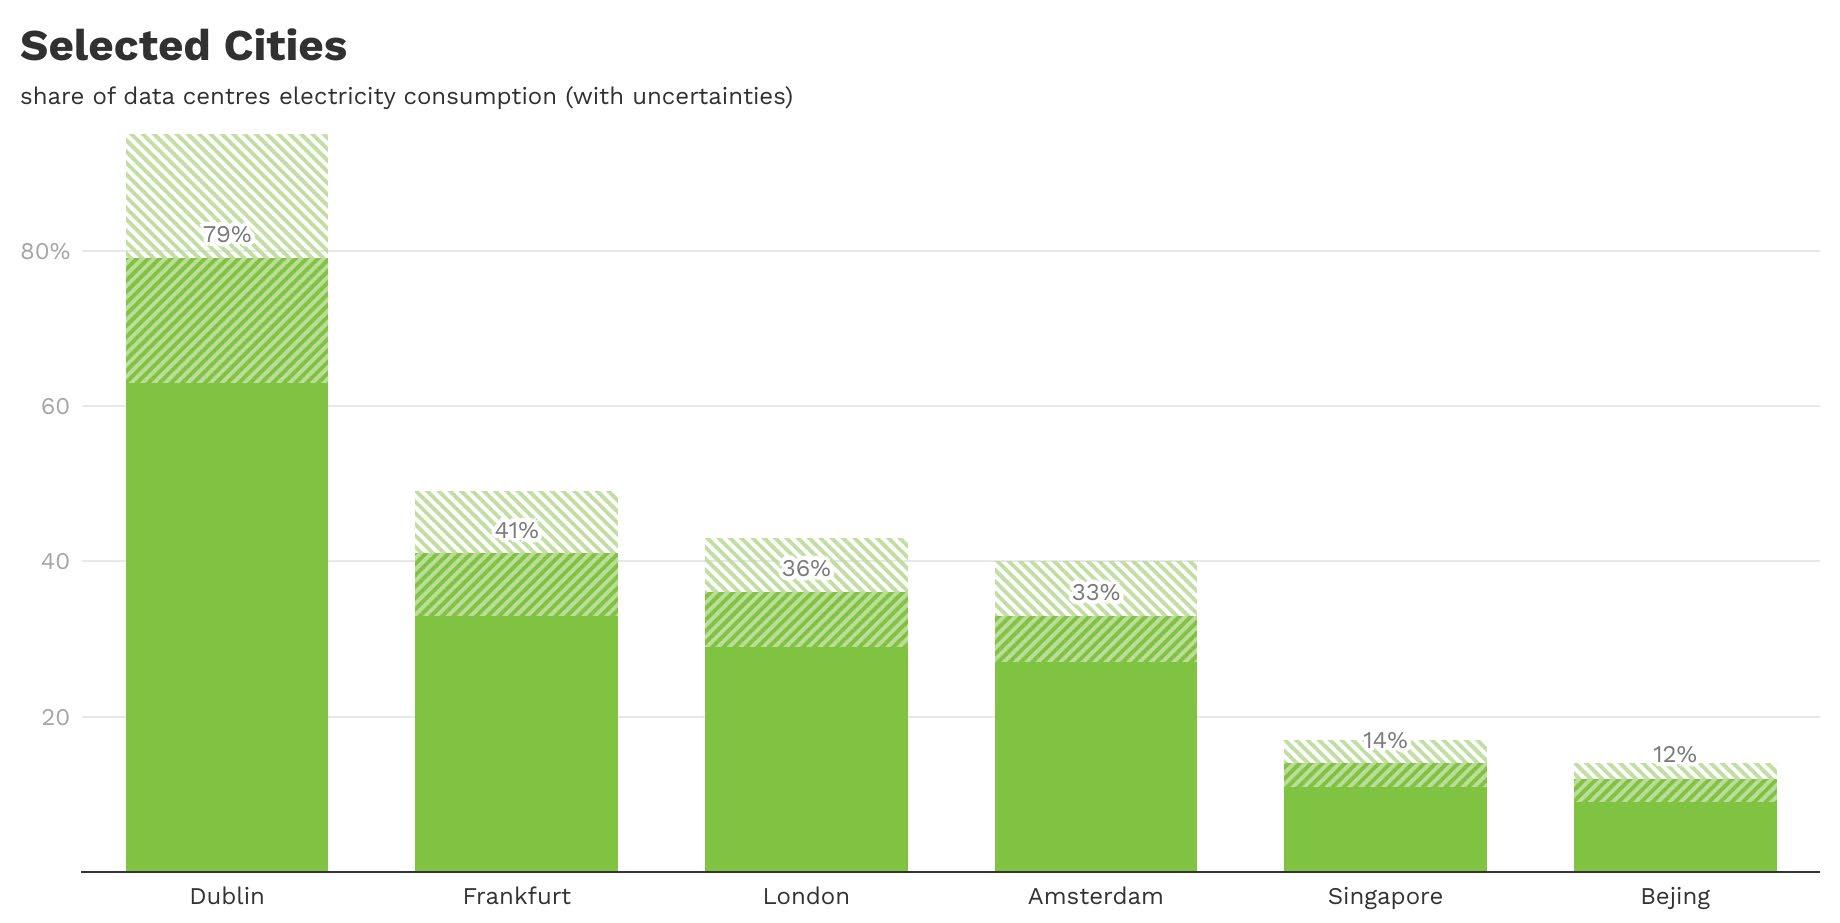
The location and thus the energy consumption of data centres is locally highly concentrated. The following chart Figure 2-2 shows the share of electricity consumption of data centres per region relative to the region's total electricity consumption
While the share of data centres’ electricity consumption is between 1.3% and 5.1% on a geo- regional level, in the US State of Virginia and Ireland it is 26% and 21%. It even reaches 33% to 41% in cities like Amsterdam, London, and Frankfurt and almost 80% in Dublin. These proportions shall be treated with some caution, as different sources were used for electricity consumption of data centres and the respective regions. IEA estimates the share of data centre electricity consumption in Ireland to 17%. For the cities, we assume that for data centre energy consumption the regional scope might be larger than for the electricity consumption of the city. For Frankfurt, the primarily found data indicated more electricity use from data centres than consumed in total. This bug could be corrected by extrapolating the city’s electricity consumption from 2014. We therefore added hatched error bars in the city chart for an estimated systematic relative error of 20%.
Figure 2-2: Estimated share of electricity consumption of data centres to the total electricity consumption in the respective region in 2023
Source: own compilation based on: McKinsey 2024; IEA 2024a, 2025 and other sources 1
Another source of highly concentrated energy consumption are the fabs, the manufacturing sites of AI chips. It is estimated to almost 1 TWh in 2024 and distributed over very few locations in Taiwan, South Korea and Japan (Vries 2025).
We see though that governments react to the pressure the data centre industry is putting on local electricity grids Ireland’s Commission for Regulation of Utilities (2025) has issued requirements for new data centres because this high local electricity consumption poses a threat to the security of public supply in the respective local area. Locations for new data centres in Ireland are limited to regions that are compatible with the electricity grid. Data centres must keep available a certain power of back-up generators or energy storage. Additionally, grid operators are allowed to reduce the power delivery to data centres if necessary. In that case, data centre operators need to pass the requirement to reduce power consumption on to the IT operators and customers
In the past, such procedure was not imaginable Data centre operators used to rely on an uninterrupted and constant power supply, around the clock (EIA 2024a) Also in the USA, electric power generation and distribution will reach its limits if consumption accelerates as described. The States of Virginia and California, the hot spots of data centre operation in the USA, are the largest importers of electricity within the United States. They mainly rely on non-renewable sources such as natural gas and nuclear power (EIA 2024b).
1 https://www.mynewsdesk.com/uk/harrisonhunteragency-dot-com/news/477935 https://www.borderstep.de/wp-content/uploads/2023/04/Studie-Markt-Rechenzentren-Hessen-2022_final-1.pdf https://ember-energy.org/app/uploads/2024/11/Global-Electricity-Review-2023.pdf https://www.eia.gov/energyexplained/electricity/use-of-electricity.php https://ember-energy.org/latest-insights/european-electricity-review-2024/eu-electricity-trends/ https://www.eia.gov/electricity/state/virginia/ https://www.ceicdata.com/en/china/electricity-consumption/cn-electricity-consumption-beijing https://data.london.gov.uk/download/leggi/cd697dad-d50b-4646-a8ed-e9dd4734a561/LEGGI%202022_v3.xlsx https://www.ema.gov.sg/resources/singapore-energy-statistics/chapter3 https://statistikportal.frankfurt.de/ASW/ASW.dll?aw=Versorgung%20und%20Umwelt/Stromverbrauch https://www.ams-institute.org/news/amsterdam-could-meet-nearly-half-its-electricity-needs-by-better-utilizing-its-rooftops/ https://www.cso.ie/en/releasesandpublications/ep/p-mec/meteredelectricityconsumption2023/keyfindings/
2.1.3 Greenhouse gas emissions
The energy consumption of data centres is not a quantifiable environmental impact in itself. It only becomes one when the emissions and environmental impacts caused by electricity generation are considered. In corporate greenhouse gas reporting, electricity consumption is therefore assigned to so-called Scope 2 emissions (World Resources Institute 2004). These emissions do not arise directly in the company (in the data centre) but in the supply chain when electricity is purchased. In addition to greenhouse gas emissions, electricity generation also causes other environmental impacts, such as water consumption, land use, emissions of other air pollutants and, of course, radioactive waste. The following section focuses on greenhouse gas emissions.
Greenhouse gases are measured in CO2 equivalents (CO2e), which includes both carbon dioxide emissions and all other greenhouse gases, such as methane (CH4) and nitrous oxide (N2O), which are converted to the greenhouse potential of CO2 using equivalence factors Greenhouse gas emissions from electricity generation depend on the type of power plant and the fuel used in it.
The power plant-specific values depend on the efficiency of the respective plants, their manufacturing effort and the losses incurred during the production of the primary energy carrier and transport to the power plant. Since a country's electricity is typically generated by a large number of different power plants using different energy sources, a specific emission factor is obtained for each country or for each electricity grid zone. The website Electricity Maps (2025) allows users to track the emission factors of the various regions worldwide in real time. This is because the emission factor also varies throughout the day depending on how strongly the sun is shining, how hard the wind is blowing, or which power plants are currently being switched on or off. If annual averages for a country's electricity generation are used, as documented for example by the International Energy Agency (IEA 2024b), then the respective CO2e emissions associated with electricity consumption within a country can be calculated. In terms of the data centres examined here, this means that their CO2e emissions depend on the respective country, as well as the power grid and time of day at which they are operated.
In their sustainability reports (see chapter 3.2), the big tech companies currently often only state CO2e emissions, while energy consumption is usually left out. They make it easy for themselves by multiplying the amount of electricity they consume by an emission factor that is purely calculated from the amount of electricity purchased, for example, from renewable sources. This method does not take into account whether this renewable electricity is even connected to the data centre's power grid or whether it was produced at the same time when the data centre consumed it. This is possible because electricity is not transmitted directly from the producer to the consumer; instead, electricity supply contracts and power grids ensure spatial and temporal decoupling. For example, it is possible to purchase licences for hydroelectric power from Norway and to offset these quantities against electricity consumption in the USA.
To calculate the greenhouse gas emissions caused by data centres, it is necessary to know both the locations and their local energy consumption. The data situation is already poor for the aggregated values. It is even more insufficient for the location-based values. Nevertheless, simple estimates are used below to obtain an order of magnitude. The International Energy Agency (IEA 2025) indicates that 43% of electricity for data centres in 2023 were consumed in the United States, 23% in China, 18% in Europe, and 16% in other geographical regions such as other Asian countries (except China), South America and Africa No distinction was made here as to whether the increase in data centre capacities would vary from region to region.
For the emission factors used to convert energy consumption (kWh) into greenhouse gas emissions (kg CO2e), we use the emission factors for the respective regions for the base year 2023
(0.393 kg CO2e/kWh for the USA, 0.584 kg CO2e/kWh for China, 0.300 kg CO2e/kWh for Europe, and 0 484 kg CO2e/kWh as a world average for the others) (Ember Electricity Data Explorer, emberenergy.org). We also assume that these emission factors will continue to decline to zero by 2040 as countries strive to meet their climate protection targets. In 2030, the emission factors will therefore reach 59% of the value from the base year 2023
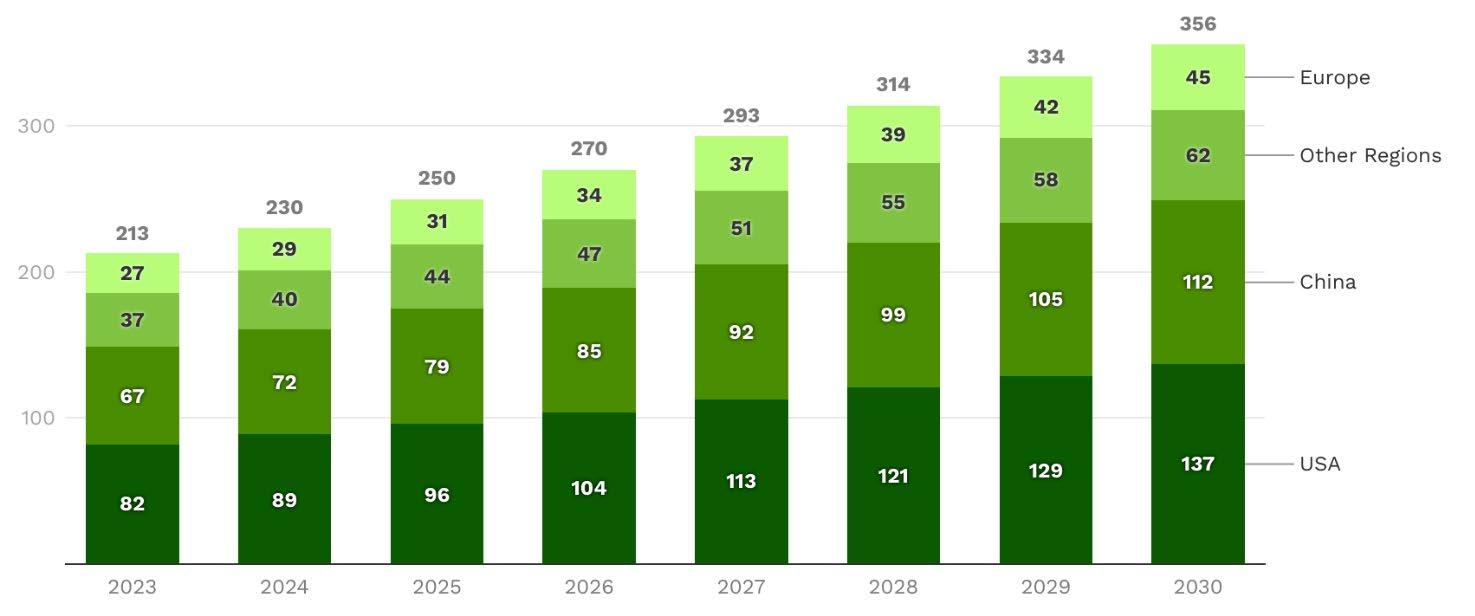
The greenhouse gas emissions that result from the electricity consumption of data centres are shown in Figure 2-3
Figure 2-3: Estimated greenhouse gas emissions from data centres (2023-2030) by geographical region
Million tonnes CO2e from data centres by geo region
Source: own calculation based on expected electricity consumption (Figure 2-1), share between regions based on IEA (2025), electricity emission factors from ember-energy.org and own assumptions for declining emission factors
Greenhouse gas emissions from data centres worldwide in 2023 were 213 million tonnes (Mt) of CO2e and will rise to 356 million tonnes in 2030. In the US, emissions will rise from 82 million tonnes in 2023 to 137 million tonnes in 2030. In China from 67 to 112 million tonnes, in Europe from 27 to 45 million tonnes, and in other regions from 37 to 62 million tonnes
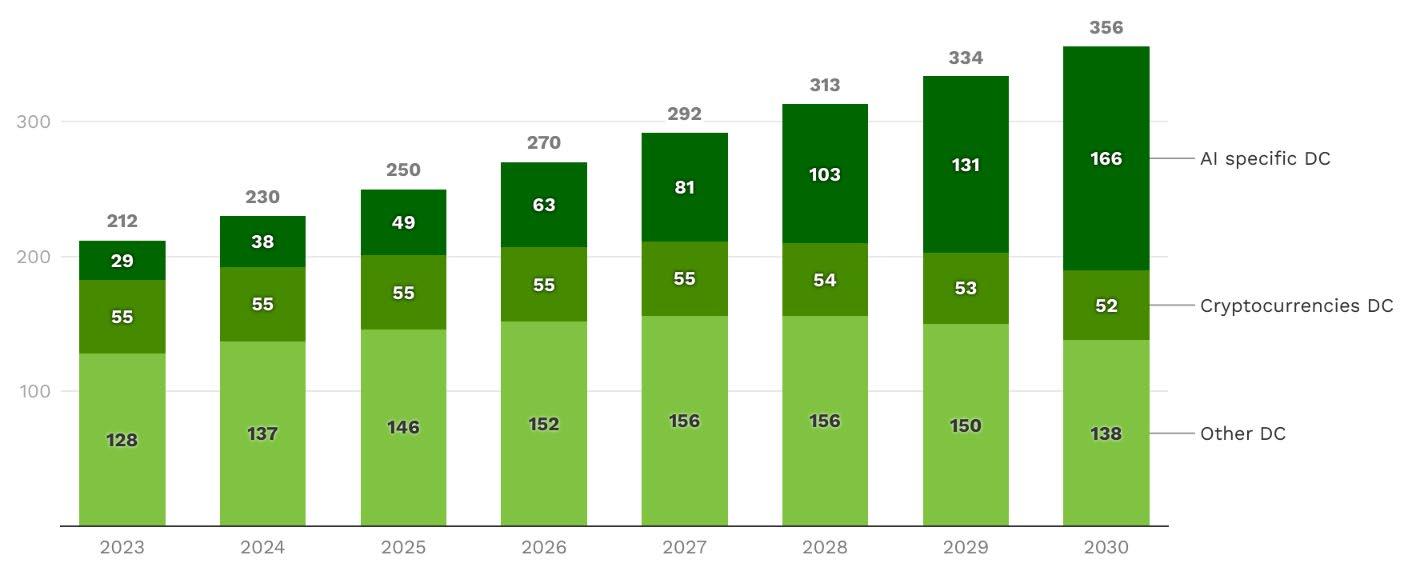
In Figure 2-4, we have broken down the total emissions into the three different types of data centres that we used to categorize electricity consumption in Figure 2-1
Figure 2-4: Estimated greenhouse gas emissions from data centres (2023-2030) by type
Million tonnes CO2e from data centres by type
Source: own calculation based on expected electricity consumption (Figure 2-1), electricity emission factors from ember-energy.org and own assumptions for declining emission factors
In Figure 2-4 we can see that greenhouse gas emissions from traditional “other” data centres (bottom bar) will rise moderately from 128 Mt in 2023 to 156 Mt in 2027 and will then decline to 138 Mt in 2030 due to reduced emission factors in the electricity generation which overcompensate the moderate growth The emissions from cryptocurrencies data centres (middle bar) remain almost constant, starting at 55 Mt in 2023 and reaching the slightly lower level of 52 Mt in 2030. However, there is a sharp increase in greenhouse gas emissions from AI-specific data centres (upper bar). Starting at 29 Mt in 2023 they are increasing to 166 Mt in 2030, which is even higher than the emissions from traditional data centres and corresponds to an almost sixfold increase (factor 5.7).
This forecast does not take into account the individual efforts of data centre operators to purchase electricity with lower emission factors, for example from renewable energy sources. To carry out a corresponding calculation, it would have to be ensured that this electricity was not only taken from the existing power grid, for example through power purchase agreements, but that the energy generation plants were built specifically for the data centres. This is usually not the case.
2.1.4 Nuclear plans
Large data centres that provide their services globally are usually working at high operational load around the clock. This allows the existing information technology to amortise as quickly as possible and generate the most profit. However, the disadvantage of this type of operation is that the energy consumption of these data centres is almost constant day and night. While there are daytime fluctuations on the electricity generation side with wind and solar energy, the data centre also requires a lot of energy when there is no renewable electricity available in the power grid. At night or when there is no wind, fossil-fuelled power plants fill the electricity gap. These are usually natural gas power plants or coal-fired power plants. At present, the additional consumption caused by the expansion of AI data centres is therefore essentially generated by running climate-damaging fossil fuel power plants over longer periods of time (McArdle and Terras 2025)
As the growing usage of fossil energy contradicts the promises made by the big tech companies to become climate-neutral by 2030 (see chapter 3.1), they have recently started focussing on nuclear energy. The reasoning behind this is that, firstly, they produce climate-neutral electricity and,
secondly, as non-flexible power plants, they have precisely the generation profile that they need for their current operation. Instead of responding flexibly to the renewable electricity availability, the companies are relying on an outdated power technology that poses significant risks to people and the planet as a whole.
Microsoft has signed a guaranteed purchase agreement with Constellation Energy for the entire output of the yet-to-be-upgraded 1st block of the Three Miles Island nuclear power plant in Pennsylvania, extending the life of the more than 50-year-old power plant by another 20 years (CEG 2024) Amazon invests in the development of water-cooled Small Modular Reactors (SMRs) by the energy companies Energy Northwest in Washington state and Dominion Energy in Virginia (Amazon 2024c) Google guarantees the American start-up Kairos Power the purchase of its electricity from the minireactors yet to be developed, which are to be cooled with liquid salt (Google 2024b). And Meta is looking for project developers who can operate functioning SMRs for the company from the year 2030 (Meta 2024b). In this ranking, Microsoft is closest to the goal of actually receiving electricity from a nuclear reactor (classic design) from 2028. For the other tech companies, the announcement of new reactor concepts is speculation on the technical feasibility, economic viability and successful operating licence.
The use of nuclear energy for power generation has always been associated with high risks. Even if a reactor accident occurs very rarely, the consequences are so devastating that nobody can take responsibility for them. No insurance company in the world would therefore insure a nuclear power plant. The damage is always at the expense of people and the environment. At the Three Mile Island nuclear power plant (Pennsylvania, USA), a partial core meltdown occurred in block II in 1979, destroying the reactor (Wikipedia 2025). Around the Chernobyl nuclear power plant (now Ukraine), which had its accident in 1986, there is now a radioactively contaminated exclusion zone covering an area of several thousand square kilometres, which will remain uninhabitable for an unforeseeable period of time. After the reactor disaster in Fukushima (Japan) in 2011, 160,000 people had to be relocated. To this day, 30,000 people are still unable to return to their villages due to the high levels of radiation (Steffen 2023)
The types of power plant now being discussed, water-cooled Small Modular Reactors (SMRs) or alternative reactor concepts that use liquid metals or salts as coolants, are ultimately just technical systems that always bear the risk of failure. Although such risks can be generally reduced by an elaborate safety architecture, they can never be completely eliminated.
Nuclear power is expected to cost more than 120 $/MWh (Liebreich 2024), at least twice as much as the energy price of 45 - 70 $/MWh that is expected for the combination of solar energy with battery storage in the USA according to the International Energy Agency (Schneider et al. 2024, Figure 69). Instead of relying on nuclear energy, it would therefore make much more economic sense to invest in large battery systems located close to data centres and store renewable energy in these systems so that it is available around the clock.
Another mistake that the tech companies are making is the assumption that the nuclear power generated would be climate neutral. Even in a conventional large-scale nuclear power plant, the emission factor of the electricity generated is 25 kg/MWh on average (IPCC 2014). This is due to the high energy input required to produce the nuclear fuel and the immense expense of building the nuclear plant itself. In the case of SMRs, this expenditure is even higher in relation to the amount of energy generated due to the lack of scaling effects. In contrast, electricity generation with renewable energies leads to emission factors of 3 kg/MWh for hydropower, 10 kg/MWh for off-shore wind power, 18 kg/MWh for on-shore wind power and 57 kg/MWh for electricity from photovoltaics with polycrystalline cells (Lauf et al. 2024)
The fact that the tech companies are trying to promote nuclear energy as ‘clean energy’ can only be explained by their deliberate ignorance of the environmental impact and risks of this form of energy. The extraction of uranium as a fuel is already associated with considerable environmental pollution in the respective mining regions. Burning the nuclear fuel rods produces radioactive substances, such as plutonium, which are suitable for the construction of nuclear weapons. The operation of nuclear reactors, whether large or small, is always associated with the production of radioactive waste. To date, there is not a single disposal site in the world that could safely store this radioactive waste for the long period of 1 million years. Any further production of nuclear waste therefore represents a mortgage on the future that coming generations will have to pay off.
2.2 Water
With the increasing number of data centres, their water consumption is also on the rise. In this chapter, we highlight the impacts of AI on water consumption. That is water withdrawal and permanently removing it from its source e.g., by evaporation. This consumption can occur in different areas. It can be directly caused by the data centre through the evaporation of water for cooling purposes (Scope 1), during the generation of electricity (Scope 2) or in the supply chain (Scope 3). In the following, we describe which cooling technologies are used in data centres, why they lead to water losses and what this means when extrapolated to the total of all data centres. In the supply chain, we distinguish here between the water consumption associated with the production of information technology and the water needed to generate the electricity to operate the data centre. The various water consumptions have a different regional reference. Therefore, it must be evaluated in each individual case whether this leads to a shortage of water for the population, agriculture or other industries and businesses, or whether there is sufficient water in the respective region.
2.2.1 Cooling technologies
A data centre converts all the electrical energy used to operate the IT into heat. At the same time, the devices are not allowed to heat up a lot. Thus, the energy consumed by a data centre must be removed from the computer rooms at relatively low temperatures. Therefore, the IT power must be counterbalanced by an equally powerful cooling technology.
Simplified, there are three ways of getting the heat out of a data centre Based on LBNL (2024) they are the following:



Direct cooling is applicable when the air temperature outside it is below 12°C. The outside air can then be used to cool down the air in the data centre via a heat exchanger (also known as “economizer”). Instead of air as a cooling medium, water (e.g., river water) can also be used for direct cooling.
Evaporative Cooling can be used in the case of hot and dry outside environments. The warm medium from inside the data centre is cooled by outside air whose temperature is lowered by evaporating water. Dry cooler with adiabatic assist or evaporative cooling towers are used.
Chillers are used when the difference of the warm medium from the data centre and outside temperature is not sufficient or negative i.e., outside it is warmer than inside. The chiller achieves the temperature difference by compressing a cooling agent (temperature increase) and by expanding it (temperature decrease). The heat transfer medium is circulated in a closed loop. The cooling principle of a chiller is comparable to that of a household refrigerator.
If applicable, direct cooling is the most energy-efficient cooling technology. Evaporative cooling is also energy-efficient, but results in water losses. The chiller technology requires the most energy. Evaporative cooling is therefore often used for energy-saving reasons, replacing electricity consumption with water consumption (LBNL 2024).
In many cases, two or three principles are combined, to achieve the most energy-efficient and flexible cooling system Either in series or in parallel for different seasons of the year, depending on the size of the data centre and local climate conditions.
In practice, the water consumption of data centres is often described using the key figure Water Usage Effectiveness (WUE). It is defined according to the EN 50600-4-9 standard and calculates the water consumption in litres per unit of electricity consumption of the information technology. The unit of WUE is litre/kWh.
The water consumption of cooling systems can vary widely, ranging from 0 to more than 4 litres/kWh. The most water-intensive technology is a water-cooled chiller with an evaporative cooling tower without an economizer. This technology has a water consumption of 2.3 to 4.1 litres/kWh and an average value of 3.2 litres/kWh (LBNL 2024) Liquid cooling in series and waterside economizers in parallel during favourable weather conditions can reduce average water consumption down to 2.0 litres/kWh “Notably, the application of airside economizers with adiabatic cooling (water-cooled chiller) is prevalent among hyperscale data centres. Their optimized operational practices enable extensive use of airside economizers to support data centre cooling, with sporadic adiabatic cooling resulting in minimal water consumption” (LBNL 2024). Through the use of free cooling and economizers, the specific water consumption of data centres (WUE) is therefore significantly lower in practice than the individual cooling technologies consume on their own.
Remark on waste heat utilization: The heat that leaves the data centre has the potential to be used for industrial purposes or domestic heating and save energy and fossil fuels at another place. Especially convenient solutions exist for high temperature waste heat e.g., from liquid cooling. In the district heating network, the heat is transported by circulating water. Apart from the fact that this water has to be filled in once, it is not lost or evaporated, but recirculated. It shall not be confused with water evaporation in cooling systems.
2.2.2 Water consumption of data centres worldwide
For the US data centre market LBNL (2024) define four data centre sizes (“space categories”): 1. Small, 2. Midsize and Colo, 3. Hyperscale and 4. AI specialized For these sizes, together with their local distribution and the weather conditions of the USA, the study calculates an average water efficiency values per size The resulting numbers are listed in Figure 2-5. They are average values that also include data centres that do not use water cooling. Therefore, the actual WUE of a single data centre can be significantly higher.
Figure 2-5: Average Water Usage Effectiveness in the US for different data centre sizes
WUE in Litres/kWh

Source: LNBL (2024)
Depending on the size of the data centre and its technical specifications, water consumption in relation to IT electricity consumption varies between 0.32 and 0.67 litres/kWh. The average value is 0.36 litres/kWh. Scaled with the electricity consumption of the data centres in the USA, this results in 66 billion litres of water consumption by data centres in North America in 2023 (LBNL 2024). This number doubled during the last ten years and is expected to double again during the next four years (ibid.) The specific water consumption figures are estimates by LBNL (2024) based on simulations. In practice, data centre operators have reported significantly higher values of up to 5 litres/kWh in some cases. 2 The following extrapolation of water consumption is therefore a conservative estimate and may actually be significantly higher.
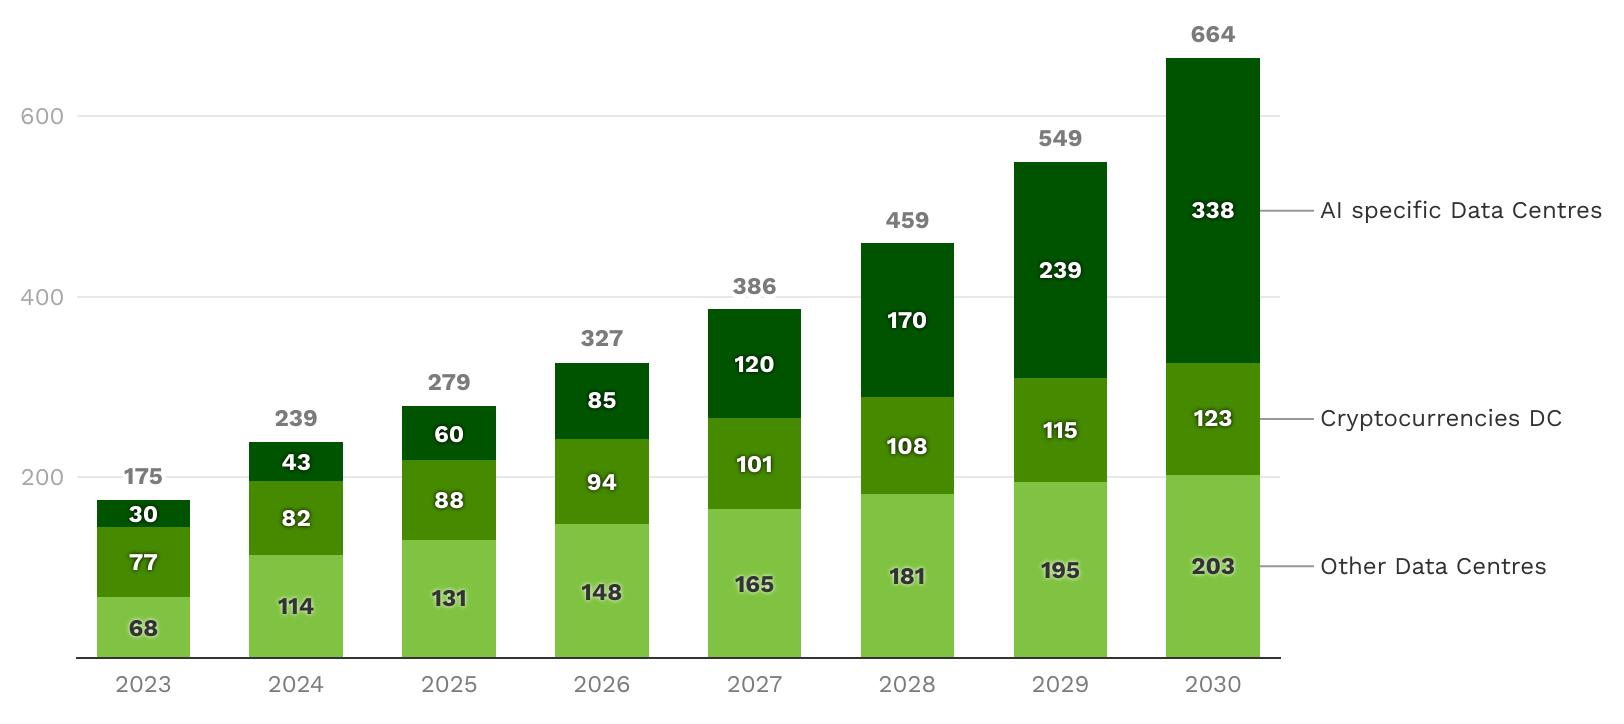
If we assume the same distribution of cooling technology around the globe as for the USA, we can scale the water consumption for the global data centre stock This results in a water consumption of data centres globally of 175 billion litres in the year 2023
Figure 2-6: Estimated global water consumption by data centres
Billion litres water consumption by data centres globally
Source: Own estimation
2 As reported by Ernst & Young during the workshop on the European Union data centre energy efficiency assessment and reporting scheme on 5 May 2025.
The 175 billion litres in 2023 can be broken down into 68 billion litres for traditional data centres, 77 billion litres for cryptocurrencies data centres, and 30 billion litres for those specialising in AI. For AI specific data centres and for cryptocurrencies, which are also very computing-intensive and comparable to AI infrastructures, we assume a specific water consumption of 0.61 litres/kWh according to LBNL (2024). For other data centres, we assume a value of 0.32 litres/kWh. The forecast for water consumption up to 2030 is based on these figures.
By 2030, absolute water consumption of data centres will have increased to a total of 664 billion litres, with conventional data centres accounting for 203 billion litres, cryptocurrencies data centres for 123 billion litres, and AI-specialised data centres for 338 billion litres. AI data centres will therefore consume more water in 2030 than conventional data centres and cryptocurrency data centres combined. As a result, average specific water consumption (WUE) will rise from 0.36 litres/kWh in 2023 to 0.48 litres/kWh in 2030.
2.2.3 Water consumption of AI chip production
It is difficult to determine the water losses in chip production and even more difficult to allocate them to IT equipment for data centres or even AI specific data centres. We therefore only highlight individual data sources below and make estimations for the global chip production which will also include chips for other IT equipment.
Taiwan Semiconductor Manufacturing Company (TSMC), the manufacturer for NVIDIA, withdrew 105 billion Litres in 2022 and discharged 71 billion litres of wastewater. The water withdrawal per 12-inch equivalent wafer mask layer was 137 litres/wafer (TSMC 2024) Ultra-pure water is an important process ingredient for chip production and intermediate cleaning. The production of ultrapure water requires a large amount of freshwater. The wastewater contains hydrofluoric (HF) acid wastewater, acidic, caustic, and organic wastewater, chemical mechanical planarization wastewater (containing copper and cobalt), sulfuric acid wastewater and other wastewater. (ibid.)
TSMC has a market share of 64.9 percent in the global semiconductor foundry market (Statista 2025). Thus, we can assume global water withdrawal for computer chip production of less than 200 billion litres in year 2022 The rapid increase of production capacities happened mainly in the two years after. For AI chip production, we observe an increase of the output by a factor of 3 between 2023 and 2024 (Vries 2025)
In contrast, Water-Europe estimates 45 billion litres of wastewater in 2024 for the chip factories (fabs) in the EU, that have a production capacity of 10% of the global market (Calasso et al. 2024). If we take this amount as a basis for an estimate of global water consumption, we arrive at 450 billion litres worldwide, more than twice as high as the figure obtained from the TSMC data.
2.2.4 Water consumption of electricity generation
The generation of electrical energy requires not only primary energy sources such as coal, natural gas, uranium, wind or sun, but also water. Water is used in the exploitation of energy sources (e.g. in agriculture for bioenergy) and in the production of power plant technologies (e.g. generators or PV systems). To operate hydroelectric power plants, large reservoirs are dammed up, causing a significant amount of water to evaporate from the water surface. However, most power plants are powered by thermal processes. To generate a temperature difference for operating the generators,
they require cooling towers that continuously evaporate water. Fossil-fired power plants, nuclear power plants, geothermal and solar thermal power plants therefore all consume large quantities of water directly at the power plant site (Jin et al. 2019)
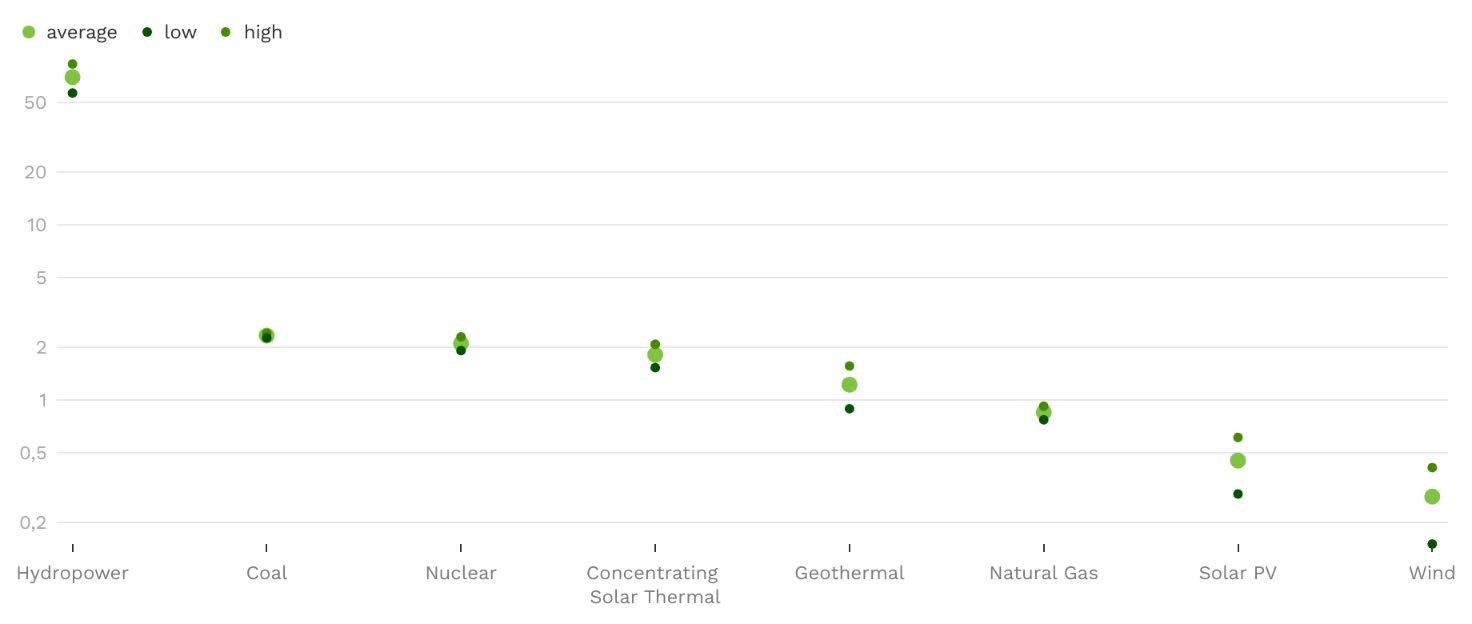
The following figure shows the water consumption for various types of power plants.
Figure 2-7: Water consumption of various power generation technologies (including manufacturing efforts and losses during operation)
Litres water per kilowatt hour electricity [l/kWh]
Source: own compilation based on Jin et al. (2019)
Specific water consumption is shown in Figure 2-7 on a logarithmic scale so that the high water consumption of hydropower (almost 70 litres per kilowatt hour) can be represented. Among the other technologies, coal-fired power plants (2.33 l/kWh) and nuclear power plants (2.1 l/kWh) have particularly high water consumption. However, plants that use renewable energies, geothermal energy and concentrated sunlight to steam water, also require a comparatively large amount of water (1.81 l/kWh and 1.22 l/kWh respectively). At 0.85 l/kWh, the water consumption of gas-fired power plants (gas turbines) is slightly lower. And the lowest consumption is found in PV systems with 0.45 l/kWh and wind power plants with 0.28 l/kWh. For the latter two plants, water consumption is dominated by the manufacturing effort (Jin et al. 2019)
With every kilowatt hour consumed in the data centre, additional water is being lost in the supply chain to produce the electricity. If we compare the water consumption of electricity generation (Scope 2 emissions) with the water losses directly in the data centre (Scope 1 emissions), we see that the water consumption in electricity generation is significantly higher. The ratio between the water losses in power generation to the direct losses in data centres must still be corrected by the PUE factor, because the energy consumption of non-IT equipment has to be added to the energy consumption of the IT, which is what the WUE value refers to. Therefore, the following formula applies:
Ratio = Specific water consumption of power generation * PUE / WUE
Assuming a value of Water Usage Effectiveness WUE = 0.36 litre/kWh for direct water losses in data centres, according to LBNL (2024), and an average global value for the Power Usage
Effectiveness of PUE = 1,55 from the year 2024 (Uptime Institute 2024) this results in ratios for the different power generation technologies as shown in Table 2:
Table 2: Ratio between water losses in power generation to direct losses in data centres
Source: own calculation based on Jin et al. (2019), Uptime Institute (2024), LBNL (2024)
By far the largest ratio between water losses from electricity generation and those from the data centre's cooling system occurs with electricity from hydropower (ratio 301). If the energy used to operate a data centre comes from a coal-fired power plant, the water losses in energy generation (Scope 2) are ten times higher than the direct losses (Scope 1) caused by the cooling system in the data centre. Nine times as much water is lost in the case of nuclear power, almost eight times as much in the case of concentrating solar power plants, and so on, up to twice as much in the case of photovoltaic electricity and roughly the same amount of water loss for wind power. This comparison in Table 2 shows, on the one hand, that the water losses from data centres are much higher than the amounts of locally lost water would suggest. On the other hand, the ratios also show that there is a high potential for savings by choosing a water-efficient power generation.
2.3 Resources
In this chapter, we estimate the material consumption of devices needed for AI. We highlight servers and data storage products as they are the material backbone of AI. The training and inference takes place predominantly in large server facilities. There is a trend though to integrate AI chips also in end-devices. At this point, we cannot quantify this trend.
2.3.1 Raw materials for server and data storage production
Servers and data storage products contain a variety of materials, most of them in very small amounts. Data availability for AI specific devices is limited To grasp the order of magnitude, we use a standard server for our calculations. AI servers are likely to require more material in the power supply unit, heat sinks and the GPU The most recent bill of material (BOM) of a standard server is compiled by Leddy et al. (2024) The total weight of a standard server is 15.82 kg which is dominated by the chassis made from iron or aluminium. All the included materials are grouped in Table 3.
Table 3: Grouped bill of material of a standard server Raw
Critical raw materials (CRM) 1 42
Strategic raw materials (SRM) 1 12
Plastics 0 910
Conflict Minerals (3TG) 0 0715
Precious metals 0 0025
Rare earth elements (REE) 0 0007
Source: Leddy et al. (2024), sorted according to material groups laid down in (European Commission 2023)
The raw material groups in Table 3 are overlapping e.g., 1.2 g of gold enter the precious metals, the non-ferrous metals and the 3TG conflict minerals. The four Conflict Minerals defined as 3TG in the EU Conflict Minerals Regulation are tin, tantalum (strategic raw material), tungsten (critical raw material) and gold. All the four conflict minerals are used in server and data storage products (Gydesen and Hermann 2024). The list of Critical Raw Materials (CRM) underlies a political definition addressing supply concerns, first launched in 2008 in the EU Raw Materials Initiative (European Commission 2023). 87 raw materials were screened by a criticality assessment in the 2023 report and 34 selected for the CRM list. Strategic Raw Materials (SRM), revealed by the same screening, denote materials that are “important for technologies that support the twin green and digital transition and defence and aerospace objectives” (European Commission 2023) The Rare earth elements (REE) found in servers and data storage products are especially magnetic materials, praseodymium, neodymium, and dysprosium. They are essential for hard disk drives The only materials found in servers that were not screened by the criticality assessment were plastics, barium, and calcium. The latter two make up 0.11kg and are classified with the non-ferrous metals.
The CRMs are dominated by 1.42 kg aluminium (bauxite), the SRM by 1.0 kg copper. Both dominate the non-ferrous metals. The amount of all the other materials is small per product and component Additionally, “the content of CRMs in PCBs [printed circuit boards] varies considerably (due to size, grade, application, included components, manufacturer etc.).” (Gydesen and Hermann 2024)
2.3.2 Global data centre stock
To get an idea of the order of magnitude of the raw materials used in data centres worldwide, we scale the raw material intensity per server with its electrical input power to the global electrical connection power. This is a crude assumption which is not valid in detail. For example, the materials in processors and on the printed circuit board will scale with the power, but very different than the chassis and other components Furthermore, this projection only takes into account the materials contained in the products and not those used for production or within the supply chain.
LBNL (2024) estimates an average power consumption per server to 600 W. We have verified the figure for the EU stock with 15 million servers (Kamiya and Bertoldi 2024) and a connected IT capacity of around 9 GW in European data centres and arrived at the same average value. Thus, 600 W per server is our reference point
In the same way, we can estimate the global stock of servers from the global energy consumption of 487 TWh in 2023 By taking into account an average PUE value of 1.55 (Uptime Institute 2024) and an average server utilization rate of 80%, we will achieve an IT connection capacity of 45 GW, which corresponds to 75 million servers in 2023. Based on the values of a single server (Table 3), we use this to calculate the resource footprint of the global data centre inventory in Table 4
Table 4: Estimated raw materials bound in global server and data storage inventory in 2023
Source: Based on Leddy et al. (2024); (LBNL 2024; IEA 2024a), sorted according to material groups laid down in (European Commission 2023), estimated material flow with a refresh rate of ¼ per year.
This rough calculation gives us an overview of how much raw material is contained in the existing server stock:
‒ Steel: we compare the amount of iron and ferrous metals in servers to the amount of steel that is contained in the building of data centres. Whitehead et al. (2015) indicate that the data centre “structural infrastructure” contains 5.18 kg/kW/year of steel. It is understood to be the construction steel of the data centre building. The racks make up an additional 0.619 kg/kW/year. We divide the 920,000 t of ferrous metals (see Table 4) of the servers by 45 GW and an assumed average lifetime of 4 years (yearly refresh rate 1/4). This results in 5.1 kg/kW/year, which is quite similar to the construction steel in a data centre building
‒ Critical Raw Materials (CRM): The figure of 107,000 tonnes is dominated by aluminium, whose ore, bauxite, is classified as a critical raw material. Less prominent are strontium and tantalum, which account for 45 and 23 tonnes respectively. The global productions are 520,000 t and 2,400 t respectively (Hatfield 2024; Friedline 2024).
‒ The Conflict Minerals (3TG) tin, tantalum and tungsten contribute with 4,500 t, 23 t and 750 t to the global stock of raw materials in servers and storage products For the latter two, this represents less than 1% of global production volumes of 2,400 and 78,000 tonnes, respectively.
‒ Global Rare Earth Elements (REE) contained in servers sum up to approximately 53 t, compared to 350,000 t annual oxide production and 110 Mt reserve (Cordier 2024)
We can conclude from this estimation that relative to global production rate of raw materials the amounts of materials in servers and data storage products are hardly conspicuous. The raw materials used in IT technology are not a significant driver of rising global demand for natural resources. The development of new raw material sources to meet demand, such as deep-sea mining, cannot be justified by the resource hunger of AI technology.
Of greater strategic importance than raw material demand, however, appear to be dependencies in chip production, where we are seeing high market concentration. Taiwan Semiconductor Manufacturing Company (TSMC) has a market share of 64.9 percent in the global foundry market (see section 2.2.3) This might be associated with import dependency but does not give rise to concerns due to environmental issues per se.
2.3.3 Recycling of Electronic Waste
At the end of the useful life, the server and data storage devices end up as waste electric and electronic equipment (WEEE), or e-waste AI significantly contributes to the creation of waste streams. “Generative AI technology could create between 1.2 and 5 million tonnes of e-waste between 2020 and 2030” (Wang et al. 2024) This would add to the existing annual 62 Mio. t of e-waste globally (European Commission 2024; Baldé et al. 2024)
Based on our own projection of expected resource requirements from the previous chapter, assuming an average technology lifespan of four years, the annual amount of electronic waste from servers and storage products will be 0.2 million tonnes in 2023. The expansion of data centre capacities will increase this annual amount of e-waste to 0.8 million tonnes in 2030. Between 2023 and 2030, this will result in approximately 4.2 million tonnes of electronic waste from servers and storage products. Added to this will be e-waste from other data centre products such as network components, cables, batteries from uninterruptible power supplies, transformers, air conditioning systems, etc.
It is to be feared that “a larger share of e-waste still ends up being exported illegally and is handled by informal recycling methods”, as Gydesen and Hermann (2024) describe.
Due to very low concentration and high number of materials, the recycling of many materials is often economically not preferred This concerns especially chips and semiconductors and their doping materials. For other materials, such as Critical Raw Materials, there is still a very low recycling rate. “The main barriers are lack of recycling facilities and market infrastructure for recycled CRMs.” (Gydesen and Hermann 2024)
Still, the equipped printed circuit board (PCB) i.e., the chips, conductors, heat sinks etc., contain the economically valuable materials. “The PCBs are both the component with the highest environmental impact and with the highest scrap price. PCBs have been identified as the most environmentally impactful components of DC equipment and the ones with the highest economic and environmental benefits if recycled by takeback schemes.” (ibid.)
Widening the scope to other e-waste also, the Global E-Waste Monitor 2024 foresees “a drop in the documented collection and recycling rate from 22.3% in 2022 to 20% by 2030 due to the widening difference in recycling efforts relative to the staggering growth of e-waste generation worldwide”. Currently, just 1% of rare earth element demand is met by e-waste recycling (Kuehr et al. 2024)
2.4 Indirect environmental impacts
2.4.1
Beyond Direct Environmental Effects
The public debate about ecological impact of AI currently focuses on “direct effects”. This is not surprising, given the striking numbers with respect to the obvious resource and energy footprints of AI hardware and their foreseeably exponential rise However, this perspective is demonstrably narrow. It becomes increasingly clear that so called “indirect” and “systemic” environmental effects of AI are at least equally significant and have been insufficiently considered so far. Indirect (or “second order”) effects result from behavioural or structural changes as a consequence of the development and use of AI which in turn affect other processes, structures and lifestyles (Luccioni et al. 2025) “Systemic environmental effects” emerge, when indirect effects scale, as AI applications achieve widespread adoption, potentially reconfiguring entire economic sectors, cultural practices, and resource flows (Gailhofer et. al. 2025)
However, the terminology of “indirect effects” is itself problematic, as it may suggest minor ‘side effects’ that are not intended. Such “indirect effects” actually represent the core functionality of AI systems – by definition 3 , these systems are designed to modify their social or natural environment according to human-defined objectives, either by influencing human behaviour or by acting autonomously according to specific objectives. When recommender systems influence what consumers buy, or when production optimization software reshapes how industries operate – these aren't secondary or indirect effects; they represent the very essence of what these systems are built to do. 4 Insufficient attention on such effects may have important political implications: As Clutton-Brock et al. (2021) suspect, the disproportionate emphasis on computational emissions may deflect attention from more fundamental questions about how AI technologies are deployed to advance existing economic and political agendas. A too “narrow focus on direct emissions”, as Luccioni et al. (2025) adequately point out, also “misrepresents AI's true climate footprint, limiting the scope for meaningful interventions”. 5 A critical analytical challenge thus lies in understanding how these technologies are instrumentalized to perpetuate existing patterns of resource exploitation and consumption-driven growth.
2.4.2 “Indirect effects” of AI: A Typology
With respect to such “indirect effects” of AI systems, we should broadly differentiate between intended and unintended environmental effects. Intended “indirect effects” directly result from an AI system's primary purpose and the underlying business models driving its development. In contrast, unintended environmental indirect effects represent what can be called the “ecological alignment problem” (Gailhofer et al., 2023, cf. Gaffney et.al., 2025). This refers to the challenges of ensuring that AI technologies actually perform in ways that align with their providers' or users' original goals. These unintended effects can manifest through various specific mechanisms. To date, detailed scientific analyses of the risks of AI systems have mainly focused on safety aspects or more general ethical problems, e.g. with regard to discrimination against people. Some of the phenomena described in such analyses, however, can be plausibly extrapolated with regard to environmental risks. Whilst research into environmental effects is still in its infancy, the first detailed studies illustrate how AI systems shape behaviour in environmentally significant ways and support such general considerations.
2.4.2.1 Intended environmental effects: Steering towards environmental harm
As an example 6 for intended “indirect effects”, scientists observing the use of predictive AI in the mining sector note a strong focus on economic and financial optimization. AI applications are primarily designed to streamline resource discovery and extraction. While some synergies with
3 Prominently Article 3 of the EU AI Act defines an AI system as a machine-based system that is designed to operate with varying levels of autonomy and that may exhibit adaptiveness after deployment, and that, for explicit or implicit objectives, infers, from the input it receives, how to generate outputs such as predictions, content, recommendations, or decisions that can influence physical or virtual environments.
4 Compare Gailhofer et. al., Umweltrechtliches Regulierungskonzept algorithmenbasierter Entscheidungssysteme, Scientific Report for the Environmental Protection Agency, Chap. 2.2.2., forthcoming 2025, see https://www.oeko.de/projekte/detail/umweltrechtliches-regulierungskonzept-algorithmenbasierterentscheidungssysteme/
5 In view of this (not least political) relevance of the terminology, it may be plausible to speak of “steering effects” instead of indirect effects of AI.), Wolfgang Hofmann-Riem proposes the concept “Techno-Steering” (see Hofmann-Riem 2022, 137), cf. Gailhofer (2025) Given the prevalent use of the term “indirect effects” in the scientific debate, we will continue to apply it here, albeit in inverted commas.
6 For a more comprehensive account see, for example, Gailhofer et. al. (2025), Gailhofer et. al. (2021).
environmental goals exist, promising ecological use cases – like mine waste disposal or long-term production optimization – receive little to no attention from AI modelers (Corrigan & Ikonnikova 2024). Instead, AI tools enable companies to analyse vast geological datasets to identify previously overlooked mineral deposits and accelerate the pace at which new extraction projects are developed (cf. Dauvergne 2022). To this end, the Norwegian University of Science and Technology (NTNU), for example, has established the 'Centre for Integrated Operations in the Petroleum Industry', which focuses on the development of novel AI-based methods for optimizing oil and gas production (Dale & Uglane 2018).
In a comparable manner, ”smart farming” applications often focus on use cases of large conventional farms and thus potentially weaken the competitiveness of smaller and possibly more sustainably producing farmers (Bronson et. al. 2021). Others observe, that such systems often optimize for yield and efficiency and, for example, prioritize the production of a few crops, neglecting biodiversity: “Since the economic benefits of automation and associated applications of AI and automation seem to be the greatest for larger farms, investments in these technologies could create strong incentives for both larger and more simplified agricultural landscapes, despite evidence that smaller farms tend to be most productive and biodiverse over longer time periods." (Galaz et. al. 2021).
Dauvergne (2022) points out regarding the AI implementation in global supply chains, that significant environmental impacts of AI applications may follow from so called rebound effects – sometimes associated with the narrower concept of the Jevons paradox – where technological efficiency gains lead to increased consumption of energy or resources 7: AI-driven optimization in logistics, production, and resource management frequently produces micro-level efficiency improvements. However, these gains frequently trigger systemic rebound effects. Transnational corporations typically reinvest cost savings from AI technologies into expanded production, potentially neutralizing or reversing initial environmental benefits. For example, AI-enhanced logistics that reduce per-unit transportation emissions may simultaneously incentivize increased shipping volumes, maintaining or expanding total environmental impact. Dauvergne also highlights the role of AI in corporate greenwashing strategies. Transnational Corporations (TNCs) leverage AI's potential for energy optimization and waste reduction in Corporate Social Responsibility (CSR) communications, while simultaneously obscuring the technology's significant environmental costs, such as elevated data centre energy consumption, and growing electronic waste volumes (Dauvergne 2022).
Ecologically harmful “indirect effects” are not limited to commercial applications. Innovations regarding autonomous vehicles (AVs) present a good example of such effects related to consumer applications. Research by Millard-Ball using traffic simulation with real San Francisco data revealed striking environmental consequences: since autonomous vehicles don't need to park, they could simply circle city blocks at low speeds while waiting for their owners. This would lead to a 90 percent reduction in parking costs, while simultaneously entailing a considerable increase in travel distances as autonomous vehicles continuously circle or seek out more distant parking spaces. The simulations showed this could more than double vehicle traffic in urban centres (Millard-Ball 2019).
The rise of “persuasive systems” powered by generative AI may reshape consumption patterns with remarkable precision. Modern recommendation systems don't just suggest products similar to what consumers have purchased before; they identify psychological triggers and optimal moments to influence behaviour (cf. Sanderson 2023). When such applications in online shopping suggest a complementary product at the perfect psychological moment during checkout, or when food delivery apps use predictive analytics to suggest ordering just as the user`s hunger typically peaks, they're
7 For a detailed analysis of problems related to rebound effects in the environmental discourse on AI see Luccioni et al. (2025).
not merely responding to existing desires – they are actively shaping behaviour toward increased consumption (cf. Rohde et. al. 2021).
2.4.2.2 Unintended Environmental Effects: The Ecological Alignment Problem
Beyond intended indirect effects, AI systems generate unintended environmental impacts through problems of ”ecological alignment” (Gailhofer et. al. 2023, Gaffney et.al., 2025). The concept of ”alignment” here refers to the tendency of AI systems to deviate from their initially programmed goals through autonomous adaptation, potentially generating outcomes that diverge from the original intentions of the provider or user of a system. AI technologies exhibit basic structural features that can generate unintended negative impacts across various contexts. According to broad, more general research, e.g. by Stray (2020), Cave & ÓhÉigeartaigh (2019), and Baum (2020), these limitations include structural tendencies to prioritize rather narrow optimization metrics, struggle with representing complex pluralistic values or goals, discount long-term consequences, or risk generating harmful feedback loops. While these challenges, again, are not specifically environmental, they suggest that significant risks generating unintended consequences can also occur when technological systems are applied to complex, environmental domains
Some scientific analyses of the emergence of unintended environmental indirect effects indicate that it is plausible to extrapolate such more general observations to the issue of environmental effects. AI applications thus may generate unintended consequences through systemic misalignments between technological systems and ecological complexity Contextual nuances, local knowledge, or unexpected human behaviours are prone to be inadequately integrated into the system’s design and implementation. As a prominent example, data biases emerge from critical limitations in data collection and representation that fundamentally distort the output of AI systems, potentially with severe environmental effects. Corrigan and Ikonnikova (2024) show how predictive AI tools in the mining sector predominantly incorporate geological and economic variables while systematically excluding environmental dimensions such as groundwater contamination, habitat fragmentation, or community health impacts.
Another example, as an instance of what has been called a “transfer context bias”, AI systems developed for large, data-rich industrial agricultural operations fail when directly applied to different contexts, such as small-scale farming systems. They thus encode assumptions that become problematic when moved outside their original environment (Galaz et. al. 2021). Similarly, gaps in the stakeholder knowledge and preferences represented in data create systematic exclusions, as Bronson et al. (2021) document in agricultural AI applications. Such applications, again, predominantly reflect industrial agricultural models while marginalizing local ecological knowledge and sustainable practices. Finally, problems may result from unanticipated human-AI interactions, when farmers misinterpret soil condition recommendations (“interpretation bias”). Instead of optimizing resource use, such users build on AI-recommendations to maximize fertilizer application, contradicting the technology's intended environmental goals (Galaz et. al. 2021). The complexity of input factors leading to environmental effects also implies specific problems of responsibility and attribution: For instance, who is responsible if an algorithm results in an automated application of inputs like pesticides that is inappropriate (reducing yields and increasing costs) or even forbidden (e.g., using larger quantities than allowed)? Is it the farmer, the hardware provider, or the software provider? (Finger 2023).
It is important to note that the same technological capabilities that generate environmental risks on the other hand offer significant potential for ecological benefits. Such potentials highlight the critical importance of strategically indirect AI-based instruments towards “green” objective functions. While much discourse emphasizes AI's efficiency potentials and capacity to generate novel environmental
knowledge, these technologies also present innovative regulatory tools. Davidova and Sharno (2023) demonstrate AI's potential as ”smart regulation” tools in agrifood sectors, capable of improving environmental management standards and enhancing regulatory compliance. Xu (2024) further documents AI systems' transformative potential for Environmental, Social, and Governance (ESG) risk assessment, revealing their capacity to analyse complex value chain interactions through advanced technological governance mechanisms.
3 Self-declarations of tech companies
3.1 Sustainability pledges
Tech companies are trying to present themselves as sustainable. Their corporate sustainability reports (CSR) give the impression of an ever more efficient digital sector, supporting and enabling carbon neutrality. In this context, data centre operators and owners have set up the Climate Neutral Data Centre Pact (CNDCP), a pledge to make data centres in Europe climate neutral by 2030 (CNDCP 2025a) The Self Regulatory Initiative sets targets in five areas: energy efficiency, clean energy, water, circular economy and circular energy systems
For energy efficiency, new and existing data centres shall reach a Power Use Effectiveness (PUE) of no greater than 1.3 in cool climates and 1.4 in warm climates until 2030. The clean energy target requires data centres to source 75% of their electricity from renewable energy or hourly carbon-free energy by the end of 2025 and 100% by 2030 Neglecting the production of radioactive waste and tremendous risks associated with nuclear energy, the CNDCP accounts nuclear power as clean energy. In terms of water usage, new data centres in water-stressed cool climates that use potable water must not exceed a Water Usage Effectiveness (WUE) of 0.4 litres/kWh. For existing facilities, the requirement applies by 2040, only when the cooling system is upgraded. The circular economy goal encourages companies to assess 100% of server equipment for reuse, repair, or recycling and set a target percentage for repair and reuse by 2025. It promotes an increase in the amount of server material repaired or reused, but without a strict performance indicator Finally, for circular energy systems, signatories are only required to explore possibilities to interconnect with waste heat users, and evaluate whether heat reuse is practical, environmentally beneficial, and cost-effective (CNDCP 2025a)
In March 2025 the pact had 129 signatories, including four out of the five above mentioned leading players in the field of artificial intelligence Google, Amazon (represented by their cloud provider AWS), Meta and Microsoft are all signatories to the pact and theoretically commit themselves to its targets (CNDCP 2025b).
3.2 Analysis of sustainability reports
To analyse the company´s self-declarations and the current state of the implementation of the CNDCP, the sustainability reports haven been searched for their claims in the five target areas introduced above (Google 2024a; Apple, Inc. 2024; Amazon 2024a; Microsoft 2024; Meta 2024a) This was done using 2024 reports from all five major tech companies, including Apple, even though they did not sign the CNDCP. Data and information which is not published in these reports was not considered. With one exception: where the sustainability reports did not provide sufficient information on the use of nuclear energy, other publicly available sources were used to complement the analysis.
In the corporate sustainability reports, many sustainability efforts are presented in a way that makes it difficult to assess their actual impact. Reports often use overly specific claims, such as stating
that almost 100% of particular server racks were recycled, without providing broader context on overall recycling rates (Amazon 2024a). At the same time, many statements remain vague, like mentioning that renewable energy projects are located in the same grid as data centres, without clarifying whether this applies to all or just a few projects (Meta 2024a). Similarly, terms like "major commercial partner" in renewable energy initiatives lack clear definitions (Microsoft 2024)
A key issue is the frequent lack of reference points, for example, companies report energy savings, repaired components, or recycling rates, but without stating how these figures relate to total energy use or material consumption, making their relevance unclear.
Additionally, companies showcase a wide range of initiatives and pilot projects, yet they rarely provide transparency on the scale of their potential impact in relation to the constantly increasing energy and resource consumption of data centres. This lack of clarity makes it even more difficult to evaluate the sustainability claims
In the following sections, the sustainability claims are summarised for each of the five targets of the CNDCP, supplemented by the topic of nuclear energy, which is not defined as clean energy here, but is shown separately due to its special risks
3.2.1
Energy Efficiency
Tech companies emphasize energy efficiency improvements in their reports, mainly showcasing potential savings compared to older technologies or previous years. However, these reports rarely put savings into context with the total electricity consumption of data centres, which continues to rise. In fact, total energy use is hardly ever mentioned, and when it is, it is compared to global electricity demand, making the industry's share appear minor (Google 2024a). As required by the Climate Neutral Data Centre Pact (CNDCP), its members report the Power Usage Effectiveness (PUE) of their data centres. This is mostly done compiled as a global average, where the target is met with values from 1.08 to 1.15. Overall, companies focus on the potential of AI to drive efficiency (Green by AI). For example, Meta claims that AI applications enable a smaller footprint for similar computing power compared to older data centres (Meta 2024a). While these efficiency gains are important, there is a lack of transparency around total electricity use and the increasing energy demands of AI
3.2.2 Renewable Energy
The claim to use 100% renewable energy for data centres is one of the most prominently reported achievements by the tech companies, presenting themselves as leaders in corporate renewable energy procurement. All five companies report a 100% match of their data centre’s electricity consumption by renewable energies This match is primarily done through different types of certificates and power purchase agreements (PPAs) on a global and annual basis. However, this accounting method allows for methodological loopholes, as energy production may not always align with actual consumption patterns. A Guardian article suggests that data centre emissions could be 662% higher than what companies report (O'Brien 2024). Even Google acknowledges this discrepancy, noting that despite maintaining a 100% renewable energy match, its greenhouse gas emissions continue to rise. To address this issue, Google promotes local and hourly accounting rather than annual matching on a global level (Google 2024a) All sustainability reports highlight exemplary renewable energy projects, such as investments in solar, wind, geothermal energy, and renewable diesel for backup power. While these efforts contribute to more renewable energy in the grid, they are not set in relation to the overall and ever-increasing electricity demand of data centres and the remaining gap which is currently filled by fossil and nuclear power plants.
3.2.3 Nuclear Energy
Leading players in the field of AI are increasingly turning to nuclear energy to meet the growing electricity demands of their data centres, often framing it as a carbon-free, stable, and abundant energy source. Google explicitly defines nuclear as clean energy and has signed agreements to purchase electricity from small modular reactors (SMRs) (Google 2024b). Amazon similarly justifies its investments in nuclear and has signed three new agreements to support nuclear projects, including SMRs (Amazon 2024b). Meta has gone a step further, expressing interest in developing its own nuclear power projects specifically to power its AI data centres, which require massive amounts of energy (Meta 2024b). Microsoft promotes "advanced nuclear" as a key part of its carbon-free electricity strategy (Microsoft 2024), yet the term "advanced" is not clearly defined, leaving questions about what distinguishes these projects from conventional nuclear power. Apple stands out as the only company in this analysis that has not publicly announced any plans to invest in or to use nuclear power.
3.2.4 Water Efficiency
Water Usage Effectiveness (WUE) is used as key metric in the CNDCP with regards to water efficiency (see chapter 3.1). Those companies which publish their WUE are all complying with CNDCP limits, ranging from 0.18 l/kWh to 0.3 l/kWh (Meta 2024a; Microsoft 2024; Amazon 2024a) The companies highlight year-over-year improvements. However, these reports do not contextualize WUE in relation to total water consumption, making it difficult to assess the true impact of efficiency measures. In contrast, Google discloses its total water use of their data centres, which increased by almost 20% in 2023, reflecting the similar rise in electricity demand but does not mention the WUE The majority of information on water usage relates to water stewardship initiatives, freshwater replenishment projects and certifications from the Alliance for Water Stewardship. Amazon and Meta claim to become "water positive," pledging to return more water to communities than they consume in their direct operations (Amazon 2024a; Meta 2024a). However, this approach does not account for regional differences in water stress, raising concerns about whether these initiatives truly benefit the areas most affected by water scarcity. The average WUE also conceals information about which regions consume the water, as an article in The Guardian points out: “In 2023 Microsoft said that 42% of its water came from “areas with water stress”, while Google said 15% of its water consumption was in areas with “high water scarcity”. Amazon did not report a figure.” (Barratt 2025)
3.2.5 Circular Economy
Circularity in data centres is mainly addressed by reporting on the share of decommissioned components which are kept in circulation. Some companies publish ‘waste diversion rates’, which range between 80 and 90% (Google 2024a; Apple, Inc. 2024), but they do not specify how this diverted material is handled, whether it is repaired, reused, or recycled . Similarly, Google reports to have resold 7 million hardware components from data centres - failing to define what qualifies as a "component" or what share of total materials this represents (Google 2024a) Data on repaired and reused components within data centres remains limited, with a few exceptions. AWS reports that 13% of its spare parts come from its own reuse inventory, giving some insight into internal material circulation (Amazon 2024a). Meta states that "hundreds" of new server racks include reused components, but without quantifying their share of total racks (Meta 2024a). They are engaging in the Open Compute Project, which promotes standardized, modular and reusable hardware for data centres (Open
Compute Project 2025) While companies highlight some progress in extending the lifespan of data centre hardware, the lack of detailed data makes it difficult to assess the actual impact of these initiatives. Without clearer reporting on how much material is reused versus recycled or resold, it remains uncertain how effectively companies are reducing waste and resource consumption.
3.2.6 Waste Heat Reuse
None of the companies reported exploring options or having specific plans to implement waste heat recovery projects. Only Google reported being in line with all five CNDCP targets including circular energy systems (see chapter 3.1), but as the target is rather vague it is not clear at what stage a potential use of waste heat from Google data centres is
4 Sustainable artificial intelligence
How can developers and users of artificial intelligence ensure that it is sustainable and does not harm the environment, society or the economic system, but rather makes a positive contribution in all dimensions of sustainability? Answering this question would, of course, go beyond the extent of this short study.
However, various scientists and institutions have already considered the topic of sustainable artificial intelligence from a wide range of perspectives in the past. Based on existing discussions, the AI4People project developed an ‘Ethical Framework for a Good AI Society’ (Floridi et al. 2018), which applies social standards to AI applications (beneficence, non-maleficence, autonomy, justice, explicability). In 2021, the SustAIn project (Rohde et al. 2021) published sustainability criteria for artificial intelligence and specified concrete minimum requirements in the sustainability dimensions of environment, society and economy, which can be assessed using a checklist. When it comes to the practical application of good AI practices, sustainability criteria are often reduced to environmental aspects. The white paper on ‘Sustainability of AI’ published by the consulting company Ramboll (Dubois et al. 2024) calls for efficient hardware and software and provides guidance on evaluating the environmental impact of the actual AI application, which we referred to as ‘indirect effects’ in section 2.4.2. In its ‘Principles for Green Artificial Intelligence,’ Deutsche Telekom (2024) sticks to simple rules that start with the use of green electricity, continue with the selection of suitable, lean AI models, the optimal use of hardware resources and code optimization, and end with the disclosure of CO2 figures.
Based on these different approaches, we have summarised below the most important points that should be taken into account when developing AI applications and evaluating them
1. Objective for sustainable AI
Artificial intelligence can only be sustainable if it is developed with the aim of increasing sustainability. Systems that are designed, for example, to increase efficiency, reduce costs or accelerate processes may be sustainable, but there is no guarantee that they will be used in a sustainable manner. Clear objectives should be set to define the positive characteristics of AI systems and prevent them from being misused.
2. Necessity of AI
Is the use of artificial intelligence, with its associated environmental impacts, appropriate for the objective in question? It is very appealing to stop structuring certain tasks clearly and developing rule-based algorithms, and instead use machine learning to perform the task. In many cases, however, there are already very good conventional solutions for specific tasks, often even
analogue or human solutions. Therefore, before developing an AI solution, it should always be checked whether artificial intelligence is the right tool for the task at hand.
3. Tailor-made solutions (sufficiency)
There is a huge range of AI models of varying complexity and scope that can be used to solve specific tasks. In the interests of sustainability, models should be selected that require particularly little data, little computing time for training and inference, and only little hardware requirements. This criterion also includes the selection of suitable, high-quality and non-discriminatory training data for machine learning.
4. Optimization of software and hardware (efficiency)
The optimization of code, data formats and software architectures offer considerable potential for savings. The same applies to the efficient use of hardware and other technology, which can also be optimized from a resource conservation perspective. This optimization should be integrated into development through a continuous improvement process (build-measure-learn). By choosing explicitly sustainable data centre infrastructures (use of renewable electricity, high efficiency, waste heat utilisation, circularity, etc.), the negative impacts of technical systems can be minimised. Appropriate metrics should be used to continuously monitor the energy consumption and other environmental impacts of AI applications during development and application (inference) and to optimize them in the form of a continuous process (build-measure-learn loop)
5. Disclosure of sustainability impacts (transparency)
If an AI application claims to be sustainable, it must assess and disclose its sustainability impacts using a transparent and verifiable method. This should include both direct negative environmental impacts, such as energy and resource consumption, and any positive effects on the application side (‘indirect effects’). AI applications are only sustainable if the positive effects outweigh the negative ones. In the medium term, all AI services should be equipped with a live-generated data package that provides information about their current sustainability impacts. This data package could be presented in a practical, easily interpretable form, such as a label or product passport.
5 Policy options
The direct effects of AI are considerable. Its infrastructure consumes an exponentially increasing amount of energy, water, land, and a wide range of raw materials, and is associated with non-negligible negative environmental impacts. In addition, there are the environmental impacts of the AI application itself, which are referred to here as “indirect effects”, as well as systemic environmental impacts. Due to the leverage effect of AI, these effects are expected to far exceed the direct effects. Even if some AI applications also enable positive environmental impacts (such as the optimization of technical systems), it cannot be assumed that these environmentally positive options will be used and that they can compensate for the negative effects. It is much more likely that, in an unregulated market, there will be ever-greater use of AI applications that offer high economic potential, have a high level of convenience or entertainment value and accelerate consumption overall. It is therefore crucial to ensure through political measures that AI does not become a threat to climate protection targets, resource conservation and a green transformation. The following sections therefore show the options for action in various areas to intervene in development in line with environmental protection goals. These options for action can be designed with varying degrees of obligation, starting with recommendations, voluntary information instruments, economical instruments, legal information obligations, minimum requirements or prohibitions.
5.1 Transparency about environmental impacts of data centres and AI services
The aim of this policy option is to create transparency with respect to the environmental impacts of AI-systems. Public authorities and the legislator need to be informed about environmental risks and impacts to be able to take regulatory measures. Consumers, professional buyers and public clients should be able to identify environmentally friendly alternatives and procure them with preference. Market dynamics should be used to ensure that AI systems continuously improve their environmental performance. One prerequisite for this is that competition should not be based on dubious environmental claims, but on clear standards and assessment methods that address the full range of problems.
The possibilities for creating more transparency are as follows:
• Mandatory data collection and publication of energy consumption and efficiency indicators for data centres used for AI. This option is already being pursued in the European Energy Efficiency Directive with the newly created European Data Centre Register (European Parliament 2023), with the limitation that the data is aggregated and not publicly available. This register should therefore be further developed and made globally available.
• Introduction of a mandatory efficiency label for data centres, comparable to the energy performance certificate for buildings or the efficiency labels for household appliances. A draft has been presented by Gröger and Behrens (2023).
• Disclosure of the environmental footprint of cloud services, including AI services When using digital services online, information on the respective environmental impacts of these services, for example greenhouse gas emissions, energy and water consumption and raw material demand in relation to a single request or a suitable utilisation unit, should be delivered directly with the service data stream. This enables a comparison of different service providers, an environmentally friendly accounting system and the definition of environment-related metrics that can be optimized over time (Gröger and Liu 2021)
• Mandatory environmental information in a contractual relationship: When invoicing or licensing an AI service, the provider should disclose the environmental impacts caused (e.g. CO2 emissions or amount of radioactive waste) to its customer in a binding manner. A similar obligation was introduced for French internet providers from the beginning of 2022 (Ministère de la Transition Ecologique 12/23/2021).
• To avoid customer lock-in effects and to enable an easy provider change, standardised data interfaces for cloud services should be defined and introduced on a mandatory basis. This helps to prevent the concentration of AI capacities on a few tech providers. The open standard ‘Sovereign Cloud Stack’ (Open Source Business Alliance - Bundesverband für digitale Souveränität e.V. 2025) can serve as a model here.
• Certification of environmentally friendly artificial intelligence. AI systems that actively contribute to environmental goals (after subtracting their direct ecological impact) should be able to make this visible and receive the appropriate attention and market advantages for doing so. To this end, transparent criteria and verification mechanisms should be developed that allow for the certification of sustainable AI (eco-labels for eco-friendly AI).
5.2 Better integration of data centres into energy grids
The local availability of energy must be taken into account. Large data centres, and AI data centres in particular, place a significant burden on local power grids. They reduce the availability of electricity,
lead to rising electricity prices and threaten climate protection targets in the energy sector. When selecting locations, it should therefore be ensured that the additional energy is sufficiently available and does not lead to an undesirable extension of the operating times of fossil fuel or nuclear power plants.
The use of renewable energies in data centres should become the norm to ensure that they do not cause additional greenhouse gas emissions or increase nuclear risks. However, there must be a match between renewable energy generation and electricity consumption. When reporting on the share of renewable energies used to operate data centres, only those quantities of electricity that have been generated on an hourly matching basis and fed into the same electricity grid can be recognised (Beyond Fossil Fuels 2024)
The stress on the power grids is reduced when the energy consumption of the data centre matches the supply on the generation side. Data centres must be able to regulate their electrical power according to the electricity supply. In doing so, they contribute to making the demand for electricity more flexible and to better integrating fluctuating renewable energies. Computing work must then be shifted to or from other data centres as needed. Existing data centre strategies, especially for hyperscale and AI data centres, aim to keep utilisation as high as possible, preferably around the clock, in order to achieve the fastest possible return on investment. Only through regulatory intervention can this economic interest be reconciled with the interest in ensuring the stability of the power grids.
Data centres can also help to make electricity grids more flexible by providing electricity storage capacity. Instead of making data centres maintain their own fossil fuel power generation plants, as is sometimes the practice, data centres should be required to maintain electricity storage capacity (e.g. battery storage).
Data centres can contribute to the energy transition by providing waste heat. This can be used to replace (fossil-fuel-based) heating systems via residual heat networks. The integration of data centres into local heating networks and a requirement for a minimum proportion of reused waste heat (energy reuse factor) should therefore be a prerequisite for the granting of operating licences for new data centres.
5.3 Increasing the energy and resource efficiency of AI applications
AI developers should be able to easily identify and use lightweight and energy-efficient AI models. To achieve this, standardised efficiency indicators should be developed for AI models. AI applications should report live on their energy and hardware requirements during training 8, operation (inference) and retraining.
Hardware life cycle management: The responsible use of hardware resources and the recycling of AI components should be part of every AI system design. To ensure this, material flows should be documented in the planning phase and strategies developed in the industry for how the technical lifespan can be extended, electronic waste reduced, and finally disposed of and recycled in an environmentally friendly manner. An extended product responsibility of the providers also applies to digital services. Even with AI services, profits must not be privatised, and the environmental consequences socialised.
8 See as an example AI Energy Score: https://huggingface.github.io/AIEnergyScore/
5.4
Adapting the legal framework conditions
The European AI Act, with its requirements for high risk and large general-purpose AI models, and the EU Energy Efficiency Directive, with its requirements for data centre reporting, already provide some suitable technology-specific rules for addressing a range of environmental problems associated with AI applications and AI data centres. However, they do not yet match the extent of the ecological implications of AI. The AI Act contains a whole range of governance instruments designed to help provide information on the undesirable effects of AI systems and to intervene effectively. However, its rules are strictly ‘anthropocentric’ and largely ignore environmental effects. In contrast, the existing rules of environmental law are hardly adapted to the new, complex and opaque AI technologies. It is therefore necessary both to supplement European technology law and to make environmental law AI-ready. This is why AI regulation needs to be amended to include specific environmental aspects and environmental law needs to be expanded to include effective ‘technology governance’ (cf. Reuel et.al. 2024, Gailhofer et. al. 2025). A range of such technology- and environmentspecific changes to the legal framework could help to minimise the environmental risks of AI and promote its ecological potential.
Key options for regulatory measures can be summarised as follows (for a comprehensive analysis see Gailhofer et.al. 2025)
• Data access rights for scientific assessments of environmental impacts: The evaluation of the indirect effects of AI applications in particular is complex. Much of the information needed to understand causes and effects of environmental risks of AI is kept secret. In order to understand how the increasing use of such applications affects human behaviour, business processes and the environment, and how AI systems themselves continue to evolve in complex social and ecological contexts, scientists should be given access to data sets and models of ecologically sensitive applications. Access to such data would enable an independent assessment of their ecological impact.
• Data access rights, like other mechanisms for establishing transparency (see above 5.1), can contribute to better information on the existence, causes and extent of environmental risks. Building on the improved information base, ecologically particularly sensitive systems should be subject to stricter risk analyses and reporting obligations. For example, notification systems for AI applications could be considered that require disclosure when AI is used in ecologically sensitive areas. Such a system would enable monitoring and early intervention in high-impact applications through defined thresholds and reporting mechanisms for relevant sectors.
• In addition, data governance obligations for ecologically sensitive AI applications should mandate defining the purposes of data usage and ensuring data completeness and quality during training. Sector specific rules, aligned with the narrower provisions of the EU AI Act, could also help prevent data biases in environmental applications.
• Another reasonable option is an impact assessment framework that provides for the structured and more specific evaluation of AI systems' environmental effects before deployment. An obligation for companies to implement such an assessment could prevent harmful applications and identify improvement opportunities through methodologies that capture both direct and indirect/systemic effects. For instance, the identification of suitable data centre locations and the approval of construction projects should be based on criteria that take into account the availability of sufficient and timely available electricity, space, water and, where appropriate, heat sinks. Civil society cannot be expected to uncover all planning deficits and deal with the local environmental impacts. Instead, environmental impact assessments should be made mandatory for the planning and commissioning of data centres and new AI sites.
• With the increasing use of AI systems in ecologically sensitive AI applications, amendments to environmental legislation should also be considered to establish binding requirements for mitigating AI-specific environmental risks and harnessing technological potential for environmental relief. In other words, specific legal requirements for a ‘sustainability by design’ of AI-based innovations could be defined for ecologically relevant use cases.
List of References
Amazon (2024a): 2023 Amazon Sustainability Report. Available online at https://sustainability.aboutamazon.com/2023-amazon-sustainability-report.pdf, checked on 3/27/2025.
Amazon (2024b): Amazon signs agreements for innovative nuclear energy projects to address growing energy demands. Company communication. Available online at https://www.aboutamazon.com/news/sustainability/amazon-nuclear-small-modular-reactor-net-carbon-zero, updated on 10/16/2024, checked on 3/18/2025.
Amazon (2024c): Carbon-free energy. Investing in nuclear energy. Company communication. Available online at https://sustainability.aboutamazon.com/climate-solutions/carbon-free-energy, updated on 2024, checked on 3/27/2025.
Apple, Inc. (2023): 2023 Environmental Progress Report. Covering fiscal year 2023. Apple, Inc. Available online at https://www.apple.com/environment/pdf/Apple_Environmental_Progress_Report_2023.pdf, checked on 3/27/2025.
Apple, Inc. (2024): 2024 Environmental Progress Report. Covering fiscal year 2023. Apple, Inc. Available online at https://www.apple.com/environment/pdf/Apple_Environmental_Progress_Report_2024.pdf, checked on 3/27/2025.
Apple, Inc. (2025): Apple will spend more than $500 billion in the U.S. over the next four years. Available online at https://www.apple.com/newsroom/2025/02/apple-will-spend-more-than-500-billion-usd-in-the-us-overthe-next-four-years/, updated on 2/24/2025, checked on 4/24/2025.
Ashare, Matt (2025): Amazon to boost AWS capacity with $100B investment, 2/7/2025. Available online at https://www.ciodive.com/news/aws-cloud-capacity-buildouts-capex-generative-ai/739546/, checked on 4/24/2025.
Baldé, Cornelis P.; Kuehr, Ruediger; Yamamoto, Tales; McDonald, Rosie; D’Angelo, Elena; Althaf, Shahana et al. (2024): The Global E-Waste Monitor 2024. Edition 2. Edited by United Nations Institute for Training and Research (UNITAR). Available online at https://ewastemonitor.info/wp-content/uploads/2024/12/GEM_2024_EN_11_NOV-web.pdf, checked on 4/14/2025.
Barratt, Luke (2025): Revealed: Big tech’s new datacentres will take water from the world’s driest areas. In The Guardian, 4/9/2025. Available online at https://www.theguardian.com/environment/2025/apr/09/bigtech-datacentres-water, checked on 4/14/2025.
Baum, Seth (2020): Social Choice Ethics in Artificial Intelligence, AI & Society, vol. 35, no. 1 (March 2020), pages 165-176.
Beyond Fossil Fuels (2024): 24/7 renewable electricity matching is a far more credible approach for the GHG Protocol and the SBTi than the Emissions First Partnership proposal. Available online at https://beyondfossilfuels.org/2024/10/10/24-7-renewable-electricity-matching/, updated on 4/24/2025, checked on 4/24/2025.
Bronson, Kelly; Rotz, Sarah; D’Allessandro, Adrian (2021): The human impact of data bias and the digital agricultural revolution, in: James (Ed.), Handbook on the Human Impact of Agriculture, 2021, 132.
Calasso, Maria Paola; Cheng, Ricky; Kreissig, Julius; Perera, Ashira; Sarkar, Rupali; Vichev, Zhelyan (2024): Socio-economic study on the value of the EU investing in water. Edited by Water Europe. Edinburgh.
Available online at https://watereurope.eu/wp-content/uploads/2024/10/Water-Europe-Socio-EconomicStudy-1.pdf, checked on 4/14/2025.
Cave, Stephen; ÓhÉigeartaigh, Séan S. (2019): Bridging near- and long-term concerns about AI, Nature Machine Intelligence| VOL 1 | JANUARY 2019 | 5. Available online at https://www.nature.com/articles/s42256018-0003-2
CBRE (2024): Global Data Center Trends 2024. Executive Summary. Available online at https://www.cbre.com/insights/reports/global-data-center-trends-2024, updated on 6/24/2024, checked on 3/28/2025.
CEG (2024): Constellation to Launch Crane Clean Energy Center, Restoring Jobs and Carbon-Free Power to The Grid. Company communication from 20/09/2024. Constellation Energy Corporation. Available online at https://www.constellationenergy.com/newsroom/2024/Constellation-to-Launch-Crane-Clean-EnergyCenter-Restoring-Jobs-and-Carbon-Free-Power-to-The-Grid.html, checked on 3/27/2025.
Clutton-Brock, Peter; Rolnick, David; Donti, Priya L.; Kaack, Lynn (2021): Climate Change and AI. Recommendations for Government Action
CNDCP (2025a): Climate Neutral Date Centre pact. Self Regulatory Initiative. Available online at https://www.climateneutraldatacentre.net/wp-content/uploads/2023/02/221213_Self-Regulatory-Initiative.pdf, checked on 3/18/2025.
CNDCP (2025b): Signatories - Pact Associations and Pact Operators. Available online at https://www.climateneutraldatacentre.net/signatories/, checked on 3/18/2025.
Cordier, Daniel J. (2024): Rare earths 2024. Edited by U.S. Geological Survey (Mineral Commodity Summaries). Available online at https://pubs.usgs.gov/periodicals/mcs2024/mcs2024-rare-earths.pdf, checked on 4/14/2025.
Corrigan, Caitlin C.; Ikonnikova, Svetlana A. (2024): A review of the use of AI in the mining industry: Insights and ethical considerations for multi-objective optimization, The Extractive Industries and Society 17 (2024) 101440.
Dale, Bjorn-Erik; Uglane, Vidar (2018): Artificial Intelligence in the oil and gas production. Available online at https://geoexpro.com/artificial-intelligence-in-oil-gas-production/, checked on 5/02/2025.
Dauvergne, Peter (2022): Is artificial intelligence greening global supply chains? Exposing the political economy of environmental costs, Review of International Political Economy 2022, Vol. 29, No. 3, 696–718.
Davidova, Marina L. & Sharno, Oksana I. (2023): Digital Transformation as a Means of Smart Regulation of Environmental Management: Technology and Practices for Agrifood Companies. In: Trukhachev (Hrsg.), Unlocking Digital Transformation of Agricultural Enterprises, 2023.
Deloitte (2024): Powering artificial intelligence. A study of AI’s environmental footprint today and tomorrow. With assistance of Bernhard Lorentz, Johannes Trüby, Geoff Tuff. Available online at https://www.deloitte.com/content/dam/assets-shared/docs/about/2024/powering-artificial-intelligence.pdf, checked on 2/27/2025.
Deutsche Telekom (2024): Grundsätze für grüne Künstliche Intelligenz. Available online at https://www.telekom.com/de/konzern/details/grundsaetze-fuer-gruene-kuenstliche-intelligenz-1077078, checked on 4/27/2025.
Digiconomist (2025): Bitcoin Energy Consumption Index. Available online at https://digiconomist.net/bitcoinenergy-consumption, checked on 4/26/2025.
Dubois, Elena; Bowles, Christopher; Pulliam, Cody Pfund; Davis, Jim; Kelterborn, Diana; Schlenga, Robin; Buhl, Nicholaj (2024): Whitepaper on the Sustainability of AI. Ramboll. Available online at https://brandcentral.ramboll.com/share/Pa6FUUKjV1v836uY5TpY/assets/65104, checked on 4/27/2025.
EIA (2024a): Data center owners turn to nuclear as potential electricity source. U.S. Energy Information Administration. Available online at https://www.eia.gov/todayinenergy/detail.php?id=63304, updated on 10/1/2024, checked on 2/6/2025.
EIA (2024b): Virginia was the top net electricity recipient of any state in 2023. U.S. Energy Information Administration. Washington, DC. Available online at https://www.eia.gov/todayinenergy/detail.php?id=64104, updated on 12/20/2024, checked on 3/28/2025
Electricity Maps (2025): Live 24/7 CO₂ emissions of electricity consumption. Available online at https://app.electricitymaps.com/map/72h/hourly, updated on 4/24/2025, checked on 4/24/2025.
European Commission (2023): Study on the critical raw materials for the EU 2023 – Final report. With assistance of M. Grohol, C. Veeh: Publications Office of the European Union.
European Commission (2024): Raw Materials Information System - E-waste. The Global E-Waste Monitor 2024. Available online at https://rmis.jrc.ec.europa.eu/ewaste, updated on 4/14/2025, checked on 4/14/2025.
European Parliament (2023): Directive (EU) 2023/1791 of the European Parliament and of the Council of 13 September 2023 on energy efficiency and amending Regulation (EU) 2023/955 (recast). Energy Efficiency Directive. Available online at http://data.europa.eu/eli/dir/2023/1791/oj.
Finger, Robert (2023): Digital innovations for sustainable and resilient agricultural systems, European Review of Agricultural Economics 50(4), 2023, 1277–1309, 1293. Available online at https://doi.org/10.1093/erae/jbad021.
Floridi, Luciano; Cowls, Josh; Beltrametti, Monica; Chatila, Raja; Chazerand, Patrice; Dignum, Virginia et al. (2018): AI4People An Ethical Framework for a Good AI Society: Opportunities, Risks, Principles, and Recommendations. Minds and Machines (2018) 28:689–707. Available online at https://doi.org/10.1007/s11023-018-9482-5, checked on 4/27/2025.
Friedline, Chad A. (2024): Tantalum 2024. Edited by U.S. Geological Survey (Mineral Commodity Summaries). Available online at https://pubs.usgs.gov/periodicals/mcs2024/mcs2024-tantalum.pdf, checked on 4/14/2025.
Gailhofer, Peter; Führ, Martin; Gröger, Jens (2023): Policy Brief: The European Parliament’s amendments to the AI Act. A plausible approach for the “Ecological Alignment” of AI? Available online at https://www.oeko.de/publikation/policy-brief-the-european-parliaments-amendments-to-the-ai-act/, checked on 02/01/2025.
Gailhofer, Peter; Hermann, Andreas; Führ, Martin; Grünberger, Tom; Franke, Johannes (with contributions from Stahl, Th. Fr.; Nolle, Lars; Zielinski, Oliver) forthcoming 2025, Umweltrechtliches Regulierungskonzept algorithmenbasierter Entscheidungssysteme, Scientific Report for the Environmental Protection Agency.
Galaz, V.; Centeno; M.A.; Callahan, P.W.; Causevic, A.; Patterson, T.; Brass, I.; Baum, S.; Farber, D.; Fischer, J.; Garcia, D.; McPhearson, T.; Jimenez, D.; King, B.; Larcey, P.; Levy, K. (2021): Artificial intelligence, systemic risks, and sustainability, Technology in Society, Vol. 67, 2021. Available online at https://doi.org/10.1016/j.techsoc.2021.101741.
GlobeNewswire (2025): Data Center Colocation Market Outlook to 2029: Revenue is Projected to Grow at a CAGR of 10.96% During 2024-2029, Amid Increasing Demand from AI and Machine Learning - A $80.37 Billion Market by 2029. Available online at https://www.globenewswire.com/news-release/2025/01/27/3015372/28124/en/Data-Center-Colocation-Market-Outlook-to-2029-Revenue-is-Projected-to-Grow-at-a-CAGR-of-10-96-During-2024-2029-Amid-Increasing-Demand-from-AI-and-MachineLearning-A-80-37-Billion-M.html, checked on 4/24/2025.
Google (2024b): New nuclear clean energy agreement with Kairos Power. Company communication from 14/10/2024, Michael Terrell. Available online at https://blog.google/outreach-initiatives/sustainability/google-kairos-power-nuclear-energy-agreement/, checked on 3/27/2025.
Google (2024a): Google Environmental Report 2024. Available online at https://www.gstatic.com/gumdrop/sustainability/google-2024-environmental-report.pdf, checked on 3/18/2025.
Google Cloud (2025): Produkte und Dienste mit KI und Machine Learning. Available online at https://cloud.google.com/products/ai, updated on 4/24/2025, checked on 4/24/2025.
Gröger, Jens; Behrens, Felix (2023): Development of an energy efficiency label for data centres. Contribution to the discussion for more transparency in the digital economy. Edited by Oeko-Institut e.V. Berlin. Available online at https://www.oeko.de//fileadmin/oekodoc/Oeko-Institut_energy-efficiency-label-for-data-centres.pdf, checked on 4/24/2025.
Gröger, Jens; Liu, Ran (2021): Green Cloud Computing. Lebenszyklusbasierte Datenerhebung zu Umweltwirkungen des Cloud Computing. With assistance of Lutz Stobbe, Jan Druschke, Nikolai Richter. Edited by Umweltbundesamt. Dessau-Roßlau. Available online at https://www.umweltbundesamt.de/sites/default/files/medien/5750/publikationen/2021-06-17_texte_94-2021_green-cloud-computing.pdf.
Gydesen, Annette; Hermann, Mathias (2024): Ecodesign requirements for circularity of servers and data storage products. TemaNord 2024:518. Edited by Nordic Council of Ministers. Viegand Maagøe A/S. Available online at http://dx.doi.org/10.6027/temanord2024-518, checked on 3/17/2025.
Hatfield, Ashley K. (2024): Strontium 2024. Edited by U.S. Geological Survey (Mineral Commodity Summaries). Available online at https://pubs.usgs.gov/periodicals/mcs2024/mcs2024-strontium.pdf, checked on 4/14/2025.
Hintemann, Ralph; Hinterholzer, Simon (2022): Steigender Energie- und Ressourcenbedarf der Rechenzentrumsbranche. Rechenzentren rücken in den Fokus von Politik und Regulierung. Borderstep Institut. Available online at https://www.borderstep.de/wp-content/uploads/2023/08/Borderstep_Rechenzentren2022_final.pdf, checked on 2/6/2025.
Hoffmann-Riem, Wolfgang (2022): Recht im Sog der digitalen Transformation. Mohr Siebeck.
IEA (2024a): Electricity 2024. Analysis and forecast to 2026. International Energy Agency. Available online at https://iea.blob.core.windows.net/assets/6b2fd954-2017-408e-bf08-952fdd62118a/Electricity2024-Analysisandforecastto2026.pdf, checked on 2/27/2015
IEA (2024b): Emissions Factors 2024 - Data product - IEA. Available online at https://www.iea.org/data-andstatistics/data-product/emissions-factors-2024, updated on 4/24/2025, checked on 4/24/2025.
IEA (2025): Energy and AI. World Energy Outlook Special report. Paris. Available online at https://iea.blob.core.windows.net/assets/86ed1178-4d77-45ac-ab38-28e849f3b93f/EnergyandAI.pdf, checked on 4/14/2025.
IPCC (2014): Climate Change 2014 Mitigation of Climate Change. Working Group III Contribution to the Fifth Assessment Report of the Intergovernmental Panel on Climate Change. With assistance of Edenhofer, O., R. Pichs-Madruga, Y. Sokona, E. Farahani, S. Kadner, K. Seyboth, A. Adler, I. Baum, S. Brunner, P. Eickemeier, B. Kriemann, J. Savolainen, S. Schlömer, C. von Stechow, T. Zwickel and J.C. Minx (eds.). Cambridge University Press, Cambridge, United Kingdom and New York, NY, USA. Available online at https://www.ipcc.ch/site/assets/uploads/2018/02/ipcc_wg3_ar5_full.pdf, checked on 3/28/2025.
Ireland’s Commission for Regulation of Utilities (2025): Data Centre grid connection | CRU.ie. Available online at https://www.cru.ie/publications/27081/, updated on 2/28/2025, checked on 2/28/2025.
Isaac, Mike; Griffith, Erin (2024): OpenAI Is Growing Fast and Burning Through Piles of Money. In The New York Times, 9/27/2024. Available online at https://www.nytimes.com/2024/09/27/technology/openaichatgpt-investors-funding.html, checked on 4/15/2025.
Jin, Yi; Behrens, Paul; Tukker, Arnold; Scherer, Laura (2019): Water use of electricity technologies: A global meta-analysis. In Renewable and Sustainable Energy Reviews (115). DOI: 10.1016/j.rser.2019.109391.
Kamiya, G.; Bertoldi, P. (2024): Energy Consumption in Data Centres and Broadband Communication Networks in the EU. In 1831-9424. DOI: 10.2760/706491.
Kuehr, Ruediger; Hirsch, David; Collins, Terry (2024): Global e- Waste Monitor 2024: Electronic Waste Rising Five Times Faster than Documented E-waste Recycling. Edited by United Nations Institute for Training and Research (UNITAR). Geneva / Bonn. Available online at https://unitar.org/about/news-stories/press/globale-waste-monitor-2024-electronic-waste-rising-five-times-faster-documented-e-waste-recycling, checked on 10/8/2024.
Lauf, Thomas; Memmler, Michael; Schneider, Sven (2024): Emissionsbilanz erneuerbarer Energieträger. Bestimmung der vermiedenen Emissionen im Jahr 2023. Umweltbundesamt. Dessau-Roßlau. Available online at https://www.umweltbundesamt.de/sites/default/files/medien/11850/publikationen/03_2025_cc_emissionsbilanz_erneuerbarer_energien_2023.pdf, checked on 3/28/2025.
LBNL (2024): 2024 United States Data Center Energy Usage Report. LBNL-2001637. With assistance of Arman Shehabi, Sarah J. Smith, Alex Hubbard, Alex Newkirk, Nuoa Lei, Md Abu Bakar Siddik et al. Lawrence Berkeley National Laboratory. Berkeley, California. Available online at https://escholarship.org/uc/item/32d6m0d1.
Leddy, Todd; Kumar, Manish; Clinger, John; Jathar, Abhishek; Petithuguenin, Laurent; Passia, Eirini (2024): Study for the review of Commission Regulation 2019/424 (Ecodesign of servers and data storage products). Phase 2 - Update of the Preparatory Study. Available online at https://eco-servers-review.eu/wp-content/uploads/2024/12/Phase-2-Study-Update-Servers-Review-Study-FINAL.pdf, checked on 3/10/2025.
Lee, Ricki (2025): Google Announces $75 billion AI Investment. In TechInformed - A leading media and marketing solutions platform for IT Decision Makers, 2/6/2025. Available online at https://techinformed.com/google-75b-ai-investment-2025/, checked on 4/24/2025.
Liebreich, Michael (2024): Generative AI – The Power and the Glory. BloombergNEF. Available online at https://about.bnef.com/blog/liebreich-generative-ai-the-power-and-the-glory/, updated on 12/24/2024, checked on 3/28/2025.
Luccioni, Alexandra Sasha; Strubell, Emma; Crawford, Kate (2025): From Efficiency Gains to Rebound Effects: The Problem of Jevons' Paradox in AI's Polarized Environmental Debate. Available online at https://arxiv.org/abs/2501.16548, checked on 4/22/2025.
McArdle, Jill; Terras, Pierre (2025): System Overload: How new data centres could throw Europe’s energy transition off course. With assistance of Kathrin Gutmann, Cyrille Cormier, Stand.earth. Beyond Fossil Fuels. Available online at https://beyondfossilfuels.org/wp-content/uploads/2025/02/SystemOverload_Report_BeyondFossilFuels.pdf, checked on 3/27/2025.
McKinsey (2024): AI power: Expanding data center capacity to meet growing demand. With assistance of Bhargs Srivathsan, Marc Sorel, Pankaj Sachdeva. Available online at https://www.mckinsey.com/industries/technology-media-and-telecommunications/our-insights/ai-power-expanding-data-center-capacity-tomeet-growing-demand#/, checked on 5/27/2025.
Meta (2024a): 2024 Sustainability Report. Available online at https://sustainability.atmeta.com/wp-content/uploads/2024/08/Meta-2024-Sustainability-Report.pdf, checked on 3/27/2025.
Meta (2024b): Accelerating the Next Wave of Nuclear to Power AI Innovation. Company communication from 03/12/2024. Available online at https://sustainability.atmeta.com/blog/2024/12/03/accelerating-the-nextwave-of-nuclear-to-power-ai-innovation/, checked on 3/27/2025.
Microsoft (2024): 2024 Environmental Sustainability Report. Reporting on our 2023 fiscal year. Available online at https://cdn-dynmedia-1.microsoft.com/is/content/microsoftcorp/microsoft/msc/documents/presentations/CSR/Microsoft-2024-Environmental-Sustainability-Report.pdf, checked on 3/27/2025.
Millard Ball, Adam (2019): The autonomous vehicle parking problem, Transport Policy Volume 75, March 2019, 99-108
Ministère de la Transition Ecologique (12/23/2021): Décret no 2021-1732 du 21 décembre 2021 relatif aux modalités d’information sur la quantité de données consommées dans le cadre de la fourniture d’accès au réseau et son équivalent en émissions de gaz à effet de serre. Available online at https://www.legifrance.gouv.fr/download/pdf?id=VBtAnRupAc6giNMgW4Ul3V3o5lLmdRUUpFMr6ZWnSW4=, checked on 4/24/2025.
Murphy, Andrea; Schifrin, Matt (2024): Forbes 2024 Global 2000 List - The World’s Largest Companies Ranked. Edited by Forbes. Available online at https://www.forbes.com/lists/global2000/, updated on 4/24/2025, checked on 4/24/2025.
Novet, Jordan (2024): Microsoft CFO says OpenAI investment will cut into profit this quarter. In CNBC, 10/31/2024. Available online at https://www.cnbc.com/2024/10/30/microsoft-cfo-says-openai-investmentwill-cut-into-profit-this-quarter.html, checked on 4/24/2025.
O'Brien, Isabel (2024): Data center emissions likely 662% higher than big tech claims. Can it keep up the ruse? In The Guardian, 9/15/2024. Available online at https://www.theguardian.com/technology/2024/sep/15/data-center-gas-emissions-tech, checked on 2/6/2025.
Open Compute Project (2025): About Open Compute Project. Available online at https://www.opencompute.org/about, checked on 3/19/2025.
Open Source Business Alliance - Bundesverband für digitale Souveränität e.V. (2025): Sovereign Cloud Stack. Available online at https://scs.community/de/, updated on 4/15/2025, checked on 4/24/2025.
Owen Gaffney, Amy Luers, Franklin Carrero-Martinez, Berna Oztekin-Gunaydin, Felix Creutzig, Virginia Dignum, Victor Galaz, Naoko Ishii, Francesca Larosa, Maria Leptin, Ken Takahashi Guevara (2025): The Earth alignment principle for artificial intelligence, Nature Sustain 2025, Available online at https://doi.org/10.1038/s41893-025-01536-6
Reuters (2025): Alibaba to invest more than $52 billion in AI over next 3 years. In Reuters Media, 2/24/2025. Available online at https://www.reuters.com/technology/artificial-intelligence/alibaba-invest-more-than-52billion-ai-over-next-3-years-2025-02-24/, checked on 4/24/2025.
Rohde, Friederike; Wagner, Josephin; Reinhard, Philipp; Petschow, Ulrich; Meyer, Andreas; Voß, Marcus; Mollen, Anne (2021): Nachhaltigkeitskriterien für künstliche Intelligenz. Entwicklung eines Kriterien- und Indikatorensets für die Nachhaltigkeitsbewertung von KI-Systemen entlang des Lebenszyklus. Institut für ökologische Wirtschaftsforschung GmbH, gemeinnützig. Berlin. Available online at https://www.ioew.de/fileadmin/user_upload/BILDER_und_Downloaddateien/Publikationen/2021/IOEW_SR_220_Nachhaltigkeitskriterien_fuer_Kuenstliche_Intelligenz.pdf, checked on 4/27/2025.
Schneider, Mycle; Froggat, Antony; et al. (2024): The World Nuclear Industry Status Report 2024. Paris. Available online at https://www.worldnuclearreport.org/IMG/pdf/wnisr2024-v2.pdf, checked on 3/28/2025.
Singh, Jaspreet (2025): Meta to spend up to $65 billion this year to power AI goals, Zuckerberg says. In Reuters Media, 1/24/2025. Available online at https://www.reuters.com/technology/meta-invest-up-65-bln-capital-expenditure-this-year-2025-01-24/, checked on 4/24/2025.
Smith, Brad (2025): The Golden Opportunity for American AI. In Microsoft, 1/3/2025. Available online at https://blogs.microsoft.com/on-the-issues/2025/01/03/the-golden-opportunity-for-american-ai/, checked on 4/24/2025.
Statista (2025): Top semiconductor foundries market share 2024 | Statista. Available online at https://www.statista.com/statistics/867223/worldwide-semiconductor-foundries-by-market-share/, updated on 2/14/2025, checked on 2/14/2025.
Steffen, Tilman (2023): Verbotszone in Fukushima wiedereröffnet. Zeit Online. Available online at https://www.zeit.de/gesellschaft/2023-04/japan-fukushima-tomioka-verbotszone-wiedereroeffnung, updated on 4/1/2023, checked on 3/27/2025.
Stray, Jonathan (2020): Aligning AI Optimization to Community Well-Being, International Journal of Community Well-Being Volume 3, pages 443–463
Synergy (2024a): Synergy Identifies the World’s Top 20 Locations for Hyperscale Data Centers. Available online at https://www.srgresearch.com/articles/synergy-identifies-the-worlds-top-20-locations-forhyperscale-data-centers, updated on 8/15/2024, checked on 3/28/2025.
Synergy (2024b): Hyperscale Data Centers Hit the Thousand Mark; Total Capacity is Doubling Every Four Years. Available online at https://www.srgresearch.com/articles/hyperscale-data-centers-hit-the-thousandmark-total-capacity-is-doubling-every-four-years, updated on 4/17/2024, checked on 3/28/2025.
Taiwan Semiconductor Manufacturing Company (2025): TSMC Intends to Expand Its Investment in the United States to US$165 Billion to Power the Future of AI. In Taiwan Semiconductor Manufacturing Company, 4/03/2025. Available online at https://pr.tsmc.com/english/news/3210, checked on 4/24/2025.
Trueman, Charlotte (2025): Nvidia invested $1bn in AI companies in 2024. Participated in more investment rounds than Amazon and Microsoft. Edited by Data Center Dynamics. Available online at https://www.datacenterdynamics.com/en/news/nvidia-invested-1bn-in-ai-companies-in-2024/, updated on 4/24/2025, checked on 4/24/2025.
TSMC (2024): Sustainability Report 2023. Available online at https://esg.tsmc.com/en-US/file/public/eall_2023.pdf, checked on 4/14/2025.
Uptime Institute (2024): Uptime Institute Global Data Center Survey 2024. With assistance of Douglas Donnellan, Andy Lawrence, Daniel Bizo, Peter Judge, John O’Brien, Jacqueline Davis et al. Available online at https://datacenter.uptimeinstitute.com/rs/711-RIA-145/images/2024.GlobalDataCenterSurvey.Report.pdf, checked on 3/29/2025.
Uptime Institute (2025): Five data center predictions for 2025. New York. Available online at https://uptimeinstitute.com/resources/research-and-reports/five-data-center-predictions-for-2025, checked on 3/28/2025.
Vries, Alex de (2025): Chipping point. Tracking electricity consumption and emissions from AI chip manufacturing. Edited by Greenpeace East Asia.
Wang, Peng; Zhang, Ling-Yu; Tzachor, Asaf; Chen, Wei-Qiang (2024): E-waste challenges of generative artificial intelligence. In Nat Comput Sci 4 (11), pp. 818–823. DOI: 10.1038/s43588-024-00712-6.
Whitehead, Beth; Andrews, Deborah; Shah, Amip (2015): The life cycle assessment of a UK data centre. In Int J Life Cycle Assess 20 (3), pp. 332–349. DOI: 10.1007/s11367-014-0838-7.
Wikipedia (2025): Three Mile Island accident. From Wikipedia, the free encyclopedia. Available online at https://en.wikipedia.org/wiki/Three_Mile_Island_accident, checked on 3/27/2025.
World Resources Institute (2004): The greenhouse gas protocol. A corporate accounting and reporting standard. World Business Council for Sustainable Development. revised ed.
Xu, Jun (2024): AI in ESG for Financial Institutions: An Industrial Survey (2024). Available online at https://arxiv.org/abs/2403.05541