Green Center Two-Month Urine Diversion Project Final Report
March 13, 2024
Introducton
Surface water bodies and groundwater aquifers across Cape Cod have become increasingly polluted with nutrients due to the combinaton of overdevelopment and inadequate wastewater management practces. When added to freshwater and marine surface waterbodies via groundwater fow, excess nutrients (nitrogen and phosphorus) degrade water quality, damage natural habitat, fuel harmful algal blooms, and threaten public health. Interestngly, human urine has been identfed as the leading source of these excess nutrients in wastewater. This realizaton has stmulated growing interest in an innovatve nutrient management strategy called urine diversion or UD UD is a practce where urine is separated from the conventonal waste stream using specialized toilet and urinal fxtures to prevent water polluton at the source, reduce water usage, and capture nutrients that are valuable as fertlizer for farms and gardens. The Rich Earth Insttute1, a non-proft organizaton based in Bratleboro, Vermont, has been successful in developing a community wide UD program where urine is collected, processed and distributed to local farmers to ofset or replace their need for conventonal fertlizers. Many Cape Cod residents see UD as an opportunity to reduce polluton at lower cost than conventonal approaches and with the added benefts of nutrient recycling and overall improved ecological sustainability.
Project Overview
The non-proft Green Center of Falmouth, MA2 is a long-tme proponent of sustainable living practces including, most recently, a concerted efort to promote and implement urine diversion Beginning in August of 2023 the Green Center initated this project to assess how much urine volume could be collected and what amount of nutrients could be diverted from residental wastewater fows using UD. With this informaton, potental watershed-scale nutrient polluton reducton benefts of UD could be beter understood.
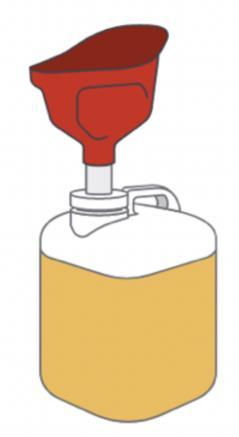
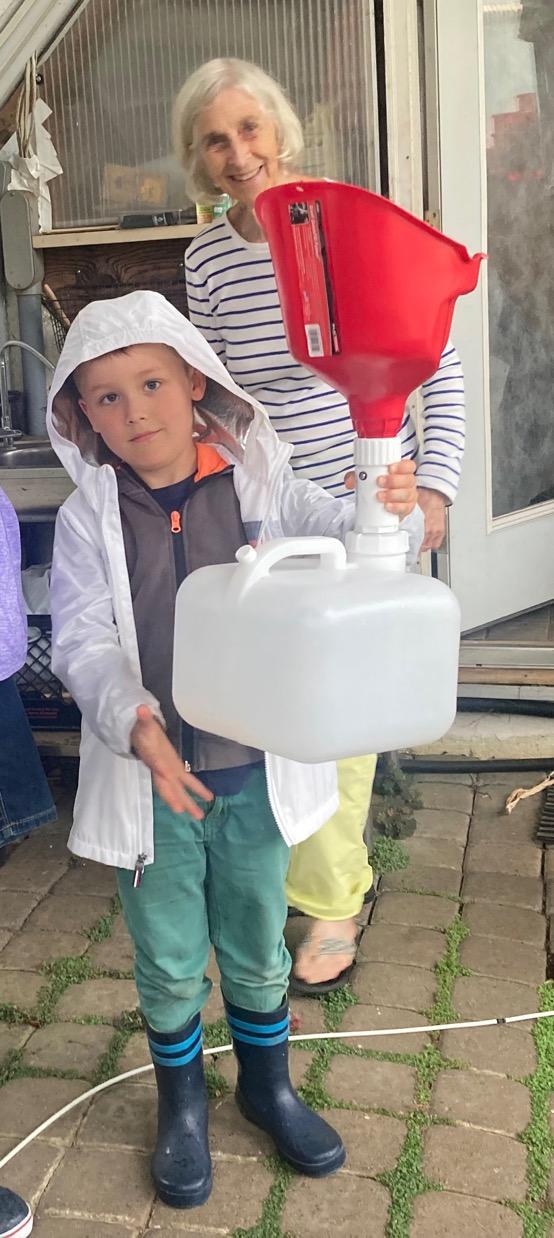
To collect the necessary data, the Green Center identfed a group of project partcipants and distributed portable collecton containers called “cubies,” (pictured) which were developed by the Rich Earth Insttute. These simple UD devices consist of a cube shaped plastc container, usually of 2.5 or 5-gallon capacity, and fted with a funnel for urine collecton. The opening inside the funnel is valved by a plastc ball that serves to allow urine in but keep odors from leaving the container.
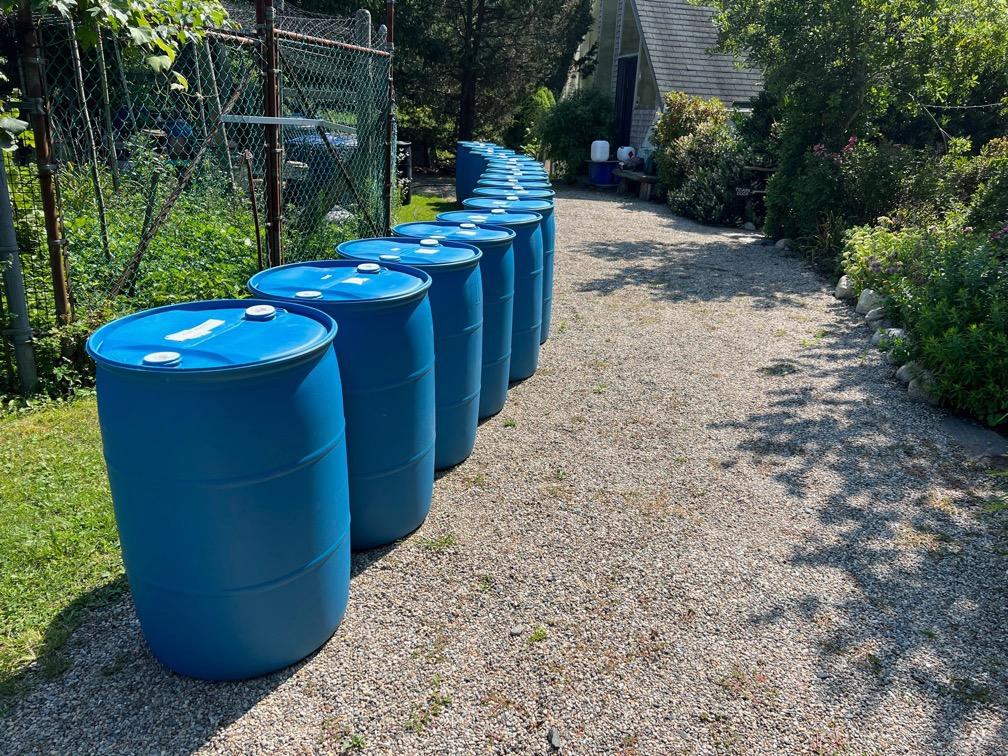
With approval from the Falmouth Board of Health the Green Center also distributed plastc 55-gallon drums where partcipants transferred their collected urine from the cubies for
1 htps://richearthinsttute.org/ 2 htps://newalchemists.net/
4 Kitridge Road, Buzzards Bay, Massachusets 02542 1 | Page
longer term storage. Storage drums were typically located outside adjacent to households or inside garages.
Partcipants were instructed to divert as much of their urine into these systems as possible for a 2 -month period. Following recommendatons from the Rich Earth Insttute they were also advised to add a cup of white vinegar to their cubies before usage and afer each emptying to acidify the urine, which helps to stabilize the nitrogen and prevent odors from ammonia of-gassing. Cubie funnels could also be cleaned by spritzing with a white vinegar flled spray botle afer each usage.
The Green Center contracted with the Massachusets Alternatve Septc System Technology Center (MASSTC) to conduct volume measurements and sampling and to collect and manage all diverted urine at the completon of the project.
Discussion and Results
At the 41 partcipatng households an average of 1.5 people diverted their urine (62 people total) about 80% of the tme they were at home. Partcipants collected their urine in cubies and transferred to their storage drums repeatedly as needed during the study period. A few partcipants required additonal storage barrels to contain their full volume during the test period. All partcipants successfully collected urine throughout the study period and many plan to contnue indefnitely.
MASSTC Environmental Project Assistant, Bryan Horsley, completed all volume measurements and sample collectons per the following process. All applicable MASSTC Standard Operatng Procedures were adhered to throughout the efort.
1. Measure Volume: The volume of each storage barrel was documented by measuring the depth of urine in inches and then convertng to gallons using a conversion guide made by the Green Center. All storage barrels used in this project were of the same geometry allowing this simple depth to volume conversion except for one site where collected urine was stored in smaller containers with clearly marked volume graduatons.
2. Mix: Before collectng samples, each storage barrel was thoroughly mixed using a combinaton of tpping the barrel back and forth and circulatng urine inside the barrel using a small electric pump. This procedure seemed efectve at producing a well-mixed sample as indicated by consistent color and cloudiness passing through the clear pump tubing while circulatng and sampling.
3. Sample: Once the barrel was well mixed samples were collected into prelabeled sample botles using a small electric pump. Each sampling event required three botles as follows: Nitrate and Nitrite in a plastc 250mL botle with no preservatve, Total Kjeldahl Nitrogen in a 250mL plastc botle with sulfuric acid, and Total Phosphorus in a 250mL plastc botle with sulfuric acid. Once collected, the botles were capped and placed in a cooler with ice and delivered to the Barnstable County Water Quality Lab for analysis. Chains of custody were completed to document proper sample handling, storage and hold tmes.
Kitridge Road, Buzzards Bay, Massachusets 02542 2 | Page
4
4. Measure Field Parameters: At the same tme as sampling , feld parameters were measured using a YSI ProDSS handheld instrument which analyzed in-situ for temperature, pH, conductvity, and dissolved oxygen.
Volume measurement and sampling of storage tanks was completed between October 5, 2023, and February 5, 2024 as close as possible to exactly 2-months (62-days) afer the start of collecton Partcipants began collectng at diferent dates which allowed sampling to spread over multple months. Volume measurements for those sites that were collected before or afer the 2-month mark were adjusted by calculatng daily average collecton volume (days since start divided by total volume measured) and multplying by 62 days to estmate the urine volume collected at the 62-day project end date as accurately as possible
The total volume of urine collected at the 2-month mark across all partcipants was calculated at 1,003 gallons (avg. per house: 29-gals, max: 71-gals, min: 9-gals). See Graph 1. below for volumes collected at each of the 41 households.
Concentratons of total nitrogen (TN) and total phosphorus (TP) were analyzed from samples collected. TN was found by adding results of Nitrate, Nitrite and Total Kjeldahl Nitrogen analyses The average concentraton of TN across all households was 7,267 mg/L and TP was 469 mg/L confrming that urine is a highly concentrated nutrient source. For comparison, average nitrogen concentraton in residental wastewater is typically in the range of 40 to 100 mg/L.
The total nutrient load (concentraton x volume) collected across all sites at the 2-month date was 30.2 kg TN and 2.0 kg TP. The average nutrient load diverted per household at the 2-month date was 0.74 kg TN and 0.05 kg TP Graphs 2 and 3 below ofer visual depicton of these nutrient analyses at the 2-month date
Per conversatons during sampling visits and review of pH data, partcipants seemed to vary in their completon of vinegar additon recommendatons with some adding a cup to the cubie before adding urine, some just spritzing the funnel afer usage, and others using no vinegar at all. This variable likely had a minor efect on volume and nutrient concentraton results due to diluton but not on the total nutrient load collected considering that all stored urine was sealed in air-tght containers and thus potental ammonia of gassing and associated nitrogen loss was minimized. pH feld measurement results were likely afected by variable vinegar (acetc acid) additon Fresh urine is typically close to neutral acidity (pH 7) but over tme in storage it naturally increases in pH as urea is converted to ammonia and reaches basic conditons in excess of pH 9. The additon of vinegar acidifes the urine, which prevents the urea to ammonia conversion and results in pH values below 7. Stored urine from this study ranged in pH from minimum 4.4 (assume vinegar additon) to maximum 9.8 (assume no vinegar additon) with an average of 8.3.
See Table 2. below for complete project data.
Of the 41 partcipatng locatons 26 requested to have their stored urine and storage barrels removed at the end of the study. MASSTC worked with the for-proft company Wasted3 to pick up and transport all collected urine
3 htps://wasted.earth/
4 Kitridge Road, Buzzards Bay, Massachusets 02542 3 | Page
to MASSTC at the end of January 2024. As most partcipants contnued to collect urine beyond the 2-month project end date there was considerably more urine stored at each locaton at the pump out dates
Approximately 1,000 gallons of urine was delivered to MASSTC, where it is currently stored for future usage in research and testng applicatons. The remaining 15 partcipants opted to keep their urine and storage tanks for contnued collecton and usage on their propertes. Many partcipants have indicated that they intend to contnue divertng their urine with this method as a means of source polluton control within their respectve watersheds. Many more partcipants indicated they would contnue the practce of UD if there were a service available to complete tank pump outs and system maintenance on a regular basis
Conclusions
To assess the potental nutrient management benefts of UD at watershed scale implementaton we can compare our fndings with the proposed sewer expansion project described in the Great Pond Targeted Watershed Management Plan (TWMP) for the nitrogen impaired Great Pond watershed in Falmouth, MA In secton 4.2.2 Project Phasing of the Great Pond TWMP Final Report it is stated that Phase 1 will entail the extension of sewer connectons to approximately 811 dwelling units in the Teatcket Acapesket Sewer Service Area 4 Table ES.2 Nitrogen Budget for Great Pond to Achieve Nitrogen TMDL Compliance in the Great Pond TWMP Executve Summary indicates that sewer connectons to these 811 units in Subarea 1 would remove an estmated 2,890 kg /year of TN.5 In comparison with the rate of nitrogen load removal we documented during this UD study, implementng UD at 811 parcels would result in diversion of 3,578 kg/year, roughly 30% more than the projected nitrogen removal by the planned sewer expansion. See Table 1 below outlining how this number was calculated.
months 0.74 kg
Potential TN load/ home/year 4.41 kg
Potential TN load/811 homes/year 3,578.36 kg
It ’s important to note that greater nutrient removal performance from UD as compared with sewering is impossible given that sewering would efectvely remove all residental wastewater from the watershed including 100% of the urine plus additonal black and grey water, which UD would not remove. The higher UD performance results identfed in this study can be explained by the fact that the projected sewering nutrient removal performance is based on models that ofen signifcantly underestmate the nutrient concentraton in residental wastewater This means that the actual nutrient removal performance of sewering these 811 parcels would be higher than the TWMP projected amount noted above.
In contrast with the modeled performance projectons of the sewering project, the urine diversion nutrient concentratons measured in this study are real values which is why UD appears to perform beter than the
4 htps://www.falmouthma.gov/DocumentCenter/View/13256/Great-Pond-TWMP-Final-Report Secton-4
5 htps://www.falmouthma.gov/DocumentCenter/View/13248/Great-Pond-TWMP-Final-Report Executve-Summary
4 Kitridge Road, Buzzards Bay, Massachusets
4 | Page
02542
TN load diverted/41 homes/2 months 30.15 kg TN load diverted/home/2
Table 1. Data of Nitrogen Removal
proposed sewering project we are comparing with It is also important to note that the results of this study were based on approximately 80% UD partcipaton and thus if all conventonal toilet fxtures were replaced with UD fxtures, 100% partcipaton could be achieved, which would result in greater nutrient removal performance with UD. Despite these inconsistencies the fndings in this report show that UD can produce very high-performance nutrient removal likely at lower cost, lower energy usage and lower greenhouse gas emissions and with the added benefts of water conservaton and reclamaton of nutrients as benefcial fertlizer products. These results and added benefts indicate that UD is a valuable tool for municipalites to utlize in their watershed management planning process and deserves further consideraton for widespread implementaton. Despite these very promising performance results there remain challenges to overcome before UD can be deployed beyond pilot scale, most notably including regulatory approvals and development of infrastructure for collecton, transport, processing, and distributon While these are not insignifcant challenges there is a growing base of support and example implementaton projects across the U.S. and internatonally indicatng that they can be overcome. In Massachusets, state regulators are actvely assessing UD’s potental as a nutrient management approach and identfying pathways for approval. Research is underway to further assess efcacy and safety, multple processing facilites are in development, and there is interest among the business community to mobilize and provide the needed infrastructure and workforce components.
The fndings of this project indicate that UD has great potental to serve as an efcient and sustainable nutrient management approach for watersheds impacted by nutrient polluton and should be considered an important tool to meet nutrient management goals.
5 | Page
4 Kitridge Road, Buzzards Bay, Massachusets 02542
0 10 20 30 40 50 60 70 80 1 2 3 4 5 6 7 8 9 10 11 12 13 14 15 16 17 18 19 20 21 22 23 24 25 26 27 28 29 30 31 32 33 34 35 36 37 38 39 40 41 Volume (gallons) Participating Households
Graph 1. Urine Collected in 2
Months
4 Kitridge Road, Buzzards Bay, Massachusets 02542 6 | Page 0.00 0.20 0.40 0.60 0.80 1.00 1.20 1.40 1.60 1.80 1 2 3 4 5 6 7 8 9 10 11 12 13 14 15 16 17 18 19 20 21 22 23 24 25 26 27 28 29 30 31 32 33 34 35 36 37 38 39 40 41 TN (kilograms) Participating Households
0.00 0.02 0.04 0.06 0.08 0.10 0.12 1 2 3 4 5 6 7 8 9 10 11 12 13 14 15 16 17 18 19 20 21 22 23 24 25 26 27 28 29 30 31 32 33 34 35 36 37 38 39 40 41 TP (kilograms) Participating Households
Graph
2. Total Nitrogen Diverted Per Household in 2 Months
Graph
3. Total Phosphorus Diverted Per Household in 2 Months
4 Kitridge Road, Buzzards Bay, Massachusets 02542 7 | Page Site ID Collection Start Date Sample Date # Days Volume at sample date (gals) Volume/day (gals) Volume at 2 months (62 days)(gals) Volume at 2 months (L) TN (mg/L) TP (mg/L) TN/2 months (kg) TP/2 months (kg) TN/year (kg) TP/year (kg) pH 1 2-Aug 5-Oct 64 43 0.67 42 158 3608 210 0.57 0.03 3.41 0.20 9.4 2 2-Aug 5-Oct 64 25 0.39 24 92 4420 370 0.41 0.03 2.43 0.20 7.1 3 4-Aug 5-Oct 62 23 0.37 23 87 8408 760 0.73 0.07 4.39 0.40 6.6 4 9-Aug 11-Oct 63 36 0.57 35 134 4808 360 0.64 0.05 3.87 0.29 7.2 5 9-Aug 11-Oct 63 9 0.14 9 33 5380 460 0.18 0.02 1.07 0.09 9.3 6 10-Aug 11-Oct 62 15 0.24 15 55 8308 480 0.46 0.03 2.76 0.16 9.2 7 10-Aug 11-Oct 62 52 0.83 52 195 6189 450 1.21 0.09 7.24 0.53 9.4 8 10-Aug 12-Oct 63 20 0.31 19 73 8612 680 0.63 0.05 3.76 0.30 9.3 9 11-Aug 12-Oct 62 37 0.60 37 142 5516 370 0.78 0.05 4.69 0.31 8.9 10 12-Aug 12-Oct 61 14 0.23 14 55 5319 230 0.29 0.01 1.74 0.08 9.3 11 13-Aug 12-Oct 60 38 0.63 39 149 6812 400 1.01 0.06 6.07 0.36 9.4 12 13-Aug 18-Oct 66 11 0.17 10 39 15069 580 0.59 0.02 3.54 0.14 9.6 13 14-Aug 18-Oct 65 38 0.58 36 137 8208 570 1.13 0.08 6.76 0.47 9.4 14 14-Aug 18-Oct 65 22 0.34 21 79 8715 570 0.69 0.05 4.15 0.27 4.6 15 14-Aug 18-Oct 65 19 0.29 18 69 15053 830 1.04 0.06 6.23 0.34 5.9 16 15-Aug 19-Oct 65 47 0.72 44 168 9681 610 1.63 0.10 9.75 0.61 9.5 17 20-Aug 19-Oct 60 18 0.30 18 69 7661 460 0.53 0.03 3.19 0.19 9.0 18 20-Aug 19-Oct 60 20 0.33 20 76 10085 630 0.77 0.05 4.62 0.29 9.5 19 20-Aug 19-Oct 60 20 0.34 21 80 8808 630 0.70 0.05 4.22 0.30 9.2 20 21-Aug 26-Oct 66 44 0.67 42 158 5006 410 0.79 0.06 4.74 0.39 5.2 21 21-Aug 26-Oct 66 60 0.91 56 213 4611 460 0.98 0.10 5.90 0.59 5.6 22 21-Aug 26-Oct 66 75 1.14 71 268 4206 280 1.13 0.08 6.77 0.45 4.4 23 21-Aug 26-Oct 66 28 0.43 27 101 5412 410 0.55 0.04 3.28 0.25 9.5 24 21-Aug 26-Oct 66 9 0.14 9 33 11151 580 0.37 0.02 2.22 0.12 9.3 25 23-Aug 26-Oct 64 23 0.36 22 85 5600 350 0.47 0.03 2.84 0.18 9.3 26 24-Aug 26-Oct 63 62 0.99 61 231 5467 340 1.27 0.08 7.59 0.47 9.5 27 29-Aug 27-Oct 59 36 0.60 37 141 6711 380 0.95 0.05 5.69 0.32 9.4 28 12-Aug 31-Oct 80 39 0.49 30 115 3211 240 0.37 0.03 2.21 0.17 4.8 29 23-Aug 31-Oct 69 23 0.33 21 78 11141 700 0.87 0.05 5.23 0.33 9.3 30 23-Aug 31-Oct 69 22 0.32 20 75 8791 350 0.66 0.03 3.95 0.16 9.1 31 24-Aug 31-Oct 68 10 0.15 9 35 7446 440 0.26 0.02 1.54 0.09 9.5 32 24-Aug 31-Oct 68 28 0.41 26 97 6922 480 0.67 0.05 4.01 0.28 9.2 33 28-Aug 31-Oct 64 40 0.63 39 147 7211 500 1.06 0.07 6.35 0.44 9.4 34 28-Aug 31-Oct 64 36 0.56 35 132 8631 490 1.14 0.06 6.84 0.39 9.4 35 6-Sep 15-Nov 70 10 0.14 9 34 4518 350 0.15 0.01 0.91 0.07 5.2 36 31-Aug 15-Nov 76 58 0.76 47 179 4547 370 0.81 0.07 4.89 0.40 4.5 37 30-Aug 15-Nov 77 29 0.38 23 88 6639 480 0.59 0.04 3.52 0.25 9.7 38 6-Sep 16-Nov 71 44 0.62 38 145 5529 400 0.80 0.06 4.82 0.35 9.3 39 3-Sep 16-Nov 74 20 0.27 17 63 5523 480 0.35 0.03 2.10 0.18 7.1 40 6-Sep 5-Feb 152 60 0.33 21 79 9004 600 0.72 0.05 4.29 0.29 9.8 41 29-Aug 5-Feb 160 60 0.52 32 122 10017 500 1.22 0.06 7.33 0.37 9.6 160 75 1 71 268 15069 830 2 0 10 1 9.8 59 9 0.14 9 33 3211 210 0.15 0.01 0.91 0.07 4.4 2870 1042 1003 3798 30.15 2.0 180.9 12.0 70 31 0.47 29 110 7267 469 0.74 0.049 4.41 0.29 8.3 Max Min Sum Average
Table 2. Green Center UD Project Data

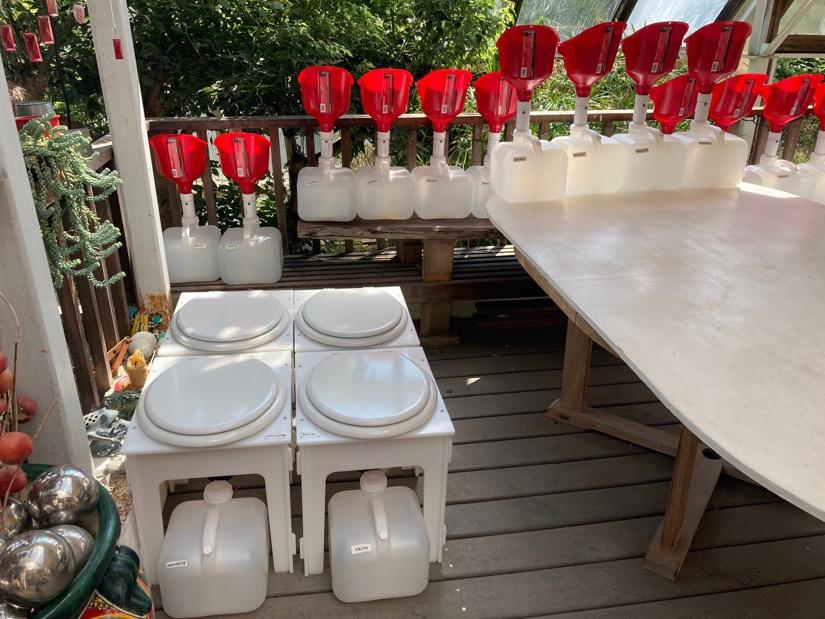
 Waterless unisex “Cubie” urinals and “Pee-Toilets”
55-gallon drums for urine storage
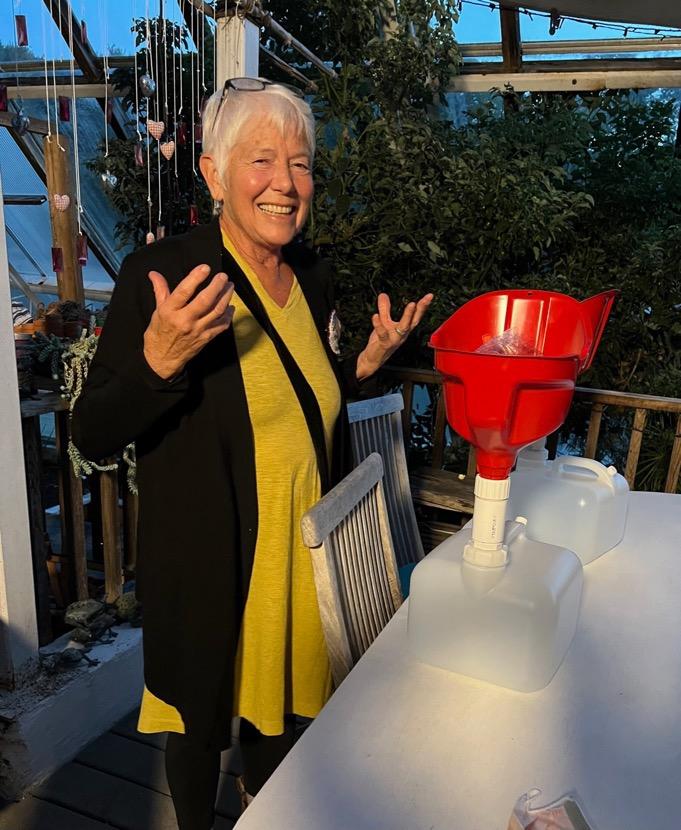
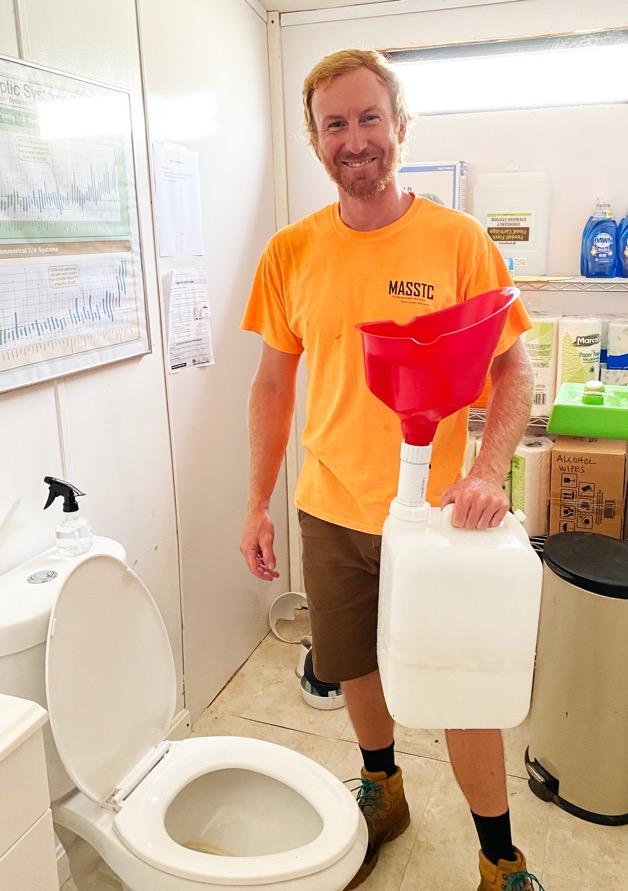
Bryan Horsley
Author of Final Report MASSTC Environmental
Waterless unisex “Cubie” urinals and “Pee-Toilets”
55-gallon drums for urine storage
Bryan Horsley
Author of Final Report MASSTC Environmental