
4 minute read
Performance on Indicators


Performance on Environmental, Employee and Society indicators
xxxx
Advertisement
369 000 CO2e Ton
CO2e emissions – Greencarrier Freight Services
Total: 369 000 tons Air: 61 000 Sea: 189 000 Road: 108 000 Rail: 11 000
In 2019 the figure was
Total: 369 000 tons Air: 76 000 Sea: 194 000 Road: 92 000 Rail: 7 000
In 2018 the figure was
Total: 350 000 tons Air: 73 000 Sea: 186 000 Road: 87 000 Rail: 4 000
In 2017 the figure was
Total: 342 000 tons Air: 57 000 Sea: 179 000 Road: 100 000 Rail: 6 000
Comment: We measure our emissions in CO2 equivalents according to Eco Transits standard. We strive to reduce the relative footprint in all we do.
69% Green Suppliers
GREEN Suppliers in Supplier Evaluation for Greencarrier Freight Services
234 of our 338 suppliers are labelled GREEN = 61% Sea: 39 of 39 = 100% Air: 28 of 28 = 100% Road: 167 of 271 = 62%
In 2019 this figure was 228 of our 373 = 61% Sea: 18 of 22 = 81% Air: 20 of 20 = 100% Road: 190 of 331 = 57%
In 2018 this figure was 79 of our 168 = 47% Sea: 14 of 24 = 58% Air: 5 of 9 = 56% Road: 60 of 135 = 44%
In 2017 this figure was 108 of our 251 = 43% Sea: 14 of 24 = 58% Air: 5 of 9 = 56% Road: 89 of 218 = 41%
Comment: The supplier evaluation is performed in Greencarrier Freight Services and includes all major suppliers. During 2017 we implemented a common evaluation system for all countries and in 2018 we simplified the process with a new digital tool. Each year we improve the content of our evaluations to stay on top of new regulations, demands and possibilities. In 2021 we will start doing on site audits of selected suppliers.
69% Offices with Green Electricity
Offices powered by green electricity
27 of 39 = 69% 2019 this figure was 24 of 39 = 64% 2018 this figure was 24 of 39 = 64% 2017 this figure was 22 of 39 = 56%
Goal: 90% by 2023.
Comment: As part of our ambitions within Green Office we encourage all our offices to switch to Green electricity sources. We can se a slight improvement from 2018 to 2020 but we did not reach our initial target of 90% by 2020. We will therfore set a new goal of 90% by 2023. .
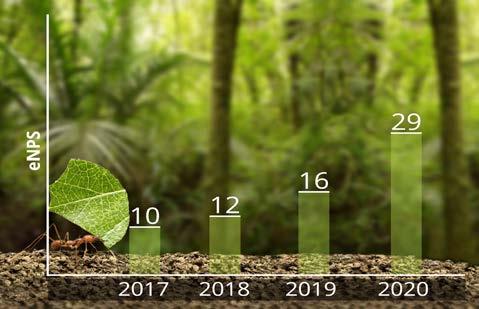
29 eNPS
eNPS (employee Net Promoter Score)
eNPS 29 2019 this figure was 16. 2018 this figure was 12 2017 this figure was 10 Goal: eNPS 30 by 2022. Comment: eNPS measures how willing employees are to recommend their workplace, based on the question: ”Would you recommend our company to a colleague or a friend?” Our initial goal was to reach to 20 by 2022. SInce we reached this goal by far in 2020 we have altered our goal to 30 by 2022.
44% Gender mix 28% Female managers
Gender Mix
Our workforce is 44% female. 2019 this figure was 42% 2018 this figure was 42%. 2017 this figure was 48%.
Goal: 45-55%
Comment: Our overall gender mix has not changed since 2018, and we are still a bit below our wanted level of 45-55 % female employees today.
Female Managers
28 % of our managers are female. 2019 this figure was 30% 2018 this figure was 29% 2017 this figure was 28%
84% Utilization of Spirit fund
Degree of utilization of our
Greencarrier Spirit Fund 84% 2019 this figure was 100% 2018 this figure was 73% 2017 this figure was 78%
Goal: 100% every year
Comment: Our ambition is to always use the money in the fund, however some years we have a lower degree of utilization and sometimes higher, depending on what projects we find. During 2020 some initaitves were made impossible by the pandemic, but we also found many different initiatives to engage in related to the pandemic. Goal: 45-55% female managers.
Comment: Compared to our overall balance in gender mix, the number of female managers is low and we strive to increase this number with a goal to be 45-55% female managers.
40% Countries with Spirit projects
Countries that has a Greencarrier Spirit project 4 of 10 = 40%
Norway, Sweden, China (incl Hong Kong), Latvia
Figures for 2019 was 7 of 11 = 64%
Lithuania, Norway, Sweden, Denmark, China (incl Hong Kong), Poland, UK
Figures for 2018 was 6 of 11 = 55%
Lithuania, Norway, Sweden, China (incl Hong Kong), Estonia, UK
Figures for 2017 was 4 of 12 = 25% Lithuania, Latvia, Sweden, China (incl Hong Kong).
Goal: 50% by 2021, 75% by 2022, 100% by 2023.
Comment: We did not reach the goal of 100% in 2020 - instead we had a lower result than last year. However we started a number of global initiatives that enables us to give back anyway. New goal is set to 100% by 2023.


