

Funding for this report was provided through Best Start, Communities for Children and through the Sir Andrew and Lady Fairley Foundation's contribution to the Greater Shepparton Lighthouse Project. It has been produced by the following members of the workgroup:
Best Start:
Belinda Whitelaw and Sally Wright
Communities for Children:
Claire Tarelli and Heather Paterson
Greater Shepparton Lighthouse Project / Goulburn Murray Local Learning and Employment Network (GMLLEN):
Judith Bujold, PhD and Jennifer Hippisley
Sexton Consulting:
Ann Sexton
Special thanks to Priscilla Shanks and Cathie Nolan (DEECD) for their contribution in assisting with data collection and advice throughout the process.
Particular acknowledgement is owed to those people who attended and contributed to the three community consultations. The report framework and content were developed at three workshops attended by a wide range of organisations that work with children and young people.
The State of Greater Shepparton’s Children Report, May 2014
This report is available at the Council offices: 90 Welsford Street, Shepparton, Victoria.
A copy of this report is also available online at: www.greatershepparton.com.au www.sheppartoncfc.com.au www.fairleyfoundation.com
This publication is copyright. No part may be reproduced by any process except in accordance with the provisions of the Copyright Act 1968
This report is for information purposes only. Whilst every effort has been made to ensure that the information is accurate, Best Start, Communities for Children and the Greater Shepparton Lighthouse Project will not accept any liability for any loss or damage which may be incurred by any person acting in reliance upon the information.
Artwork/Photo credits:
Provided courtesy of Communities for Children and Greater Shepparton City Council, Jason Miller and Sue Graves.
Design: Flying Pig Design
g reater s hepparton b est s tart p rogram
The Greater Shepparton Best Start Program was introduced in 2002 as one of the inaugural five Best Start sites across Victoria. Best Start aims to improve the health, development, learning and wellbeing of all Victorian children (0-8 years –'the early years') by supporting communities, families and service providers to provide the best possible environment, experiences and care for young children. In particular Best Start has a strong emphasis on prevention and early intervention, and strengthening universal early years services so they are responsive to the diverse needs of children and families in our community.
As Chair of the Greater Shepparton Best Start Partnership and current Mayor of the City of Greater Shepparton I am very aware of the critical importance of high quality, timely data. This assists us to identify what we need to do and to evaluate the effectiveness of our efforts in bringing about change and improvement in children’s lives.
This State of Greater Shepparton’s Children Report 2014 is an invaluable resource for this purpose. It will assist us to effectively plan and prioritise precious resources to the areas and communities most in need. Our commitment to taking an evidence based approach, built on reference to and collection of quality data and research, is reflected in the Greater Shepparton Best Start Early Years Plan 2011-2014.
In 2012 the Greater Shepparton Best Start Early Years Partnership committed to the development of a comprehensive early years data profile. The opportunity to partner with the Communities for Children Initiative and the Greater Shepparton Lighthouse Project in the development of this data profile has brought many benefits.
International and national research shows that a child’s ‘early years’ are critical in shaping their future, and investing resources in the early childhood years pays positive dividends for communities. Investment in children’s wellbeing builds the ‘human capital’ of a strong society.
Jenny Houlihan Chair, Greater Shepparton Best Start Partnership Mayor, City of Greater Shepparton
cI ty of g reater s hepparton c ommun I t I es for c h I ldren
The City of Greater Shepparton Communities for Children (CGSCFC) program was established in October 2011 with CatholicCare Sandhurst (formally Centacare) as the Facilitating Partner. This Australian Government initiative aims to improve the health, development and wellbeing of children aged 0-12 and their families by focusing on prevention and early intervention approaches that bring about positive family functioning, safety and child development. As one of ten trial ‘enhanced’ sites in Australia, Shepparton also has a focus on vulnerable and disadvantaged families.
Since its inception, CGSCFC has facilitated 16 projects with 14 Community Partners in the delivery of a broad range of activities including health and wellbeing programs, school hubs, playgroups, antenatal and young parent support.
City of Greater Shepparton Communities for Children relies on quality evidence to support its decision-making process by informing activities and funding to ensure the greatest impact can be achieved with the resources available.
At the program’s strategic planning workshop in February 2014, the importance of reliable and relevant data to guide the future direction of the program was ratified in a new strategy direction. This places emphasis on developing a strong evidence base that informs service delivery, directly linked to the best possible outcomes for children and their families.
The City of Greater Shepparton Communities for Children is proud to have been involved in the development of the inaugural State of Greater Shepparton’s Children Report 2014, in collaboration with Best Start, the Greater Shepparton Lighthouse Project and the Goulburn Murray Local Learning and Employment Network (GMLLEN), and thanks the many services and organisations that contributed towards its publication.
Claire Tarelli Team Leader, Communities for Children
g reater s hepparton lI ghthouse p roject
The Greater Shepparton Lighthouse Project emerged from meetings in 2011/2012 between the Sir Andrew and Lady Fairley Foundation, major philanthropic funders and the Shepparton CEO Community. Leaders of Shepparton’s education, non-profit, community (including health care, local government, service clubs and business), civic, and philanthropic sectors are now working collectively to tackle pressing challenges, and to take advantage of opportunities in a ‘whole of community’ approach to improve the wellbeing of children and educational outcomes in Greater Shepparton. The initiatives supported by our organisation recognise the importance of looking at education in both a preventive and a wider perspective, and the key role that early childhood education plays in the cognitive and emotional development of children.
By working closely with the community, The Lighthouse Project is developing a model of partnership, to address educational, social and economic disadvantage. With the aim to support collective strengthening and capacity building in the Goulburn Murray area, it is a privilege to work in collaboration with Best Start and Communities for Children to produce the first State of Greater Shepparton’s Children Report 2014. Moreover, the Lighthouse Project is looking at establishing an evidential basis for making informed decisions about strategies and measurement points.
It is important for our organisation to engage stakeholders in the discussion of appropriate levers of change and in the future management of data reporting and dissemination.
In order to develop a cradle to career model (0-18 years), the State of Greater Shepparton’s Children Report 2014 proposes a unique profile of the area, based on an ecological approach inclusive of the children and young people in their families and their community. The framework, inspired by the reflection of the Bendigo Child Friendly City Leadership Group (The State of Bendigo`s Children Report, 2011), includes the key indicators of child and family wellbeing identified by the stakeholders.
This State of Greater Shepparton’s Children Report 2014 serves as a baseline, indicating whether improvement or challenges have been raised over time. It also contributes to the implementation of priorities and projects to improve aspirations, engagement and results around education.
Adam Furphy Chair, Greater
Shepparton Lighthouse Project
Steering Committee
The development of this State of Greater Shepparton’s Children Report 2014 has been a joint endeavour of Council’s Best Start Program, the City of Greater Shepparton Communities for Children initiative1 and the Greater Shepparton Lighthouse Project2. The impetus for this is a shared commitment to promoting better use of quality data and evidence for local community capacity building, service planning, and program evaluation.
Good planning requires good data.
With particular reference to the Victorian Child and Adolescent Outcomes Framework and the State of Bendigo’s Children Report March 2011, this report presents a broad range of data related to the key indicators of health, educational attainment and community wellbeing of the children (0-18 years of age). It highlights both the areas in which Greater Shepparton's children and young people are doing well and those which must be addressed if they are to thrive and succeed in adulthood. The report prompts reflection on what factors are contributing to healthy development, and where effort and advocacy needs to be focussed.
The data is complemented by a series of local commentary/discussion ‘snapshots’ which add depth and interest to the report. These reflect the success of local service activities, give examples of what is working well, pose questions for further discussion and provide additional interpretation of some data. They evoke a sense of pride in what has been achieved and stimulate collective responsibility for areas that necessitate improvement.
For example, whilst our AEDI (Australian Early Development Index) child vulnerability rates and early learning/ literacy indicators are improving, the rates of family assaults and drug use have increased. Both these gains and challenges need to be considered in dialogue with organisational and community representatives of our diverse community – to consolidate what is working and respond to the issues that impede healthy child and adolescent development.
In April 2013 representatives from Best Start, Centacare and the GMLLEN3 formed a workgroup to progress the development of this data resource. The report framework and content were developed at three workshops attended by a wide range of community representatives working with children and young people in Greater Shepparton.
The first workshop focussed on developing the broad developmental domains, brainstorming what indicators should sit under each domain and identifying possible data categories.
From this a draft format was developed and taken to the second workshop for:
• Confirmation of domains and indicators and the inclusion of sections for both community demographics and the AEDI.
• Consultation around such questions as the report title and whether our Indigenous data should form a separate section or be included under each domain.
• Consideration of and input to the data categories4
The third workshop confirmed the scope of the report and provided input to the range of snapshots incorporated into the report. The development of this resource has been endorsed by the respective management of Best Start, Centacare and the GMLLEN5 as the sponsors and funders of the document.
The project worker already employed by GMLLEN has taken responsibility for all the data collation and coordination of report content. The final selection of what data to include was informed by key stakeholders at the workshops and conversations with some services outside the workshops.
The selected data in this report is publicly available. The report presents information relating to selected demographic characteristics and the Australian Early Development Index (AEDI). The main body of data is then set out under five developmental domains, each with a number of headline indicators and set of data categories and data items.
Data gaps which have been identified in relation to the five Developmental Domains provide direction for the next stage of data collection. Given the intent that this resource will be used to drive service and community development the Next Steps section sets out a number of key actions and intentions.
In acknowledgement of the extensive body of data that is of value to readers, References and Looking for More Data lists a number of useful resources.
Finally the Indicator Summary on page 56 provides a summary picture of what the data tells us. It sets out the data included in this report and those data categories relevant to child and adolescent development which are outside the scope of this document.
l Demographics
l AEDI data
5 Developmental Domains 13 Indicators
l Happy and Healthy Children − 3 Indicators
l Learning Early and School Success − 4 Indicators
l Safe and Secure − 3 Indicators
l Supported Families − 2 Indicators
l Vibrant Communities − 1 Indicator
Data Gaps
39 datasets and 8 datasets only collected for the whole population
Inclusion of data specifically relating to Indigenous children and youth, and those from culturally diverse backgrounds, is considered particularly important given the rich diversity of the Greater Shepparton community. It provides an additional level of evidence as to where population health and educational disparities are greatest, and where social investment should be directed.
The research has identified where there are gaps in data. These data gaps indicate areas where effort and resources are required to ensure effective advocacy.
The Data Gaps section presents where either the data is collected but not publicly available or not collected systematically. Such gaps may present opportunities to advocate for important data to be made more accessible.
Please note that where data is sourced on the Department of Education and Early Childhood Development (DEECD) VCAMS Portal this website is the stated reference.
1 Auspiced by CentaCare.
2 Auspiced by GMLLEN
3 As a member of the Greater Shepparton Lighthouse Project Steering Committee, GMLLEN is the auspice on behalf of the Greater Shepparton Lighthouse Project, for funds received from the Sir Andrew and Lady Fairley Foundation for this research project. One activity of this project was to develop a data profile to inform planning for the Greater Shepparton Lighthouse Project.
4 Data catagories are the descriptor for the type of data presented i.e breastfeeding rates.
5 On behalf of the Greater Shepparton Lighthouse Project.
Data is principally displayed in a way that shows whether Greater Shepparton is doing better (green circle) or worse (red circle) in relation to Victorian key indicators. It is important to note that green does not always mean that the level of health or education is developmentally acceptable, it is just better than the state or national result.
Trends are depicted to increase the value of the data. Greater Shepparton rates may be increasing on a particular indicator, however these may apply across the state. Therefore, such results should be interpreted carefully and be taken into consideration with a multifactorial approach analysis, as for example, when looking specifically at the impact of local activities.
"It is very clear from our consultations that local organisations need information about their local communities and, likewise, State-wide organisations need access to their jurisdictional information. The Best Start program reports are an example of collation of information for local areas. To enable this to occur effectively, protocols are needed for collation and analysis of data, and for Aboriginal interpretation and review, to allow data to be placed accurately in context and to allow appropriate communication of this information. It is inappropriate for data analysis and reporting of Aboriginal child health and wellbeing issues to occur in the absence of Aboriginal input, if only because inaccurate conclusions are often reached without such input."
Misrepresentation of data about Aboriginal people and communities was a major concern expressed in consultations. Qualitative research following up results of quantitative surveys was suggested a number of times as a means of making the most use of survey data. Data was acknowledged as an important resource for training of health professionals and others in Aboriginal child health. However, it was also noted that it is important not to add an extra data collection burden to cooperatives and organisations in the absence of capacity to implement it.

It is not in the scope of this report to comment on the ‘statistical significance’ of the comparative results, or make judgments on individual data measures in relation to deciding community priorities. However, such a report can guide community observers in their understanding of the local challenges, as well as being a starting point in establishing benchmarks and key performance indicators to improve the life chances for Greater Shepparton’s children.
For example, the report shows positive trends in many fields where the data indicates that during a specific period, the situation has improved for the targeted population.
Greater Shepparton is doing better than the Victorian average in relation to the proportion of children experiencing a high level of family stress. However, the evidence suggests that an even lower rate would be desirable, in accordance with benchmarks established by local, state or international standards.
Other positive trends are highlighted in the document, for example the social competence and wellbeing AEDI domain and the school completion rate for Indigenous students (including the proportion of Indigenous youth attending secondary school and of young people engaged with education institutions in Greater Shepparton), although the local figures are below the state average (page 30).
Although the percentage of children on track is below the state average, improvement has been noticed; the proportion of children who are developmentally vulnerable is lower in 2012 than in 2009 (page 15).
Language and cognitive skills
Greater Shepparton trend
The proportion of Greater Shepparton children who are developmentally vulnerable is lower in 2012 (9.9%) than in 2009 (12.1%). Significant change.
State trend
The proportion of children who are developmentally vulnerable is stable between 2012 and 2009 (6.1%).
Source: VCAMS Portal, DEECD

Children are vulnerable in one or more domains
Greater Shepparton trend
The proportion of Greater Shepparton children who are developmentally vulnerable is higher in 2012 (24.6%) than in 2009 (23.5%). No significant change.
State trend
The proportion of children who are developmentally vulnerable is lower in 2012 (19.5%) than in 2009 (20.3%).
The report also highlights areas where negative trends have been recorded over the past few years. For example, in the AEDI, it is noted that the proportion of Greater Shepparton children who are developmentally vulnerable is above the Victorian average and is higher in 2012 than in 2009, whereas the state trend shows a deceasing rate for the same period.
The situation is also concerning when looking at the NAPLAN results (page 27) and the school attainment in Year 12 (page 29).
Proportion of children with high levels of family stress
Greater Shepparton trend
Decreased 2011 to 2012.
State trend
Increased 2011 to 2012.
Source: VCAMS Portal, DEECD
Immunisation 24 - < 27 months
Greater Shepparton trend
Increased 2011-12 to 2012-13 (+2.3%).
State trend
Stable 2011-12 to 2012-13 (-0.2%).
Source: VCAMS Portal, DEECD
There is an increasing rate of children in Greater Shepparton who are immunised. This rate is slightly higher than the state average (page 19).
Social competence and wellbeing
Greater Shepparton trend
The proportion of Greater Shepparton children who are developmentally vulnerable is higher in 2012 (11.4%) than in 2009 (9.3%). Significant change.
State trend
The proportion of children who are developmentally vulnerable is stable between 2012 (8.1%) and 2009 (8.4%).
Estimated Resident Population (ERP) Trend: 2011-2012 = +0.98%
Source: Profile.id (2013)
Birth Rate
In 2012, the birth rate for women less than 20 years of age in Greater Shepparton was 25.5 (per 1000) compared to the Victorian rate of 10.4. The birth rate for Victorian Indigenous women under 20 was 62.8 (VCAMS, 2012).
Source: ABS, 2011
2006-2011 = + 271
Source: ABS (2011); Profile.id (2013)
Immigration
Source: ABS, 2011
Source: ABS (2011), Department of Health (2012)
Proficiency in English
another
and English well or very well
Adult literacy level
Source: Profile.id (2013)
SEIFA
Trend: Decreased 2006 (rank 19, 3rd decile) to 2011 (rank 13, 2nd decile)
Source: Profile.id (2013)
GAP
GAP
951.9
Median: 996.6
Rank (2011): 13th
SEIFA is a measure of Australian socio-economic wellbeing and is designed to compare the socio-economic status of areas at a given point in time. The SEIFA Index of Relative Social-Economic Disadvantage is derived from Census variable data such as low income, unemployment, low educational attainment and dwellings without motor vehicles. A low SEIFA score indicates that an area is relatively disadvantaged compared to an area with a higher score (Profile.id, 2013). In 2006, Greater Shepparton had a SEIFA score of 968 (rank 19, 3rd decile), showing a deterioration of the socio-economic wellbeing between 2006 and 2011.
Economic growth data (GRP)
Greater Shepparton trend: 2011 to 2012= -1.5%
Victorian Trend: 2011 to 2012= +0.5
Source: National Institute of Economic and Industry Research (NIEIR, 2013)
The AEDI provides "a new type of social barometer, showing the outcomes of the first five years of children's lives and providing a baseline for what might happen next.”
(Milburn, 2010)
The Australian Early Development Index (AEDI) is a measure of how young children are developing in different communities, creating a snapshot of children’s development as they enter school.
Based on the scores from a teacher-completed checklist, the AEDI measures five areas, or domains, of early childhood development. These domains are:
• Physical Health and Wellbeing
• Social Competence
• Emotional Maturity
• Language and Cognitive Skills
• Communication and General Knowledge
The AEDI domain results are reported as numbers and percentages and give a clear representation of the children who are 'on track', 'developmentally at risk' or 'developmentally vulnerable'. See page 61 for a detailed description of these terms.
Greater Shepparton’s 2012 AEDI data collection assessed 973 children in their first year of formal schooling. This data collection was undertaken by 74 teachers from 39 schools in Greater Shepparton − both government and non-government. From this sample, 7.6% children were Indigenous, 5.3% were born in a country other than Australia and 12.5% had English as a second language.
Community demographic factors have a significant impact on child development and it is important to consider this information when interpreting the results. Some of the following key considerations reported in the 2012 Community Profile may help when interpreting results:
• Boys are more likely to be developmentally vulnerable on the AEDI domains compared with girls.
• Indigenous children are more than twice as likely to be developmentally vulnerable than non-Indigenous children.
• Children who are not proficient in English, independent of whether they speak another language or not, are more likely than other children to be developmentally vulnerable, particularly on the language and cognitive skills (school-based) domain.
• Research shows a high quality early childhood education experience enhances all-round development in children. Information about children diagnosed with special needs is not included.
• It may be useful to consider how well children are settling into the school environment and what may be influencing their transitions to school.
Greater Shepparton now has three sets of AEDI results which give valuable comparative information in relation to the health and wellbeing of our children. The Greater Shepparton Best Start Partnership commissioned the first data collection in 2008 and the Commonwealth Government have funded two subsequent national collections in 2009 and 2012. The expectation is that this will continue every 3 years.
Local AEDI data has been a valuable guide in deciding where service development funding should be directed. For example, each of the three data collections has shown that Mooroopna, south Shepparton and north west Shepparton have the highest number of children assessed as being ‘developmentally vulnerable’ and ‘developmentally at risk’.
For further information visit the AEDI website http://www.rch.org.au/aedi/ and see the Greater Shepparton Community Profile.
Statistical significance available on www.rch.org.au/aedi
Physical health and wellbeing
Greater Shepparton trend
The proportion of Greater Shepparton children who are developmentally vulnerable is higher in 2012 (9.5%) than in 2009 (9.2%). No significant change.
State trend
The proportion of children who are developmentally vulnerable is stable between 2009 (7.7%) and 2012 (7.8%).
Children developmentally at risk (13.4%) or developmentally vulnerable (9.5%):
• Have at least sometimes experienced coming unprepared for school by being dressed inappropriately, coming to school hungry or tired.
• Range from those who have not developed one of the three skills (independence, handedness, coordination), to those who have not developed any of these skills.
• Range from those who have an average ability to perform skills requiring gross and fine motor competence and good or average overall energy levels, to those who have poor fine and gross motor skills, poor overall energy levels and physical skills.
Social competence and wellbeing
Greater Shepparton trend
The proportion of Greater Shepparton children who are developmentally vulnerable is higher in 2012 (11.4%) than in 2009 (9.3%). Significant change.
State trend
The proportion of children who are developmentally vulnerable is stable between 2012 (8.1%) and 2009 (8.4%).
Children developmentally at risk (16.5%) or developmentally vulnerable (11.4%):
• Have average to poor overall social skills, low self-confidence and are rarely able to play with various children and interact cooperatively.
• Only sometimes or never accept responsibility for actions, show respect for others and for property, demonstrate selfcontrol, and are rarely able to follow rules and take care of materials.
• Only sometimes or never work neatly, independently, are rarely able to solve problems, follow class routines and do not easily adjust to changes in routines.
• Only sometimes or never show curiosity about the world, and are rarely eager to explore new books, toys or unfamiliar objects and games.
Communication and general knowledge
Greater Shepparton trend
The proportion of Greater Shepparton children who are developmentally vulnerable is lower in 2012 (9.0%) than in 2009 (10.3%). No significant change.
State trend
The proportion of children who are developmentally vulnerable is higher in 2012 (8.0%) than in 2009 (8.3%).
Children developmentally at risk (16.1%) or developmentally vulnerable (9.0%):
• Range from being average to very poor in effective communication, may have difficulty in participating in games involving the use of language, may be difficult to understand and/or have difficulty in understanding others and may show little general knowledge.
Greater Shepparton trend
The proportion of Greater Shepparton children who are developmentally vulnerable is lower in 2012 (8.0%) than in 2009 (9.1%). No significant change.
State trend
The proportion of children who are developmentally vulnerable is lower in 2012 (7.2%) than in 2009 (8.3%).
Children developmentally at risk (16.0%) or developmentally vulnerable (8.0%):
• Never or almost never show most of the helping behaviours including helping someone hurt, sick or upset, offering to help spontaneously, and inviting others to join in.
• Often show most of the anxious behaviours; are worried, unhappy, nervous, sad or excessively shy, indecisive; and are upset when left at school.
• Often show most of the aggressive behaviours; they get into physical fights, kick or bite others, take other people’s things, are disobedient or have temper tantrums.
• Often show most of the hyperactive behaviours; they could be restless, distractible, impulsive; they fidget and have difficulty settling to activities.
Language and cognitive skills
Greater Shepparton trend
The proportion of Greater Shepparton children who are developmentally vulnerable is lower in 2012 (9.9%) than in 2009 (12.1%). Significant change.
State trend
The proportion of children who are developmentally vulnerable is stable between 2012 and 2009 (6.1%).
Children developmentally at risk (14.0%) or developmentally vulnerable (9.9%):
• Do not have most of the basic literacy skills; have problems with identifying letters or attaching sounds to them, rhyming, may not know the writing directions and how to write their own name.
• May not show interest in books and reading, or maths and number games, or both, and may have difficulty remembering things.
• Have only up to one of the advanced literacy skills; cannot read or write simple words or sentences, and rarely write voluntarily.
• Have marked difficulty with numbers, cannot count, compare or recognise numbers, may not be able to name all the shapes and may have difficulty with time concepts.
Children are vulnerable in one or more domains
Greater Shepparton trend
The proportion of Greater Shepparton children who are developmentally vulnerable is higher in 2012 (24.6%) than in 2009 (23.5%). No significant change.
State trend
The proportion of children who are developmentally vulnerable is lower in 2012 (19.5%) than in 2009 (20.3%).
Children are vulnerable in two or more domains
Greater Shepparton trend
The proportion of Greater Shepparton children who are developmentally vulnerable is lower in 2012 (11.6%) than in 2009 (12.6%). No significant change.
State trend
The proportion of children who are developmentally vulnerable is lower in 2012 (9.5%) than in 2009 (10.0%).
This domain refers to the different ways the health and development of children is monitored and supported to ensure a good, safe and healthy start to life. It focuses on prevention, detection and early intervention of health, wellbeing and developmental concerns.
"Our children are our future. Good health and wellbeing in the early years are the foundations of well-adjusted and productive adult lives and fully functioning societies." (Bammer, Michaux & Sanson, 2010)
a ntenatal care and b I rth
Low birth weight
Greater Shepparton trend
N/A (not collected in the Shepparton Population Health Profile prior to 2013) State trend
Increased 1985-2006 (+1.4%)
Source: Shepparton Population Health Profile, Department of Health, 2013; http://www.education.vic.gov.au/about/research/Pages//011birthweight.aspx
"Investing in expectant mothers and their young children is a powerful equalizer and a key tool for economic and social stability. The Scandinavian countries and Cuba, for example, invest in pregnant women and young children. They have put in place high quality centre-based programs involving parents, that are accessible and affordable. For example, the high rate of adult literacy in Norway indicates the benefits of its widespread early childhood programming. Brain plasticity allows us to consider later interventions to improve outcomes for children who have had a poor start. However, it is better for the child, and less costly for society, to provide a positive beginning, rather than having to resort to remedial action later on." (Mustard, 2011)
b reastfeed I ng rates
Babies fully breastfed at 3 months
Greater Shepparton trend
Increased between 2011-12 and 2012-13 (+2.8%)
State trend
Stable between 2011-12 and 2012-13 (-0.7%)
Source: VCAMS Portal, DEECD
Babies fully breastfed at 6 months
Greater Shepparton trend
Increased 2011-12 to 2012-13 (+2.2%)
State trend
Decreased 2010-11 to 2011-12 (-1.0%)
Source: VCAMS Portal, DEECD
Whilst Greater Shepparton has some of the lowest 2011/12 breastfeeding rates in Victoria - 6th lowest out of 78 municipalities for fully breastfed at 3 months (42.5%) and 5th lowest for fully breastfed at 6 months (15.6%) - it is encouraging to note that Greater Shepparton’s 2012/2013 breastfeeding rates have increased to 45.3% and 17.8% respectively. The Greater Shepparton Breastfeeding Workgroup, made up of representatives from various local organisations involved in breastfeeding, has been working hard to effect this. Examples of joint service development and activities include the production of the Breastfeeding Friendly Locations Map and the establishment of the Riverside Plaza Breastfeeding Café.
Children have their 4 month assessment (2012/2013)
Greater Shepparton trend
Decreased 2011-12 to 2012-13 (-3.5%)
State trend
Decreased 2011-12 to 2012-13 (-1.1%)
Indigenous Children have their 4 month assessment
Greater Shepparton trend
Decreased 2011-12 to 2012-13 (-23.4%, please note this does not represent the actual trend over the last 4 years)
State trend
Decreased 2011-12 to 2012-13 (-2.2%)
Source: Greater Shepparton Maternal & Child Health Service Annual Reporting 2011/12, 2012/2013
Children have their 3.5 years assessment
Greater Shepparton trend
Increased 2011-12 to 2012-13 (+5.8%)
State trend
Increased 2011-12 to 2012-13 (+2.1%)
Indigenous Children have their 3.5 years assessment
Greater Shepparton trend
Decreased 2011-12 to 2012-13 (-3.8%)
State trend
Stable between 2011-12 and 2012-13 (+0.6%)
Source: VCAMS Portal, DEECD; Greater Shepparton Maternal & Child Health Service
Did you Know?
The Greater Shepparton Maternal and Child Health (MCH) service has a high usage of interpreters. Clear communication is critical if the nurses are to complete the requirements of a Key Age and Stage visit, provide a high quality standard of clinical care and develop rapport with families.
The interpreting service for MCH is available through the Victorian Interpreting and Translating Service (VITS), which is funded by the Department of Education and Early Childhood Development (DEECD). Staff can make bookings for an interpreter online or via the phone. Nurses find having an interpreter attend a session in person is much more effective than having to rely on a phone interpreter. Unfortunately there are often issues with sourcing an interpreter locally for some of the languages spoken in Greater Shepparton. This means extra costs if the interpreter has to travel from Melbourne. Issues with a phone interpreter include the phone cutting out midway through a key age and stage check and privacy issues if the interpreter is in a public or shared space while conducting the session, compromising confidentiality.
The MCH nurses have noted that often engagement with Culturally and Linguistically Diverse (CALD) families can be difficult due to them not having experienced a similar service in their country of origin. While the MCH nurses work conscientiously to establish rapport with CALD families and the availability of an interpreting service can definitely assist with communication needs, the problems and issues described above can sometimes hinder the ongoing engagement of families with the service.
12 − < 15 months
Greater Shepparton trend
Stable 2011-12 to 2012-13 (-0.4%)
State trend
Decreased 2011-12 to 2012-13 (-0.9%)
Source: VCAMS Portal, DEECD
24 − < 27 months
Greater Shepparton trend
Increased 2011-12 to 2012-13 (+2.3%)
State trend
Stable 2011-12 to 2012-13 (-0.2%)
Source: VCAMS Portal, DEECD
60- <63 months
Greater Shepparton trend
Increased 2011-12 to 2012-13 (+1.5%)
State trend
Increased 2011-12 to 2012-13 (+1.2%)
Source: VCAMS Portal, DEECD
According to the National Health Performance Authority, the Goulburn Valley has the eighth highest child immunisation rate in Australia (based on 61 regions surveyed during the 2011-12 period). Council’s Maternal and Child Health Team Leader said that the thorough consultation process between nurses and parents was crucial to ensuring children were up to date with their vaccinations.
‘‘When we see families, particularly at the four week visit, we start promoting immunisations that babies can have, and follow up with them to make sure they are up to date,’’ […] ‘‘As part of the discussion we’ll have conversations about what the vaccination schedule is and what they can expect after the immunisation.’’ (Shepparton News, 2013)
Parents concerned about their child’s oral health
Greater Shepparton trend
N/A
State trend
N/A
Source: Outcomes for Victorian children at school entry, SEHQ, 2008
Proportion of children with emotional or behaviour difficulties
Greater Shepparton trend
Increased 2011 to 2012 (+1.0%)
State trend
Stable 2011 to 2012 (+0.2%)
Source: VCAMS Portal, DEECD
Proportion of children who are bullied Years 5-6
Greater Shepparton trend
Years 5-6: stable 2012 to 2013 (-0.8%)
State trend
Years 5-6: stable 2012 to 2013(-0.2%)
Source: VCAMS Portal, DEECD
Proportion of children who are bullied Years 7-9
Greater Shepparton trend
Years 7-9: decreased 2012 to 2013 (-2%)
State trend
Years 7-9: stable 2012 to 2013 (+0.5%)
Source: VCAMS Portal, DEECD
Proportion of children with high levels of family stress
Greater Shepparton trend
Decreased 2011 to 2012 (-2.3%)
State trend
Stable 2011 to 2012 (+0.6%)
Source: VCAMS Portal, DEECD
The Department of Health Local Government Area Profiles for Greater Shepparton 2012 have identified that the percentage of registered mental health clients per 100,000 population for Greater Shepparton is 16.2%, compared to Victoria (11%).
Local data provided by Goulburn Valley Health’s Mental Health Unit recognises that:
• 1 in 5 adults experience mental health illness in their lifetime
• 1 in 4 adolescents will experience a mental illness, Alcohol and Other Drugs (AoD) or both
Source: In Health and Wellbeing Planning Guide and Status Report 2012, Greater Shepparton City Council.
Children who attended a school or community breakfast club
Greater Shepparton trend
Stable 2009 to 2012
State trend
N/A
Source: AEDI, 2012 (Population: children in their first year of formal schooling)
Relationships Australia Victoria has been coordinating an evening meals program every Wednesday night at Lulla’s Children and Family Centre as one of their Communities for Children program activities. This provides parents with an opportunity to learn new, cost-effective recipes, and teaching the children at this Early Learning Centre about healthy cooking and eating. As well as engaging socially, parents also get an opportunity to interact with the centre staff to catch up about their child’s progress on the meals night, and discuss any parental concerns. Some of the most vulnerable families have been identified since the meals program commenced, and support has been provided to those requiring it, while simultaneously building resilience and capacity.
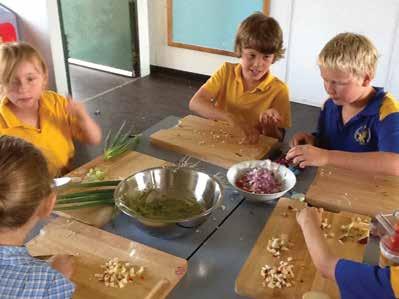
Bourchier Street Primary School have employed a nutritionist to coordinate a ‘Paddock to Plate’ program funded through the Communities for Children program. The program involves growing a wide variety of fruit and vegetables, which are then harvested by the children to make a range of healthy, international dishes to share, teaching and practising healthy cooking and eating for the students and their parents. An unexpected outcome of the program has been an increase in student attendance since the Paddock to Plate project commenced. For more information see: http://bspspaddocktoplate.weebly.com
"The economic and social participation of young people is recognised as an essential ingredient in promoting wellbeing and reducing mental health issues. Provision of mental health and physical health support to young people is a key factor in improving education and vocational outcomes." (Muir et al 2009)
n umbers of young people WI th sexually transm I ss I ble I nfect I ons (st Is)
Rate of sexually transmissible infections in young people per 100,000
Greater Shepparton trend
Decreased 2011 to 2012 (-40.3%)
State trend
Increased 2011 to 2012 (+152.7)
Source:VCAMS Portal, DEECD
m ental health
Adolescents' rate of intentional self harm per 1,000
Greater Shepparton trend
Increased 2007-08 to 2008-09 (+0.4)
State trend
Stable 2007-08 to 2008-09 (0.0)
Source: Adolescent Community Profile, City of Greater Shepparton, DEECD, 2010
Adolescents' rate of psychiatric hospitalisation per 1,000
Greater Shepparton trend
Increased 2007-08 to 2008-09 (+2.0)
State trend
Increased 2007-08 to 2008-09 (+0.6)
Source: Adolescent Community Profile, City of Greater Shepparton, DEECD, 2010
Did you know?
Headspace is the National Youth Mental Health Foundation, established in 2006 with funding from the Commonwealth Government. It is a world-first initiative that fills a gap in the system by treating young people who have mild to moderate mental health issues. In 2013, Headspace Shepparton Centre was officially launched, aiming to provide support, information and advice to young people aged 12-25 who are going through a tough time, such as depression, anxiety, bullying, drug and alcohol issues and health and wellbeing.
Partnerships have formed the core of the Headspace model, with corporations and organisations committed to improving the wellbeing of young Australians, by delivering additional programs that complement existing services. These partnerships benefit young people and their families (in http://www.headspace.org.au).
Births per 1000 women aged 15-19
Greater Shepparton trend
Increased 2008 to 2012 (+4.6)
State trend
Stable 2007 to 2008 (+0.2)
Source: Adolescent Community Profile, City of Greater Shepparton, DEECD, 2010; Selected Local Area Survey Results about Health, Wellbeing & Community Life, 2013
The Bridge Antenatal Care and Education Program was established in 2003 to provide more 'youth friendly' antenatal care for women aged 24 years and under. It combines a weekly group session at The Bridge Youth Service with clinical care provided at The Bridge by a Goulburn Valley Health midwife.
Young pregnant women are supported in a broad range of areas including physical and emotional wellbeing, housing and drug and alcohol issues. An important aspect is the preparation for and support with parenting, and the majority of young women go on to attend the Bridge’s Future Parenting Program after the birth of their baby.
"Engagement process with children with disabilities involves adopting an ability approach rather than focusing on their impairments, limitations or special needs." (DEECD, 2013)
n umbers of ch I ldren and adolescent s WI th d I sab I l I ty or de V elopmental delay
Number of people with a profound or severe disability ages 0-4
Greater Shepparton trend
Stable 2006 to 2011 (+0.1%)
State trend
Stable 2006 to 2011 (0.0%)
Number of people with a profound or severe disability ages 5-14
Greater Shepparton trend
Stable 2006 to 2011 (+0.8%)
State trend
Stable 2006 to 2011 (+0.6%)
Number of people with a profound or severe disability ages 15-19
Greater Shepparton trend
Increased 2006 to 2011 (+1.3%)
State trend
Increased 2006 to 2011 (+1.0%)
Source: ABS, 2011, in GV Primary Care Partnership, 2013
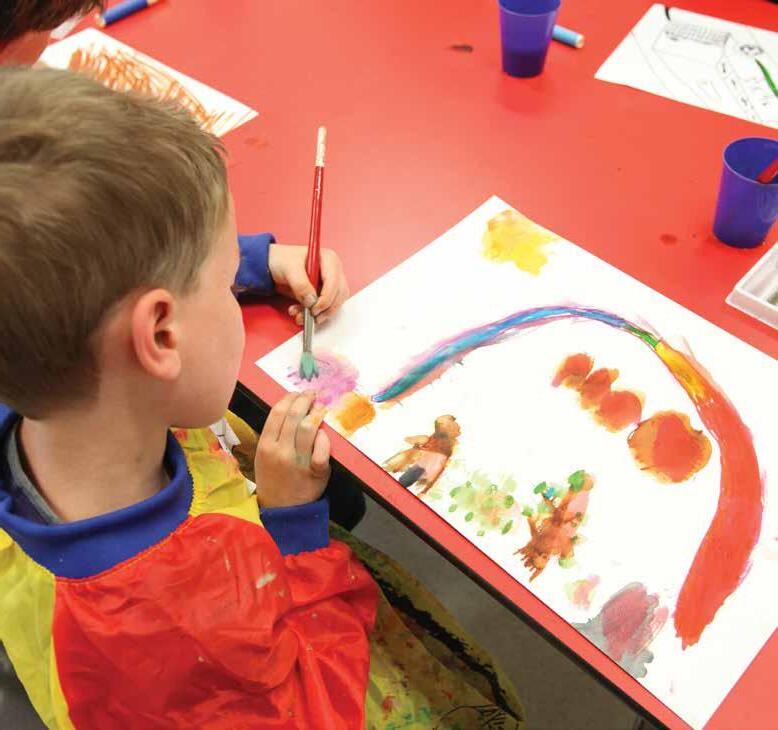
This domain refers to the cognitive and social development of children, including academic achievement and resources for parental support and engagement.
"Early childhood education is associated with better performance in school later on. Programme for International Student Assessment (PISA) research shows that the relationship between pre-primary attendance and performance tends to be greater in school systems with a longer duration of pre-primary education, smaller pupil-to-teacher ratios in pre-primary education, and higher public expenditure per child at the pre-primary level." (Organisation for Economic Cooperation and Development (OECD), 2013)
n umber of commun I ty playgroups operat I ng
Number of sessions offered per week
These playgroups sessions are run in 30 different venues in Greater Shepparton.
Source: www.greatershepparton.com.au
Did you know?
Early years research shows that Supported Playgroups and fun activities are some of the best ways of engaging vulnerable families. Funding received through the DEECD Supported Playgroup Initiative has enabled Best Start to support the running of approximately 10 Supported Playgroups in Greater Shepparton. A listing of community playgroups is available on Council's website (www.greatershepparton.com.au).
Kindergarten attendance at age 4
Greater Shepparton trend
Decreased 2011 to 2012 (-13.2%)
State trend
Increased 2011 to 2012 (+3.4%)
Source: VCAMS Portal, DEECD
Kindergarten participation rate − Aboriginal Children
Greater Shepparton trend
N/A
State trend
Decreased 2010 to 2011 (-2.7%)
Source: VCAMS Portal, DEECD
Children reported to have had a non-parental early childhood education and/or care experience in the year before school
Greater Shepparton trend
Increased 2009 to 2012 (+4.3%)
State trend
N/A
Source: AEDI, 2012
Children who attended preschool, including preschool in a day care centre, in the year before school
Greater Shepparton trend
Increased 2009 to 2012 (+5.0%)
State trend
N/A
Source: AEDI, 2012
Wellbe I ng of ch I ldren start I ng school
Proportion of children at school entry with emotional or behavioural difficulties
Greater Shepparton trend
Increased 2011 to 2012 (+1%)
State trend
Stable 2011 to 2012 (+0.2%)
Source: VCAMS Portal, DEECD
Proportion of children at school entry whose parents report concerns with their behaviour
Greater Shepparton trend
Stable 2011 to 2012 (-0.9%)
State trend
Decreased 2011 to 2012 (-1.8%)
Source: VCAMS Portal, DEECD
Early Years programs funded by Communities for Children at St Georges Road, Wilmot Road and Gowrie Street Primary Schools as part of their ‘Schools as Hubs’ project have included Mother Goose, Run, Hop, Jump, Finger Gym, Paint ‘n’ Play and weekly English Language classes for Arabic-speaking parents with simultaneous play based programs for their children. All of these activities involve the parents actively engaging in their children’s learning experiences. St Georges Road Primary School also incorporate a Playgroup for Indigenous children from Lulla’s Children and Family Centre, to help make the transition from early years to primary school a smoother process. Parents who are new to the area have been linked into Maternal and Child Health services as a result of their participation in the schools’ activities.

"Imagine a school where democracy is more than a buzzword, and involvement is more than attendance. It is a place where all adults and students interact as co-learners and leaders, and where students are encouraged to speak out about their schools." (Fletcher, 2005)
naplan
Children meeting national standards in literacy − Year 3
Greater Shepparton trend
Stable 2010 to 2011 (0.0%)
State trend
Stable 2010 to 2011 (-0.1%)
Children meeting national standards in literacy − Year 5
Greater Shepparton trend
Decreased 2010 to 2011 (-1.3%)
State trend
Stable 2010 to 2011 (+0.1%)
Children meeting national standards in literacy − Year 7
Greater Shepparton trend
Increased 2010 to 2011 (+1.0%)
State trend
Stable 2010 to 2011 (-0.4%)
Children meeting national standards in literacy − Year 9
Greater Shepparton trend
Decreased 2010 to 2011 (-1.0%)
State trend
Stable 2010 to 2011 (+0.7%)
Source: VCAMS Portal, DEECD
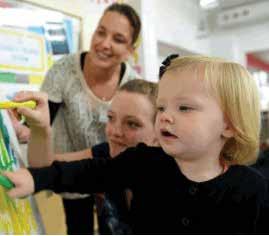
Children meeting national standards in numeracy − Year 3
Greater Shepparton trend
Increased 2010 to 2011 (+2.0%)
State trend
Stable 2010 to 2011 (+0.8%)
Children meeting national standards in numeracy − Year 5
Greater Shepparton trend
Decreased 2010 to 2011 (-2.1%)
State trend
Stable 2010 to 2011 (-0.1%)
Children meeting national standards in numeracy − Year 7
Greater Shepparton trend
Decreased 2010 to 2011 (-1.0%)
State trend
Stable 2010 to 2011 (-0.3%)
Children meeting national standards in numeracy − Year 9
Greater Shepparton trend
Stable 2010 to 2011 (+0.3%)
State trend
Stable 2010 to 2011 (-0.2%)
Source: VCAMS Portal, DEECD
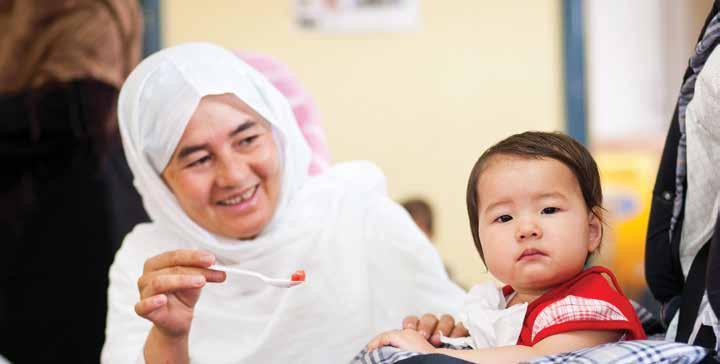
"Think of the education-to-employment system as a highway, where three drivers − educators, employers, and young people − all want to get to the same destination. There are three critical intersections − when young people enrol in postsecondary education, when they build skills, and when they seek work. At every point, each driver needs to take account of the others to keep moving safely and efficiently. Our research, however, shows that doesn’t usually happen. Instead, drivers don’t take one another into account, proceeding obliviously in their own lanes, or they collide, leaving everyone worse off than when they started." (Mourshed, Farrell & Barton, 2013)
s chool attendance data
Proportion of people who report feeling connected to their school (data available only for government schools) − Years 5-6
Greater Shepparton trend
Increased 2012 to 2013 (+0.9%)
State trend
Stable 2012 to 2013 (+0.4%)
Proportion of people who report feeling connected to their school (data available only for government schools) − Years 7-9
Greater Shepparton trend
Decreased 2012 to 2013 (-1.0%)
State trend
Decreased 2012 to 2013 (-1.1%)
Source: VCAMS Portal, DEECD
Proportion of people aged 19 years who have attained Year 12 or equivalent
Greater Shepparton trend
Decreased 2010 to 2011 (-1.4%)
State trend
Increased 2010 to 2011 (+2.6%)
Source: VCAMS Portal, DEECD
Notre Dame College’s McAuley Champagnat Programme (MCP) was developed in 2006 to meet the educational needs of 'at risk' students in the Greater Shepparton region. The Catholic Education Office of the Sandhurst Diocese and the Salvation Army’s Brayton Youth and Family Services as well as numerous community and corporate organisations work together with MCP to fulfil its vision for the students and their families.
Students engage in an educational program that aims to equip them with skills and qualifications to make successful transitions. Many of the students have learning difficulties and/or multiple behavioural problems which make it difficult for them to attend mainstream schools. Many arrive at the MCP with little self-esteem, low expectations and limited numeracy and literacy skills and walk away with pride in themselves, motivation, achievement and most importantly an education that equips them to reach educational and career goals. Highly skilled staff work with students and their families in a unique learning environment that focuses on 'hands-on learning' to give students specific industry skills and prepare them for the world of work. Staff work tirelessly to provide whole-of-student development.
(cited from http://www.notredame.vic.edu.au/mcauley-champagnat_programme/mcp.htm)
School completion rates for Indigenous students
Year 12 or equivalent attainment at age 19 (number of attainments)
Greater Shepparton trend
Increased from 2010 to 2011 (+6)
State trend
Increased from 2010 to 2011 (+69)
Source: DEECD, internal data, 2012
Following a similar positive trend as the school completion rate for Indigenous students presented above, the latest ABS data shows an increase in the proportion of Indigenous youth attending secondary school and of young people engaged with education institutions in Greater Shepparton.
Figure 1 shows the proportion of Indigenous youth (12-17 years old) attending secondary school, showing increasing numbers of boys in particular engaging with education following implementation of the Munarra Youth Futures program.
Figure 1 Figure 2
LGA
Figure 2 shows the proportion of Indigenous young people (15-24 years old) engaged with education institutions in Greater Shepparton, showing an increase to above the State average for rural Indigenous people by 2011, and well above average enrolments at TAFE (Technical and Further Education) due to the ASHE (Academy of Sport Health and Education) program. Data are from the Australian Bureau of Statistics Census of Population and Housing, 2006 and 2011.
See also Appendix 1 for the key strategies and actions in place listed in the Victorian Indigenous Affairs Framework (VIAF). s chool leaVI ng data
Percentage of engaged school leavers (involved in full time work and/or study)
Greater Shepparton trend
N/A
State trend
N/A
Source: Community indicators Victoria, 2013, in GV Primary Care Partnership, 2013
Transience, or mobility across schools, has become a major trend in recent decades. The negative effects of such mobility on reading and mathematics have been documented in many research articles (see Hattie, 2009). Students may face adjustment issues, including problems with friendship patterns, particularly friendships to support learning.
“I know through personal experience that changing school can be tough. New teachers to get to know, new routines to learn and new friends to make can all add up to an unsettled time for students who move schools. This is often further complicated for students who are transient. It can seem that as soon as the student gets to know the school and the school gets to know the student that they are then on the move again. Lower academic levels can be linked to this.” Steve Rogers, Principal Mooroopna Primary School, Executive Chair Shepparton Central Network Hume Region.
Percentage of disengaged school leavers (not involved in work or study at all)
Greater Shepparton trend
N/A
State trend
N/A
Source: Community indicators Victoria, 2013, in GV Primary Care Partnership, 2013
Numbers of young people attending alternative education programs (2012)
Adult Community Education (ACE): 433
Technical and Further Education (TAFE) / Academy of Sport, Health and Education (ASHE): 60
Vocational Education and Training (VET) / Victorian Certificate Of Applied Learning (VCAL): 609
McAuley Champagnat Programme (MCP): 54
Berry Street: 63
Big Picture: 30
Greater Shepparton trend
From 2011 to 2012 ACE (+32); TAFE/ASHE (+5); VET/VCAL (+85)
State trend
N/A
Source: GMLLEN, 2013
Along with many key partners in Greater Shepparton, this initiative, facilitated by GMLLEN, focuses on increasing the profile of and developing stronger links with schools to showcase the opportunities and pathways available in the Agriculture and Horticulture sector.
The four key initiatives the partnership has been involved in driving throughout 2013 is a ‘hands on’ Agriculture and Horticulture workshop event at Dookie in which more than 100 students from across the region participated. An equine industry event was also organised in which 20 students representing different schools across the region participated. This event showcased breeding and performance, equine nursing and racing. Professional development opportunities were offered for teachers and staff interested in experiencing a day working in the Agriculture and Horticulture sector. The partners also planned an Agriculture and Horticulture Teachers Forum, led by Charles Sturt University, which provided teachers with up-to-date information on Agriculture and Horticulture, and aimed to inspire, motivate and support teachers and lay the foundations for an ongoing network.
The Agriculture and Horticulture Teachers Forum featured presenters and topics covering: The future − Bringing 21st Century Agriculture and Horticulture into the classroom, schools and what they are already doing − exemplars, jobs and careers − career trends, opportunities and challenges and research − applications of microwave technologies in Ag/Forestry and Investigating the effect of different pasture types on animal health.
"While adolescents may observe their parents more critically than they did when they were younger, they still absorb their parents’ attitudes and note their parents’ actions. So in addition to being actively involved in their child’s academic lives, by helping to guide their decisions about their education, monitoring their school work and engaging with them intellectually, parents can also be implicitly involved by acting as role models." (OECD, 2012)
parents read I ng to ch I ldren at home
Children are regularly read to/encouraged in their reading at home
Greater Shepparton trend
N/A
State trend
N/A
Source: AEDI, 2012 (reported by teachers)
The Greater Shepparton Book Bag program has been running since 2004. It distributes over 2700 bags every year to families with children attending their 4 week, 8 months, 18 months and 3 ½ year Maternal and Child Health key age and stage checks. Book bags are also distributed through other family support services to reach the more vulnerable families who may not be able to access the Maternal and Child Health Service.
The bags include an age appropriate story book, nursery rhyme and activity sheets, parent information booklet and library membership and services information. In 2012, a small sample of parents (51) were surveyed, of which 69% found the book bags ‘very useful’, and 57% indicated they started reading to their child for the first time after receiving the book bag.
The Story a Day program was first piloted in 2004 and now runs in 15 kindergardens across Greater Shepparton. It aims to establish a partnership for early learning and reading between the kindergarten and home. Feedback collected at the end of each year from parents indicates they believe the program improves their child’s interest in books, their understanding of how a book works and increases the time spent reading stories at home together.
Participant quotes:
"All the children love it, it really does encourage reading and the enjoyment of books. I even had my 3 year old repeating stories."
"Not all children get to read at home, so the Story a Day program would encourage that process."
parents part I c I pat I ng I n pr I mary schools
Children whose parent(s)/caregiver(s) are actively engaged with the school in supporting their child’s learning
Greater Shepparton trend
N/A
State trend
N/A
Source: AEDI, 2012 (reported by teachers)
c h I ldren and young people haV e access to I nternet at home
Children in households with internet/home internet access
Greater Shepparton trend
Increased 2007 to 2011 (+7.8%)
State trend
Increased 2007 to 2011 (+7.5%)
Source: Community Indicators Victoria, 2011, in GV Primary Care Partnership, 2013
The Smith Family student2student program
The student2student program works by matching students who need to improve their reading with peer buddies who help and encourage them with their reading. Peer support is central to the success of the program. Student2student involves three groups of participants:
• Students in Years 3 to 8 assessed as being up to two years behind in their reading development and want additional support to improve their reading.
• Reading buddies with good literacy skills who are at least two years older than the student. The buddies are trained by The Smith Family to help their students develop reading confidence and skills, using the ‘Pause, Prompt, Praise’ reading support method.
• Volunteer Supervisors who provide support for up to 10 reading buddies, helping them with problems and ensuring that they are supporting the students effectively.
Each student and buddy receives an identical book pack from The Smith Family. The reading buddy then telephones the student two to three times a week for at least 20 minutes, over an 18 week period. The student reads to the buddy, who uses the skills learnt in their training to assist the student with their reading and offer encouragement and praise. The buddy keeps a simple record of each phone call and reports progress to a Volunteer Supervisor fortnightly.
In 2013, a detailed analysis of data showed that 93% of participating students improved their reading age; 83% of students agreed they read more; 81% students agreed the program helped them feel more confident with school work; 92% of parents reported children felt better about themselves.
(cited from http://www.thesmithfamily.com.au/what-we-do/our-work/at-school/early-years-and-primary/student2student)
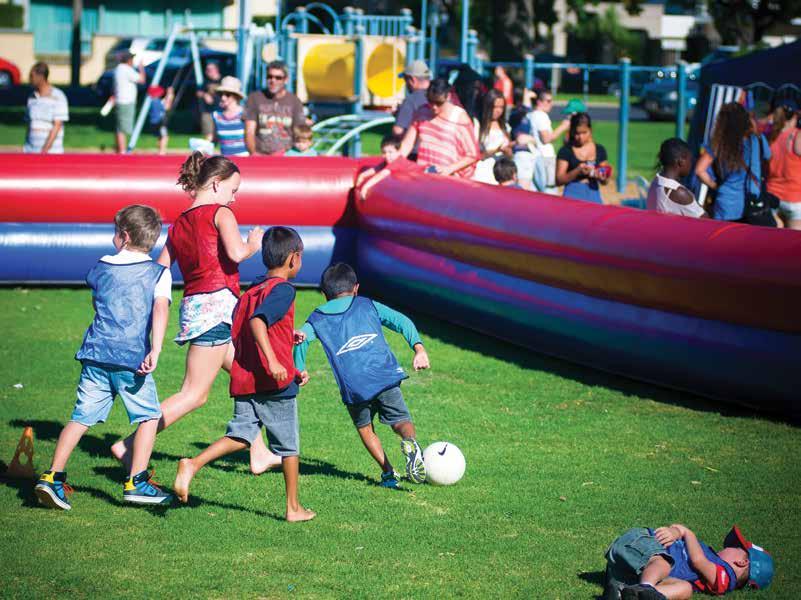
This domain refers to the promotion of an environment where children feel safe and secure, free from violence and other physical hazards.
r eported fam I ly VI olence I nc I dents
Proportion of family violence incidents where children and young people are involved as other parties
Greater Shepparton trend
Decreased 2010-11 to 2011-12 (-3.7%)
State trend
Stable 2010-11 to 2011-12 (+0.8%)
Source: VCAMS Portal, DEECD
c h I ld protect I on reports
Children on child protection orders per 1000 children aged 0-17 years
Greater Shepparton trend
N/A
State trend
N/A
Source: VCAMS Portal, DEECD
c h I ld protect I on reports (ages 0-8)
Number and rate of child protection re-reports within a year
Greater Shepparton trend
Decreased 2007-08 to 2008-09 (-1.7%)
State trend
Stable 2007-08 to 2008-09 (-0.4%)
Source: Early Childhood Community Profile, City of Greater Shepparton, DEECD, 2010
c h I ld protect I on substant I at I ons
Number of investigations of child abuse notifications for children aged 0-17 that were substantiated
Greater Shepparton trend
Decreased 2009-10 to 2010-11 (-2.1)
State trend
Stable 2009-10 to 2010-11 (+0.9)
Source: VCAMS Portal, DEECD
The FIRST in ChildFIRST stands for Child and Family Information Referral and Support Team. This is the 'one stop shop' for parents and professionals to gain information about family and children’s services. FamilyCare actively support families to access such services.
Supplementary Data:
In 2012-2013, in Greater Shepparton, FamilyCare reached 851 families experiencing violence incidents where children and young people were involved as other parties (compared to 9,709 families in Victoria).
Source: Family Care, internal data for July 2012-June 2013; Victoria’s vulnerable children – our shared responsibility. Baseline performance data report 2013
n umbers of young people I n out of h ome c are
Children in out of home care aged 0-17 years (per 1,000 children)
Greater Shepparton trend
Stable 2011 to 2012 (+0.7)
State trend
Stable 2011 to 2012 (+0.4)
Source: VCAMS Portal, DEECD
Proportion of Aboriginal children in out-of-home care who are placed in accordance with The Aboriginal Child Placement Principle
Greater Shepparton trend
Decreased 2011 to 2012 (-12.2%)
State trend
Decreased 2011 to 2012 (-1.3%)
Source: VCAMS Portal, DEECD
a cc I dent and I njury data (g V h ealth)
hosp I tal separat I ons
Rate of hospital separations, all principal diagnosis, per 1,000 children (0-8yrs)
Greater Shepparton trend
Decreased 2007-08 to 2008-09 (average 1.0% per year)
State trend
Increased 2007-08 to 2008-09 (average 2.1 per year)
Source: Early Childhood Community Profile, City of Greater Shepparton, DEECD, 2010
Top three causes for hospital separations per 1000 children (0-8 years)
Victoria
1. Asthma unspecified: 7.9
2. Other pre-term infant: 7.7
3. Dental caries unspecified: 6.3
Greater Shepparton
1. Routine and ritual circumcision: 12.8
2. Asthma unspecified: 9.3
3. Other pre-term infant: 7.8
The Bridge Youth Service in Greater Shepparton is a local organisation that works specifically with young people aged 12-25 and their families. The Bridge values the support of its local communities and works closely with other organisations to ensure the best outcomes for young people. In a typical year and throughout the Local Government Areas (LGAs) of Moira, Strathbogie, Shepparton, Mitchell and Murrindindi, the organisation would see between 1,000 and 1,500 young people who benefit directly from specific and structured support, participation in group work programs, involvement in mentoring programs and youth events.
Youth data is locally collected by different organisations like The Bridge, based on the use of services or on different surveys conducted independently by each organisation. However, more publicly available data is needed at a more global level to get a better picture of the situation of youth security and safety in the area.

p ol I ce reports of young assault VI ct I ms (aged 0-17)
Crimes where the victim was a child or young person aged 0-17 (per 1,000)
Greater Shepparton trend
Increased 2010-11to 2011-12 (+1.9)
State trend
Stable 2010-11to 2011-12 (+0.8)
Source: VCAMS Portal, DEECD
Crimes where the offender was a child or young person aged 0-17 (per 1,000)
Greater Shepparton trend
Stable 2010-11 to 2011-12 (-0.3)
State trend
Decreased 2010-11 to 2011-12 (-1.5)
Source: VCAMS Portal, DEECD
Number of young people aged 12-18 years convicted and placed on a community order (rate per 100,000)
Greater Shepparton trend
Decreased 2011-12 to 2012-13 (-2.3)
State trend
Stable 2011-12 to 2012-13 (-0.4)
Source: VCAMS Portal, DEECD
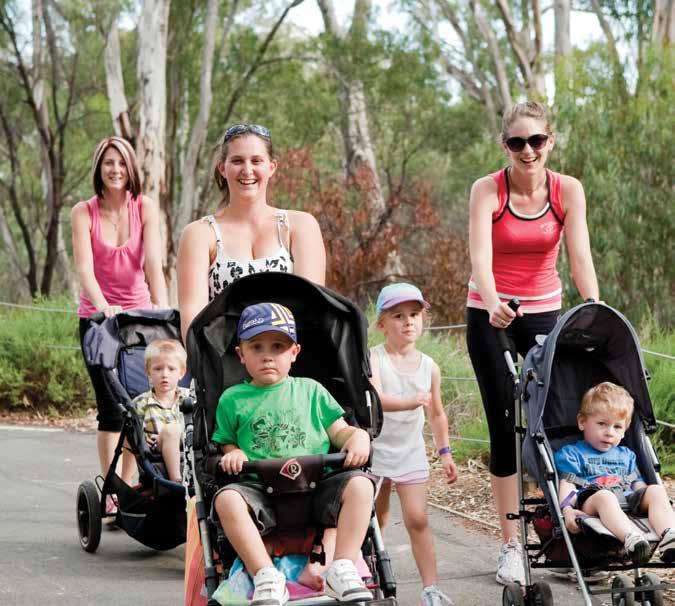
This domain refers to the wellbeing of children and their families, to their access to resources within a financially secure environment. It also refers to the capacity of our municipality to build community connections and provide information and support to parents.
s upported by pos I t IV e relat I onsh I ps
Proportion of children at school entry whose parents report high levels of family stress in the past month
Greater Shepparton trend
Decreased 2011 to 2012 (-2.3%)
State trend
Stable 2011 to 2012 (+0.6%)
Source: VCAMS Portal, DEECD
parents not soc I ally I solated
Number of families accessing Family and Community Support Services
Greater Shepparton trend
Increased 2011/12 to 2012/13 (+49)
State trend
Increased 2011/12 to 2012/13 (+1,077)
Source: VCAMS Portal, DEECD
"Children and youth who have material basics are those having access to the things they need to live a ‘normal life’. They live in adequate and stable housing, with adequate clothing, healthy food, clean water and the materials they need to participate in education and training pathways." (Australian Research Alliance for Children and Youth (ARACY), 2013)
gp fam I ly check-up rates
General Practitioner Availability
Estimated number of GPs: population 2010 ratio
Greater Shepparton trend
N/A
State trend
N/A
GV Primary Care Partenership, 2013
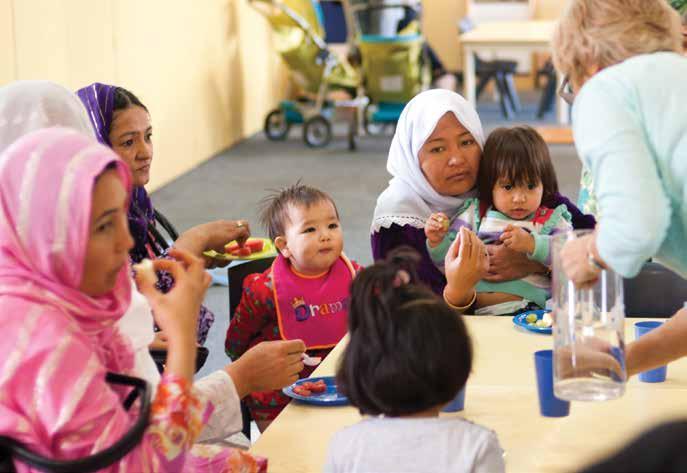
aVa I lab I l I ty of hous I ng and transport
Transport limitations – Limitations and restrictions perceived in day to day travel
Greater Shepparton trend
Increased 2007 to 2011 (+8.2%)
State trend
Increased 2007 to 2011 (+3.4%)
Source: Community Indicators Victoria, 2013
% population near public transport
Greater Shepparton trend
N/A
State trend
N/A
Source: Department of Health, Hume region, 2013
Transport – Households with no vehicle
Greater Shepparton trend
N/A
State trend
N/A
Source: Department of Health, Hume region, 2013
Lack of transport and transport affordability is a major barrier to service access for some families. This is particularly problematic in outlying towns such as Tatura and Murchison.
f ood secur I ty
Persons who ran out of food in the previous 12 months and couldn’t afford to buy anymore
Greater Shepparton trend
N/A
State trend
N/A
Source: Department of Health, 2008
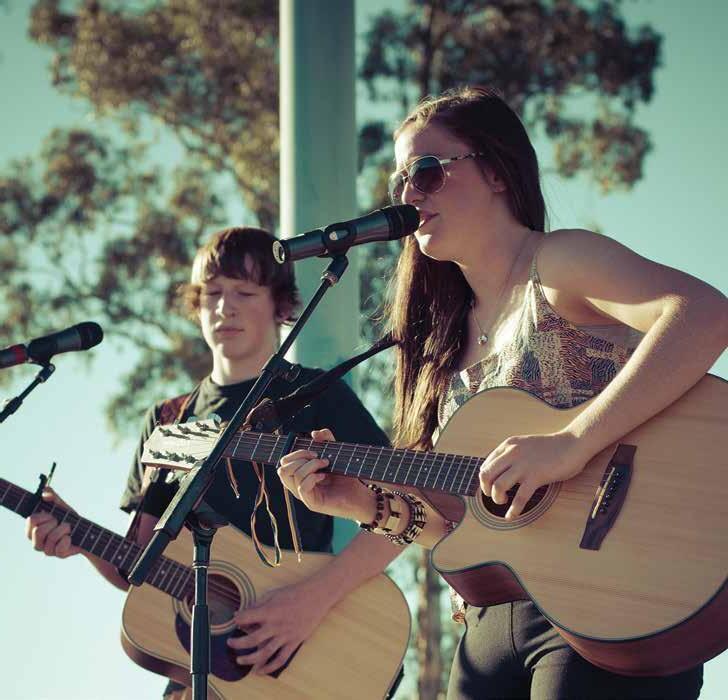
This domain refers to the inclusion and active participation of families, including Indigenous, culturally and linguistically diverse, recently arrived, socio-economically disadvantaged families and those affected by disability.
"By promoting tolerance, education also builds values, attitudes, norms and beliefs that improve interpersonal trust and increase civic engagement, which are pillars of democracy." (UNESCO, 2012).
o pportun I t I es to play
The area has easy access to recreational & leisure facilities
Greater Shepparton trend
N/A
State trend
N/A
Source: Indicators of community strength (2008)
u sage of open commun I ty spaces
Area has good facilities and services (shops, childcare, schools and libraries)
Greater Shepparton trend
N/A
State trend
N/A
Source: Indicators of community strength (2008)
a ccess to art, cultural e V ents & act IVI t I es
Participation in arts and cultural activities
Greater Shepparton trend
N/A
State trend
N/A
Source: Indicators of community strength (2008)
Supplementary Data:
Greater Shepparton library membership and participation (2013)
Ages 0-5: 811
Ages 6-12: 1,841
Ages 13-18: 1,814
Source:Goulburn Valley Regional Library, Internal data, 2014.
young people feel they haV e a say I n the I r commun I ty
Participation in citizen engagement
Greater Shepparton trend
N/A
State trend
N/A
Respondents were asked if they had attended a town meeting or public hearing, met, called or written to a local politician, joined a protest or signed a petition in the previous 12 months.
Source: Indicators of community strength (2011)
As part of the Goulburn Murray Local Learning & Employment Network (GMLLEN) role of working with culturally and linguistically diverse communities, the Building la Nouvelle Generation Program - meaning Building a New Generation, is a leadership program that was created to help young people from diverse backgrounds have a smooth transition into community life. The program was an idea that formed after members of the local African community approached the GMLLEN, wanting to devise a program that would help their young people fit into community life, as well as enabling them to embrace their African heritage. The program is made up of a range of workshops that are hosted by local agencies and individuals.
Participants quote:
“[…] This program has been a great journey for me. Through this program I have met many leaders of our community […]. To be able to meet them in real life and knowing about the things they have done to become a leader is just amazing. I have learnt so much from them and now I feel that I am confident enough to apply that knowledge in my life to make our community better. […] Furthermore, this program has given me the opportunity to mix with other participants from different backgrounds and has made me strong enough to get involved in the community and share my views and ideas with others.”
This section not only presents the data gaps, but also stresses the importance of considering different ways and collaborative approaches to gain more local ownership of data that is systematically collected for government funded programs and service development initiatives. Data collection and data use need to be empowering to the communities to whom it relates. We need to consider how we collect and present data, being cognisant of historical and cultural factors that make information/data collection a process that must be sensitive and respectful.
Indigenous local data
Source: DEECD
Antenatal Care: Women access antenatal care during their pregnancy
Source: Victorian Perinatal Data Collection, Department of Health
Maternal use of nicotine in pregnancy
Source: DEECD, 2010
Maternal use of alcohol in pregnancy
Source: DEECD, 2010 Victoria
Maternal use of other drugs in pregnancy
Oral health status: Proportion of children brushing their teeth twice a day
Source: DEECD, 2010
Children aged 6 months-12 years who had ever had a filling
Source: DEECD, 2010
Sport and Leisure/physical activity: Children doing adequate amount of exercise and physical activity
Source: DEECD, 2010
Regular access to healthy food: Proportion of children 4-12 years reporting to eat at least the minimum recommended serves of fruit and vegetables
Victoria
Source: DEECD, 2010 Victoria
Number of young people with STIs: Safe sex- young people (10-17) practicing safe sex by using a condom
Source: DoH, Hume region, 2013 Victoria 58.1%
Drug and Alcohol use rates: Proportion of adolescents who have drunk alcohol in the last 30 days
Source: DEECD, 2010 Victoria 23.8% (12-14) 52.3% (15-17)
Drug and Alcohol use rates: Proportion of adolescents who have smoked cigarettes in the last 30 days
Source: DEECD, 2010
Drug and Alcohol use rates: Proportion of adolescents (12-14) who have ever used drugs (marijuana, glue or chromed, other illegal drugs)
Source: DEECD, 2010
Drug and Alcohol use rates: Proportion of adolescents (15-17) who have ever used drugs (marijuana, glue or chromed, other illegal drugs).
Source: DEECD, 2010
Mental health: Proportion of adolescents with the highest level of psychological distress.
Victoria 5.6% (12-14) 17.7% (15-17
Victoria 3.7% (mari) 7.9% (glue) 1.0% (other)
Victoria 16.0% (mari) 7.0% (glue) 4.7% (other)
Source: DEECD, 2010 Victoria 13.0%
3. CHILDREN WITH SPECIAL NEEDS ARE WELL SUPPORTED
Number of children referred to ECIS (Early Childhood Intervention Services)
Number of children and adolescents with disability or developmental delay: Children diagnosed/identified with a developmental delay prior to year 1
LEARNING EARLY AND SCHooL SUCCESS
4. CHILDREN ARE INVOLVED IN EARLY LEARNING AND PLAYGROUP ACTIVITIES
Kindergarten attendance at age 3
Participation of Aboriginal children in 3 year-old kindergarten
Source: Victoria’s vulnerable children – our shared responsibility. Baseline performance data report 2013
5. CHILDREN AND YOUNG PEOPLE ARE ACHIEVING AT SCHOOL
NAPLAN: Children meeting national standards in writing (Year 3-5-7-9)
Source: DEECD
NAPLAN: Indigenous local data
Source: DEECD
NAPLAN: LBOTE local data
Source: DEECD
(of estimated population Aboriginal young children)
6. YOUNG PEOPLE ARE ENGAGED IN LEARNING OR EARNING (GOVERNMENT SCHOOLS DATA ONLY)
School attendance data: Average absence days from school in 2012
Source: Victoria’s vulnerable children – our shared responsibility. Baseline performance data report 2013
School attendance data: School completion rates for CALD students
Suspension data
Expulsion data
Source: DEECD, internal data 2013
Victoria
Year 5: 14.4
Year 7: 15.4
Year 9: 21.0
Students apparent retention rate Year 10 - 12
Source: VCAMS Portal, DEECD
ATSI students apparent retention Year 10 - 12
Source: VCAMS Portal, DEECD
School leaving data: Learning or earning at age 15
School leaving data: Numbers of pregnant or young mothers attending school
School leaving data: Number of children being home schooled
p hys I cal act IVI ty and healthy l I festyle
Physical activity levels % sedentary
Greater Shepparton trend
Increased 2008 to 2011-2012 (+1.5%)
State trend
Stable 2008 to 2011-2012 (+0.2%)
Physical activity levels % insufficient time and/or sessions
Greater Shepparton trend
Increased 2008 to 2011-2012 (+8.7%)
State trend
Stable between 2008 and 2011-2012 (-0.8%)
Physical activity levels % sufficient time and sessions
Greater Shepparton trend
Decreased 2008 to 2011-2012 (-3.8%)
State trend
Increased 2008 to 2011-2012 (+3.6%)
Source: Victorian Population Health Survey Department of Health, 2011-2012
The 2012 AEDI data shows deterioration over the last three years in the capacity of Greater Shepparton's children to be physically ready for the school day and notably, to be on track with gross and fine motor skills.
In Victoria, data about children and young people`s physical activity and about many aspects of their healthy life style is not collected at a local government level.
o V er W e I ght or obese
Prevalence of overweight and obesity
Greater Shepparton trend
Decreased 2011-2012 to 2013 (-5.4%)
State trend
Decreased 2008 to 2011-2012 (-1.2%)
Source: Shepparton Population Health Profile, Department of Health, 2013
r egular access to healthy food
Compliance with fruit and vegetables guidelines
(% whole population who do not meet dietary guidelines)
Greater Shepparton trend
Stable 2012 to 2013 (0.0%)
State trend
N/A (different data sources)
Source: Shepparton Population Health Profile, Department of Health, 2013
s u I c I de rates and attempts
Avoidable Mortality Suicide per 100,000
Greater Shepparton trend
Increased 2012 to 2013 (+0.12%)
State trend
Increased 2012 to 2013 (+0.09%)
f eel I ng of safety WI th I n commun I ty
People who feel safe or very safe when walking alone in local area during the day
Greater Shepparton trend
Increased 2007 to 2011 (+3.9%)
State trend
Increased 2007 to 2011 (+1.0%)
Source: Community Indicators Victoria, 2011
People who feel safe or very safe when walking alone in local area at night
Greater Shepparton trend
Decreased 2007 to 2011 (-6.1%)
State trend
Increased 2007 to 2011 (+3.8%)
Source: Community Indicators Victoria, 2011
The content of this report needs careful consideration by those who are familiar with the data, and discussion with those who can influence how it is used pro-actively to build a stronger, healthier future for children and young people in Greater Shepparton.
Best Start, Communities for Children and the Lighthouse Project embrace the opportunity to work with families, community organisations and government to build on the strengths and respond to the challenges that this data illuminates.
1. Disseminate and Discuss
• Distribute widely.
• Hold a workshop for those interested in gaining a deeper understanding of the data and its implications.
• Present at key stakeholder meetings.
• Media publicity (please refer to acknowlegements to see where this report is available).
2. Utilise
• Consider data items with a view to extending the understanding through further data comparison and use of local service/community data.
• Think critically about what the data is saying.
• Consider data items in conjunction with other relevant local data.
3. Strategise
• Inform strategic planning for Communities for Children, the Greater Shepparton Lighthouse Project and Best Start Early Years Plan and other local planning.
4. Consolidate
• Develop a second plan in 3 years’ time.
AEDI (2009, 2012). Australian Early Development Index. http://www.rch.org.au/aedi/
ARACY (2013). The Nest action agenda. Improving the wellbeing of Australia’s children and youth while growing our GDP by over 7%. http://www.aracy.org.au/documents/ item/162
Australian Bureau of Statistics (2006; 2011). www.abs.gov. au/
Bammer, G., Michaux, A. & Sanson, A. (2010). Bridging the 'Know-Do' Gap: Knowledge Brokering to Improve Child Wellbeing. ANU E-Press, Canberra, 163pp.
Bolkas, A. (2013). Region ranks among highest for child immunisation rates. http://www.mmg.com.au/localnews/shepparton/region-ranks-among-highest-for-childimmunisation-rates-1.47389
Community Indicators Victoria (2012). http://www. communityindicators.net.au/
DEECD (2010). Adolescent Community Profile, City of Greater Shepparton. http://www.education.vic.gov.au/ Documents/about/research/acpgreatershepparton.pdf
DEECD (2010). Early Childhood Community Profile, City of Greater Shepparton. http://www.education.vic.gov.au/ Documents/about/research/ecprofgreatsheppar.pdf
DEECD (2013). Engaging Children in Decision Making. A guide for consulting children. http://www.maribyrnong.vic. gov.au/Files/Engaging_Children_In_Decision_Making_2013. pdf
DEECD. http://www.education.vic.gov.au/about/research/ Pages//011birthweight.aspx
DEECD (2013). Internal data.
DEECD. VCAMS Portal. http://www.education.vic.gov.au/ about/research/Pages/vcamstableau.aspx
Department of Health (2013). Shepparton Population Health Profile. www.greatershepparton.com.au
Department of Health. Victorian Perinatal Data Collection. http://www.health.vic.gov.au/ccopmm/vpdc/
Department of Health (2011-2012). Victorian Population Health Survey. http://www.health.vic.gov.au/healthstatus/ survey/vphs.htm
DHS (2013). Victoria’s vulnerable children – our shared responsibility. Baseline performance data report. http:// www.dhs.vic.gov.au/about-the-department/documentsand-resources/reports-publications/victorias-vulnerablechildren-our-shared-responsibility
DTPLI (2013). Indicators of community strength. http://www.dpcd.vic.gov.au/__data/assets/pdf_ file/0007/58795/641ICS-2008_Greater_Shepparton_pdf.pdf
Family Care (July 2012-June 2013), internal data.
Fletcher, A. (2005). Meaningful Student Involvement: Guide to Students as Partners in School Change, created for SoundOut.org in partnership with HumanLinks Foundation. http://www.soundout.org/MSIGuide.pdf
GMLLEN (2014). Goulburn Murray Local Learning Employment Network. Environmental scan, internal document.
GMLLEN (2014). http://www.gmllen.com.au/
Goulburn Valley Primary Care Partnership (2011, 2013). Goulburn Valley Health and Wellbeing Community Profile. http://gvpcp.org.au/download/health_planning/2013Community-Profile-GVPCP.pdf
Greater Shepparton City Council (2011/12; 2012/13). MCH Annual Report.
Greater Shepparton City Council (2012). Health and Wellbeing Planning Guide and Status Report. http://www.greatershepparton.com.au/download. asp?RelatedLinkID=7059
Hattie, J. (2009). Visible Learning: A Synthesis of Over 800 Meta-Analyses Relating to Achievement. Routledge Taylor & Francis Group.
Headspace, 2009. The National Conversation - a National Strategy for Young Australians. http://www.headspace.org. au/about-headspace/what-we-do/publications-and-research
Milburn, C. (2010). ‘Preschool Key to Happier Futures’, The Age, Melbourne, 8 November, 2010.
Mourshed, M. Farrell, D. & Barton, D. (2012). Education to Employment: Designing a System that Works, Washington,DC: McKinsey Center for Government. http:// www.mckinsey.com/insights/social_sector/education_to_ employment_designing_a_system_that_works.
Muir, K., Powell, A., Patulny, R., Flaxman, S., McDermott, S., Oprea, I., Gendera, S., Vespignani, J., Sitek, T., Abello, D., Katz, I. (2009) Independent Evaluation of headspace: the National Youth Mental Health Foundation. Available from: Social Policy Research Centre, University of New South Wales
Mustard, F. (2011), in McCain, M.N., Mustard, F. & al. Early Years Study 3. http://earlyyearsstudy.ca/en/
National Institute of Economic and Industry Research (NIEIR, 2013). nieir.com.au
National Welfare Rights Network (2014). www.welfarerights.org.au
Notre Dame College. http://www.notredame.vic.edu.au/
OECD (2012). PISA - Let's Read Them a Story! The Parent Factor in Education. http://www.oecd.org/edu/school/ programmeforinternationalstudentassessmentpisa/pisa-letsre adthemastorytheparentfactorineducation.htm
OECD (2013). Education at a glance 2013. OECD Indicators. http://www.oecd.org/edu/eag2013%20(eng)--FINAL%20 20%20June%202013.pdf
Onemda (2008). Designing a Victorian Aboriginal Child Health, Development and Wellbeing Survey. Report and recommendations, July 2008.
Profile id. (2013). profile.id.com.au/shepparton/home
SEHQ (2008). School Entrant Health Questionnaire. Outcomes for Victorian children at school entry. http://www. education.vic.gov.au/about/research/pages/reportdatahealth. aspx
The Sir Andrew and Lady Fairley Foundation. http://www. fairleyfoundation.org/index.html
The Smith Family. www.thesmithfamily.com.au
The State of Bendigo Children report (2011). http://www. childfriendlycity.com.au/File.axd?id=a933f130-0c16-47d0a473-2062dff69400
UNESCO (2012). Education for All. Global Monitoring Report Youth and Skills: Putting Education to Work. http:// www.un-ngls.org/spip.php?article4132
Department of Education and Early Childhood Development
Balert Boorron: The Victorian Plan for Aboriginal Children and Young People (2010-2020)
https://www.eduweb.vic.gov.au/edulibrary/public/govrel/ Policy/thecharter/balertboorron.pdf
Department of Education and Early Childhood Development
The State of Victoria`s Children Report 2011 http://www.education.vic.gov.au/Documents/about/ research/sovc2011.pdf
Department of Education and Early Childhood Development
VCAMS Portal
http://www.education.vic.gov.au/about/research/Pages/ vcamstableau.aspx
Department of Human Services
Victoria’s Vulnerable Children – Our Shared Responsibility.
Baseline Performance Data Report 2013
http://www.dhs.vic.gov.au/about-the-department/plans,programs-and-projects/plans-and-strategies/victoriasvulnerable-children-strategy-2013
Goulburn Valley Industry and Employment Taskforce
Goulburn Valley Industry and Employment Plan – February 2014
http://www.rdv.vic.gov.au/__data/assets/pdf_ file/0013/210712/Goulbourn-Valley-Industry-andEmployment-Plan-2014.PDF
Goulburn Valley Primary Care Partnership
Goulburn Valley Health and Wellbeing Community Profiles
http://gvpcp.org.au/download/health_planning/2013Community-Profile-GVPCP.pdf
Profile .id
Community profile- City of Greater Shepparton http://profile.id.com.au/shepparton/home
The Sir Andrew and Lady Fairley Foundation
Shepparton Philanthropic Forums 2011 and 2014 Reports www.fairleyfoundation.org
Maternal health and early childhood development
Key strategies and actions in place:
• Dardee Boorai: Victorian Charter of Safety and Wellbeing for Aboriginal Children and Young People
• The Aboriginal Services Plan 2008–10
• Victorian Indigenous Childhood Health and Wellbeing Survey
• Aboriginal Best Start
• Indigenous Kindergarten Program (free for 3 and 4-yearolds)
• Parenting: In-Home Support Program and Home Based Learning Program
• Expanded and more Koorie Maternity Services
Key strategies and actions in place:
• Dardee Boorai: Victorian Charter of Safety and Wellbeing for Aboriginal Children and Young People
• Wannik Education Strategy
• Yalca: A Partnership in Education and Training for the New Millennium
Key strategies and actions in place:
• Wannik: Education Strategy
• Wurreker The Koorie Community and TAFE in Victoria in Equal Partnership
• Yalca A Partnership in Education and Training for the New Millennium
Aboriginal economic development and employment
Key strategies and actions in place:
• Youth transitions –clear pathways from school to work and further study
• Improved transitions from further education and training into employment
• Karreeta Yirramboi
• Victorian Aboriginal Public Sector Employment and Career Development Action Plan (2010–2015)
• Moonda Wurrin Gree Pathways to a Better Future: The report of the Victorian Aboriginal Economic Development Group
a ppend I x 2:
(Adapted from the State of Bendigo's Children Report, 2011)
Note: Datasets in italics are not currently documented in the report.
Quality organisations, services, programs
• Early years provision
• Family support and counselling services
Capacity
• Information and data
• Evidence base about what works
• Research
Quality infrastructure
• Playgrounds and recreation spaces
• Libraries
• Schools
• Internet access
• Transport
Providing a positive lifestyle
l Physical activity levels: DATA GAP
l Regular access to healthy food below the state average.
l Numbers of young people with STI’s above the state average.
l Drug, alcohol, nicotine use rates (adolescents): DATA GAP
l Teenage births above the state average.
l Families accessing Family and Community Support Services: Availability of housing and transport below the state average.
l Persons who ran out of food in the previous 12 months and couldn’t afford to buy anymore above the state average.
Supported by child expertise
l MCH 4 months below the state average
l MCH 3.5 years above the state average
l Access to bulk billing services: DATA GAP
Happy & Healthy
l Maternal use of substances in pregnancy: DATA GAP.
l Low birth weight: Shepparton is ranked 8/79 LGAs for low birth weight babies.
l Breastfeeding rates increased 2011/12 - 2012/13.
l Immunisation rates over 90% in 2012-13.
l Dental health: DATA GAP
l Mental health (children): Proportion of children with emotional or behavior difficulties or being bullied above the state average.
l Proportion of children with high levels of family stress below the state average.
l Proportion of children at school entry with emotional or behavioural difficulties and whose parents report concerns with their behaviour above the state average.
l Adolescents rate of intentional self-harm above the state average.
l Adolescents rate of psychiatric hospitalisation below the state average.
l Overweight or obese: DATA GAP
l Number of people with a profound or severe disability above the state average.
l Rate of hospital separations above the state average.
Engaged, learning and earning
l NAPLAN: Children meeting national standards in literacy (reading) and numeracy below the state average.
l Connectedness to school: Above the state average Years 5-6
l Connectedness to school: Below the state average Years 7-9
l Proportion of young people aged 19 years who have attained Year 12 or equivalent below the state average.
l Suspension and expulsion: DATA GAP
l % 15-19 year old school leavers above the state average.
Well developed by their first year of school (AEDI)
l 11.6% developmentally vulnerable on two or more of the following domains (Victoria: 9.5%):
l Physical health & wellbeing: Children developmentally at risk (13.4%) or vulnerable (9.5%) have not developed one of the three skills (independence, handedness, coordination).
l Social competence & wellbeing: Children developmentally at risk (16.5%) or vulnerable (11.4%) Have average to poor overall social skills, low self-confidence and are rarely able to play with various children and interact cooperatively.
l Emotional maturity: Children developmentally at risk (16.0%) or vulnerable (8.0%) never or almost never show most of the helping behaviours including helping someone hurt, sick or upset, offering to help spontaneously, and inviting others to join in.
l Language & cognitive skills: Children developmentally at risk (14.0%) or vulnerable (9.9%) do not have most of the basic literacy skills.
l Communication skills and general knowledge:Children developmentally at risk (16.1%) or vulnerable (9.0%) range from being average to very poor in effective communication.
Safe and secure
l Child protection reports and substantiations above the state average.
l Numbers of young people in out of Home Care above the state average.
l Adolescents are securely housed: DATA GAP
l Police reports of young assault victims above the state average.
Active citizens
l Participation in arts and cultural activities below the state average.
l Participation in citizen engagement above the state average.
Creating a positive learning environment
l Kindergarten attendance at age 4 below the state average.
l Access to parent early education programs (rate over 90% in 2012).
l Parents reading to children at home and participating in schools below the state average.
l Children whose parents actively engage in supporting child learning below the state average.
l Internet access at home below the state average.
Safe
l Proportion of children at school entry whose parents report high levels of family stress in the past month below the state average.
Modelling good citizenship
l The area has easy access to recreational & leisure facilities as well as good facilities and services like shops, childcare, schools and libraries: below the state average.
Broad networks
• Opportunities to participate (e.g. clubs interests)
Well planned, safe environments
l Crime rate: People who feel safe or very safe when walking alone in local area during the day above the state average.
l People who feel safe or very safe when walking alone in local area at night below the state average.
Community, government and business working together
• Partnerships undertaking strategic planning
• Joint use/integrated service delivery
e xpend I ture on early ch I ldhood educat I onal I nst I tut I ons, as a percentage of gdp (2010) In oecd, 2013
e mployment status
Source: Profile.id (2013), Regional Victoria data
Employed Labour Force
Greater Shepparton Trend
Stable between 2006 and 2011 (+0.5%)
Unemployed Labour Force
Greater Shepparton Trend
Stable between 2006 and 2011 (-0.5%)
Private expenditure on educational institutions as a percentage of GDP
Public expenditure on educational institutions as a percentage of GDP
Regional Victoria Trend Stable between 2006 and 2011 (+0.5%)
Source: Profile.id (2013), Regional Victoria data
Health Care and Social Assistance
Greater Shepparton Trend
Increased between 2006 and 2011 (+2.2%)
Retail Trade
Greater Shepparton Trend
Stable between 2006 and 2011 (-0.5%)
Manufacturing
Greater Shepparton Trend
Stable between 2006 and 2011 (-1.0%)
Agriculture, Forestry and Fishing
Greater Shepparton Trend
Decreased between 2006 and 2011 (-1.8%)
Income
Regional Victoria Trend
Increased between 2006 and 2011 (+1.6%)
Regional Victoria Trend
Stable between 2006 and 2011 (-0.7%)
Regional Victoria Trend
Decreased between 2006 and 2011 (-1.4%)
Regional Victoria Trend
Decreased between 2006 and 2011 (-1.7%)
Household income quartiles (Equivalised data) Lowest income group
Greater Shepparton Trend
Increased between 2006 and 2011 (+1.8%)
Source: Profile.id (2013), Regional Victoria data
Regional Victoria Trend Stable between 2006 and 2011 (+0.5%)
Individual income quartiles − Medium lowest income group
Greater Shepparton Trend
Increased between 2006 and 2011 (+1.1%)
Source: Profile.id (2013), Regional Victoria data
Regional Victoria Trend
Stable between 2006 and 2011 (+0.9%)
People in poverty, housing stress households − 2011 rental stress
Trends
N/A
Source: Department of health (2012)
People in poverty, housing stress households − 2011 rental stress
Trends
N/A
Source: Department of health (2012)
Income management data (natIonal Welfare rIghts netWork 2014)
Greater Shepparton
Voluntary Income Management: 201 Involuntary Income Management: 143
Source : National Welfare Rights Network, State of Play: Income Management in 2014
Developmentally ‘on track’
The cut-off for an AEDI score to represent on track uses the baseline cut-offs from the 2009 AEDI data collection. In 2009 children who scored above the 25th percentile (in the top 75 per cent) of the national population were classified as on track.
If more children are doing better nationally in 2012 than in 2009, then more than 75 per cent of children will be on track in 2012.
Developmentally ‘vulnerable’
The cut-off for an AEDI score to represent vulnerable uses the baseline cut-offs from the 2009 AEDI data collection. In 2009 children who scored below the 10th percentile (in the lowest 10 per cent) of the national population were classified as vulnerable.
If more children are doing better nationally in 2012 than in 2009, then fewer than 10 per cent of children will be vulnerable in 2012.
Developmentally ‘at risk’
The cut-off for an AEDI score to represent at risk uses the baseline cut-offs from the 2009 AEDI data collection. In 2009 children who scored between the 10th and the 25th percentile of the national population were classified as at risk.
Developmentally vulnerable on one or more domain/s
The percentage of children in the community who have at least one or more AEDI domain score/s below the 10th percentile.
Developmentally vulnerable on two or more domains
The percentage of children in the community who have at least two or more AEDI domain scores below the 10th percentile.
Separation from a healthcare facility occurs anytime a patient (or resident) leaves because of death, discharge, sign-out against medical advice or transfer.
"CHildHood makES uS Human. [...] ouT of CHildrEarinG, ComE THE Human CapaCiTy for EnGaGinG wiTH and undErSTandinG onE anoTHEr."
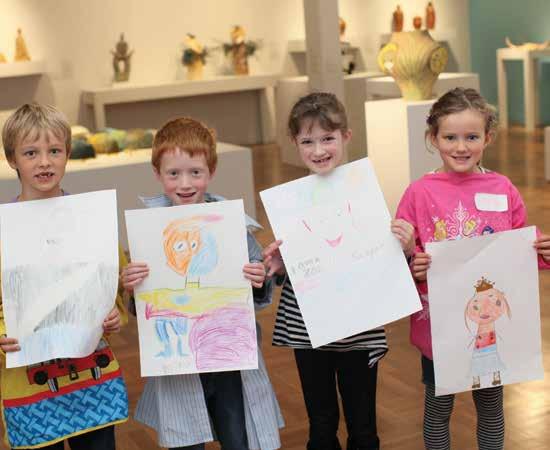

b est s tart | c ommun I t I es for c h I ldren | g reater s hepparton lI ghthouse p roject