World Ultra Wealth Report 2025
Brian Alster
Chief Executive Officer
Glenn Brian Chief Revenue Officer
Manuel Bianchi
Global Head of Sales
Olivia Logan
Vice President, Marketing and Corporate Development
Amanda Cifone
Vice President, Marketing
Lead authors
Maya Imberg
Senior Director, Head of Thought Leadership and Analytics
Maeen Shaban
Director of Research and Analytics
Bettina Lengyel
Associate Analyst, Thought Leadership and Analytics
Design
Dawn Lastre
Graphic Designer
Gaetano Medulla
Junior Graphic Designer
© Altrata. September 2025.
This publication is for your information only and is not intended as an offer, or a solicitation of an offer, to buy or sell any product or other specific service. All information and opinions indicated are subject to change without notice.
For the world’s richest individuals, wealth generation has continued apace over the past year and a half. The global ultra high net worth (UHNW) population, comprising individuals with a net worth in excess of $30m, totaled 510,810 at the end of June 2025, a rise of 5.4% since the beginning of the year. This followed a very robust expansion of 12% in 2024 – the third-strongest growth in the past decade. The total net worth of the UHNW class rose by 6.7% to $59.8tn at the end of June 2025 (and by 11.6% in 2024) – a figure double that of the annual GDP of the US.
The US is by far the largest wealth market in the world, home to 38% of the total UHNW population, more than the combined share of all other countries in the top 10. US ultra wealthy numbers surged in 2024 (by 21%) and continued to expand firmly (by 6.5%) in the first half of 2025 at a faster pace than in secondranked China. The UHNW population also rose strongly in all the top-ranked cities in 2024, with growth moderating to an extent over the first half of 2025. Hong Kong was a notable growth outlier and Tokyo was the only leading city to register a decline over the first half of 2025.
A huge shift in the generational makeup of the UHNW population over the next 15 years is under way and will have farreaching implications. By 2040, today’s ‘Next Gens’ (Generation Z and Millennials) will comprise almost 35% of the global UHNW population, up from just 8% today. Generation X (currently aged between 44 and 59) will account for 45%, almost doubling from the current 25%. Meanwhile, the combined share of the Baby Boomer and Silent Generation (and older) will fall steadily from 67% to just 20%.
The regions of North America and Asia had the fastest growing ultra wealthy populations. The UHNW population in the world’s leading ultra wealth region increased by 6.2% in the first half of 2025 to 208,090 individuals, lifting North America’s share of the global ultra wealthy class to a record 41%, almost eight percentage points higher than a decade ago. In Asia, wealth portfolios in the second-largest UHNW region showed resilience amid trade dislocation, with the UHNW population expanding by 6.4% between January and June 2025 to 129,100 individuals.
The share of global private wealth held by the ultra wealthy will continue to increase. By 2030, we forecast the global ultra wealthy population will total 676,970 individuals, an increase of 166,160 from the mid-2025 level of 510,810. Asia is expected to register the strongest growth in UHNW population, but North America will remain the largest ultra wealth region by far. India will be a standout, with four of the top 10 growth cities, including Bengaluru, Mumbai, Hyderabad and Delhi. Among US states, Florida, Utah and Texas are set to experience the fastest growth in UHNW numbers.
Ultra wealthy Next Gens are more likely to have hospitality, entertainment or technology as their primary industries than the average UHNW individual, though banking and finance still dominates. The transformative impact of rapid digital innovation and adoption is evident in the growing share of technology (accounting for 9%) as a primary industry focus among Next Gen ultra wealthy. Perhaps even more notably, the explosion of social media platforms is driving wealth creation in other sectors, such as hospitality and entertainment (15%).
Altrata’s latest World Ultra Wealth Report – the 13th edition – provides a unique and comprehensive analysis of the global ultra high net worth (UHNW) population. This exclusive group of wealthy individuals, each with a net worth in excess of $30m, has grown rapidly in size and influence over the past decade, accumulating immense collective wealth that now totals almost $60tn – double the annual GDP of the US.
We begin by illustrating the distribution of wealth among the global rich , and highlight the significance of an expanding global ultra wealthy class to a wide range of industries and sectors that target and cater to this exclusive segment. Following yet another turbulent period for the global economy and markets, we move on to assess the developments across the ultra wealthy landscape in 2024 and over the first half of 2025, identifying the key wealth drivers, analyzing regional trends, and ranking the leading UHNW countries and cities. In a complex environment of volatile geopolitics, rising protectionism, digital transformation, and a realignment by the world’s largest wealth market of long-established economic, trade, and security relations, we present our updated five-year forecast for the ultra wealthy population, including our assessment of the world’s fastestgrowing wealth centers.
The report then moves to examine key facets of the global UHNW population through an analysis of four identifiable generational cohorts: the Silent Generation, the Baby Boomers, Generation X, and the Next Gens (Millennials and Generation Z). We explore a range of characteristics, from key demographics and wealth holdings to primary industry focus and personal interests, highlighting key similarities and drawing out important variations between the different groups. We explain the dramatic changes that are set to alter the composition of the UHNW population over the next 15 years. These are anticipated to arise from a huge redistribution of global net worth from older to younger generations, which will have major implications for all organizations and sectors that target and cater to the ultra rich.
Altrata’s comprehensive database on the wealthy and its detailed Wealth and Investable Assets Model provide unrivaled insight into the world’s UHNW population, its characteristics and the constantly changing landscape of wealth creation, making it an essential resource for any organization looking to prospect for and engage with individuals in this exclusive demographic.
Ultra high net worth (UHNW) individuals
Those with a net worth of $30m+ (also referred to as the ‘ultra wealthy’).
Very high net worth (VHNW) individuals
Those with a net worth of $5m to $30m.

At the end of June 2025 there were an estimated 41.3 million high net worth (HNW) individuals around the world, each with wealth in excess of $1m. Within this relatively affluent group, the ultra high net worth (UHNW) population numbered 510,810 individuals, each holding substantial fortunes in excess of $30m. The ultra wealthy represent just 1.1% of the global HNW class, but their cumulative share of wealth is significantly larger. At $59.8tn, the total net worth of the UHNW cohort accounted for 32.4% of the wealth held by all HNW individuals, highlighting the considerable influence and privileged standing of this exclusive segment.
The wealthy by tier
Global population and wealth by major wealth tier in June 2025
Source: Wealth-X, an Altrata company, 2025
7x
The pace at which the ultra wealthy population has grown faster than the global adult population over the last two decades
Our data (going back to 2004) shows that over this period the size of the ultra wealthy class has swelled rapidly, outpacing the expansion of the global adult population by a factor of seven. Relative changes in cumulative net worth are likely to have been of an even higher magnitude. This escalation in ultra wealth holdings around the world has driven a surge in growth among the industries and sectors that cater specifically to the super rich.
7x
The pace at which the ultra wealthy population has grown faster than the global adult population over the past two decades
The market for luxury consumption and high-end lifestyle services has expanded strongly in recent decades, driven by the more varied interests and demands of a progressively diverse UHNW class. Global spend on luxury goods and services totaled $290bn in 2024 (estimate), accounting for 21% of all consumer-facing spending on luxury goods. There has been a similar trend across the high-end real estate sector, with the increasing global connectivity of the ultra wealthy, trends in remote working, and a more volatile geopolitical backdrop redefining expectations for luxury living around the world, from established top-tier global cities to new emerging hotspots.
With an estimated stock of $30tn of investable assets – equivalent to a very substantial 10% of investable assets globally – the UHNW class is the predominant clientele for financial services, prime brokerage and asset management companies, whether directly or via family offices. A surge in the number of inter-generational wealth transfers across more globalized UHNW families, including a new wave of first-generation wealth handovers, has spurred an expansion of wealth management firms specializing in estate planning and legacy transition. Amid rising wealth and shifting attitudes to civic engagement, the ultra wealthy cohort also accounts for a very prominent share of global individual giving to philanthropic organizations, with personal donations by the ultra wealthy estimated at a substantial $207bn in 2023, equivalent to more than a third of all giving by individuals.
Globally, the ultra wealthy account for:
$290bn of luxury goods spend, equivalent to 21% of total individual spend1
$207bn of philanthropic donations, equivalent to 36% of all giving by individuals 2
$30tn of investable assets, equivalent to 10% of global investable assets 3
Source: Wealth-X, an Altrata company. Estimates using Wealth-X data and Bain/Altagamma for overall luxury goods spend.
1 Refers to 2024 (estimate) data. Source: Wealth-X, an Altrata company. Based on estimates using Wealth-X data and Bain/Altagamma.
2 Refers to 2023 data. Source: Wealth-X, an Altrata company.
3 Refers to 2024 data. Source: Wealth-X, an Altrata company.
Source: Wealth-X, an Altrata company; World Bank for global population. call
Despite their small number, the ultra wealthy are a critical consumer segment for luxury goods providers. They accounted for 21% of all luxury goods spend by individuals in 2024 (estimate), spending a total of $290bn. Luxury brands have been increasingly turning their focus to this segment in recent years amid a decline in the overall size of the global luxury consumer base, which had been growing year-on-year for more than two decades⁴.
Spending on private jets and yachts is almost exclusively accounted for by the ultra wealthy, while more than half of consumer-facing fine wines spend is by this segment. As a category of its own, luxury car spend is greatest, on account of most ultra wealthy making (at the very least) one occasional purchase every so often. Like other consumer segments, the ultra wealthy continue to shift their spending towards experiences and experience-based goods, spending $45bn on hospitality and fine art annually (the latter also attracting interest for its long-term investment potential).
Luxury spend by category $290bn
Annual luxury goods and services spend by the ultra wealthy in 2024 (estimate)
Note: Personal luxury goods include jewelry, watches, fashion, and beauty products. Spending refers to consumer-facing spend; not commercial or corporate spend. Source: Wealth-X, an Altrata company; Bain/Altagamma.
With the general luxury consumer base having declined after a decades-long period of expansion, the ultra wealthy are increasingly critical to luxury brands’ quest for growth.
As clients or donors, the ultra wealthy are of vital importance to a wide range of industries and sectors; however, their individual value as potential introducers to other wealthy prospects is often overlooked. A personal introduction is far more likely to be successful in making an emotional connection to a specific product or service.
The networks of the ultra wealthy are highly valuable. Over the course of their lives, the ultra wealthy forge connections with large numbers of similarly wealthy and influential people as they build and run their businesses, serve on the boards of companies or not-for-profit organizations, and make personal introductions at corporate and leisure events, during holidays and in other ways. In fact, the average UHNW individual knows at least 70 other UHNW individuals directly plus many more with smaller but still substantial fortunes.
The number of ultra wealthy people to which each ultra wealthy individual has a direct connection.
Note: Direct connections are based on shared professional, personal and civic experiences, such as current or historical overlapping careers, contacts and board overlaps, among others. The term UHNW includes both confirmed and likely UHNW individuals, based on Altrata’s proprietary valuation methodology.
Source: RelSci and Wealth-X, both Altrata companies 2025
These connections to other wealthy individuals present opportunities for organizations to connect with, develop relationships with and, eventually, acquire additional clients or donors. Organizations that harness the power of these connections stand to benefit significantly in achieving their commercial, organizational or philanthropic objectives.
The
typical UHNW individual has a direct connection to more than 70 other UHNW individuals
Note: Direct connections are based on shared professional, personal and civic experiences, such as current or historical overlapping careers, contacts and board overlaps, among others. The term UHNW includes both confirmed and likely UHNW individuals, based on Altrata’s proprietary valuation methodology.
Source: RelSci and Wealth-X, Altrata companies, 2025
The value of an ultra wealthy client or donor as an introducer to other valuable prospects is often overlooked.
The global UHNW population totaled 510,810 individuals at the end of June 2025, a rise of 5.4% from the beginning of the year. This followed a robust expansion of 12% in 2024 – the third-strongest growth in the past decade – as wealth generation continued apace among the world’s richest individuals.
Global asset markets were volatile, roiled by geopolitical tensions, lackluster economic growth, rising protectionism, heightened interstate conflict in the Middle East, and an erratic realignment in the US of long-established economic, trade, and security relations under a new administration. Policy uncertainty and weakened confidence in institutions prompted strategic diversification among US investors into other safe-haven markets, leading to a broad depreciation trend in the US dollar. However, as in 2024, recessionary concerns were unfounded and most equity markets delivered solid returns. Global rates eased gradually lower, real estate markets stabilized, fiscal spending plans ramped higher, and investor enthusiasm for AI adoption and crypto deregulation lifted mega-cap technology stocks and digital assets. The total net worth of the UHNW class rose by 6.7% to $59.8tn at the end of June, following dynamic growth of 11.6% in 2024.
Select global indicators for 2024 and H1 2025 (Year-on-year change)
Select global indicators for H1 2025* and 2024 (year-on-year change)
Global UHNW wealth in June 2025
Firm growth in UHNW numbers as volatile markets navigate US policy upheaval
The UHNW population in the world’s leading ultra wealth region increased by 6.2% in the first half of 2025 to 208,090 individuals. Following on from double-digit growth in 2024, this lifted North America’s share of the global ultra wealthy class to a record 41%, almost eight percentage points higher than a decade ago. As elsewhere, there was considerable market volatility amid a more erratic and isolationist US policy agenda under the Trump administration, with exposure to a new global tariff war and a weaker US dollar a key determinant of business and sector performance. The Canadian economy slowed in response to conflict escalation with its principal trading partner. Overall, however, wealth portfolios in the region were bolstered by above-average equity market gains concentrated, as in 2024, among US tech stocks. These gains came on the back of a resilient US economy, solid corporate earnings, new tax cuts for the wealthy, and investor expectations of accelerated business deregulation and additional (if gradual) monetary policy easing. Having surged by 20% in 2024, the collective net worth of North America’s UHNW population increased by 7.1% in the first half of 2025 to $24tn (a 40% global share).
Wealth portfolios in second-largest UHNW region show resilience amid trade dislocation
Asia’s UHNW population expanded by 6.4% over January-June 2025 to 129,100 individuals. This was stronger growth than in Europe and so maintained Asia’s status as the second-largest ultra wealth region, a position it has held since 2020. Market disruption and business uncertainty caused by higher (and erratic) US tariffs – with China being a notable target – were an unwelcome headwind for the region’s trade-focused economies, set alongside subdued global demand and structurally weaker growth in China. Nevertheless, wealth holdings received support from a still resilient economic performance in a global context, a weaker US dollar, monetary loosening across the region, and spillover effects from new fiscal stimulus in China. Following relative underperformance in 2024, average returns across the region’s capital markets surpassed those in most developedeconomy peers, led by firm gains in Japan, Hong Kong (buoyed by a surge in secondary listings of Chinese companies on the stock market), and the tech-heavy markets of South Korea and Taiwan. This contributed to a 10% increase in the collective net worth of Asia’s UHNW class to $14.8tn.
Wealth assets bolstered by equity rebound, despite the weak performance of major economies
Europe recorded slightly below-average growth of 4.8% in its ultra wealthy population, which totaled 127,480 individuals at the end of June 2025. Economic performance across the third-largest UHNW region remained lackluster, particularly in the main wealth markets of Germany, the UK and France, as a more protectionist US trade policy added new complexity to an already challenging outlook inhibited by structural constraints and rising political fragmentation. However, there were signs of investor optimism on the back of a landmark easing of fiscal constraints in Germany and a region-wide ramping up of defense spending plans. Alongside a steady reduction in interest rates, lower inflation, recovering real estate markets, currency appreciation against the US dollar, and firmer growth trends across southern and central Europe (supported by buoyant tourism sectors and EU structural funds), wealth portfolios expanded steadily. The cumulative net worth of the UHNW class increased by 4.7% over the first half of 2025 to $14.7tn. Equity markets on the whole recorded firm gains, with the MSCI Europe Index outperforming most US and global indices, although this followed a stark underperformance in 2024.
Heightened risk of regional conflict and subdued commodity markets weigh on UHNW portfolios
In contrast to developments in the three largest UHNW regions, the Middle East registered only very moderate gains in ultra wealthy individuals and total net worth. Its UHNW population increased by just 0.4% to 21,160 people in the first six months of 2025, a 4.1% global share. A spike in commodity prices (and accelerated efforts in Europe to diversify energy supplies) delivered strong revenue gains in hydrocarbon-exporting countries. There was support for portfolios from the US dollar currency peg in most Gulf Arab countries, which mitigated financial market volatility, and from an upturn in global travel and tourism, although this impact gradually faded. Wealth changes were by no means uniform across the region, with energy-importing countries and structurally vulnerable economies undermined by the surge in living costs and heightened social unrest. Pressure on capital markets increased from the middle of the year as risk aversion grew in relation to emerging-market assets. Nevertheless, the region’s total UHNW wealth expanded by 2.4% to $3.5tn in mid-2025.

Moderate growth of UHNW population and net worth, supported by capital market
The UHNW population in Latin America and the Caribbean grew by 2.7% in the first half of 2025 to 14,830 individuals. This continued the moderating trend in the pace of expansion seen in 2024, following a three-year period of dynamic growth of the region’s UHNW class and net worth. This reflected less favorable terms of trade for the major commodity-exporting wealth markets, sticky inflation, softer economic growth, and heightened uncertainty over the impact of a more protectionist US trade policy (to which Mexico is the most exposed). The region’s economic performance was respectable, however, supported by firm expansion in the largest wealth market of Brazil and a continued rebound in Argentina. Most Latin American central banks maintained an easing stance, with a notable exception being Brazil, where a hike in rates bolstered the currency and equity returns. In general, stock markets in the region trended higher, with some benefiting from currency appreciation against the US dollar and firm capital inflows tied to a global trend of investor diversification away from US assets. Total UHNW wealth in Latin America and the Caribbean increased by 1.7% in the first half of 2025 to $1.8tn.
Sluggish trend in Australia and an upturn in Africa’s UHNW population
The UHNW population in the Pacific region – which mainly reflects developments in Australia – edged lower in the first half of 2025 to 7,290 individuals. This contrasted with close to a 10% expansion in 2024. Economic and capital-market developments were subdued in the face of softer Chinese demand for Australian mineral commodities, domestic cost-of-living pressures, and second-order effects from rising trade protectionism. Following relative underperformance in 2023-24, the smallest UHNW region of Africa recorded a 7.5% rise in ultra wealthy numbers in the first half of 2025 to 2,860 individuals. Asset portfolios were supported by lower financing costs, currency appreciation against the US dollar, and firm demand for the region’s critical mineral reserves. This more than offset the structural headwinds to wealth generation posed by elevated political instability, financing pressures, high indebtedness, and widespread social unrest. The two regions accounted for a combined 2% of the global UHNW population.
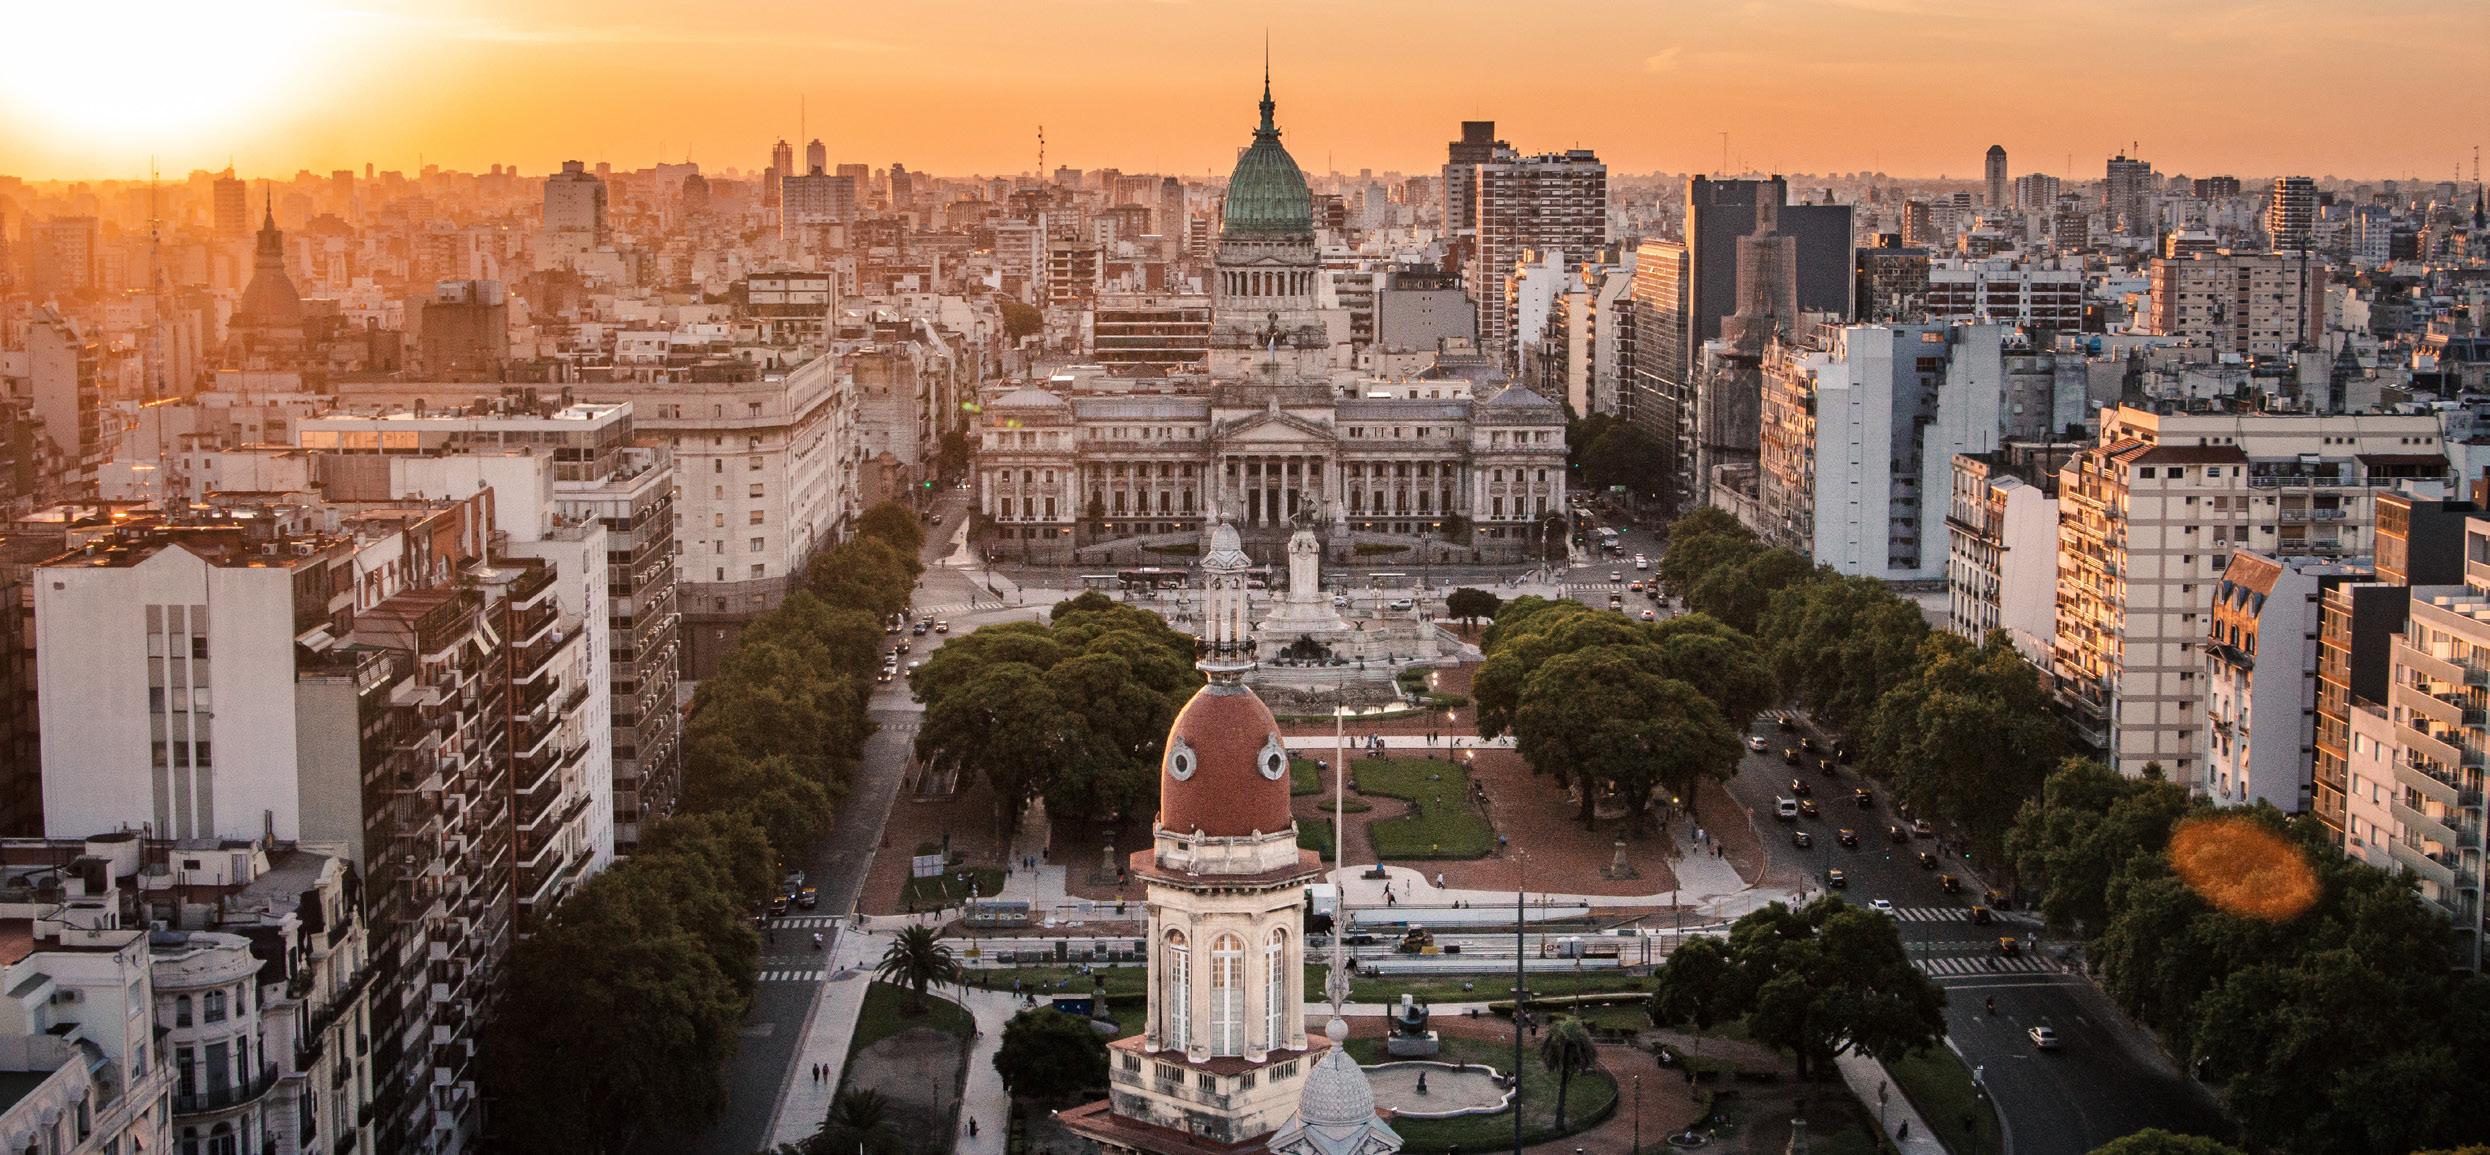

Three-quarters of the UHNW population reside in just 10 countries, underlining the influential status of the world’s largest wealth markets and the focused opportunities for companies and organizations that target and/or cater to the global rich. Here, we highlight the key country trends and recent changes in UHNW population size.
America First – the US consolidates its position as the world’s dominant UHNW market in the first half of 2025.
The US is by far the largest wealth market in the world, home to 38% of the total UHNW population, more than the combined share of all other countries in the top 10. Ultra wealthy numbers surged in 2024 on the back of dynamic equity gains, gradual monetary loosening and robust consumer-led growth, and continued to expand firmly in the first half of 2025 (at a faster pace than in secondranked China). Asset markets were more volatile amid the Trump administration’s policy blitz and isolationist tilt, with the US dollar losing ground against all major currencies. Stock market returns remained positive, however, driven by the tech sector. At the end of June, the S&P 500 showed year-to-date gains of 6% after a 25% rise in 2024.
China registers the weakest growth in UHNW numbers among the top six countries.
The second-ranked UHNW market underperformed relative to its peers in 2024 and over the first half of 2025. Heightened trade conflict with the US and tighter restrictions globally weighed on sentiment and export competitiveness, adding to headwinds from structurally weaker domestic demand. However, there was reasonable support for wealth portfolios from interest rate cuts, expanded fiscal stimulus, relative renminbi appreciation, and extensive state-backed investment in AI-focused technologies and advanced manufacturing.
Hong Kong is a standout performer; third-ranked Germany shows robust UHNW growth.
Hong Kong recorded the strongest population gains of all the leading UHNW markets. Following a period when political reforms and exposure to US-China rivalry diminished its appeal slightly among international firms, Asia’s largest financial hub recorded double-digit growth in UHNW numbers, which accelerated over the first half of 2025. Key drivers were real estate reforms and vibrant equity gains, with the financial sector benefiting from an influx of firms from the Chinese mainland seeking to list on the local stock market. Asia’s biggest wealth market, Japan, registered softer, but still firm, growth in UHNW numbers. Financial stocks, in particular, were bolstered by a higher policy rate, the yen’s safe-haven status and governance reforms. Amid a soft economy and US tariff threats, there was a robust expansion of the UHNW class in Germany, Europe’s largest wealth market. Equity returns on the Dax index advanced strongly owing to rate cuts, euro appreciation and a hugely expanded fiscal program for defense and infrastructure spending.
The three largest wealth regions dominate the rankings; any change in composition will be gradual.
The 10 largest UHNW countries are all located across three regions, with four markets in Europe, four in Asia and two in North America. This configuration has remained largely unchanged over the past decade, with the only notable development being the rise of India into the echelon of leading countries, having recently overtaken Switzerland. Other wealth markets positioned just outside the top 10 still have ground to make up in terms of their respective UHNW populations. However, shifting patterns in global wealth distribution could well lead to several countries from outside of the three main wealth regions becoming an established presence in the top rankings over the next decade, with the most likely being Saudi Arabia (currently ranked 14th) and Brazil (15th).
The top 10 cities are home to around a fifth of the world’s UHNW population. The distribution of ultra wealth at city level has evolved over the past decade, shaped by socioeconomic trends, the globalization of business and technology, and increasing mobility of the ultra wealthy class. The allure of the largest global cities remains strong, however, offering privileged access to aligned social networks, investment opportunities, and an array of high-end cultural, educational, entertainment and lifestyle services. Below, we highlight some of the structural drivers and recent changes in UHNW city population size.
Note: Population numbers are rounded to the nearest 5. Cities are de ned on the basis of urban agglomerations and metropolitan (metro) areas, which include the built-up areas outside the administrative core. For example, New York includes New York City, Newark and Jersey City. We focus on metro areas to ensure comparability because globally comparable city-level data is not available. Major cities are determined on a nominal GDP basis in $. Changes are measured based on model inputs updated retrospectively and not on previously published gures.
Source: Wealth-X, an Altrata company, 2025
A fifth of the global UHNW population resides in the top 10 cities.
Some 19% of the global UHNW population resided in the top 10 cities as of June 2025.
This share has trended gradually higher over the past decade, notwithstanding greater volatility in recent years. The number of ultra wealthy individuals rose strongly in all of the top-ranked cities in 2024, with growth moderating to an extent over the first half of 2025. During this period, Hong Kong was a notable outlier and Tokyo was the only leading wealth market to register a decline. On average, the UHNW population across the top 10 cities expanded by 7% in the six months to June, outpacing the 5.6% growth of the global ultra wealthy class (although if Hong Kong is excluded, there is a below-average rise across the other nine cities).
New York and Hong Kong are the premier cities, with UHNW populations at a level well above those of other leading wealth centers.
The foremost UHNW cities of New York and Hong Kong registered robust growth in ultra wealthy numbers in the 18-month period to June 2025. The top-ranked wealth hub of New York, the finance and commerce center of the world’s largest UHNW country, saw a rapid expansion in 2024, followed by softer growth amid a more volatile domestic and global environment. The city’s ultra wealthy class comprised 21,380 individuals at the end of June (a 4.2% global share). Hong Kong’s unrivaled status as a nexus for financial flows between China and the global economy was a key driver of its rapid expansion of UHNW numbers and wealth, with the territory’s equity market attracting the most listings of any global exchange in the first half of 2025, boosting overall returns. This IPO boom primarily comprised mainland-Chinese companies, with investor activity incentivized by the global breakthrough of DeepSeek, a Chinese AI startup, in early 2025.
Broad-based expansion in cities’ HNW populations, but Tokyo loses ground.
Los Angeles consolidated its position as the third-largest UHNW city – home to around half the number of New York’s ultra wealthy inhabitants – ahead of two other US centers, San Francisco and Chicago. Since the pandemic, the US has experienced a structural migratory shift of some corporates and wealthy individuals out of more traditional wealth hubs and metropolitan centers, particularly to areas in Texas and Florida, driven by remote working trends and for tax-planning purposes. That said, Los Angeles, San Francisco (which has one of the highest densities of UHNW individuals of any global city) and Chicago all recorded firm gains in their respective ultra wealthy populations over the 18-month period to June 2025. Among the leading UHNW cities, the Japanese capital of Tokyo lost ground to its peers, seeing a modest fall in ultra wealthy numbers in the first half of 2025. Asset portfolios were dampened by strong inflation, political instability, real estate pressures, and exporters’ exposure to more protectionist US trade policy.
US cities dominate the ranking, while China and Germany do not feature.
Reflecting its dominant UHNW status, the US accounts for seven of the top 10 cities (and the next two in the list), while there are two cities in Asia and one in Europe. Paris has recently fallen out of the leading positions. The world’s second- and third-largest ultra wealth markets, China and Germany, have no top-10 city representation (the highest-ranked city being Shanghai in 25th position). This is explained by their stock of private net worth being dispersed more uniformly across domestic urban centers than in most leading wealth markets. This contrasts especially with London and Tokyo, which are home to an especially high share of their respective country’s UHNW populations.
The global economy is transforming at a frenetic pace, with tectonic shifts in digitalization, climate and energy, demographics and, increasingly, geopolitics and geoeconomics. Trends of rising protectionism, political polarization, weakening institutions, and the increasing concentration of executive power in the world’s largest economies are reshaping traditional alliances and loosening constraints on geopolitical brinkmanship. Alongside determined (and erratic) moves in the US to realign trade, security, and the socioeconomic policies of the world’s largest wealth market, these profound shifts are adding new layers of uncertainty to a complex and volatile investment landscape.
An anticipated further weakening of long-established norms and macroeconomic anchors in the coming years warrants a degree of caution with regard to wealth preservation planning. Strategic diversification – across regions, asset classes, and liquidity profiles – will be crucial in navigating global markets, given a high risk of policy missteps and conflict escalation in such a febrile environment.
And yet, as developments in global capital markets and UHNW portfolios over the past 18 months have shown, such disruption can also be a catalyst for new and diverse opportunities for wealth generation. At the same time, structural megatrends – urbanization, digital innovation, climate-focused investments (such as in clean energy and critical minerals), an expanding middle class in emerging markets, rising female labor participation, e-commerce growth, aging populations, and rising debt concerns – will continue to reshape the world economy and wealth markets. These forces are largely impervious to political whims or economic cycles. Future developments in AI and crypto assets will be a key focus for individuals, markets, and governments around the globe. These advances continue to attract their share of unbridled enthusiasm and skepticism as to their real-world utility but, in the event of widespread adoption, their potential to disrupt the status quo is undeniable.
The share of global private wealth held by the ultra wealthy will continue to increase.
Against this backdrop of high uncertainty, disruptive forces, and fundamental wealth drivers, we anticipate a firm expansion of the global UHNW population and its combined wealth over the next five years. By 2030, we forecast the global ultra wealthy population to total 676,970 individuals, an increase of 166,160 from the mid-2025 level.
Asia is set to register the strongest growth in UHNW population, but North America will remain the largest ultra wealth region by far
Asia is projected to record the strongest cumulative growth in its ultra wealthy population to 2030 (its population growing by almost 40% over the period), lifting the region’s share of the global UHNW class to 27%, up from 25% currently. After several decades of outperforming other regions strongly in terms of wealth expansion, Asian growth is settling at a level below its pre-pandemic trend amid structural developments in China. However, the broad outlook for wealth creation in the region remains positive, led by an expanding Indian economy. Support will come from the established wealth centers of Singapore and Japan, and from markets in south-east Asia, such as Indonesia, Malaysia, and Vietnam.
The UHNW population in North America is forecast to increase by an additional 68,140 ultra wealthy individuals by 2030, the largest absolute increase in number for any region. However, growth will lag slightly behind that of Asia and be on a par with the global average. We project continued expansion of the UHNW class in Europe, but with growth trailing that of the two other major wealth regions. This will lead to a further gradual decline in the regional share of the global ultra wealthy population to 24% by 2030 (down from 26% in 2020).
The combined share of the global UHNW population across the other four regions is forecast to edge lower by 2030, from 9% in mid-2025. Average annual growth in the Middle East is projected to be the weakest of the four regions over the five-year period. Growth of the ultra wealthy classes in Latin America and the Caribbean and the Pacific region will be stronger, but below the global average. We forecast a more robust pace of expansion in Africa (outperforming all regions bar Asia) from a low base, supported by infrastructure development, rapid urbanization, trade diversification, and deepening consumer markets.
Note: F stands for forecast. Among the world’s 200 major cities as ranked by nominal GDP in US$.
Source: Wealth-X, an Altrata company, 2025
The long-established appeal of the world’s premier cities and the size of their respective ultra wealthy populations mean that only minor changes are expected in the composition of the top 10 UHNW cities over the next five years. Looking beyond the top-tier cities, our list of those with the fastest-growing ultra wealthy populations by 2030 shows a wide variety of emerging wealth hubs worldwide. Key drivers include the changing sectoral focus of wealth generation, global trade and supply-chain diversification, huge state-funded investment programs, burgeoning consumer classes, targeted tax and lifestyle incentives, the rising connectivity of the UHNW class, country-specific regulations, and the broadening spread of multi-generational wealth transfers.
India is a standout, with four of the top 10 growth cities, including the financial center of Mumbai and the IT and business services hubs of Bengaluru and Hyderabad in the southern half of the country. Despite emerging structural challenges, China remains a hugely influential driver of global wealth trends and is home to two of the hottest ultra wealth markets, namely the megacities of Chongqing and Hefei. UHNW numbers are also forecast to grow at a robust pace in Manila,
the capital of the Philippines, thanks to a rapidly expanding economy and spillover effects from trade diversification among its south-east Asian peer economies. The Nordics are the ones to watch from a developed market perspective. Already boasting a high concentration of ultra wealthy individuals, both Oslo and Stockholm, the respective affluent capitals of Norway and Sweden, are forecast to register some of the strongest rates of UHNW population growth in 2025-30.
Over the next five years, Florida is projected to have the fastest-growing ultra wealthy population of all the US states, with Texas also ranking highly in third position. Key drivers (relative to other states) include favorable demographics, economic growth, alongside tax-planning reasons and entrepreneurial policies, all of which underpin the growth (as well as the formation) of businesses that are owned and/or run by the ultra wealthy (and those set to become ultra wealthy as a result).
As previously highlighted, the states of Florida and Texas have, in particular, experienced rising inflows of ultra wealthy individuals and related corporate activity over recent years, often from the more traditional wealth hubs of California and New York. Key drivers include attractive low-tax regimes, remote working trends, the growth of emerging tech and finance hubs in areas such as Austin and Miami, and general lifestyle appeal. A high-profile example of this internal migratory shift was the decision by Elon Musk to relocate Tesla’s corporate headquarters from California to Texas in late 2021.
Less established wealth centers, such as Utah, are also seeing an increase in their ultra wealthy populations, showing how the huge US wealth market offers a wide choice of locations for an increasingly mobile and connected UHNW elite. Utah is middle ranked for its total ultra wealthy population but comes in second place for growth. Its average growth is forecast at 8.1% a year, a nod to the popular winter sports destination and expanding business services hub of Salt Lake City. The burgeoning tech center of Scottsdale in Arizona has been one of the fastest-growing UHNW hubs in the US in recent years, and we expect this to continue to 2030. Other prominent hotspots include the Lake Tahoe area of Nevada and affluent regions of Idaho and South Carolina.
However, the Trump administration’s reordering of the political, legal and migratory environment could possibly prompt some ultra wealthy individuals to reassess the stability and attractiveness of their US-based investments.
Notwithstanding these migratory swings, California is still projected to see firm growth in ultra wealthy numbers to 2030 and remain the US state with the biggest UHNW population by far – some 30% larger than next-ranked Texas.
Florida, Utah and Texas are set to experience the fastest growth in UHNW numbers, but California will remain the leading UHNW US state by far.
What are some of the defining characteristics across different generations of the ultra wealthy class?
Ultra wealth has traditionally been heavily concentrated in the older generations, reflecting the length of time it takes to accumulate substantial fortunes through business acumen, profitable investments and/or via inheritance. In recent decades, the financialization and rapid digitalization of the world economy have significantly expanded the opportunities for accelerated wealth creation for a younger generation of entrepreneurs. Over this period, strong growth of a more regionally diverse global UHNW population and its cumulative stock of wealth has also led to a marked rise in the frequency of substantial wealth transfers to younger generations (often at an earlier life stage than was the case for their older peers). It is a trend that will accelerate significantly over the next 15 years.
In this chapter, we study four identifiable generational cohorts across the global ultra wealthy population: the Silent Generation (aged 80+); Baby Boomers (aged 60-79); Generation X (aged 4459); and Next Gens (aged 18-43, comprising Millennials and Generation Z). We model the upcoming transformation of the generational makeup of the UHNW class and explore a variety of characteristics, from demographics and wealth holdings to primary industry focus and personal interests, highlighting key similarities and drawing out important variations between the different groups. What emerges is a valuable insight into generational trends for companies and organizations prospecting for, targeting and engaging with the ultra wealthy.
The huge shift in the generational makeup of the ultra wealthy over the next 15 years - and thereby this group’s characteristics and preferences - will have significant implications for all organizations that target and cater to this demographic.
A huge shift in the generational makeup of the UHNW population over the next 15 years is under way. The composition of today’s UHNW population is dominated by the Baby Boomer generation – those born between 1946 and 1964 – which comprises a 45% share. The Boomer populace is twice the size of the next-largest cohort, Gen X, which is, in turn, slightly larger than the Silent Generation (those born before 1946). The youngest of the four main generational groups, Next Gens, accounts for a modest 8% share of the total UHNW population.
This is set to change dramatically over the next two decades as the ‘Great Wealth Transfer’ brings a huge redistribution of global net worth – unprecedented in scale and speed – from older to younger generations through lifetime gifting and inheritance on death. The major beneficiaries will be Gen X and Next Gens.
Share of ultra wealthy adults globally by generation Generations
2013 and later
Younger than 18
Note: F stands for forecast. Age refers to current age. Adults refer to individuals aged 18 and above.
Source: Wealth-X, an Altrata company, 2025 Generation Alpha
By 2040, today’s Next Gens and Gen X will comprise 80% of the global UHNW population, up from 33% today.
By 2040, today’s Next Gen cohort is predicted to account for 35% of the global UHNW population, with the relative share of Gen X almost doubling from the current 25%. In just 15 years, these two generational groups are expected to comprise 80% of the total ultra wealthy class, as demographic trends lead to a steady reduction in the size of the Baby Boomer population (to a 17% share) and especially of the Silent Generation (to just a 3% share). This huge shift in the generational makeup of the UHNW population over the next 15 years will have far-reaching implications across the ultra wealthy landscape. The differing preferences, experiences, values, and aspirations of the various generations will prompt a reappraisal of investment strategies, legacy planning, philanthropic engagement, wealth management, and demand for luxury assets.
Baby Boomers are currently the wealthiest generation, with median wealth of $57m, some 30% higher than that of Next Gens. The portfolios of those aged 60-79 have been bolstered over time by the protracted economic expansion in the west since the second world war, dynamic gains from several stock market booms, skyrocketing real estate and pension asset appreciation, and fortunes inherited from a largely frugal Silent Generation. These (and other) socioeconomic factors provided a strong net worth base for new wealth accumulation amid the more volatile capital market developments of recent decades. The expectation is for the median wealth levels of the Gen X and Next Gen (especially the Millennial) cohorts to surpass that of the Baby Boomers over the next 20 years, as many fortunes are transferred to the younger generations.
UHNW female representation is modest across all generational groups, but the Next Gens have an evidently higher share. The global ultra wealthy population is heavily male dominated, with women accounting for a low 12% share. This distribution is largely mirrored across different generations, although an emerging trend is apparent in the higher 17% share of women among the youngest group of ultra wealthy Next Gens. Female representation is on a (very) gradual upward path, influenced by shifting regional patterns of global wealth, slowly evolving cultural (and boardroom) attitudes, more accessible and diverse market opportunities for capital accumulation, and the rising number of intergenerational wealth transfers.
Median wealth by UHNW generation
Share of women by UHNW generation
Self-made fortunes dominate, although a quarter of Next Gens have a blend of inherited and selfcreated wealth. Most members of the global ultra wealthy population have built their own fortunes (being ‘self-made’), and this is the case across all four cohorts. The Baby Boomer generation boasts the highest share (78%) of wholly self-made entrepreneurs, with the proportion trending lower across the younger generations to 65% of Next Gens. The prevalence of solely inherited wealth is low across the board: an 8% share of Next Gens being the highest, but only slightly above the 6% average for the global UHNW population.
Source of wealth by UHNW generation
The standout trend is the rising proportion of the younger ultra wealthy who have cultivated their net worth through a combination of inheritance and self-creation, a nod to the higher frequency of inter-generational estate transfers and family gifting among an expanding global wealthy class. Among Next Gens the share is 27%, 10 percentage points higher than for Baby Boomers. 15.1
Share of UHNW population by source of wealth by gender by region
While self-made wealth dominates, inter-generational wealth transfer as an input to subsequent wealth creation is higher among Next Gen ultra wealthy.
The established sectors of banking and finance, and business and consumer services, are the main industry focus, but patterns are shifting. Generational differences in the leading primary industries of the ultra wealthy are modest overall, although the distribution among the youngest Next Gen cohort is indicative of evolving trends in digitalization and wealth creation. As has long been the case, banking and finance is the predominant industry for the global UHNW class. The respective share among Next Gens is 10 percentage points lower than the UHNW average, at 19%, reflecting the past decade’s restructuring of the global financial services sector and the emergence of alternative wealthgeneration channels.
The transformative impact of rapid digital innovation and adoption is evident in the growing share of technology as a primary industry focus among younger generations. It is also, perhaps even more notably, driving wealth creation in other sectors, such as hospitality and entertainment. Digital disruption and the explosion of social media platforms have opened up an array of wealth-creation and wealthenrichment opportunities for Next Gens, be they ‘influencers’, established celebrities or owners of brands.
Technological advances will continue to shape the future industry focus of the ultra wealthy, but so too will other global trends. Rising urbanization and an expanding global middle class will ensure that business and consumer services remain a prominent sector for the ultra wealthy (as is currently the case across all generations). Meanwhile, the non-profit and social organizations sector will continue to be one of the more common areas of focus for ultra wealthy individuals, particularly those who are ready to move on from the day-to-day management of their commercial enterprises.
Variations in asset allocation between the different generations are generally modest, especially when comparing the average distribution per UHNW individual. Liquid assets (mainly cash, income and dividends) account for the largest proportion (35-45%) of wealth portfolios across all four groups, ahead of privately owned investments (about 30%). This is followed by real estate and luxury assets, such as art, jewelry and vehicle collections, with the lowest share (around 10%) in public holdings.
There is a somewhat different pattern in asset allocation when expressed as a share of the cumulative wealth of each cohort, with a notably higher proportion of public holdings and a reduced influence of real estate and luxury assets. The main reason for this is the outsized influence on the aggregate wealth data of the fortunes of a relatively small number of ‘super billionaires’. The scale of wealth held by these individuals results in a skewed distribution – most evident in public and private holdings – when compared with the average UHNW individual.
Ultra wealthy Next Gens hold a slightly greater share of their portfolios in real estate and luxury assets compared with their older counterparts. This is primarily a reflection of the cohort’s lower level of median wealth and the fact that their business and investment assets are generally less developed and not as diversified. It is also partly an indication of the personal consumer preferences of the younger generation and of the rising frequency of wealthy family estate transfers (often including one or more residential properties, as well as various luxury assets). Portfolio allocations are very similar in the Gen X, Baby Boomer, and Silent Generation cohorts, reflecting global investment trends and broadly comparable levels of median wealth.
Sports and philanthropy are the most popular interests, with technology more prominent among the younger generations. Sport is universally popular across the cohorts, and especially among Next Gens and Gen X. This reflects its broad appeal to all ages, whether as an active leisure pursuit, for social relaxation or, increasingly, for purposes of investment and ownership prestige in a time of lucrative media rights and the growth of sports franchises. Philanthropy also ranks highly across the board, with interest growing in line with age (and median wealth). It is the most popular non-business pursuit among Baby Boomers and the Silent Generation, with a clear gender bias towards women.
Top seven interests, passions and hobbies by UHNW generation
Proportion of individuals
(Gen Z and Millennial)
In part this is down to a prioritization of interests, with older UHNW individuals generally able to devote a larger proportion of their time to hobbies and philanthropic initiatives. At a later stage in their lives, they may also feel a greater obligation to engage with benevolent causes. A perhaps surprising insight is that philanthropy ranks almost as highly as technology in popularity among Next Gens. This is likely influenced by the increasing scope of inherited wealth, as well as the volatile global landscape. It underlines how motivations can evolve – today’s ultra wealthy young individuals are likely to be more aware than their elders at their age about global inequality and the environment, and more engaged with charitable causes from earlier in their lives.
18
Technology is one of the top three interests for Next Gens and Gen X, but fails to make the top six for Baby Boomers and the over-80s, marking a clear generational split. The outdoors is the third most common pursuit among the older cohorts, being fairly popular across all ages, as are travel and public speaking. Music is a standout passion among Next Gens, while an interest in art tends to increase with age.
Education is the most common field for philanthropic activity across all ultra wealthy generations. Among the wide range of charitable causes and philanthropic ventures seeking donations, certain fields consistently attract the most attention from ultra wealthy individuals of all ages. Initiatives to improve educational facilities and learning opportunities are the most popular area for charitable giving. This includes alumni gifts to alma maters. This has long been a feature of US universities and is now gaining prominence among educational institutions around the world at a time of increasing financial and political pressures.
Top seven philanthropy causes by UHNW generation
There is also broad interest across the generational cohorts in donating funds to support social services, the arts and culture, healthcare and medical research, the environment, and child development. In most of these fields, the level of engagement tends to be moderately higher among the older generations (this is certainly the case for arts and culture). Older individuals’ wealth tends to be greater and they typically have more time to devote to philanthropic initiatives as they decrease their focus on commercial endeavors. However, the main takeaway is the extensive participation by all ultra wealthy age groups across a wide range of philanthropic initiatives. Perhaps surprisingly – given the younger generations’ increased awareness of (and exposure to) climate-related issues – giving to environmental and conservation causes ranks only sixth among Next Gens and Gen X.
Philanthropic engagement tends to be higher among the older UHNW generations.
Note: Giving to more than one cause is possible, so the numbers do not add up to 100%. Social services include crime prevention, reducing pove y and unemployment. Religious organizations do not appear among the top seven philanthropic causes. However, this type of giving is often anonymous and disparate in nature, so we believe it is higher than our actual estimates.
Source: Wealth-X, an Altrata company, 2025
To size the wealthy population and its combined wealth, we use our proprietary Wealth and Investable Assets Model. This model produces statistically significant estimates for total private wealth and estimates the size of the population by level of wealth and investable assets for the world and each of the top 70 economies, which account for 98% of world GDP.
We use a two-step process. First, to estimate total private wealth, we use econometric techniques that incorporate a large number of national variables, such as stock market values, GDP, tax rates, income levels and savings from sources such as the World Bank, International Monetary Fund, Organization for Economic Cooperation and Development and national statistics authorities. Second, we estimate wealth distribution across each country’s population. Owing to a lack of wealth distribution data, most wealth models estimate wealth distribution patterns using income distribution data.
Wealth-X’s proprietary database of millions of records on the world’s wealthiest individuals enables us to construct wealth distribution patterns using real, rather than assumed, wealth distributions, making the model more reliable. We then use the resulting Lorenz curves to distribute the net wealth of a country across its population. The database is also used to construct investable asset distribution patterns across each country’s population. The model uses residency as the determinant of an individual’s location.
Our model also estimates population, wealth and investable assets for the world’s 200 major cities as ranked by nominal GDP in US$. These cities are defined on the basis of urban agglomerations (UAs) and metropolitan (metro) areas, which include the built-up areas outside the administrative core. We find that metro and urban areas are closer to self-contained entities compared with city administrative cores (city proper) because more residents are likely to work and spend within the metro/UA boundaries. We focus on metro areas to ensure comparability because globally comparable city-level data is not available.
To profile the UHNW in greater depth, this report leverages the unique and proprietary Wealth-X Database, the world’s most extensive collection of curated research and intelligence on the wealthy. Our database provides insights into their financial profile, career history, known associates, affiliations, family background, education, philanthropic endeavors, passions, hobbies, interests and much more. Our proprietary valuation model (as defined by net worth) assesses all asset holdings, including privately and publicly held businesses and investable assets. The database uses the primary business address as the determinant of a wealthy individual’s location. References to $ or dollars refer to US dollars.
To size and forecast wealth distribution shifts by generation, we leveraged the Wealth-X Database and our Wealth and Investable Assets Model. We examined the wealthy’s age profile today, how this has changed over the past decade, and the pace of generational change. Using these trends, we mapped generational cohorts and projected how the distribution of wealthy individuals will evolve each year through 2040. This provides a clear, data-driven view of the future generational distribution of wealth and the wealthy.
Our connections data was leveraged from Altrata’s RelSci and Wealth-X. RelSci’s Relationship Mapping Database covers 10 million influential individuals and 2 million organizations. Connections are based on shared professional, personal and civic experiences, such as current or historical overlapping careers, contacts and board overlaps, among others. With regards to our connections data, we limited relationships to those with a ‘strong’ likelihood of relationship, as RelSci also creates paths of connection using lower likelihood connections.
Analysis of the data and additional insights were provided by Altrata’s Analytics team. Leveraging Altrata’s databases and its own data models, Altrata Analytics provides customizable data assets tailored to an organization’s needs.
484,520

Altrata provides the most essential intelligence and insight on business leaders, the global wealthy and well-connected. Leading commercial, philanthropic and educational institutions depend on Altrata solutions to meet their growth objectives. Clients partner with Altrata to confidently engage with exceptional individuals and organizations, create meaningful relationships and seize strategic opportunities.
Altrata’s global dataset contains millions of individual profiles on the wealthy, senior decision makers, board members and C-suite leaders. Altrata offers actionable, accurate and comprehensive data, maintained by a global team of in-house researchers committed to surfacing the right insight at the right time to drive positive business outcomes. Altrata is the definitive leader in global wealth intelligence, professional relationships mapping and affluent market dynamics.
Altrata is a registered trademark of Delinian Limited and its affiliated companies, and is comprised of five industry leading offerings: BoardEx, Boardroom Insiders, RelSci, WealthEngine and Wealth-X.