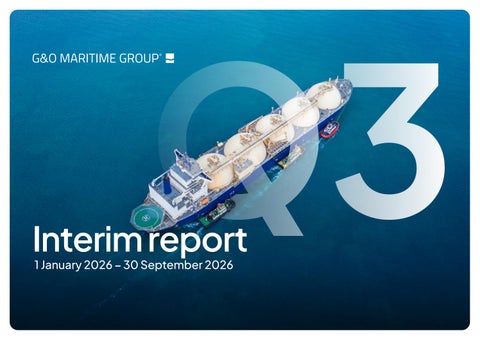
Q3
Interim report 1 January 2026 – 30 September 2026
Content 3
Historical line
17
Note 1 - Segment information
4
Quarterly News
18
Note 2 - Revenue from contacts with
Strong Group Presence at SMM 2026
customers
6
Group highlights
19
Note 3 - Special Items
7
Segment highlights
20
Note 4 - Cash flow specifications
8
CEO Update
20
Note 5 - Financial assests and liabilities
9
Management’s review
21
Note 6 - Acquisitions of enterprises
11
Management statement
22
Accounting policy
13
Income Statement
23
G&O Maritime Group
13
Statement of other comprehensive
24
Brands
25
Colophon
income
14
Statement of financial position
15
Statement of cash flows
16
Statement of changes in Equity
drives maritime innovation with advanced, future‑ready solutions.
2
Historical line Gertsen & Olufsen dates back to 1945. However, it was formally established as G&O Maritime Group in 2014 when Gertsen & Olufsen acquired Atlas Incinerators.
1917
Since then, the Group has expanded through several strategic acquisitions with the aim of establishing a niche sub-system group serving the maritime industry with market leading products.
1974
Hans Jensen Lubricators
2015
Atlas Incinerators
1945
Pres-Vac Engineering joins G&O Maritime Group
2011
Gertsen & Olufsen
2026
2018
FuelTech joins G&O Maritime Group
Eltronic FuelTech
2021
Global Boiler Services
Polaris acquires G&O Maritime Group
1959
2015
HECO International
1952
Pres-Vac Engineering
2024
HECO joins G&O Maritime Group
2014
Global Boilers Services joins G&O Maritime Group
2022
Hans Jensen Lubricators joins G&O Maritime Group
G&O Maritime Group is formed as Atlas Incinerators joins Gertsen & Olufsen A/S
3
Quarterly News Strong Group Presence at SMM 2026 At SMM 2026 in Hamburg, G&O Maritime Group demonstrated the strength of its One Group approach through one of the most comprehensive trade fair presences to date. For the first time, FuelTech A/S and Global Boiler Services participated under the Group umbrella, reinforcing a coordinated market approach and a stronger collective presence. With a dedicated Product Zone highlighting the Group’s technologies and a Customer Care Zone designed for customer engagement and collaboration, the Group attracted significant visitor traffic and high-quality discussions throughout the exhibition Customer conversations throughout the week provided valuable insights into the priorities shaping the maritime industry. Energy efficiency, lifecycle extension of existing assets, digitalization and regulatory compliance emerged as recurring themes across discussions with shipowners, operators and technical stakeholders. These priorities align closely with the Group’s focus on helping customers improve operational performance while supporting the industry’s transition towards more sustainable and efficient operations Unlocking New Possibilities in Engine Design A key highlight was the unveiling of the latest compensator solution, which has been developed inhouse. This new model combines increased rotating mass, larger diameter construction and intelligent active control to deliver industry-leading excitation performance. The product launch event at the stand attracted strong interest from customers, partners and industry representatives and further demonstrated the Group’s commitment to innovation and technology leadership.
Stronger Presence, Stronger Position Beyond the exhibition floor, customer and partner events strengthened relationships and created opportunities for deeper business discussions. Overall, SMM 2026 successfully increased the visibility of G&O Maritime Group, strengthened customer engagement and showcased the value of bringing the Group’s companies together under one strong market presence.
4
Executive Board Board of Directors Jesper Teddy Lok, chairman Rune Lillie Gornitzka Bo Kristensen Kristian Verner Mørch Sameer Kalra Thomas Synnestvedt Knudsen
Anders Egehus Group CEO
Ibrahim Hassan CFO
Henning Høgh COO
Company information The Company
G&O Maritime Group A/S Lundtoftegårdsvej 95, 3. DK-2800 Kgs. Lyngby CVR No: 43 32 69 88 Financial period: 1 January - 30 September
Auditors
PricewaterhouseCoopers Statsautoriseret Revisionspartnerselskab Strandvejen 44 DK-2900 Hellerup
Kristoffer Buhl Larsen CCO
Louise Andreasen FuelTech CEO
Martin Lyager Hansen CSO
5
Group highlights
Group facts
Q3, 2026 Q3, 2025
Net revenue Propulsion Management
Headquarter in
Lyngby, Denmark
DKK 184 mio.
with operations worldwide
DKK 80 mio.
8 brands and
> 650 employees
DKK 736 mio.
DKK 24 mio.
DKK 33 mio.
DKK 20 mio.
9M 2025 Revenue: 549 mio.
DKK 20 mio.
Net revenue Service Management
9M 2026 adj. EBITDA:
DKK 101 mio.
DKK 33 mio.
9M 2025 adj. EBITDA: 99 mio.
DKK 59 mio.
6
DKK 184 mio.
Adjusted Group EBITDA
Net revenue Water & Waste Management
9M 2026 Revenue:
DKK 267 mio.
Net revenue Tank Management
DKK 30 mio.
across 5 countries and 13 locations
Group revenue
DKK 39 mio. Group EBIT
DKK 4 mio. DKK 19 mio.
Segment highlights Propulsion Management
Tank Management
63%
11%
of revenue
8%
Revenue, DKKm +40% CAGR
2025
2026
324
341
2024
2025
LTM Q3 2026
Group Revenue
Revenue, DKKm -11% CAGR
90 85 80
2024
582
2026
85
98
103
94
2024
2025
LTM Q3 2026
2024
701
739
2024
2025
925
LTM Q3 2026
198
224
2025
LTM Q3 2026
2024
2025
165
+15% CAGR 2023
2025
103 2024
7
2026
76
Group adjusted EBITDA
2025
2024
75
130 120 110
2023
-10% CAGR
195 190 185 180 175 170 165
2024
2026
+17% CAGR
840 820 800 780 760 740 720
18%
of revenue
Revenue, DKKm +12% CAGR
96 94 92 90 88 86
Service Management
of revenue
of revenue
Revenue, DKKm 460 440 420 400 380 360 340
Water &Waste Management
130
132
2025
LTM Q3 2026
LTM Q3 2026
Q3
CEO Update Orderbook grows further as the business tackles the impact of the closure of Hormuz
The geopolitical challenges in the Middle East continues to affect our boiler repair business negatively, and the temporary push of the global docking and repair patterns likewise. Measures have been taken to adjust the cost base. At the same time ordering of new tankers vessels are at a historic high level with positive impact on order intake for delivery in 2027 and beyond.
Q3 revenue
The integration of FuelTech is well underway to be concluded by the end of the year and allows resource sharing across the group in particular within Service, Commercial and R&D. The process has been smooth and has offered more opportunities and benefits than originally anticipated, positioning us a strengthened Group. This was evident also at the bi-annual SMM maritime exhibition held in September in Hamburg, where some 50,000 trade visitors from across the world attended.
Q3 adj.EBITDA
267 mio. 39 mio.
Ibrahim Hassan has joined as our new CFO, while Martin Lyager Hansen takes on the newly established role as Chief Service Officer. Martin brings extensive experience from the maritime service industry, including the past three years working in China, which serves as a solid foundation for expanding the service activities across our brands. We remain optimistic about the future given the solid activity levels in the industry, a very high number of newbuilding being ordered, which supports additional order book growth and high activity levels for most brands, with a set-up that is geared to support across all revenue streams.
The total new sales order book grew by 4% Y-o-Y
8
Management’s review As we enter the last and fourth quarter of the year, we reconfirm our updated guidance for full year 2026 as disclosed in the H1 report. We currently expect to land in the lower to middle part of the range. Revenue development in Q3 2026 G&O Maritime Group reported revenue of DKK 266.5 million in the third quarter of 2026, up 45% from DKK 183.6 million in Q3 2025. The increase was driven by the acquisition of FuelTech, which is part of the product segment. Adjusting for FuelTech in the Product segment, organic growth is -1%. Revenue in the Service business declined 45% compared to the same quarter last year, reflecting challenging market conditions, continued geopolitical uncertainty and the conflict in the Middle East. For 9M 2026, revenue amounted to DKK 735.6 million compared to DKK 549.0 million in 9M 2025, representing growth of 34%. FuelTech contributed by 49%, while the organic growth is -15%, largely driven by the service business.
Revenue per segment (DKK mio.)
Operating expenses increased following the FuelTech acquisition compared to same quarter last year. Operating expenses amounted to DKK 107.3 million in Q3 2026 and DKK 313.8 million in 9M 2026, compared to DKK 72.3 million and DKK 219.4 million, respectively, in the comparative periods. EBITDA and Earnings Performance Adjusted EBITDA amounted to DKK 39.1 million in Q3 2026, compared to DKK 32.6 million in Q3 2025. EBITDA margin is negatively impacted by the development in the service business. For 9M 2026, adjusted EBITDA amounted to DKK101.0 million compared to DKK 98.9 million in 9M 2025, corresponding to an adjusted EBITDA margin of 14% (9M 2025: 18%). While profitability improved
Q3 2026
DKK in thousands 59.3 mio.
2026 Q3
2025 Q3 124.3 mio.
233.9 mio.
Service Segment
significantly compared to Q1. However, earnings for the first nine months remain affected by challenging market conditions in certain regions. Excluding the service business, EBITDA margin is 16% in 9M 2026 compared to 17% in 9M 2025. The service business has realised an EBITDA margin of -2.2% in the first nine months of the year compared to 20% in the same period last year. Reported EBITDA amounted to DKK 36.9 million in Q3 2026 and DKK 82.4 million in 9M 2026. Special items amounted to DKK 18.6 million in 9M 2026, primarily relating to acquisition and integration activities associated with the FuelTech transaction. Order backlog The Product order backlog increased by 4% year-overyear reflecting a strong commercial execution and customer demand for our products. The increase in order backlog is also supported by a strong newbuilding market.
Summary of Financials (DKK thousands)
32.6 mio.
Production Segment
Gross margin and operating expenses Gross profit increased by 40% to DKK 146.4 million in Q3 2026 from DKK 104.9 million in Q3 2025, corresponding to a gross margin of 55% (Q3 2025: 57%). For 9M 2026, gross profit amounted to DKK 414.7 million compared to DKK 318.3 million in 9M 2025, with a gross margin of 56% (9M 2025: 58%).
Q3 2025
9 months 2026
9 months 2025
Full-year 2025
Revenue
266,503
183,630
735,614
548,971
738,639
Gross profit
146,432
104,900
414,748
318,325
429,433
Gross profit margin
55%
57%
56%
58%
58%
Proforma adj. EBITDA
39,139
32,624
100,997
98,931
130,097
Proforma adj. EBITDA margin
15%
18%
14%
18%
18%
EBIT
4,148
18,630
-4,343
43,767
50,672
EAT
-19,296
8,903
-49,149
-21,716
-34,140
Total assets
2,249,841
1,160,043
2,249,841
1,160,043
1,145,801
Equity
466,752
286,413
466,752
286,413
269,469
9
Working Capital and Cash Conversion Cash conversion was 136% in Q3, supported by a working capital release of DKK 22.3m in Q3, bringing the cash conversion for 9M 2026 to 50%. Cash flow from operating activities amounted to DKK 1.4m for 9M 2026 (Q3: DKK 26.3m), after net interest payments of DKK 43.0m, tax of DKK 16.1m and FuelTech-related transaction and integration costs of DKK 18.6m. Cash flow from investing activities primarily reflected the acquisition of FuelTech, while financing activities included proceeds from the Group’s bond issue and equity raise completed during the period.
Events after the date of financial position No subsequent events have occurred that materially affect the Group’s financial position. Significant risks The Group is exposed to geopolitical risks affecting the shipping industry in general. A slowdown in economic activity resulting from the current macroeconomic environment could adversely affect the Group’s business. In addition, the Group is to some extent exposed to financial risks, including interest rate, liquidity, currency, and credit risks.
Cash conversion (DKK mio.) 26%
131%
127%
-31%
136%
53 11
43
-16
41
39 33
31
43 16
Management continues to prioritise working capital optimisation, cash generation and successful integration of FuelTech. The improvement in cash conversion during Q3 continues to provide an encouraging indicator for the last quarter of the year as operational synergies are realised and profitability continues to improve.
130%
−6
15 −5
13
52
10
22
9 −6
−8
−27 −49
−5
−19
Development in quarterly proforma adjusted EBITDA 60.0
25%
50.0
Q2, 25
Q3, 25
Q4, 25
Q1, 26
Q2, 26
Q3, 26
20%
Adjusted EBITDA
40.0 15%
Change in NWC
Capex
Cash conversion
30.0
20.0
51.8
43.0 32.6
10%
39.1
31.2
5%
10.0
10.1 0.0
Q2,125 Quarterly EBITDA (DKK mio.)
Q3,225
Q4,3 25
Q1,426
5 26 Q2,
6 26 Q3,
Quarterly EBITDA margin (%)
10
0%
Cash conversion = (Adjusted EBITDA + Change in NWC - Capex) / Adjusted EBITDA.
Management statement The Board of Directors and Executive Board have discussed and approved the interim report of G&O Maritime Group for the period 1 January – 30 September 2026. The interim report, which has been neither audited nor reviewed by the Company’s auditors, has been prepared in accordance with IAS 34 ‘Interim Financial Reporting’ as adopted by the EU and additional disclosure requirements of the Danish Financial Statements Act. In our opinion, the interim report gives a true and fair view of the Group’s assets and liabilities and financial position at 30 September 2026 and of the results of the Group’s operations and cash flows for the period 1 January to 30 September 2026. Furthermore, in our opinion, the Management’s review includes a fair review of the development and performance of the business, the results for the period and of the Group’s financial position in general and describes the principal risks and uncertainties that the Group faces. Lyngby, 30 October 2026
Anders Egehus
Ibrahim Hassan
Group CEO
CFO
Henning Høgh COO
11
Q3 2026 financial statement 12
Income Statement Q3 2026
Q3 2025
9 months 2026
9 months 2025
Full-year 2025
Full-year 2024
266,503
183,630
735,614
548,971
738,639
502,613
0
0
0
0
-6,828
23,052
5,593
3,125
15,297
5,833
7,554
5,124
Cost of goods and service
-125,664
-81,855
-336,163
-236,479
-309,932
-207,109
Gross profit
146,432
104,900
414,748
318,325
429,433
323,680
DKK in thousands Revenue from contract with customers
Notes 2
Change in inventories of work in progress and finished goods Work on own account recognised in assets
Other operating income / expense
0
0
0
0
94
-467
Other external expenses
-21,890
-17,370
-64,447
-53,649
-64,887
-59,947
Staff costs
-85,403
-54,905
-249,304
-165,745
-234,543
-160,274
39,139
32,624
100,997
98,931
130,097
102,992
Operating result before depreciation, amortisation and special items (Adjusted EBITDA) Special item expenses
-2,249
-464
-18,616
-5,142
-5,624
-20,468
Operating result before depreciation and amortisation (EBITDA)
3
36,890
32,160
82,381
93,789
124,473
82,524
Depreciation and amortisation
-32,742
-13,530
-86,724
-50,022
-73,801
-50,224
4,148
18,630
-4,343
43,767
50,672
32,300
Operating profit before financial income and expenses (EBIT) Financial income
0
5
7,214
44
52
704
Financial expenses
-25,945
-11,245
-61,131
-70,064
-83,473
-34,377
Loss before tax
-21,797
7,390
-58,260
-26,253
-32,749
-1,373
Tax on profit / loss for the year Net loss for the year
2,501
1,513
9,111
4,537
-1,391
-5,391
-19,296
8,903
-49,149
-21,716
-34,140
-6,764
Q3 2026
Q3 2025
9 months 2026
9 months 2025
Full-year 2025
Full-year 2024
-19,296
8,903
-49,149
-21,716
-34,140
-6,764
Statement of other comprehensive income DKK in thousands Loss for the year
Notes
Items that may be reclassified to profit or loss:
Cash flow hedge for deferred gains/(losses) incurred during the period
0
0
0
0
24
-513
Exchange adjustment
3,254
-430
3,332
-3,340
-7,884
652
Other comprehensive income for the period, net of tax
3,254
-430
3,332
-3,340
-7,860
139
-16,042
8,473
-45,817
-25,056
-42,000
-6,625
Total comprehensive income Total comprehensive income for the year is attributable to:
G&O Maritime Group A/S
-16,042
8,473
-45,817
-25,056
-42,000
-6,625
Total
-16,042
8,473
-45,817
-25,056
-42,000
-6,625
13
Statement of financial position 30 September 2026
30 September 2025
31 December 2025
Goodwill
759,998
335,939
335,400
Share capital
Intangible assets
816,755
392,559
377,847
Retained earnings
Property, plant and equipment
55,602
45,828
44,622
Reserve for hedging transaction
Right of use assets
73,174
32,412
33,872
Deposit
10,097
1,964
2,149
Reserve for exchange rate conversion
Total non-current assets
1,715,626
808,702
793,890
Total equity
Inventories
245,825
155,319
141,015
Provisions
12,469
8,941
5,163
Trade receivables
195,182
123,337
126,399
Deferred tax liability
162,273
70,130
66,340
Other receivables
22,346
9,323
9,576
Borrowings
842,827
536,727
536,521
Contract assets
13,546
7,424
1,425
Earn-out, fair value
114,800
0
0
Prepayments
11,617
6,623
6,641
887
887
887
DKK in thousands
Notes
Cash and cash equivalents
45,699
49,315
66,855
Total current assets
534,215
351,341
351,911
2,249,841
1,160,043
1,145,801
Total assets
DKK in thousands
Other liabilities Lease liabilities Total non-current liabilities
30 September 2026
30 September 2025
31 December 2025
400
400
400
470,919
289,392
276,968
0
-24
0
-4,567
-3,355
-7,899
466,752
286,413
269,469
63,786
27,275
26,828
1,197,042
643,960
635,739
Lease liabilities
12,592
6,710
9,189
Borrowings
11,694
2,397
4,871
Contract liabilities
14
Notes
59,936
37,098
24,503
Intercompany
309,856
87,807
90,450
Payables to parent for joint taxation
20,780
8,635
11,610
Trade payables
127,149
58,042
69,161
Other liabilities
44,040
28,981
30,809
Total current liabilities
586,047
229,670
240,593
Total liabilities
1,783,089
873,630
876,332
Total equity and liabilities
2,249,841
1,160,043
1,145,801
Statement of cash flows DKK in thousands
Notes
Result of the period
9 months 2026
9 months 2025
Full-year 2025
-49,149
-21,716
-34,140
Adjustments
4
127,602
137,312
154,081
Change in working capital
4
-18,023
-11,011
2,348
7,214
44
52
Interest paid
-50,221
-70,064
-53,549
Income taxes paid/received
-16,060
0
-7,191
1,363
34,565
61,601 -4,873
Interest received
Cash flow from operating activities Purchase of property, plant and equipment
-10,756
-4,246
-744,461
0
0
Intangible assets
-22,102
-10,667
-15,377
Cash flow from investing activities
-777,319
-14,913
-20,250
Acquisition of businesses
6
Repayment of other long-term debt
0
0
0
Borrowing
4
6,626
-40,915
-40,952
Proceeds from bond issuing
4
295,593
0
0
243,100
0
0
Repayment of intercompany
0
1,959
0
Proceeds from intercompany
219,406
0
0
-9,925
-7,783
-9,946
Cash capital increase from shareholders
Principal elements of lease payments Cash flow from financing activities
4
754,800
-46,739
-50,898
Cash flow for the period
-21,156
-27,087
-9,547
Cash and cash equivalents at the beginning of the financial period
66,855
76,402
76,402
Cash and cash equivalents at end of period
45,699
49,315
66,855
Acquisition of businesses is presented net of cash acquired.
15
Statement of changes in Equity 1 JANUARY - 30 SEPTEMBER 2026 In thousands DKK At 1 January 2026
Share capital
Reserve for exchange rate conversion
Reserve for hedging transaction
Retained earnings
Total equity
TDKK
TDKK
TDKK
TDKK
TDKK
400
-7,899
0
276,968
269,469
Profit/loss for the year
0
0
0
-49,149
-49,149
Group contribution
0
0
0
243,100
243,100
Other comprehensive income At 30 September 2026
0
3,332
0
0
3,332
400
-4,567
0
470,919
466,752
During the period no dividend was paid.
1 JANUARY - 30 SEPTEMBER 2025 In thousands DKK
At 1 January 2025 Profit/loss for the year Capital increase Other comprehensive income At 30 September 2025
Share capital
Reserve for exchange rate conversion
Reserve for hedging transaction
Retained earnings
Total equity
TDKK
TDKK
TDKK
TDKK
TDKK
40
-15
-24
311,468
311,469 -21,716
0
0
0
-21,716
360
0
0
-360
0
0
-3,340
0
0
-3,340
400
-3,355
-24
289,392
286,413
During the period no dividend was paid.
1 JANUARY - 31 DECEMBER 2025 In thousands DKK
At 1 January 2025 Profit/loss for the year Capital increase Other comprehensive income At 31 December 2025
Share capital
Reserve for exchange rate conversion
Reserve for hedging transaction
Retained earnings
Total equity
TDKK
TDKK
TDKK
TDKK
TDKK
40
-15
-24
311,468
311,469 -34,140
0
0
0
-34,140
360
0
0
-360
0
0
-7,884
24
0
-7,860
400
-7,899
0
276,968
269,469
During the period no dividend was paid.
16
Note 1 - Segment information In thousands DKK
9 months 2026
9 months 2025
Product segment
Service segment
Revenue from contract with customers
632,864
102,750
735,614
387,628
161,343
548,971
Cost of goods and service
-253,673
-67,193
-320,866
-134,134
-96,512
-230,646
379,191
35,557
414,748
253,494
64,831
318,325
Gross Profit Other operating income / expense
Total
Product segment
Service segment
Total
0
0
0
0
0
0
Other external expenses
-54,040
-10,407
-64,447
-43,241
-10,408
-53,649
Staff costs
-221,885
-27,419
-249,304
-144,165
-21,580
-165,745
Operating result before depreciation, amortisation and special items (Adjusted EBITDA)
103,266
-2,269
100,997
66,088
32,843
98,931
Special item expenses
-18,616
-5,142
Profit/loss before financial income and expenses
82,381
93,789
Depreciation and amortisation
-86,724
-50,022
Operating profit before financial income and expenses (EBIT)
-4,343
43,767
Financial items, net
-53,917
-70,020
Profit/loss before tax
-58,260
-26,253
Tax on profit/loss for the year Net profit/loss for the year FuelTech has been added to the Propulsion Management division and is recognised as part of the Product Segment.
17
9,111
4,537
-49,149
-21,716
Note 2 - Revenue from contacts with customers In thousands DKK
9 Months 2026
9 Months 2025
Product segment
Service segment
Propulsion Management
499,661
Tank Management
77,468
Water & Waste Management
55,735
Revenue from business segments
Service Management Total
Total
Product segment
Service segment
Total
0
499,661
259,508
0
259,508
0
77,468
72,767
0
72,767
0
55,735
55,353
0
55,353
0
102,750
102,750
0
161,343
161,343
632,864
102,750
735,614
387,628
161,343
548,971
Service segment
Total
Product segment
Service segment
Total 386,849
In thousands DKK
9 Months 2026
9 Months 2025
Revenue from type of goods and service
Product segment
Product sale
592,048
24,749
616,797
352,847
34,002
Service sales
40,816
78,001
118,817
34,781
127,341
162,122
632,864
102,750
735,614
387,628
161,343
548,971
Service segment
Total
Product segment
Service segment
Total 386,849
Total In thousands DKK
9 Months 2026
9 Months 2025
Over time/Point in time
Product segment
Revenue recognised at a point in time
592,048
24,749
616,797
352,847
34,002
40,816
78,001
118,817
34,781
127,341
162,122
632,864
102,750
735,614
387,628
161,343
548,971
Service segment
Total
Product segment
Service segment
Total
Revenue recognised over time Total In thousands DKK
9 Months 2026
9 Months 2025
Geographical regions
Product segment
APAC
385,749
16,295
402,044
185,118
5,060
190,178
Europe
182,051
47,666
229,717
164,189
7,481
171,670
Rest of world
65,064
38,789
103,853
38,321
148,802
187,123
Total
632,864
102,750
735,614
387,628
161,343
548,971
18
Note 3 - Special Items In thousands DKK
9 months 2026
9 months 2025
M&A and integration cost
16,236
2,998
Strategic market studies
0
600
Extraordinary staff expenses Adoption of IFRS and other related costs
580
0
0
785
Other special items
1,800
759
Total
18,616
5,142
If special item expenses had been recognized in adjusted EBIDTA, it would have been recognized as followed: In thousands DKK Cost of goods sold Other external expenses Staff expenses Total
9 months 2026
9 months 2025
124
530
17,962
4,612
530
0
18,616
5,142
19
Note 4 - Cash flow specifications In thousands DKK
Note 5 - Financial assests and liabilities 1-5 years
Trade receivables
195,182
0
0
195,182
195,182
Other receivables
35,892
0
0
35,892
35,892
Cash and cash equivalents
45,699
0
45,699
45,699
9M 2026
2025
Change in current liabilities, such as trade payables, deferred income, etc
-14,274
-11,284
Change in receivables, such as trade receivables, contract assets, etc.
9,033
12,777
Change in inventories
-15,690
7,556
Change in provisions
2,908
-6,701
Change in working capital
-18,023
2,348
Derivative financial assets
In thousands DKK
9M 2026
2025
Total Financial assets
Financial income
-7,214
-52
Financial expenses
Total Over 5 contractual years cash flow
Within 1 year
In thousands DKK
Carrying amount
9 Months 2026 Non-derivative financial assets
Derivatives
0
0
0
0
0
276,773
0
0
276,773
276,773
Non-derivative financial liabilities
61,131
83,473
Lease liabilities
18,026
42,966
36,911
97,903
76,378
86,724
73,801
Borrowing
12,462
12,448
10,635
35,545
31,730
-9,111
1,391
Trade payables and other payables
171,189
0
0
171,189
171,189
Other adjustments
-3,928
-4,532
Adjustment
127,602
154,081
Bond
65,100
904,166
0
969,266
822,791
Total Financial liabilities
266,777
959,580
47,546
1,273,903
1,102,088
In thousands DKK
Within 1 year
1-5 years
Total Over 5 contractual years cash flow
Carrying amount
Depreciations, amortisation and impairment losses Tax on profit/Loss of the year
The above cannot be derived directly from the statement of financial position as movements in working capital components from acquisitions is from acquisition date
In thousands DKK
Intercompany
Bond
Borrowings
Leases
Total
2025
Net debt: At January 2025
Non-derivative financial assets
85,857
514,688
65,350
29,911
695,806
Cash flows
0
0
-40,952
-9,946
-50,898
Trade receivables
126,399
0
0
126,399
New lease
0
0
0
16,322
16,322
Other receivables
11,001
0
0
11,001
11,001
4,593
2,305
0
-270
6,628
Cash and cash equivalents
66,855
0
0
66,855
66,855
At December 2025
90,450
516,993
24,398
36,017
667,858
At January 2026
90,450
516,993
24,398
36,017
667,858
Cash flows
219,406
295,594
6,626
-9,925
511,701
New lease
0
0
0
50,286
50,286
Non-derivative financial liabilities
Other changes
0
10,204
706
0
10,910
309,856
822,791
31,730
76,378
1,240,755
Lease liabilities Borrowing
Other changes
At September 2026
126,399
Derivative financial assets Derivatives Total Financial assets
20
0
0
0
0
0
204,255
0
0
204,255
204,255
11,367
22,157
10,293
43,817
36,017
3,193
12,523
12,584
28,300
24,398
Trade payables and other payables
99,970
0
0
99,970
99,970
Bond
39,921
636,758
0
676,679
516,994
Total Financial liabilities
154,451
671,438
22,877
848,766
677,379
Note 6 - Acquisitions of enterprises Acquisitions
Purchase price
2026
Cash
Eltronic FuelTech A/S
Transaction and integration costs
On 19 February 2026, the Group entered into an agreement to acquire 100% of the shares in Eltronic FuelTech A/S, a Group specialising in dual-fuel systems enabling vessels to operate on alternative fuels such as methanol and ammonia, with a strong focus on safety, efficiency, and reliability.
Costs incurred to complete the transaction has totalled MDKK 16.2 year to date. Of this amount, MDKK 3.1 relates to integration costs incurred following the acquisition until this reporting date, primarily relating to the IT carve-out from Eltronic Group. Transaction and integration costs are recognised as part of special items.
FuelTech is headquartered in Denmark, with sales office in China and a production footprint in South Korea. The transaction became effective from 16 March 2026, and G&O Maritime Group obtained control and began consolidation of the business from that date.
Strategic rationale and synergies The acquisition of FuelTech was attractive for G&O Maritime Group from a strategic, operational and financial angle. It supports the Group Strategy’s growth ambitions, enhances the top- and bottom-line growth profile and expands the Group’s footprint to South Korea closer to existing customers and business partners. The acquisition comprises a significant share of the Group’s total financials adding approx. 56% revenue growth to the 2025 actual revenue based on latest available financials. The goodwill arising from the acquisition consists largely of synergies across several areas between the Group and the acquired as the partnership will strengthen commercial initiatives across brands, operations and overheads.
Consideration The consideration transferred to acquire the shares in FuelTech amounted to MDKK 747.9. In addition to the consideration transferred the purchase price agreement includes 4 separate earn-outs. The earn-out periods cover four financial years through 31 December 2029. The initial recognition of the fair value of earn-outs is valued at MDKK 114.8, of which the total portion is classified as other long-term debt.
Fair value of acquired net assets and goodwill The purchase price allocation of the fair value of identified assets, liabilities and contingent liabilities recognised in this interim report is provisional and subject to changes. Acquired goodwill totalling MDKK 421.9 is not deductible for tax purposes.
In thousands DKK 747,882
Fair value of earn-out
114,800
Total purchase consideration
862,682
Property, plant & equipment
7,816
Development projects
3,247
Deposits Customer relations
971 378,400
Order Backlog
73,100
Technology/Know-how
26,100
Inventory
89,120
Trade receivables
107,285
Other receivables
3,080
Contract assets
4,186
Cash
3,421
Provisions
-4,398
Corporate tax
-24,786
Deferred tax liability
-105,491
Trade payables
-42,404
Prepayments
-19,127
Deferred revenue
-22,753
Financial leases
-391
Other payables
-36,643
Net identifiable assets acquired
440,733
Goodwill arising from acquisition
421,949
Net asset acquired
862,682
Financial impact of acquisition
Receivables
Based on the latest available public financial information, revenue and profit for 2025 would have been MDKK 1,152 and MDKK 28,8 respectively. Please refer to guidance for a 2026 view on combined results.
The fair value of the acquired trade receivables is MDKK 107,3. The carrying amount of the trade receivables corresponds to the fair value. The Management expects to collect the contractual cash flow.
21
Accounting policy The unaudited condensed consolidated interim financial statements have been prepared in accordance with IAS 34 Interim Financial Reporting as issued by the International Accounting Standards Board (IASB) and adopted by the EU and additional Danish disclosure requirements for interim financial reporting of listed companies. The accounting policies applied are consistent with the accounting policies set out in the Annual Report 2025. The audited annual financial statement for 2025 was published on 27th April 2026 and is available on the company website.
22
G&O Maritime Group drives maritime innovation with advanced, future‑ready solutions. G&O Maritime Group
We deliver high‑performance sub‑systems that enable shipowners, shipyards and designers to enhance efficiency, optimise operations, and prepare for the future.
13 different G&O Group locations
Service partners
19 different locations
With the addition of FuelTech A/S, a leading specialist in advanced fuel‑supply systems for alternative green fuels such as methanol and ammonia, we further strengthen our position as a leading niche supplier to the global maritime industry.
Headquartered in Lyngby, Denmark with opeations worldwide
Built on deep expertise within Propulsion, Tank, Water & Waste, and Service Management, our world‑class service organisation allows us to work closer—as one Group and alongside you—to create value today while shaping the future of shipping together.
8 brands and > 650 employees across 5 countries and 13 locations
Because being closer takes us further.
23
Brands
In March 2026, FuelTech joins forces with G&O Maritime Group. A strong addition to the Propulsion Management Segment. FuelTech specialises in dual–fuel systems enabling vessels to operate on alternative fuels such as methanol and ammonia, with a strong focus on safety, efficiency, and reliability.
Compensators engineered to eliminate propeller and main engine induced vibrations, enabling full utilisation of the RPM range. This enhances crew comfort and safety, optimises fuel efficiency, and minimises long-term maintenance costs.
Piston rod stuffing boxes for two-stroke engines continuously improved to live up to new fuel types entering the market. A trusted partner who delivers quality on time and has a sustainable profile.
Leading global provider of cylinder lubrication systems for two-stroke marine engines, ensuring up to 55% lube oil savings, improved engine reliability and reduced emissions.
Valves and venting equipment reducing emissions from cargo ensuring cost savings due to reduction of cargo vapour loss during voyage and safety for the crew and the environment.
Incineration of waste and oil sludge, to achieve lower operational costs and reduced environmental impact, while experiencing a 15% higher burning capacity compared to similar marine incinerators.
Propulsion Management
Biologically cleaning of grey and black wastewater before it is discharged. To achieve a reduced impact on marine eco systems and a lower cost of ownership.
Specialised 24/7 solutions for the maintenance, repair, and optimisation of marine boilers. Expertise in boiler systems, automation, and spare parts ensures reliable operations, minimised downtime, and enhanced efficiency for vessel performance.
Tank Management Water &Waste Management Service Management
24
Colophon Headquarters, Denmark: Lundtoftegårdsvej 95, 3. DK-2800 Kgs. Lyngby Denmark
Website: www.gomaritimegroup.com/
Linkedin: G&O Maritime Group