Edmonton Smart Bus Project Variable Speed Limit Evaluation Climate Uncertainty & Asset Management Aboiteau Exhibit: Université de Moncton
2017 | W INTER/HIVER WINTER/HIVER
Intelligent Transportation Systems
Publications Mail Agreement #40065710
Les systèmes de transport intelligents
www.csce.ca CIVIL_Winter2017_LAZ.indd 1
2017-12-05 1:33 PM
Get more out of your membership benefits. Get preferred rates and coverage that fits your needs.
You could save with preferred rates on your home and car insurance.
Get more out of your Canadian Society for Civil Engineering membership. As a member of the Canadian Society for Civil Engineering, you have access to the TD Insurance Meloche Monnex program. This means you can get preferred insurance rates on a wide range of home and car coverage that can be customized for your needs. For over 65 years, TD Insurance has been helping Canadians find quality home and car insurance solutions.
Endorsed by
Feel confident your home and car coverage fits your needs. Get a quote now.
HOME | CAR | TRAVEL
Get a quote and see how much you could save! Call 1-866-269-1371 Or, go to tdinsurance.com/csce The TD Insurance Meloche Monnex program is underwritten by SECURITY NATIONAL INSURANCE COMPANY. It is distributed by Meloche Monnex Insurance and Financial Services, Inc. in Quebec, by Meloche Monnex Financial Services Inc. in Ontario, and by TD Insurance Direct Agency Inc. in the rest of Canada. Our address: 50 Place Cremazie, 12th Floor, Montreal, Quebec H2P 1B6. Due to provincial legislation, our car and recreational insurance program is not offered in British Columbia, Manitoba or Saskatchewan. *Nationally, 90% of all of our clients who belong to a professional or alumni group that has an agreement with us and who insure a home (excluding rentals and condos) and a car on October 31, 2016, saved $625 when compared to the premiums they would have paid without the preferred insurance rate for groups and the multi-product discount. Savings are not guaranteed and may vary based on the client’s profile. Savings vary in each province and may be higher or lower than $625. Wide Horizons Solution® Travel Insurance is underwritten by Royal & Sun Alliance Insurance Company of Canada and distributed in some provinces by RSA Travel Insurance Inc., operating as RSA Travel Insurance Agency in British Columbia. All trade marks are the property of their respective owners. ® The TD logo and other TD trade-marks are the property of The Toronto-Dominion Bank.
2908-0817_AMG_CSCE_8-375x10-75in_EN.indd 1 CIVIL_Winter2017_LAZ.indd 2 1 Civil_MelocheMonnex_Fall.indd
9/6/17 12:45 PM 2017-12-05 2017-09-08 1:33 10:59PM AM
contents WINTER 2017/HIVER2017 | VOLUME 34.5
IN VIEW: PROJECT/PROJET EN VEDETTE 14 The 3D Turcot Interchange: Virtual Engineering/ L’Échangeur Turcot 3D : L’ingénierie virtuelle HISTORIC CIVIL ENGINEERING SITE/LIEU HISTORIQUE DE GÉNIE CIVIL 10 The Aboiteau/L’Aboiteau
SUSTAINABLE INFRASTRUCTURE/ LES INFRASTRUCTURES DURABLES
11 Managing assets in the context of future climate uncertainty/ La gestion des actifs dans l’incertitude du climat du futur
TECHNICAL: INTELLIGENT TRANSPORTATION SYSTEMS/TECHNIQUE: LES SYSTÈMES DE TRANSPORT INTELLIGENTS 18 From the Technical Editor 19 Measuring traffic conditions using Transit GPS Data 22 Proactive VSL field operation test
NEWS, VIEWS & DEPARTMENTS NOUVELLES, POINTS DE VUE ET RUBRIQUES 4 President’s perspective/
Perspective présidentielle 6 From the regions: Ontario Region/Région de l’Ontario 7 Student voice/La voix des étudiants 8 Young professionals corner/Le coin des jeunes professionnels 30 CSCE partners and sponsors/ Associés et commanditaires SCGC
24 Web-Mining-Based Traffic Analytics 28 Real-Time Signal Control for Large Urban Networks
14
c. in itish 016, each g as
23
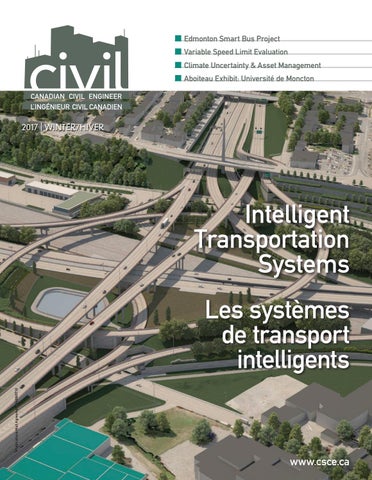
8 On the cover: Turcot Interchange simulation (courtesy WSP)
Canadian Civil Engineer | Winter 2017
3
12:45 PM
08 10:59 AM
CIVIL_Winter2017_LAZ.indd 3
2017-12-05 1:33 PM
PRESIDENT’S PERSPECTIVE | PERSPECTIVE DE LA PRÉSIDENTE
Susan Tighe, Ph.D., P.Eng. PRESIDENT, CSCE/PRÉSIDENTE SCGC PRESIDENT@CSCE.CA
CSCE/SCGC 521-300, rue St-Sacrement Montreal, Québec H2Y 1X4 Tel.: 514-933-2634, Fax: 514-933-3504 E-mail: mahmoud.lardjane@csce.ca www.csce.ca PRESIDENT/PRÉSIDENTE Susan Tighe, Ph.D., P.Eng.
MANAGING EDITOR/ DIRECTEUR DE LA RÉDACTION Doug Picklyk Tel.: 416-510-5119 dpicklyk@ccemag.com ADVERTISING SALES/ PUBLICITÉ Maureen Levy Tel: 416-510-5111 mlevy@ccemag.com ART DIRECTOR/ COMPOSITION ARTISTIQUE Lisa Zambri Tel: 416-442-5600 x3595 Annual Subscription Rates/Abonnement annuel Canada & U.S./E.U. $35.00, Other countries/Autres pays $45.00; Single copy/Un numéro $7.50; Agency discount/Rabais au distributeurs 10% PUBLICATION ISSN 9825-7515 RETURN ADDRESS/ADRESSE DE RETOUR : The Canadian Society for Civil Engineering La Société Canadienne de Génie Civil 521-300, rue St-Sacrement Montreal, Québec H2Y 1X4 Canadian Civil Engineer (CCE) is published five times per year by the Canadian Society for Civil Engineering (CSCE). L’ingénieur Civil Canadien (ICC) est publié cinq fois par année par la Société Canadienne de Génie Civil (SCGC). The opinions expressed in the papers are solely those of the authors and the Canadian Society for Civil Engineering is not responsible for the statements made in this publication. Les opinions exprimées dans les articles sont la seule responsabilité de leurs auteurs et la Société canadienne de génie civil n’engage pas sa responsabilité dans les propos exprimés. CIVIL Magazine is produced by the publishers of Canadian Consulting Engineer Magazine, published by Annex Publishing & Printing Inc. Le magazine Civil est produit par l’editeur de la publication Canadian Consulting Engineer qui est publie par Annex Publishing & Printing Inc.
Annex Publishing & Printing Inc., 80 Valleybrook Drive, Toronto, Ontario M3B 2S9 Tel.: 416-442-5600; Fax: 416-510-5140 PUBLICATIONS MAIL AGREEMENT/POSTES CANADA ENREGISTREMENT #40065710
4
CIVIL_Winter2017_LAZ.indd 4
Fall Activities:
Making progress and our presence with other organizations
I
am now at the midpoint of my term as President, and the past few months have been rather busy. With the elimination of the Executive Director role earlier this year, it has resulted in some additional responsibilities. Firstly, we are very fortunate to have a very dedicated staff in the CSCE national office. I am also grateful to the other executive members for assisting with this transition. A Task Force, led by Past President, Jim Gilliland is now working hard to re-examine roles and responsibilities with the ultimate goal of making the national office stronger and relevant for the changing needs of the organization. I look forward to seeing the outcome of that exercise. This fall also resulted in various CSCE representatives attending the new brother/sister organization annual meetings. In early October Adrian Munteanu, VP Ontario Region attended the Canadian Geotech- innovative nical Society meetings in Ottawa. A little later in the month, Glenn communication Hewus President Elect attended the American Society of Civil Engineering (ASCE) Annual conference in New Orleans. Michel tool, THE HUB Khouday, Senior Vice President of CSCE, Canadian Senator Rosa Galvez and our National Lecture Tour speaker, Chris Olidis Principal Engineer with Applied Research Associates and myself participated in a CSCE-sponsored Panel Session on Public Private Partnerships (PPP). The event was a huge success with very positive feedback. I also attended the CSCE Hong Kong Branch (HKB) Annual Dinner 2017 cum Canada 150. Brian Burrell, Vice President International also attended on October 26, 2017. The annual dinner was attended by over 200 people and was fantastic. There were a number of high-ranking dignitaries at the event, including Canada’s Consul General at Consulate General of Canada in Hong Kong. The Branch did a wonderful job of raising the CSCE (and Canadian) flags; indeed, the leadership team is to be commended! The fall workshop and meeting of the Board of Directors was held November 4 -5, 2017. The workshop, led by President-Elect Glenn Hewus, focused on Communication. The Board meeting discussed upcoming conferences and our exciting Membership Renewal Blitz among various other issues. The Board also recognized the loss of Dr. Todd Chan as a great ambassador of our society. He is sadly missed.
Hiver 2017 | L’Ingénieur civil canadien
2017-12-05 1:33 PM
PRESIDENT’S PERSPECTIVE | PERSPECTIVE DE LA PRÉSIDENTE
Results of the survey on the new innovative communication tool, THE HUB, are currently being analyzed. And we are working on ensuring THE HUB greatly improves and expands the CSCE website, while providing a Professional Network for members and it will complement a new loyalty initiative program geared towards all members. I am very grateful to serve with a very engaged executive and board as well as countless volunteers from across the country. As
a previous President said, Be Seen, Be Heard, Be Relevant, and I would add, Be Proud!!! Susan Tighe, Ph.D., P.Eng. is Deputy Provost and Associate Vice-President Integrated Planning and Budgeting and the Norman McLeod Professor in Sustainable Pavement Engineering at the University of Waterloo.
Activités automnales :
progrès réalisés et présence auprès d’autres organisations
J
e suis maintenant au milieu de mon mandat, et les derniers mois ont été plutôt chargés. La suppression de la fonction de directeur exécutif plus tôt cette année a entraîné certaines responsabilités supplémentaires. Aussi, nous sommes très chanceux d’avoir pu compter sur un personnel très dévoué au bureau national de la SCGC pour nous adapter à ce changement. Je suis également reconnaissante aux autres membres exécutifs d’avoir contribué à bien gérer cette transition. Un groupe de travail, dirigé par le président sortant, Jim Gilliland, réexamine les rôles et les responsabilités du personnel dans le but ultime de renforcer le bureau national et de le rendre plus pertinent pour les besoins changeants de l’organisation. J’ai hâte de voir le résultat de cet exercice. Cet automne, divers représentants de la SCGC ont assisté aux réunions annuelles d’organisations soeurs. Au début d’octobre, Adrian Munteanu, Vice-président de la Région de l’Ontario, a assisté aux réunions de la Société canadienne de géotechnique à Ottawa. Un peu plus tard, le président élu Glenn Hewus a assisté à la conférence annuelle de l’American Society of Civil Engineering (ASCE) à la Nouvelle-Orléans. Michel Khouday, Premier vice-président de la SCGC, la sénatrice canadienne Rosa Galvez et Chris Olidis, ingénieur en chef d’Applied Research Associates et moi-même avons participé à une réunion d’experts sur les partenariats public-privé (PPP) parrainée par la SCGC. L’événement a eu un très grand succès et a suscité des commentaires très positifs. J’ai également pris part au dîner annuel 2017 de la succursale de la SCGC de Hong Kong (HKB) célébrant aussi les 150 ans du Canada le 26 octobre 2017 en compagnie de Brian Burrell, Vice-président, International. L’événement a attiré plus de 200 personnes et fut fantastique. Un certain nombre de dignitaires de haut rang, dont le Consul général du Canada à Hong Kong, y ont
Canadian Civil Engineer | Winter 2017
CIVIL_Winter2017_LAZ.indd 5
assisté. La succursale a accompli un excelle nouvel lent travail de promotion de la SCGC (et du Canada). Son équipe de direction doit outil de en être félicitée! communication L’atelier d’automne et la réunion du conseil d’administration ont eu lieu du 4 au innovant le HUB 5 novembre 2017. L’atelier, dirigé par le président élu Glenn Hewus, portait sur la communication. Le Conseil a discuté, en autres, des conférences à venir et de notre campagne de renouvellement des adhésions. Le Conseil a également rendu hommage à la mémoire du Dr Todd Chan en tant que grand ambassadeur de notre société. Il nous manque beaucoup. Les résultats de l’enquête sur le nouvel outil de communication innovant le HUB sont en cours d’analyse. Et nous nous attelons à faire en sorte que le HUB améliore et élargisse grandement le site Web de la SCGC. Il offrira aux membres un réseau professionnel et il viendra compléter un nouveau programme d’initiatives de fidélisation destiné à tous nos membres. Je suis très reconnaissante de travailler avec un exécutif et un conseil d’administration très engagés ainsi qu’avec d’innombrables bénévoles de partout au pays. Comme a dit un ancien président, soyez vus, soyez entendus, soyez pertinents, et j’ajouterais, soyez fiers! Susan Tighe, Ph.D., P.Eng., est vice-rectrice et vice-présidente associée, Planification intégrée et budgétisation et professeure Norman McLeod en ingénierie des chaussées durables à l’Université de Waterloo
5
2017-12-05 1:33 PM
FROM THE REGIONS: SECTION NEWS | DE NOS RÉGIONS : NOUVELLES DES SECTIONS
Ontario Region: Canada 150 years Adrian Munteanu, P.Eng., MCSCE VICE-PRESIDENT ONTARIO REGION, CSCE
C
anada 150 is a significant anniversary for our country but also for our profession. The civil engineering profession is celebrating 130 years…it was in 1887 when civil engineering was recognized as a profession, when the Parliament approved the Charter of then the newly born Canadian Society of Civil Engineers. In that spirit, the Ontario Region celebrated our country and our profession with lots of activities and fun at our sections and student chapters, out of which, I’d like to mention two events that were quite successful here in the National Capital: the 1st Annual Interactive Civil Engineering Symposium, and the new updated and upgraded Civil Engineering Exhibition “Building Canada”. The 1st Annual Interactive Civil Engineering Symposium was held
at the University of Ottawa campus on February 4th. It was a joint effort between the American Concrete Institute (ACI) – Ottawa Chapter and the CSCE National Capital Section (NCS). People had the opportunity to network and meet with different professionals and industry leaders in both a technical and casual environment. It included a few projects/professional presentations from the Ottawa region in the morning, and a volleyball tournament in the afternoon – it was a great success. Invitations to the 2nd Annual Interactive Civil Engineering Symposium, 2018 will be launched soon. Our History Committee, together with the NCS, took old posters the society had featuring infrastructure across Canada and updated them with new projects and created the exhibition “Building Canada.” The City of Ottawa and the University of Ottawa were also engaged to include interesting local projects and to reflect on engineering education. The exhibition was held at Ottawa City Hall for a month in the middle of summer and was well appreciated by the visitors. Many thanks to Alan Perks (History Committee) for his effort in creating this exhibition and for the interesting facts he provided to the visitors. We sure had some fun with this exhibition, Al!
Région de l’Ontario: Canada – 150 ans Adrian Munteanu, P.Eng., MSCGC VICE-PRÉSIDENT, RÉGION DE L’ONTARIO, SCGC
L
’anniversaire des 150 ans du Canada est important pour notre pays mais aussi pour notre profession. Celle-ci célèbre ses 130 ans ... c›est en 1887 que le génie civil a été reconnu comme une profession, lorsque le parlement a approuvé la charte de la toute nouvelle Société canadienne des ingénieurs civils. Dans cet esprit, la région de l’Ontario a célébré notre pays et notre profession avec beaucoup d’activités et de plaisir dans nos sections et nos chapitres étudiants. J’aimerais mentionner deux événements qui ont eu beaucoup de succès dans la capitale nationale: le 1er Symposium interactif annuel sur le génie civil et la nouvelle exposition sur le
The Organizing Team of the 1st Annual Interactive Civil Engineering Symposium. L’équipe organisatrice du 1er Symposium annuel interactif de génie civil.
6
CIVIL_Winter2017_LAZ.indd 6
génie civil «Building Canada» mise à jour et améliorée. Le 1er symposium interactif annuel sur le génie civil s’est tenu sur le campus de l’Université d’Ottawa le 4 février. Il s’agissait d’un effort conjoint entre la Section d’Ottawa de l’American Concrete Institute (ACI) et la Section de la capitale nationale (SNCS) de la SCGC. Les participants ont eu l’occasion de réseauter et de rencontrer différents professionnels et leaders de l’industrie dans un environnement technique et décontracté. Le programme du symposium comprenait quelques projets et des présentations professionnelles de la région d’Ottawa le matin et un tournoi de volleyball l’après-midi. L’événement a eu un grand succès. Les invitations au 2e symposium annuel interactif de génie civil 2018 seront bientôt lancées. En collaboration avec la section de la capitale nationale, notre Comité d’histoire a mis à jour de vieilles affiches illustrant des infrastructures de partout au Canada avec de nouveaux projets et a mis sur pied l’exposition «Building Canada». La ville d’Ottawa et l’Université d’Ottawa ont également inclus des projets locaux intéressants et ont présenté des réflexions sur l’enseignement de l’ingénierie. L’exposition a eu lieu à l’hôtel de ville d’Ottawa pendant un mois durant l’été et fut très appréciée des visiteurs. Un grand merci à Alan Perks (Comité d’histoire) pour ses efforts dans la création de cette exposition et pour les faits intéressants qu’il a fournis aux visiteurs. Nous nous sommes bien amusés avec cette exposition, Al!
Hiver 2017 | L’Ingénieur civil canadien
2017-12-05 1:33 PM
THE STUDENT VOICE | LA VOIX DES ÉTUDIANTS
Why a dynasty is not a guarantee of the future? Daniel Charron-Drolet, PRESIDENT, CSCE STUDENT CHAPTER, LAVAL UNIVERSITY
T
he student chapter of Université Laval was named the best student chapter in the country for six consecutive years between 2003 and 2008. This culture of excellence should ensure a good continuity for the future. However, a lack of leadership and vision in recent years has limited the number and quality of organized activities and has stopped the recruitment of new chapter members. At the end of the 2016 winter session, the student chapter did not have a single member. That’s when I entered the scene. After one year in the job market, I decided to undertake graduate studies in civil engineering. Being a member of the Quebec section committee and having a foothold at Laval University, I was given the mandate to rebuild the Laval University student chapter. At the start of the fall 2016 term, with the help of PhD student Gilberto Cidreira Keserle, we signed up undergraduate students. This Continued on page 8
Pourquoi une dynastie n’est pas un gage du futur? Daniel Charron-Drolet PRÉSIDENT, CHAPITRE ÉTUDIANT SCGC, UNIVERSITÉ LAVAL
L
e chapitre étudiant de l’Université Laval a été nommé le meilleur chapitre étudiant au pays 6 années consécutives entre 2003 et 2008. Cette culture d’excellence devrait assurer une bonne continuité pour l’avenir. Cependant, un manque de leadership et de vision dans les dernières années a limité le nombre et la qualité des activités organisées et a carrément interrompu le recrutement de nouveaux membres du chapitre. Au terme de la session d’hiver 2016, le chapitre étudiant n’avait plus un seul membre. C’est à ce moment que j’entre en scène. Après 1 an sur le marché du travail, j’ai décidé de poursuivre mes études au 2e cycle en génie civil. Faisant partie du comité de la section de Québec et ayant un pied à terre à l’Université Laval, j’ai eu comme mandat de reconstruire le chapitre étudiant de l’Université Laval. Suite à la page 8
Canadian Civil Engineer | Winter 2017
CIVIL_Winter2017_LAZ.indd 7
Civil_Winter17_Aegion.indd 1
7
2017-11-14 1:27 PM
2017-12-05 1:33 PM
THE STUDENT VOICE | LA VOIX DES ÉTUDIANTS Suite de la page 7
Continued from page 7
enabled the chapter to orDès le début de la sesganize several activities, sion d’automne 2016, such as training sessions avec l’aide du doctoron SAFI software, a tour ant Gilberto Cidreira of the Canam-Ponts plant Keserle, nous avons in Quebec City and a site recruté des étudiants visit of the new Chamdu 1er cycle. Le replain Bridge in collabocrutement a permis ration with the Montreal au chapitre d’organisLeaders from different CSCE Student Chapters who participated in the Student Chapter section. er plusieurs activités, The chapter’s executive Leaders Workshop Dirigeants de divers chapitres étudiants qui ont participé à l’Atelier comme des séances de committee is now com- des dirigeants des chapitres étudiants formation du logiciel posed of eight students SAFI, une visite de and will be organizing more activities this year, such as a tour of the l’usine de Canam-Ponts à Québec et une visite de chantier du nouDaniel Johnson Dam. Finally, with the experience that I gained I can veau Pont Champlain en collaboration avec la section de Montréal. offer these tips: Le comité exécutif du chapitre est maintenant composé de 8 étudi• graduate students are an asset for the chapter ants et nous organisons encore plus d’activités cette année, comme • having links with the nearest professional section is an undeniable la visite du barrage Daniel-Johnson. Pour finir, mon expérience me advantage permet d’offrir ces quelques conseils: • annual recruitment is essential • les étudiants diplômés sont un atout pour le chapitre • the success of the activities will depend upon communication • avoir des liens avec la section professionnelle la plus proche est un and it is necessary to use all communication channels to promote avantage indéniable them • le recrutement annuel est primordial • and leadership, in all its forms, is vital to the survival of any orga• le succès des activités passe par la communication, il faut utiliser nization. toutes les méthodes pour en faire la promotion • et le leadership, sous toutes ces formes, est vital à la survie de toute organisation.
YOUNG PROFESSIONALS’ CORNER | LE COIN DES JEUNES PROFESSIONNELS
Engagement pour une Commitment to Membership Growth croissance des adhésions Nicholas C. Kaminski, P. Eng., PMP, MCSCE
Nicholas C. Kaminski, P. Eng., PMP, MSCGC
CSCE YOUNG PROFESSIONALS COMMITTEE
PROFESSIONNELS
VP TREASURER AND VP COMMUNICATIONS
G
rowing with youth is part of the CSCE’s Vision 2020 and it has been widely successful since its implementation in 2012. Our Society has made numerous strides in increasing its memberships for young professionals and students. The introduction of free student membership in 2015 has provided an opportunity for young members to experience the array of benefits a full CSCE membership would offer after graduation.
8
CIVIL_Winter2017_LAZ.indd 8
V-P TRÉSORIER ET V-P COMMUNICATIONS, COMITÉ DES JEUNES
C
roître avec les jeunes fait partie de la Vision 2020 de la SCGC et a connu un grand succès depuis sa mise en œuvre en 2012. Notre Société a fait de grands progrès pour accroître les adhésions des jeunes professionnels et des étudiants. L’introduction, en 2015, de la gratuité pour les étudiants a donné l’occasion aux jeunes membres de profiter de l’ensemble des avantages qu’offrirait une adhésion complète à la SCGC après l’obtention de leurs diplômes. La création d’un nouveau chapitre étudiant à l’Université de Regina illustre les progrès réalisés au
Hiver 2017 | L’Ingénieur civil canadien
2017-12-05 1:33 PM
YOUNG PROFESSIONALS’ CORNER | LE COIN DES JEUNES PROFESSIONNELS The creation of a new student chapter at the University of Regina is just one example of the progress being made at the local section level. The Young Professionals Committee continues to offer support and funding for mentoring, networking and student outreach events at local sections across the country. It is critical to the CSCE’s success to continue to foster the growth of young professionals within our organization. When conversing with fellow civil engineers or students, remember to inform them of the numerous benefits that CSCE membership provides to its members, below are just a few examples of these benefits: • Enhanced networking opportunities at both a local and national level with industry peers in a variety of engineering sectors • Access to member-discounted rates for merchandise, our flagship national conference, technical presentations and the National Lecture Tour • Recognized publications on the latest developments and projects in the civil engineering profession including the Canadian Civil Engineer (CIVIL) magazine published five times per year • Access to the CSCE’s professional development program which can help keep your skills competitive • Potential to be recognized for honours and award programs including the Young Professional Engineer Award presented at the Annual Conference Awards Banquet TheYoung Professionals Committee is always happy to answer any questions you may have and to provide assistance whenever we can. Contact information for our members can be found on the CSCE’s website. kaminski.nick@icloud.com
niveau local. Le Comité des jeunes professionnels continue d’offrir du soutien et du financement pour des activités de mentorat, de réseautage et de sensibilisation destinées aux étudiants dans les sections du pays. Continuer à encourager la croissance des jeunes professionnels au sein de notre organisation est essentiel pour la réussite de la Société. Lors de vos discussions avec d’autres ingénieurs civils ou étudiants, n’oubliez pas de les informer des nombreux avantages que l’adhésion à la SCGC apporte à ses membres. En voici quelques exemples : • davantage de possibilités de réseautage aux niveaux local et national avec des pairs de l’industrie dans divers secteurs de l’ingénierie • tarifs réduits pour l’achat de marchandises, pour une inscription au congrès annuel, aux présentations techniques et à la Tournée nationale de conférences • accès à des publications reconnues traitant des derniers développements et projets de la profession de génie civil, y compris la revue l’Ingénieur civil canadien (CIVIL) publiée cinq fois par an • accès au programme de formation continue de la SCGC qui peut vous aider à maintenir vos compétences compétitives • possibilité d’être reconnu pour les distinctions et les prix, y compris le Prix du jeune ingénieur professionnel présenté au gala des prix du congrès annuel Le Comité des jeunes professionnels est toujours heureux de répondre à toutes vos questions et de vous apporter son assistance dans la mesure du possible. Les coordonnées de nos membres sont disponibles sur le site Web de la SCGC. Nicholas C. Kaminski, P. Eng., PMP, MSCGC V-p trésorier et V-p communications, Comité des jeunes professionnels kaminski.nick@icloud.com
CALL FOR CASE STUDIES - 2017 The editors of CIVIL magazine invite CSCE-CSGC members to submit case studies for possible publication in future issues. Projects submitted should should demonstrate technical innovation in structural/civil engineering, project management or other engineering expertise. Submit a brief summary of 700 words (in English or French), plus two or three images, to: Doug Picklyk, Associate Editor, CIVIL. dpicklyk@ccemag.com, Tel. 416-510-5119.
Canadian Civil Engineer | Winter 2017
CIVIL_Winter2017_LAZ.indd 9
Civil._Winter_Andersonindd.indd 1
Canadian Civil Engineer 2017-11-10 10:11 AM 4.875” x 3.625”9 November 2017
2017-12-05 1:33 PM
HISTORIC CIVIL ENGINEERING SITE | LIEU HISTORIQUE DE GÉNIE CIVIL
The Aboiteau
L’aboiteau
The engineering structure that built Acadia
Un ouvrage d’ingénierie pour construire l’Acadie
Gilles Hébert,
Gilles Hébert,
SECRETARY, EAST NB (MONCTON) & PEI CSCE SECTION
SECRÉTAIRE, SECTION EST N.-B. (MONCTON) & Î.-P.-E. SCGC
L
L
’Université de Moncton has a new exhibition in the Faculty of Engineering entitled: «The Aboiteau: the engineering structure that built Acadia». This exhibition includes a section of an ancient Aboiteau from the Grand-Pré region dated 1689, a long term loan from the Nova Scotia Museum. Information boards have been created explaining how these original aboiteaux and dykes worked and detailing the importance of these structures in establishing the Acadian colony. This exhibition is sponsored by the City of Dieppe. In 2013, the Canadian Society for Civil Engineering recognized the Acadian Aboiteau as a National Engineering Structure of significant historical importance. In 2014, to honour and recognize the ingenuity of the Acadian people, a Canadian Society for Civil Engineering commemorative plaque was installed at an observation site constructed adjacent to a fully functioning Aboiteau located near Fort Beauséjour, Aulac, New Brunswick. A copy of this commemorative plaque is part of the Faculty of Engineering Aboiteau exhibition. This plaque contains the following quote: “The Canadian Society for Civil Engineering recognizes and honours the scientific and engineering knowledge introduced by the Acadian people. In the 17th Century, Acadian settlers needed to convert vast areas of salt marshes on the Bay of Fundy to arable fields and pastures. They built a series of ingenious aboiteaux and dykes to reclaim these tidal lands for agricultural purposes. These water control systems contributed to the establishment of the first sustainable colony in Canada and more specifically in the Maritime Provinces. The maintenance of the early structures was subsequently taken over by the provincial governments. These aboiteaux and dykes are still in use today providing flood protection for modern-day infrastructure like private and public properties, roads and railway beds and utilities… Gilles Hébert FCSCE, Secretary, East NB & PEI CSCE Section; Gérard Poitras FCSCE, Councillor, East NB & PEI CSCE Section; Alistair MacKenzie FCSCE, President, CSCE History Committee; Sherry Trenholm FCSCE, Councillor, East NB & PEI CSCE Section; Jérémie Aubé, President, East NB & PEI CSCE Section; Samuel
’Université de Moncton a mis sur pied une nouvelle exposition intitulée : «L’aboiteau : un ouvrage d’ingénierie pour construire l’Acadie» à la Faculté d’ingénierie. Cette exposition comprend une pièce d’un aboiteau datée à 1689 provenant de la région de Grand-Pré qui est un prêt à long terme du musée de la Nouvelle-Écosse. Des panneaux explicatifs ont été créés qui résument le fonctionnement de ces aboiteaux et digues originaux ainsi que leur importance dans l’établissement de la colonie acadienne. Cette exposition est commanditée par la Ville de Dieppe. En 2013, la Société canadienne de génie civil reconnaît l’aboiteau acadien comme structure nationale d’ingénierie d’importance historique significative. En 2014, afin de marquer et reconnaître l’ingéniosité acadienne, une plaque commémorative de la Société canadienne de génie civil est installée sur un site d’observation construit près d’un aboiteau fonctionnel dans la région du Fort Beauséjour, Aulac, Nouveau-Brunswick. Une copie de cette plaque commémorative fait maintenant partie de l’exposition de la Faculté d’ingénierie. La plaque contient la citation suivante : «La Société canadienne de génie civil reconnaît et honore la contribution scientifique et les concepts d’ingénierie du peuple acadien. Ces concepts d’ingénierie ont été utilisés dans la réalisation et l’aménagement des aboiteaux et des digues nécessaires pour gagner des étendues de terres agricoles sur les marais salins. La mise en œuvre de ces concepts d’ingénierie, dès le 17e siècle, a permis l’établissement de la première colonie agraire durable au Canada et plus spécifiquement dans les provinces maritimes. L’entretien de ces centaines de premiers aboiteaux et Aboiteau exhibit digues devinrent la responsabilité des gouvernements provinciaux. Ces aboiteaux et digues sont encore fonctionnels aujourd’hui. Les aboiteaux protègent les propriétés riveraines privées et publiques, les routes et les voies ferrées, ainsi que de nombreux services publics…»
Richard, Vice-President, Atlantic Region, CSCE
10
CIVIL_Winter2017_LAZ.indd 10
Hiver 2017 | L’Ingénieur civil canadien
2017-12-05 1:33 PM
SUSTAINABLE INFRASTRUCTURE | LES INFRASTRUCTURES DURABLES
La gestion des actifs dans l’incertitude du climat du futur Dr Guy Félio, P.Eng., FCSCE, IRP[Climate]
L
orsque des événements climatiques violents tels que ceux qui sont survenus au Texas et en Louisiane se produisent, ils mettent en perspective la vulnérabilité de nos services publics et de notre mode de vie. Au Canada, les feux de forêt ont fait rage en Colombie-Britannique; Windsor (ON) a récemment connu des inondations qui ont touché près de 6 000 maisons, et une recherche rapide dans les nouvelles révélera de nombreux autres cas de dégâts liés à la météo. Les coûts associés à ces catastrophes continuent d’augmenter; le Bureau d’assurance du Canada a déclaré en janvier 2017: «Des incendies qui ont ravagé Fort McMurray en mai aux inondations qui ont dévasté certaines parties de la Nouvelle-Écosse et de TerreNeuve au cours du week-end de l’Action de grâce, le climat extrême a eu un impact important sur les Canadiens en 2016. Selon Catastrophe Indices and Quantification (CatIQ), les dommages assurés en 2016 ont dépassé les 4,9 milliards de dollars, brisant le record annuel précédent de 3,2 milliards de dollars de 2013.» Les événements de 2016 se sont produits d’un océan à l’autre, comme le montre le tableau ci-dessous (Source: Bureau d’assurance du Canada).
• 23-26 mars, tempête de neige du Sud de l’Ontario (Fergus, Orangeville, Barrie, Newmarket) • 3-19 mai, feu de forêt de Fort McMurray (Wood Buffalo, Fort McMurray) • 24-25 juin, tempêtes du Nord de l’Ontario et des Prairies (Saskatoon, West Hawk Lake, Killarney, Thunder Bay) • 28-30 juin, tempêtes des Prairies (Calgary, Edmonton, Okotoks, Sud du Saskatchewan et Manitoba) • 8 juillet, tempêtes du Sud de l’Ontario (Bradford, Markdale, London) • 8-11 juillet, tempêtes de l’Ouest du Canada (Edmonton, Calgary, Estevan, Sud-Ouest du Manitoba) • 15-16 juillet, tempêtes des Prairies (Calgary, Swift Current) • 18-20 juillet, tempêtes du Sud des Prairies (Medicine Hat, Outlook, Winnipeg) • 22 juillet, tempête de grêle de Moose Jaw (Moose Jaw) • 27 juillet, tempêtes de l’Ontario et du Québec (Toronto, Saguenay) • 30 juillet – 1er août, tempêtes des Prairies (Calgary, Airdrie, Fort McMurray, Yorkton, Melville, Winnipeg) • 28-30 septembre, inondations de Windsor (Windsor, LaSalle, Tecumseh) • 9-11 octobre, inondations de l’Atlantique (Municipalité régionale de Cap-Breton, la péninsule de Connaigre, la région centrale et la côte sud de la partie ’île de Terre-Neuve-et-Labrador)
Le climat ne peut pas être entièrement responsable de ces catastrophes. Au tournant du 20ème siècle, 37% de la population canadienne vivaient dans les villes. En 2011, les données de Statistique Canada montrent que ce taux dépasse 80%. Historiquement, les colonies ont été construites le long des rivières ou des plans d’eau de surface pour Suite à la page 12
Managing assets in the context of future climate uncertainty Dr. Guy Félio, P.Eng., FCSCE, IRP[Climate]
R
ecent violent weather events in Texas and Louisiana put in perspective the vulnerability of our public services and way of life when they happen. In Canada, wildfires keep raging in British Columbia, Windsor (ON) recently experienced flooding that affected close to 6,000 homes, and a quick search in the news will reveal many more cases of weather related damage. The costs associated with these disasters continue to increase; the Insurance Bureau of Canada reported in January 2017: “From the wildfires that swept through Fort McMurray in May to the floods that devastated parts of Nova Scotia and Newfoundland over Thanksgiving weekend, severe weather had a huge impact on CaCaption: Aboiteau exhibit
Continued to page 12
Canadian Civil Engineer | Winter 2017
CIVIL_Winter2017_LAZ.indd 11
• March 23-26 Southern Ontario Ice Storm (Fergus, Orangeville, Barrie, Newmarket) • May 3-19 Fort McMurray Wild Fire (Wood Buffalo, Fort McMurray) • June 24-25 Northern Ontario and Prairie Storms (Saskatoon, West Hawk Lake, Killarney, Thunder Bay) • June 28-30 Prairie Storms (Calgary, Edmonton, Okotoks, Southern Saskatchewan and Manitoba) • July 8 Southern Ontario Storms (Bradford, Markdale, London) • July 8-11 Western Canada Storms (Edmonton, Calgary, Estevan, Southwestern Manitoba) • July 15-16 Prairie Storms (Calgary, Swift Current) • July 18-20 Southern Prairie Storms (Medicine Hat, Outlook, Winnipeg) • July 22 Moose Jaw Hailstorm (Moose Jaw) • July 27 Ontario-Quebec Storms (Toronto, Saguenay) • July 30 – August 1 Prairie Storms (Calgary, Airdrie, Fort McMurray, Yorkton, Melville, Winnipeg) • September 28-30 Windsor Flooding (Windsor, LaSalle, Tecumseh) • October 9-11 Atlantic Flooding (Cape Breton Regional Municipality, the Connaigre Peninsula, the central region and south coast of the island portion of Newfoundland and Labrador)
11
2017-12-05 1:33 PM
SUSTAINABLE INFRASTRUCTURE | LES INFRASTRUCTURES DURABLES Suite de la page 11 faciliter le commerce, la pêche ou l’approvisionnement en eau potable, des zones qui sont sensibles aux précipitations, à la fonte des neiges rapide, etc. L’utilisation du sous-sol a changé: construit à l’origine comme espace de stockage froid puis construit de manière à ce que les murs de la fondation soient sous le niveau du gel, il est souvent le centre de divertissement de la maison avec des milliers de dollars de matériel électronique ... et l’une des zones les plus vulnérables aux inondations. L’infrastructure peut ne pas avoir été maintenue dans un bon état, ce à quoi il faut ajouter la tendance à créer des surfaces imperméables telles que les routes et les aires de stationnement qui forment un entonnoir pour les eaux pluviales dans des systèmes conçus en fonction de données climatiques historiques. Aujourd’hui, les praticiens des infrastructures de partout au pays, les planificateurs urbains, les ingénieurs, les gestionnaires des finances publiques et les gestionnaires d’actifs planifient, conçoivent et construisent ou modernisent des actifs à longue durée de vie qui subiront sans aucun doute les effets des changements climatiques. Il s’agit de l’espace de gestion d’actifs: planification, construction, exploitation et maintenance durant le cycle de vie de l’actif. L’incertitude climatique future ajoute une nouvelle variable qui ne peut être traitée par l’approche traditionnelle de «facteur de sécurité» car l’inconnu est trop vaste et la probabilité que des changements interviennent trop incertaine. Le manque de données et de certitude n’a pas empêché les municipalités de fournir des services, de gérer leurs actifs et d’utiliser efficacement leurs ressources limitées. Les conditions météorologiques et l’incertitude climatique future sont une autre variable à considérer; mais où commencer? Considérons la collecte et l’analyse de données déjà réalisées dans le rapport sur les immobilisations tangibles (PS 3150) et la gestion d’actifs. L’évaluation des risques climatiques utilise les mêmes données de base des infrastructures auxquelles s’ajoutent les informations météorologiques ainsi que les projections climatiques futures, comme l’illustre le tableau ci-dessous. L’information fondamentale sur les actifs existe dans les registres des actifs; pour l’analyse de risques du climat, le degré d’exposition, la vulnérabilité et le seuil critique climatique (au-dessus duquel le service est perturbé ou l’infrastructure cède) permettra de créer un profil de risque des actifs et d’établir les impacts potentiels sur les services et la
collectivité. En conclusion, les risques climatiques sont un autre niveau de risque à prendre en considération dans la gestion des actifs. Bien qu’ils présentent une plus grande incertitude future que celles auxquelles les gestionnaires d’actifs peuvent être actuellement habitués, il existe des outils (comme le Protocole PIEVC d’Ingénieurs Canada) qui peuvent aider à «gérer» cette incertitude. Il n’y a aucune raison de ne pas tenir compte de l’incertitude climatique dans la gestion d’actifs. En dernier ressort, l’accent porte sur les services et la collectivité et l’assurance que les actifs essentiels restent fonctionnels lors d’événements extrêmes et que toute fonctionnalité perdue est rapidement rétablie!
Continued from page 11 nadians in 2016. According to Catastrophe Indices and Quantification (CatIQ), insured damage for 2016 topped $4.9 billion – smashing the previous annual record of $3.2 billion set in 2013.” These 2016 events took place from coast to coast as shown in the table below (Source: Insurance Bureau of Canada). Weather cannot take the whole blame for these disasters. At the turn of the 20th Century, 37% of Canada’s population lived in cities – in
12
CIVIL_Winter2017_LAZ.indd 12
2011, data from Statistics Canada shows it is more than 80%. Historically, settlements were built along rivers or near surface bodies of water for trade, fishing or drinking – areas susceptible to precipitation, rapid snowmelt, etc. The use of the basement has changed: originally built as a cold storage space and later constructed so that foundation walls were below the frost line, it is often the centre of entertainment of the house with thousands of dollars worth of electronic equipment … and one of the most vulnerable areas to flooding. Infrastructure
Hiver 2017 | L’Ingénieur civil canadien
2017-12-05 1:33 PM
SUSTAINABLE INFRASTRUCTURE | LES INFRASTRUCTURES DURABLES may not have been maintained in a state of good repair. Adding to this has been the trend to create impervious surfaces such as roads and parking that funnel storm water in systems designed based on historical climate data. Today, infrastructure practitioners across the country– urban planners, engineers, public finance officers and asset managers are planning, designing and constructing or retrofitting long-life assets that undoubtedly will experience changes in climate. This is the asset management space: plan, build operate and maintain over the asset’s life-cycle. Future climate uncertainty adds a new variable to the mix – one that cannot be dealt with using the traditional “factor of safety” approach since the unknown is too broad and the probability of changes materializing too uncertain. Lack of data and certainty has not stopped municipalities from providing services, managing their assets, and making effective and efficient use of their scarce resources. Extreme weather and future climate
uncertainty is another variable to consider; but where to start? Consider the data collection and analysis already done through tangible capital assets reporting (PS 3150) and asset management; assessing climate risks uses the same base infrastructure data – augmented with weather information and future climate projections as illustrated in the table below. The foundational asset information exists in the asset registers; for the climate risk analysis, the exposure, vulnerability and climate event threshold (above which the service will be disrupted or the infrastructure fail) will allow to create a risk profile of the assets, and the allow to establish the potential impacts on the service and the community. In conclusion, climate risks are another layer of risk to consider in the management of assets. Although they present a greater future uncertainty than those asset managers may be currently accustomed, there are tools (for example, Engineers Canada’s PIEVC Protocol) that can help “manage” this uncertainty. There are no reasons not to consider climate uncertainty in asset management. Ultimately, the focus is on the service and the community, and ensuring critical assets maintain functionality during the extreme event, and recover quickly any functionality lost!
Denso Products - Unmatched Quality and Performance
If it doesn’t say
on the outside, then its not
Denso North America Inc. • www.densona.com
Canadian Civil Engineer | Winter 2017
CIVIL_Winter2017_LAZ.indd 13
on the inside.
13
2017-12-05 1:33 PM
IN VIEW: PROJECTS | PROJETS EN VEDETTE
L’Échangeur Turcot 3D : L’ingénierie virtuelle! Martin Pilon, WSP Canada
L
’échangeur Turcot constitue une plaque tournante en ce qui a trait à la circulation routière dans la région de Montréal. Ce projet du ministère des Transports, de la Mobilité durable et de l’Électrification des transports est actuellement le chantier routier le plus complexe en Amérique du Nord et le lieu de plusieurs innovations et premières au Québec, que ce soit au niveau de la conception, de la construction ou des outils de validation et de communication utilisés. Il ne fait aucun doute que le plus grand défi du projet est de maintenir la mobilité pour plus de 300 000 véhicules qui transitent quotidiennement par l’échangeur et de composer avec plusieurs contraintes d’espace, d’utilisation et d’échéancier. KPH Turcot a dû faire appel à une conception sortant de l’ordinaire et à des technologies innovantes dans le domaine de la modélisation 3D et de la simulation visuelle pour être en mesure de concevoir, de valider et de communiquer les lignes directrices du projet. Dans ce sens, les professionnels en modélisation 3D et en simulation visuelle de WSP ont travaillé de concert avec les différentes équipes de conception afin de de faciliter le travail en mode intégré à partir de la même plateforme 3D. Cette maquette numérique a permis de promouvoir la bonne compréhension du projet, dans sa globalité et dans ses détails, et des changements apportés à l’environnement existant en fournissant une représentation juste et précise de l’ensemble des aménagements projetés. Plus qu’un simple outil de visualisation, cette maquette innovatrice ultra précise a évolué tout au long du processus de conception. Elle a
Turcot Interchange éxistant/existing 14
CIVIL_Winter2017_LAZ.indd 14
permis de valider de nombreux éléments tels que:
Les différents concepts de détails architecturaux Cette base de données fut utile sur le plan architectural. Plusieurs images de synthèses furent livrées afin de valider la configuration des murs modulaires architecturaux ainsi que les murs anti-bruit. De plus, en simulant des emplacements ayant un haut impact visuel, les spécialistes furent en mesure de valider et d’intervenir en fonction des priorités techniques et visuelles. À l’aide de cet outil de visualisation, les équipes d’architecture de paysages furent en mesure de valider plusieurs points cruciaux des concepts d’aménagements tels les écrans visuels, les pentes, les conflits avec les caméras de surveillance, ainsi que les plantations en fonction de leur espèce et de leur temps de croissance. L’équipe de simulation a aussi aidé à la configuration du réseau d’éclairage. À l’aide d’outils de rendu et de fichiers IES (Illuminating Engineering Society), la maquette 3D fut utilisée pour produire des images de synthèse représentant la luminosité des configurations planifiées. Ces rendus ont permis aux ingénieurs de valider l’efficacité lumineuse, la sur-illumination, ainsi que les angles avec potentiel d’éblouissements. Dans certains cas, plusieurs lampadaires furent retirés de la configuration initiale. Suite à la page 16
Turcot Interchange simulation Hiver 2017 | L’Ingénieur civil canadien
2017-12-05 1:33 PM
IN VIEW: PROJECTS | PROJETS EN VEDETTE
The 3D Turcot Interchange: Virtual Engineering! Martin Pilon, WSP Canada
T
he Turcot Interchange is a traffic hub in the Montreal area. This project of the Ministry of Transport, Sustainable Mobility and Transport Electrification is currently the most complex road project in North America and is the site of several innovations and premieres in Quebec, both in terms of design, construction and validation and communication tools used. There is no doubt that the biggest challenge of the project is to maintain mobility for more than 300,000 vehicles that pass through the interchange daily, while coping with limited space, use and schedule. KPH Turcot had to rely on out-of-the-ordinary design and innovative technologies in 3D modelling and visual simulations to design, validate and communicate the project guidelines. In this sense, the 3D modelling and visual simulation professionals from WSP worked with various design teams to facilitate work in an integrated mode from the same 3D platform. This digital model was able to promote a good understanding of the project, in its entirety and in its details, and changes to the existing environment by providing a fair and accurate representation of all planned developments. More than a visualization tool, this ultra-precise and innovative model has evolved throughout the design process. It was able to validate many elements, such as:
Different architectural detail designs
ages were delivered to validate the configuration of architectural modular walls and sound abatement walls. In addition, by simulating locations with high visual impact, specialists were able to validate and intervene according to technical and visual priorities. Using this visualization tool, landscape architecture teams were able to validate several crucial points of landscape designs, such as visual screens, slopes, conflicts with surveillance cameras as well as plantations according to their species and their growth. The simulation team also helped with the configuration of the lighting network. Using rendering tools and Illuminating Engineering Society (IES) files, the 3D model was used to produce computer-generated images representing the brightness of the planned configurations. These renderings allowed our engineers to validate the luminous efficiency, the over illumination, as well as the angles with glare potential. In some cases, several lampposts were removed from the initial configuration.
Surveillance camera positioning The 3D model was also very useful to the road surveillance teams. Using the engineering plans, virtual surveillance cameras were placed in the 3D model. Thus, our specialists were able to validate the blind spots, landscaping design conflicts, practicability, etc. In the comfort of their offices, they were able to avoid travel and the associated risks. Let us remember that before the arrival of this tool, engineers had to lift up
This database was useful on the architectural level. Several synthetic im-
Continued on page 16
Des camĂŠras de surveillance virtuelles / Virtual surveillance angles. Canadian Civil Engineer | Winter 2017
CIVIL_Winter2017_LAZ.indd 15
15
2017-12-05 1:33 PM
IN VIEW: PROJECTS | PROJETS EN VEDETTE
Les murs anti-bruit / Sound abatement walls.
Les différents concepts d’aménagements paysagers / Different landscape designs.
Suite de la page 14
Le positionnement des caméras de surveillance La maquette 3D fut également très utile aux équipes de surveillance routière. À l’aide des plans d’ingénierie, des caméras de surveillance virtuelles furent placées dans la maquette 3D. Ainsi, nos spécialistes furent en mesure de valider les angles morts, les conflits d’aménagements paysagers, les praticabilités, etc. Dans le confort de leurs bureaux, ils ont pu éviter déplacements et risques associés à ceux-ci. Rappelons-nous qu’avant l’arrivée de cet outil, les ingénieurs devaient, à l’aide d’une nacelle, se soulever plusieurs dizaines de mètres pour enfin imaginer, avec des plans en deux dimensions, la perspective d’une caméra qui, en elle-même, ne peut pas être reproduite par l’œil humain.
La simulation de plusieurs types de phasages La version finale du mandat fut achevée récemment. Mais avant de devenir la maquette de haut réalisme et précision que nous dévoilons dans cet article, elle fit ses débuts modestes il y a plus de cinq ans comme outil de gestion des phases de construction-démantèlement aussi bien que comme outil de gestion des déplacements des usagers et de gestion des contaminants et des matières résiduelles. La capacité d’intégration et de synthèse de cet outil novateur combine les sciences de la géomatique, de la modélisation 3D, de la conception technique et des produits de communication. La maquette a permis de centraliser l’ensemble des interventions du projet pour en donner une image complète dans l’intérêt des concepteurs, des décideurs et du public en général. L’outil a permis de prendre des décisions éclairées tout au long des différentes phases de conception. La maquette a également permis de générer de nombreux outils de
Continued from page 15 several tens of meters by means of a pod to finally imagine, with two-dimensional plans, the perspective of a camera that, in itself, cannot be reproduced by the human eye. The final version of the mandate was completed recently. But before becoming the model of high realism and precision that we unveil in
16
CIVIL_Winter2017_LAZ.indd 16
communication innovateurs adaptés aux différentes phases de projet autant pour des besoins à l’interne que pour le MTQ. Ces produits comptent des parcours animés réalistes, des images de synthèse, des photos simulation, des animations visuelles du phasage, une maquette 3D permettant de visualiser les infrastructures une fois terminées via un site Web, ainsi que plusieurs produits de type réalité virtuelle (VR). De plus, l’équipe de WSP a produit des simulations et des parcours animés du projet Turcot présentés à l’aide de casques de réalité virtuelle. Cette technologie permet une immersion totale de l’utilisateur dans un environnement artificiellement généré à l’aide de la maquette numérique et plonge les utilisateurs dans le projet Turcot en éliminant la distance entre l’observateur et ce qu’il observe. Cette technologie permet de présenter et de comprendre l’information d’une façon ultra réaliste, globale et à l’échelle humaine. Complémentaire aux outils de communication conventionnels, elle augmente l’efficacité des outils d’aide à la décision pour tous les intervenants et possède un immense potentiel de développement pour améliorer l’interopérabilité et la prise de décision entre les différents professionnels, les décideurs et le public. En conclusion, cette maquette se voulait un outil de collaboration et de plateforme de diffusion. Ainsi, le ministère des Transports, de la Mobilité durable et de l’Électrification des transports se dota de cette base de données 3D afin de communiquer de façon transparente, efficace et novatrice les changements et décisions prises tout au long du processus de conception. ‘’Savoir, penser, rêver. Tout est là.’’ Victor Hugo WSP remercie le Ministère ainsi que tous les partenaires pour cette opportunité.
this article, it made its humble beginnings more than five years ago as a management tool for the construction-dismantling phases as well as a tool for managing the movements of users and the contaminants and residual materials. The integration and synthesis capability of this innovative tool combines the sciences of geomatics, 3D modelling, technical design and
Hiver 2017 | L’Ingénieur civil canadien
2017-12-05 1:33 PM
IN VIEW: PROJECTS | PROJETS EN VEDETTE
communication products. The model made it possible to centralize all of the project’s interventions in order to provide a complete image for the benefit of designers, decision makers and the general public. The tool helped to make informed decisions throughout the various design stages. The model also generated many innovative communication tools adapted to the different project phases for both internal and MTQ needs. These products include very realistic animated traffic movements, computer-generated images, simulation photos, visual phasing animations, a 3D model allowing the public to visualize the infrastructure once completed via a website, as well as several virtual reality (VR) products. The ability to integrate and synthesize this innovative tool combines the sciences of geomatics, 3D modeling, technical design and communication products. The model made it possible to centralize all of the project’s interventions in order to provide a complete image for the benefit of designers, decision-makers and the general public. The tool has made informed decisions throughout the various design phases. The model also generated many innovative communication tools adapted to the different project phases for both internal and MTQ needs. These products include realistic animated tracks, computer-generated images, simulation photos, visual phasage animations, a 3D mod-
el to visualize the infrastructure once completed via a website, as well as several virtual reality (VR) products. In addition, the WSP team produced simulations and animated tours of the Turcot project using virtual reality headsets. This technology allows a total immersion of the user in an artificially generated environment using the digital model and immerses the users in the Turcot project by eliminating the distance between the observer and what he observes. This technology makes it possible to present and understand information in an ultra-realistic, global and human-scale way. Complementary to conventional communication tools, it increases the effectiveness of decision support tools for all stakeholders and has tremendous development potential to improve interoperability and decision-making between different professionals, policy makers and the public. In conclusion, this model was intended as a collaboration tool and dissemination platform. The Ministry of Transport, Sustainable Mobility and Transport Electrification developed this 3D database to communicate changes and decisions made throughout the design process in a transparent, effective and innovative way.  WSP extends its thanks to the Ministry of Transport as well as all the partners for this opportunity.
ENJOY THE BENEFITS OF
MEMBERSHIP
www.csce.ca Civil_Winter_NewCSCE.indd 1
Canadian Civil Engineer | Winter 2017
CIVIL_Winter2017_LAZ.indd 17
2017-11-14 3:39 PM
17
2017-12-05 1:33 PM
FROM THE TECHNICAL EDITOR | MOT DU RÉDACTEUR TECHNIQUE
Traffic Systems and Data Analytics Tony Z. Qiu, Ph.D., P.Eng. & Xu Wang TRANSPORTATION DIVISION CSCE
I
ntelligent transportation systems and information technologies have developed rapidly in recent years, with constantly expanding capabilities to collect numerous kinds of transportation-related data. These technologies are more cost effective options over other types. Real-time, massive and multi-source data are available in transportation field. Together with traditional data sources, other sources, such as global positioning systems, cellphone call records and transit smart card records, have been considered in transportation applications to provide a more thorough understanding of travel demand and behaviours. Data analytics can support decision-making in transportation planning, management and control. Data analysis allows transportation planner to quantify trip generation, distribution, mode choice, and route assignment. Data analysis also enables network-wide data access, centralized transportation management and network performance improvement. Furthermore, real-time data analysis facilitates problem diagnosis, performance optimization and the implementation of reactive or proactive countermeasures. Popular data analysis methods fall into the categories of artificial in-
telligence methods and statistical methods. Artificial intelligence methods enhance understanding of transportation phenomena with predictive analytics achieved using powerful predictive algorithms. Statistical methods describe the nature and correlation of the data, and construct statistical models to support future applications. This issue of CIVIL magazine provides insight into the work and future of data analytics in the transportation field. The first article uses bus GPS data to describe the sample size requirements under different traffic states when estimating the link travel speed on urban freeways. The second article presents the work conducted to improve traffic mobility performance, involving implementation of a proactive variable speed limit control in the field. The third article describes the work which develops a Web mining driven traffic analytics system. The fourth article proposes computational solutions in a distributed multiagent framework for real-time traffic signal timing of multi-intersection large-scale urban networks. Tony Z. Qiu is associate professor, transportation engineering, and director, Centre for Smart Transportation, at the University of Alberta. Xu Wang is a post doctoral fellow in transportation engineering at the University of Alberta.
Systèmes de circulation et analyse de données Tony Z. Qiu, Ph.D., P.Eng. & Xu Wang DIVISION DES TRANSPORTS, SCGC
L
es systèmes de transport intelligents et les technologies de l’information se sont développés rapidement au cours des dernières années, avec des capacités sans cesse croissantes de collecte plus rentable de nombreux types de données liées au transports. Des ensembles de données en temps réel, massifs et multi-sources sont maintenant disponibles. Avec les sources de données traditionnelles, telles que les systèmes de positionnement global, les registres d’appels des téléphones portables et des cartes de transport intelligentes, nous sommes maintenant en mesure de mieux comprendre la demande et les comportements des déplacements. L’analyse de données peut aider la prise de décisions dans la planification, la gestion et le contrôle des transports. L’analyse de données permet aux planificateurs des transports de quantifier la génération de déplacements, leur distribution, le choix des modes et l’affectation des circuits. L’analyse de données permet également l’accès aux données à l’échelle du réseau, la gestion centralisée des transports et l’amélioration des performances du réseau. De plus, l’analyse de données en temps réel facilite le diagnostic des problèmes, l’optimisation des performances et la mise en place de contre-mesures réactives ou proactives.
18
CIVIL_Winter2017_LAZ.indd 18
Les méthodes d’analyse de données populaires tombent dans les catégories des méthodes d’intelligence artificielle et des méthodes statistiques. Les méthodes d’intelligence artificielle améliorent la compréhension des phénomènes de transport avec l’analytique prédictive réalisée à l’aide de puissants algorithmes prédictifs. Les méthodes statistiques décrivent la nature et la corrélation des données, et construisent des modèles statistiques pour soutenir de futures applications. Les articles suivants donnent un aperçu du travail et de l’avenir de l’analyse de données dans le domaine des transports. Le premier article utilise les données GPS d’autobus pour décrire les exigences de taille d’échantillon dans différents états de la circulation lors de l’estimation de la vitesse de déplacement sur les autoroutes urbaines. Le deuxième article présente le travail effectué pour améliorer la performance de la mobilité de la circulation impliquant la mise en œuvre d’un contrôle de la vitesse variable proactif sur le terrain. Le troisième article décrit les travaux pour élaborer un système d’analyse de la circulation axé sur le Web. Tony Z. Qiu est professeur agrégé en génie des transports et directeur du Centre des transports intelligents, Université de l’Alberta. Xu Wang est boursière postdoctorale en ingénierie des transports à l’Université de l’Alberta.
Hiver 2017 | L’Ingénieur civil canadien
2017-12-05 1:33 PM
TECHNICAL: TRAFFIC SYSTEMS | TECHNIQUE: SYSTÈMES DE CIRCULATION
Measuring traffic conditions using Transit GPS Data Difei He, Department of Civil and Environmental Engineering, University of Alberta
S
peed estimation and traffic condition monitoring using GPS-based probe vehicles has been explored thoroughly in recent studies. Bus transit data, one of the commonly used probe vehicles, has certain advantages, however in dynamic traffic situations the required sample sizes for bus transit data can vary. The Edmonton Transit Services (ETS) initiated a Smart Bus Project (1) that equipped 928 buses with smart bus technologies to provide real-time traffic information to customers and the traffic control department. To explore the applicability of using smart bus GPS data to estimate real-time traffic conditions in Edmonton, we analyzed the dynamic sample size required for estimating the travel speed along an urban freeway and to find a more accurate sample size requirement during the freeflow, speed drop/recovery and congested periods.
Data collection The ETS Smart Bus GPS Data, provided by Edmonton Transit Service for researchers and transportation engineers, can be found on Edmonton’s Open Data Portal (2). The ETS Bus data follows the Real-time General Transit Feed Specification (Real-time GTFS) data format defined by Google. It mainly consists of two components, VehiFigure 1. The Study Site: Whitemud Drive
cle-Position and Trip-Update information. The Vehicle-Position records all information with respect to vehicle trips that includes vehicle ID, timestamps, and geographical coordinates. The information is collected from one second to a 120-second update frequency. The Trip-Update provides the real-time transit-schedule-related information that includes scheduled routes, scheduled beginning time, bus stop locations, etc. The information is updated every 30 seconds continuously to keep tracking buses. The common time interval between two consecutive buses on the same route is 15 minutes, which means that every 15 minutes there should be a scheduled bus that passes the same location. However, this situation can vary due to traffic conditions along the routes and the driver’s personal driving behaviour.
VDS Data For our research, the vehicle detection system (VDS) speed data on Whitemud Drive (an urban freeway in Edmonton with restricted access and exits) was selected as the benchmark to compare the accuracy of speed estimation from ETS Bus data. There are 20 loop detectors planted along Whitemud Drive, 10 in each direction located at major intersections that constantly record the speed and volume of passing vehicles in a
20-second interval. This raw data provides the ground truth for our estimation, and it helps to justify the accuracy of the Transit GPS data.
CASE STUDY Edmonton Smart Bus Project Whitemud Dr. has an annual average daily traffic (AADT) of around 120,000 vehicles (Figure 2). More than 30 bus routes pass through Whitemud Dr. every day. The Transit Bus data received from the ETS contains 10 weekdays data from December 5th 2016 to December 16th 2016. Because most of the transit service routes only serve between 6 am and 10 pm, we selected this period to conduct the speed comparison analysis. The average sample size changes for a whole day, the highest sample size for each 15-minute time window is seven transit buses during the morning peak hours. Using the smart bus GPS data to detect the traffic flow speed changes on major urban freeways is the major objective in this study. And it is important to understand how different sample sizes would impact the accuracy of speed estimation as well as the speed changes. In total, 2,407 buses traveled through one observed road link that results in a total of 1,046 speed estimation results. According to pre-determined bus schedules, in the 15-minute time slot, there will be on average six smart buses that pass over this road link during the peak hour time. The reason to choose this road link as the example is that the road links have high traffic volumes and loop detectors that can justify the estimation accuracy in various traffic conditions.
Speed Profile Comparison Based on the ground truth speed estimation generated from the fixed location VDS data, we witnessed several severe speed drops on December 5th, 6th, and 16th in the morning and
Canadian Civil Engineer | Winter 2017
CIVIL_Winter2017_LAZ.indd 19
19
2017-12-05 1:33 PM
TECHNICAL: TRAFFIC SYSTEMS | TECHNIQUE: SYSTÈMES DE CIRCULATION PERIOD
NUMBER OF OBSERVATIONS
MASD (KM/H)
MAPSD (%)
Speed Drop or Recovery
32
9.4
16.0
Congested Period
62
5.3
10.9
Total (6 a.m. - 10 p.m.)
2047
7.0
9.2
Table 1. Speed Estimation Results for All Speed Estimations
evening peak hours. These catastrophic speed changes can further testify whether the current sample size and proposed speed estimation method can truly represent the real traffic flow scenarios under different conditions. From these data we could see that the GPS speed estimation can represent the general trend of speed profile when compared with the VDS data, with some variations. For instance, during the morning peak hour on Dec 6th, the GPS speed estimation results did capture the dramatic speed drop between 8 a.m. – 9 a.m. On Dec 5th and 16th, the GPS speed estimations also captured the speed drops during the afternoon peak hours. However, there will be some discrepancies in speed estimates at a specific time due to some random errors and the special nature of the transit bus. For instance, on Dec 5th between 10 am and 12 pm, there were some spikes in the GPS speed estimation, where the highest one has
reached over 100 km/h. This phenomenon may be due to a speed estimation error or due to a driver’s personal behaviour. There are normally more estimation discrepancies during dramatic speed changes like the beginning or end of the congestion periods, which might be due to the increasing speed variance during that time. The Mean Absolute Speed Difference and Percentage Mean Absolute Speed Difference are shown in Table 1. In total, the sample size in these 10 selected dates is 2,407, and on average there are 2.3 probe vehicles per speed estimation. The overall mean absolute speed difference is 7.0 km/h, and this value will be higher in the speed drop or recovery stage, which is 9.4 km/h difference. The congested period, due to its low speed variance, has reached a MASD of 5.3 km/h. The results are complying with the sample size requirement calculation above, and the error is within the acceptable range. The percentage
Figure 2. The Distribution of Speed Estimation Difference between GPS and VDS Data
20
CIVIL_Winter2017_LAZ.indd 20
mean absolute speed difference showed that the difference between GPS and VDS speed estimations is 9.2% on average.
Speed Gap between VDS and GPS To address the speed gap issue between smart buses and the general traffic, we conducted a simple speed difference comparison to test our preliminary assumption that the speed differences follow a normal distribution. To be noted, the speed gap between VDS and GPS data could vary based on many variables including link length, curvature, or speed limit etc. However, this is beyond our scope. Here we only want to address the standard deviation of speed estimations under various traffic conditions that follow the normal distribution, which can justify our assumption in applying the CLT method to estimate the sample sizes. Based on the total 1,046 GPS speed estimations, Figure 2 shows the speed differences between VDS speed estimation and GPS smart bus speed estimation, which as stated above, appears a normal distribution. Later the one-sample Kolmogorov-Smirnov Test further shows the asymmetric significance is less than 0.000 that proves the distribution follows a normal distribution. The x-axis shows the speed gap between GPS and VDS data, and the y-axis shows the number of speed estimations that fall into different categories. The difference between GPS and VDS speed estimations are also independent from the sample sizes. From a box plot, we can see that the distribution of speed difference for each sample size follows a relative good normal distribution. All the groups have shown that the average VDS travel speed is higher than that of the GPS estimated speed, where the mean remains relatively consistent. On the contrary, the standard deviation for each group decreases as the sample size increases. Because a larger sample size provides higher accuracy of the speed estimation, the stable mean values followed by the decreasing standard deviation meet with our intuition.
Hiver 2017 | L’Ingénieur civil canadien
2017-12-05 1:33 PM
TECHNICAL: TRAFFIC SYSTEMS | TECHNIQUE: SYSTÈMES DE CIRCULATION
Because the probe vehicle here is the ETS bus, which could instinctively travel slower than the general traffic flow.
Estimation Accuracy and Sample Size Analysis in Various Traffic Condition In testifying the accuracy of speed estimation in the congested condition, we have classified the traffic condition in three categories: freeflow, speed drop and recovery period, and congested time. The estimated speeds are extracted from the previous estimation results, and the speed drops are identified from the previous speed profile. To estimate the dynamic sample size requirements under different traffic conditions to achieve the same speed estimate accuracy, Table 2 shows an example of the minimum sample size under different conditions on the road link observed using the sample size estimation method above. As we can see, the congested traffic condition requires the minimum sample sizes, which is due to less speed variance in the general traffic. The Juan et al. (4) also mentioned that the speed variance on the freeway will be less than the speed variance when in the freeflow condition. Under the speed drop or speed recovery period, the speed variances have increased dramatically, which require the sample size to be much greater to achieve the same confidence level at the same allowable error. However, due to the speed discrepancies between transit buses and general traffic in nature, the estimation speeds need further modeling and algorithms to transfer the transit bus speeds to general traffic speeds.
Conclusion This research has suggested dynamic sample size requirements during the different traffic conditions, and has provided a valid analysis of the applicability of using Transit GPS data to conduct link travel speed estimations, because the Transit bus is a special type of on-road vehicles where the speed profile could potentially be different.
Canadian Civil Engineer | Winter 2017
CIVIL_Winter2017_LAZ.indd 21
Confidence level 85% 90% 95% (a)
<5km/h 4 5 7
<10 km/h <15 km/h 1 1 2 1 2 1
Confidence level 85% 90% 95% (b)
<5km/h 6 8 11
<10 km/h <15 km/h 2 1 2 1 2 2
Confidence level 85% 90% 95% (c)
<5km/h 3 4 5
<10 km/h <15 km/h 1 1 1 1 2 1
Table 2. Sample size requirements for different combinations of confidence levels and allowable errors. (a) Under Freeflow Condition, (b) Under Speed Drop or Recovery, and (c) Under Congested Condition
We used the loop detector data as the reference to justify the speed gap between transit buses and general traffic, which the mean difference value is approximately 7.0 km/h. The speed standard deviations of the smart bus GPS data also follow a standard normal distribution. The general distribution is not significantly skewed to the left or right, which shows that the variance of speed estimation error is mostly due to individual driving behaviours. In conclusion, the estimation error is mostly related to the variance of traffic speeds, where the highest sample size requirement happens when there are significant speed changes within one period. However, these rapid travel speed changes normally happen over a short period of time, where in most the cases, the Transit bus GPS data can provide sufficient samples in estimating the travel speed under the current bus schedules. The research has proposed a different way of thinking the sample sizes, where different traffic conditions can impact the speed estimations. Due to the lower speed variances in congested traffic conditions, the required sample size is smaller than that of the freeflow condition. While in the freeflow condition,
even though we assume that all the vehicles will travel close to the speed limit, the speed variance is higher than that of a congested period.
References 1. Live, T. E. T. S., T. E. T. S. Live, B. Finder, E. T. S. Live, B. Finder, E. T. S. Route, S. Ets, B. Stop, S. Ets, L. Ets, S. Finder, E. T. S. R. Map, E. T. S. Live, S. Bus, and A. Place. Progress Report - Winter 2013 / 2014 Progress Report - Fall 2013 Progress Report - Summer 2013 Progress Report - Spring 2013. No. November 2013, 2014. 2. City of Edmonton. Edmonton’s Open Data Portal. 3. Green, M., M. Fontaine, and B. Smith. Investigation of Dynamic Probe Sample Requirements for Traffic Condition Monitoring. Transportation Research Record, Vol. 1870, No. 1870, 2004, pp. 55–61. https:// doi.org/10.3141/1870-07. 4. Argote-Cabañero, J., E. Christofa, and A. Skabardonis. Connected Vehicle Penetration Rate for Estimation of Arterial Measures of Effectiveness. Transportation Research Part C: Emerging Technologies, Vol. 60, 2015, pp. 298–312. https://doi.org/10.1016/j. trc.2015.08.013.
21
2017-12-05 1:33 PM
TECHNICAL: TRAFFIC SYSTEMS | TECHNIQUE: SYSTÈMES DE CIRCULATION
Proactive VSL field operation test Xu Wang, Ph.D. School of Civil Engineering, Shandong University
T
ransportation engineers, system designers, and system operators have always lacked a sufficient quantity and quality of data to fully understand the operational efficiency of transportation systems. Intelligent Transportation Systems (ITS) provide the feasibility to generate more comprehensive and accurate traffic data which is helpful in improving traffic management efficiency. Active traffic and demand management (ATDM) is an innovative traffic management strategy emphasizing Information Technology (IT)-based infrastructure, advanced control technology, and system integration to address the grand challenges in transportation systems. It is a cycle consisting of: (1) obtain and analyze traffic measurement data; (2) operation planning-simulate various scenarios and control strategies; (3) implement the most promising control strategies in the field; and (4) maintain a real-time decision support system that filters current traffic measurements to predict the traffic state in the near future and suggest the best available
Figure 1. Whitemud Drive Testbed
22
CIVIL_Winter2017_LAZ.indd 22
control strategy for the predicted situation. ATDM, including Ramp Metering (RM) and Variable Speed Limit (VSL), is a promising solution to improve traffic mobility and safety for freeway networks. VSL is a dynamic traffic control strategy where the speed limit on a freeway is altered to reduce the traffic stream speed, to increase the traffic flow, and to eliminate the risk of potential flow break down in response to a traffic incident or severe weather conditions. A typical VSL system architecture consists of traffic sensors to collect real-time traffic-related data, a communication protocol to communicate with a Traffic Management Centre (TMC), and dynamic message signs. Though the safety benefit from speed homogenization through the VSL implementation is well established, most VSL control algorithms failed to prove improvements in traffic flow efficiency. The reason could be the very simple control strategies. Most existing VSL control strategies work in a reactive manner, and they lack the benefit that can be
achieved from traffic state prediction. Intuitively, the successful implementation of any ATDM strategy requires traffic state prediction and coordination. To promise the aforementioned functions, in this project we proposed a model predictive control (MPC)-based VSL control with a noble control strategy. To our knowledge, we are the first research group who will investigate the real-life impact of MPC-based VSL control.
VSL Field Operation Test Interest has increased in the field of ATDM, and numerous simulation studies have been devoted to reveiw its effectiveness. Unfortunately, the real life benefits of ATDM application are still not apparent. This may be attributable to the following several factors: (1) inaccuracy of traffic data obtained from the available traffic sensors and failure to transmit the real-time and on-line data to the TMC; (2) absence of accurate traffic dynamics for real time traffic prediction; and (3) unreliable field application software in the field. To improve upon the above functions, DynaTAM (Dynamic network analysis Tool for Active Traffic and Demand Management) was developed by the University of Alberta. It can be used to analyze, simulate, and optimize a traffic network in offline or online. This field application software was used at the TMC of the City of Edmonton as a decision support tool. Also, in order to validate the performance, a comprehensive field operation test was conducted on the 11km Whitemud Dr. corridor, an urban freeway. The the westbound direction of Whitemud Dr. provided several challenges for microscopic modeling including on-ramps and offramps, diverging and merging sections, and several interacting bottlenecks. The testbed is shown in Figure 1.
Hiver 2017 | L’Ingénieur civil canadien
2017-12-05 1:33 PM
TECHNICAL: TRAFFIC SYSTEMS | TECHNIQUE: SYSTĂˆMES DE CIRCULATION
In 2010, the City of Edmonton installed sensors to measure traffic states to support several ITS-related projects. Dual loop detectors were installed on the mainline of the Whitemud Dr. testbed together with a video-based traffic monitoring system, permanent variable message signs and portable variable speed limit signs. The field operation test supported a comprehensive evaluation of the effectiveness of VSL with respect to freeway mobility. The evaluation framework focused on the detection of the performance of the system with respect to the intended application. Different Measures of Effectiveness (MOEs) were applied to quantify the performance and effectiveness. Figure 2 shows the interface of the developed software tool. The coded network in the graphical interface shows the testbed. In this project, the evaluation measured the effects of VSL implementation on a broad array of issues, and the impact on overall transportation system performance. The DynaTAM tool achieves the following broad functionalities: 1) estimation of the current state of a traffic network using both historical and real-time data; and 2) generation of prediction-based information for a given time horizon with the control variable. The two functions interact in a rolling horizon concept. DynaTAM has two components: 1) master module for finding optimal speed limit values based on the user selected VSL control algorithm; and 2) graphical user interface (GUI) for optimal speed limit displaying. The software reads real-time traffic data from the central database of the TMC and has the capability for on-line data conditioning. The master module of the software comprises the traffic simulator. METANET-based VSL control was implemented in the traffic
Canadian Civil Engineer | Winter 2017
CIVIL_Winter2017_LAZ.indd 23
Figure 2. DYNATAM Interface
simulator for the field test. A decision tree method was embedded in the master software module for finding the optimal speed limit satisfying several constraints on the optimal control variable. Optimal speed limit was displayed in the GUI of the TMC. The time varying field implemented speed limit values and estimated MOEs will be stored in the historical database for future reference.
Preliminary Performance Evaluation The preliminary VSL tests were conducted from August 11th to September 4th, 2015. The VSL control was operated during peak periods (6:30-8:30 am and 4:30-6:30 pm). In the performance evaluation, the performance between VSL-control and no-control scenarios from both mobility and safety perspective were compared. Comparison groups from historical data, which are in the same days of week as the field test, were chosen. A statistical significance t-test was applied to identify the traffic flow in VSL-control and no-control cases are in a similar pattern.
Conclusions and Future Scopes ATDM is a promising solution to improve traffic mobility and safety for both freeway
and arterial roadway networks. Reduced traffic congestion causes less carbon emissions and ultimately improves freeway traffic mobility. From the field operation test of this project, we have shown the benefits of implementing VSL based on model-based control. In future research, we will use the microscopic simulation tool to simulate the Connected Vehicle environment, and enhance our understanding of how local, coordinated and integrated ATDM can affect traffic operation of the studied corridor and perform simulation study of different active traffic management scenarios: 1) local ramp metering only; 2) coordinated ramp metering; and 3) coordinated ramp metering integrated with VSL. We will compare the performance measurements of different scenarios. Based on the simulation results, a suitable ATDM strategy will be recommended, including VSL and Coordinated RM, for the study corridor in the City of Edmonton, and some suggestions and recommendations for field implementation and further research direction will be provided.  Xu Wang, Ph.D. School of Civil Engineering, Shandong University, xu18@ualberta.ca
23
2017-12-05 1:33 PM
TECHNICAL: TRAFFIC SYSTEMS | TECHNIQUE: SYSTÈMES DE CIRCULATION
Web-Mining-Based Traffic Analytics Charanjeet Kaur, Diwakar Krishnamurthy, and Behrouz H. Far DEPARTMENT OF ELECTRICAL AND COMPUTER ENGINEERING, UNIVERSITY OF CALGARY
T
raffic data can be collected in various ways, and a common practice is roadside sensors, which is expensive because of infrastructure and planning costs, and it cannot be easily applied to new routes. In this article, we propose Web mining as an alternative, leveraging existing Internet sources to capture current traffic data. Commonly available application programming interfaces (APIs) are used to capture and store information. This approach is flexible and can be tailored to any route of interest, and it can also incorporate new data sources that affect commute times. Typically, the data collected for vehicle traffic analysis includes the following: • Number of cars, speed, flow, occupancy • Time of the day, weekday, weekend, day of the month, season, year • Weather, temperature, humidity • Road type • Events scheduled, e.g., hockey games • Events unscheduled, e.g., fire • Accidents, detours, lane closures • Police archives of incidents • Parking: location, occupancy • Zones: schools, elderly houses, event locations, historically accident prone areas • Glare (direction of sun) Much of this information can be collected from online sources such as Google Maps[1], Twitter[2] and websites providing weather information. Data mining techniques can be applied to infer how the traffic pattern on a given road is related to factors such as time of day, day of the week, accidents, and weather events. In contrast to traditional approaches relying on specialized roadside instrumentation, this approach is more flexible as it can be adapted with little effort and cost to analyze any road for which such Web data is available.
24
CIVIL_Winter2017_LAZ.indd 24
As a proof of concept, our system continuously collects and maintains historical commute time estimates for 18 heavy traffic roads in Calgary. The system also extracts reports of accidents on these roads by mining Twitter posts. We use clustering[3] on the dataset to discern succinct commute time trends and leverage the clustering analysis to build a model that can predict commute times. Specifically, the model can predict the commute time for a selected route given the following inputs: a) day of the week; b) time of the day; and c) weather condition. The technique first assigns the day for which prediction must be offered to one of the six clusters based on a Naïve-Bayes machine learning classification technique[4,8]. It then uses from this cluster the historical accident information for the given time of the day to estimate the commute time for that instant. Results show that the model is particularly effective in predicting commute times for workdays under both good and bad weather conditions. This work makes several new contributions. Firstly, we are not aware of other studies that have exploited Web mining for traffic analysis. Our methodology can serve as an example for others attempting similar studies. Secondly, we provide new insights on commute time patterns of Calgary’s busiest highway and the factors that influence them. This could for example be useful for those that manage the highway, and researchers who want to validate traffic simulators for the highway. Thirdly, we show how heuristics that combine finegrained accident data and clustering analysis can be leveraged to offer accurate commute time predictions. Finally, we share the datasets generated by our system with others for
use in their studies.
Data Collection System For collecting commute times, we rely on the Google Maps API which allows programmatic access to the information provided by the website[5]. Google provides the ICT commute time for free when accessing the Maps website using a browser, so we developed a custom parser to extract the ICT commute time. We augment the commute time information gathered with traffic accident information mined from Twitter[2]. We selected two sources, Canadian Traffic Network Calgary (@CTNCalgary) and 660 News Traffic (@660NewsTraffic). Tweets are programmatically gathered by a script using the Twitter Search API. Finally, we augment the commute time and accident information with historical weather data collected automatically from the climate. weather.gc.ca website[6].
Deerfoot Trail Case Study We analyzed the behaviour of Deerfoot Trail, a multi-lane highway that spans about 50km within Calgary and features 21 interchanges. It has three to four lanes in each direction and has a speed limit of 100 km/hr. It is Alberta’s busiest highway with traffic volumes ranging between 27,000 and 158,000 vehicles per day[7]. Data for both the north and south directions was collected for 202 days between September 21, 2013 to April 10, 2014. For each day, data from Google Maps and Twitter was collected for 19 different time instants (at 30-minute intervals during rush hours and two-hour intervals during other periods). Finally, we also tracked traffic in six nearly equal length
Hiver 2017 | L’Ingénieur civil canadien
2017-12-05 1:33 PM
TECHNICAL: TRAFFIC SYSTEMS | TECHNIQUE: SYSTÈMES DE CIRCULATION
sub-segments in each direction. We focused on the following broad questions to drive the analysis: • Q1: What are the peak traffic hours? • Q2: How are peaks related to accidents? • Q3: What are the bottleneck sub-segments during peak traffic?
Commute Time and Accidents We begin by focusing on peak traffic hours, discovering that the morning peak happens from 7 am to 9 am, and the evening peak from 3 pm to 6 pm. Comparing the maximums and standard deviations of commute times, the evening rush hour appeared more severe than the morning rush hour. Similar trends were seen in both directions. Next, we characterized in more detail the commute times during peak traffic. We plotted the probability density function (PDF) of
commute times for the morning peak hour in the north-south direction. Without traffic, it should take 35 minutes while following posted speed limits. Our findings indicate there is a significant probability that the commute time will exceed 35 minutes. Similar behaviour was revealed for the evening rush hours, and similar trends were observed for the south-north direction. We addressed Q2 by correlating peak commute times with accidents. Analysis indicates that there are more accidents in the evening peak hours than the morning peak. The data reveals there is negligible likelihood of observing more than two accidents in the morning. In contrast, there is significantly more likelihood of observing higher number of accidents in the evening peak hours. The higher incidence of accidents in the evening explains the higher commute times in
the evening. Unfortunately, we do not have data to identify the root cause of higher accidents in the evening. We intend to collect other sources of information, e.g., special events such as hockey games, to address this limitation. Finally, we exploit the sub-segment information from our system to address Q3. We consider six nearly equal sized sub-segments in both directions. For this analysis, we calculate the commute time normalized per kilometer to facilitate comparisons of sub-segment commute times. For each of the rush traffic instants, we calculate the percentage of days for which each sub-segment was the slowest, i.e., had maximum normalized commute time. For the north-south direction, during 7 am to 8 am the northern most point of the highway, consisting predominantly of industrial and com-
C’est l’heure! JE VEUX RENOUVELER ´ MON ADHESION
www.csce.ca Civil_Nov_NEWFrenchCSCE.indd 1
Canadian Civil Engineer | Winter 2017
CIVIL_Winter2017_LAZ.indd 25
2017-11-17 10:40 AM
25
2017-12-05 1:33 PM
TECHNICAL: TRAFFIC SYSTEMS | TECHNIQUE: SYSTÈMES DE CIRCULATION
mercial organizations, constitutes the bottleneck stretch for a majority of days. It also encompasses part of the airport and businesses that rely on air transportation, e.g., courier companies. Our data suggests there is heavy traffic volume in this segment possibly due to employees commuting to start their workday. In contrast to the morning hours, the bottleneck shifts at 3:00 pm to 4:30 pm to the segment spanning 16th Avenue NE to 17th Avenue SE which includes exits to the downtown core of the city. Long commute times in this segment in the evening are likely due to commuters returning home from downtown offices. There is another bottleneck switch from 5:00 pm to 5:30 pm to the segment situated south of the downtown core, an area that is predominantly industrial, and evening congestion is likely again due to commuters returning home from work. The south-north segment behaves quite differently, where the bottleneck segment in the northern most point of the highway remains the bottleneck throughout the day. This behaviour suggests there is a lack of a viable alternative to Deerfoot Trail for crossing this stretch, which likely results in heavy volume and delays.
Analysis of the sub-segment information provided several interesting observations on the accidents. More than 34% of the total accidents reported in the Tweets were concentrated on the 4km stretch covering the 16th Avenue NE, Memorial Drive, and 17th Avenue SE interchanges. Based on the speed limit, it should only take about three minutes to travel this sub-segment. However, the commute times in this sub-segment were as high as 66 minutes at 3 pm on 23rd December 2013 when it was snowing and there was 18 cm of snow on the ground. In summary, analysis reveals the evening rush period is longer and more severe in terms of commute times compared to the morning rush period. The increased likelihood of observing accidents in the evening hours, relative to the morning hours, likely explains the long evening commute times.
Clustering Analysis We performed clustering analysis to identify a small number of unique commute time patterns which will be used to develop a commute time prediction technique. We partitioned our dataset into a training set consisting of the first 153 days of data and a test set containing the remaining 49 days. We apply
k-means clustering[3] to identify unique commute time patterns. We have one cluster containing all days with no accidents (C1), three clusters for good weather days with accidents (C2, C3, and C4) and two clusters for bad weather days with accidents (C5 and C6). The commute time trends for the C1 cluster for the north-south and south-north directions reveal that it only contains weekends and holidays with no accidents. C1 captures the best possible traffic conditions on the highway. Clusters C3 and C5 together contain about 60% of the days in the training set. A remarkable feature of these clusters is that the days in these clusters have well-defined traffic patterns and are very close to their respective centroids. This suggests that commute time prediction models that leverage information in these clusters can be very effective.
Commute Time Prediction Our system can be exploited to develop commute time prediction models that can help commuters select less congested routes. They can also help traffic controllers come up with strategies to mitigate congestion. We present an approach that leverages historical com-
Figure 7. Summary of clustering - North–South
26
CIVIL_Winter2017_LAZ.indd 26
Hiver 2017 | L’Ingénieur civil canadien
2017-12-05 1:33 PM
TECHNICAL: TRAFFIC SYSTEMS | TECHNIQUE: SYSTÈMES DE CIRCULATION
mute time data. Specifically, our technique takes as input the weather forecast for a given day. It then the uses the results of clustering applied on historical commute times to offer a commute time prediction for various time instants in that day. The technique consists of two steps. First, we use Naïve-Bayes classification[4] to assign the day for which prediction is desired to one of the six clusters identified earlier. Next, we extract from this cluster the average number of accidents for each of the 19 time instants for which predictions are desired. We use the average for each instant to estimate commute time delays at that instant. Table 1: Prediction mismatch Prediction Percentage of mismatch predictions 0 minutes
18.7%
>0 and <=5 minutes
58.1%
>5 and <=10 minutes
18.2%
>10 and <=15 minutes
3.7%
>15 and <=20 minutes
0.9%
>20 minutes
0.5%
Table 1 provides a finer-grained analysis of the absolute difference between predicted and actual commute times from our technique. From the table, 76.8% of the predictions are within 5 minutes of their corresponding actual commute times. Considering the 50 KM distance of the highway, an error of 5 minutes Table 2: Prediction accuracy for different types of clusters Cluster Percentage of Average days classified error C1 14.3%
0.3%
C2 14.3%
27.4%
C3 18.4%
3.3%
C4 6.1%
7%
C5 46.9%
7.9%
Canadian Civil Engineer | Winter 2017
CIVIL_Winter2017_LAZ.indd 27
is not likely to be problematic to users of the prediction algorithm. Table 2 provides errors based on the cluster into which a prediction day is classified by our algorithm. From the table, no day in the test data set is classified into C6, which encompasses extreme weather days. This behaviour is due to the lack of extreme weather days in the test set, which spans the relatively mild months of March and April. From Table 2, predictions are accurate for days classified into C1, C3, C4, and C5. Clusters C3, C4, and C5 contain workdays, which are typically of more interest in commute time prediction exercises. From Table 2, predictions are poor for days in the test set that map to C2. Recalling our earlier analysis, C2 contains weekends and holidays with accidents. Accidents do not occur in any set patterns on these days in contrast to workdays where accidents typically happen during rush hours. Predictions for this cluster are likely to benefit from more training data.
Conclusion and Future Work Our analysis of traffic patterns of a 50km stretch of Deerfoot Trail indicated that while bottlenecks can shift depending on the traffic direction and time of the day, the segment spanning 32nd Avenue NE and 64th Avenue NE is the most congested overall and appears to be a good candidate for traffic optimization. Also, information from this system can be used to develop commute time prediction algorithms. Our system can be enhanced in several ways. The proposed methodology relies on the ICT commute time estimates from the Google Maps. While the results seem to conform to real traffic trends in Calgary, a more rigorous evaluation will be done to validate the accuracy of this metric. Our system also only focuses on accidents and weather as factors that influence commute time. As outlined in the introduction, there are other factors such as sun position, special events, and lane closures that can have impact. Some of these factors (e.g.,
lane closures), can be identified by enhancing our Twitter scripts’ text parsing capabilities. Other factors would require identification of more Web sources, e.g., hockey game schedules from nhl.com. Automating this would increase the flexibility of the system towards handling more routes. Furthermore, our system ignores fine-grained weather metrics such as temperature, visibility, and precipitation amounts. Such features can be added in a straightforward manner since they are readily available from providers of weather data.
ACKNOWLEDGEMENT This work has been partially supported by a grant from Natural Sciences and Engineering Research Council of Canada (NSERC) and Alberta Innovates - Technology Futures (AITF). Charanjeet Kaur, ckaur@ucalgary.ca Diwakar Krishnamurthy, dkrishna@ucalgary. ca Behrouz H. Far, far@ucalgary.ca
REFERENCES [1] Google Maps API, https://developers.google.com/maps [2] Twitter Search API, https://dev.twitter. com/docs/using-search [3] J. A. Hartignan, Clustering Algorithms. New York, NY: John Wiley and Sons Inc., 1975. [4] I. Rish, “An Empirical Stud of the NaïveBayes Classifier,” IJCAI Workshop on Empirical Methods in AI, pp. 41-46, 2001. [5] R. C. Fan, X. Yang, and J. D. Fay, “Using location data to determine traffic information”, U.S. Patent 6594576 B2, July 15, 2003. [6] Government of Canada – Climate, http:// climate.weather.gc.ca/ [7] Alberta Transportation – Traffic Volumes, https://www.transportation.alberta. ca/2639.htm [8] WEKA : Data Mining Tool, http://www. cs.waikato.ac.nz/ml/weka
27
2017-12-05 1:33 PM
TECHNICAL: TRAFFIC SYSTEMS | TECHNIQUE: SYSTÈMES DE CIRCULATION
Real-Time Signal Control for Urban Networks Mohammad Noaeen, Ph.D. candidate, Behrouz H. Far, professor Department of Electrical and Computer Engineering, University of Calgary Mohsen Ramezani, assistant professor, School of Civil Engineering, University of Sydney
O
ptimizing traffic signals is a concern for most modern cities, and it is important for the management of traffic flow, energy consumption, air pollution, and safety. The amount of research in this field is considerable, yet traffic congestion across the world persists. This implies the complexity of the problem and a deficit of applied techniques to efficiently manage urban traffic. One of the most controversial topics is the proposal of real-time traffic control to optimally time signals in large urban networks. Existing methods of real-time control only work when the traffic is in an undersaturated
condition (i.e., low traffic). However, oversaturated conditions are the most critical problems that must be handled. To fill this gap, we aim to propose computational solutions in a distributed multi-agent framework. This agent-based framework is composed of two agents, including an intersection control agent, and a sensors agent. The intersection control agent is composed of five modules: data collection, traffic state estimation and prediction, decision logic, signal actuation, and a communication module. Probe vehicles and loop detectors are separate modules of the sensors agent. Designing agents
Figure 1. The process flow of our research project
28
CIVIL_Winter2017_LAZ.indd 28
are identical throughout the network, which makes the system implementation easier. We aim to contribute to two main computing parts of this framework, including the decision logic module (i.e., network signal timing control), and traffic state estimation and prediction module (i.e., real-time input to the proposed signal timing control). We determined two main research problems in the two following research areas: 1- Computationally efficient real-time control for large-scale congested urban networks 2- Real-time queue length estimation and prediction for congested urban networks Let’s start with the second problem, which provides inputs to the first. For estimation purposes, vehicles’ positions and velocity are collected from mobile sensors (i.e., probe vehicles) and vehicle counts are gathered by fixed sensors (i.e., loop detectors). A powerful traffic flow theory (i.e., shockwave analysis) and data analysis techniques are employed to estimate the traffic states and queue lengths, which will be used as an input to the main control model. Applications of these methods are as follows: 1- Based on historical data, links’ Fundamental Diagrams are built, which is used and is fundamental in the shockwave analysis. 2- Queue lengths, shock waves, and queue shockwave profiles are identified and estimated in both real-time and offline processes based on the data collected from probe vehicles and loop detectors. 3- The evolution of queue lengths in an offline process for different times of days, weeks, and seasons are recorded as a historical database and is analyzed to extract a relation or correlation between queues of vehicles in adjacent intersections in various conditions.
Hiver 2017 | L’Ingénieur civil canadien
2017-12-05 1:33 PM
TECHNICAL: TRAFFIC SYSTEMS | TECHNIQUE: SYSTÈMES DE CIRCULATION This database will later be used as a support in the real-time signal timing process. 4- A real-time estimation method is customized to update shockwave profiles and vehicle trajectories to provide more reliable queue length estimates. The queue length estimates will then be used as input to the main proposed model in each intersection controller. In order to select an appropriate method for the first research problem—real-time control of traffic signals in large-scale networks— current literature argues that no optimization method can efficiently apply a control of traffic signals in real-time because of the computational complexities and in turn, they suggest the use of adaptive methods. In adaptive methods, the centralized and hierarchical approaches used in existing commercial tools are too slow to provide solutions for large-scale networks in real-time. Recent literature recommends ‘distributed adaptive’ methods. Among various distributed methods, the Max Pressure (MP) control method —a telecommunication network computing method— has been recognized the most desirable in city-wide networks in
terms of real-time computation efficiency, adaptability, scalability, robustness, queue stability, accessibility, and low amount of input data requirements. Because of these reasons, we selected the MP method. In spite of the above-mentioned features that MP provides, by reviewing the literature, we identified research gaps which will be addressed in our proposed method: the application of MP in congested networks considering spill-back issues, optimality of MP decisions, benefits of traffic signal coordination, management of small queues, and consideration of pedestrians. In the proposed agent-based method, controllers are installed at intersections to communicate with each other to maximize local throughput by sharing their knowledge of current traffic conditions. However, the system is designed in a way that each controller controls itself based on the data exchanged with the immediate adjacent intersections, not any other intersections in the network. The proposed approach will eventually be implemented and evaluated through a largescale network with real traffic data in a traffic
simulator. The results will then be compared with other methods, whether commercial tools (e.g., SCATS) or theoretical methods (e.g., the existing MP methods and the fixedtime Webster method). Figure 1 (opposite page) illustrates the process flow of our research project. In summary, we believe this research will foster a clear connection between three different areas of research: network control systems, data analysis, and traffic management. The outcome of this research will lead to a decrease in total queue length, total queue spill-backs, and total delay in the whole network, which as a result can lead to a decrease in fuel consumption and pollution and improve public safety. Mohammad Noaeen, mohammad.noaeen@ucalgary.ca Behrouz H. Far, far@ucalgary.ca M. Ramezani, mohsen.ramezani@sydney.edu.au ACKNOWLEDGEMENT
The authors thank Bea Margarita Esguerra and Saad Khurshid for their assistance.
CSCE SECTIONS SCGC Newfoundland
Sherbrooke
Durham/Northumberland
Calgary
Contact: Jean-Gabriel Lebel, MESCGC T. 514-502-7368 Courriel: jg.lebel@usherbrooke.ca
Contact: Robbie Larocque T. 905-576-8500 Email: robbie.larocque@dgbiddle.com
Contact: Kris Karvinen, MCSCE T. 403-716-1489 Email: cscecalgarychapter@gmail.com
Nova Scotia
Québec
London & District
Edmonton
East New Brunswick and P.E.I. (Moncton)
Contact: Kim Lajoie, MSCGC T. 418-650-7193 Courriel: scgc-sectionquebec@outlook.com
Contact: Julian N. Novick, MCSCE T. 519-850-0020 x104 Email: julian@wastell.ca
Contact: Courtney Beamish, MCSCE T. 780-264-1832 Email: chair@csceedmonton.ca
Capital Section (Ottawa-Gatineau)
Manitoba
Vancouver
Contact: Nima Aghniaey, MCSCE T. 613-580-2424 x17691 Email: nima.aghniaey@ottawa.ca
Contact: Tricia Stadnyk, MCSCE T. 204-474-8704 Email: tricia.stadnyk@umanitoba.ca
Contact: Graham Walker, MCSCE T. 780-496-5695 Email: graham.walker2@aecom.com
West New Brunswick
Toronto
South Saskatchewan
Vancouver Island
Contact: Nigel Parker, AMCSCE T. 647-463-5002 Email: nparker@rjc.ca
Contact: Harold Retzlaff, MCSCE T. 306-787-4758 Email: harold.retzlaff@gov.sk.ca
Contact: Jonathan Reiter, MCSCE T. 250-590-4133 Email: jreiter@seng.ca
Montréal
Hamilton/Niagara
Saskatoon
CSCE Hong Kong Branch
Contact: Bing Chen, MCSCE T. 709-864-8958 Email: bchen@mun.ca Contact: Haibo Niu, MCSCE Email: haibo.niu@dal.ca
Contact: Jérémie Aubé, MCSCE T. 506-777-0619 Email: jeremie.aube@wsp.com Contact: Brandon Searle, SMCSCE T. 506-260-3947 Email: Brandon.searle@opusinternational.ca Contact: Sara Rankohi, MSCGC T. 450-641-4000 x 3282 Email: sara.rankohi@groupecanam.com
Contact: Ben Hunter, MCSCE T. 905-335-2353 x 269 Email: ben.hunter@amec.com
Contact: Roanne Kelln, AMCSCE T. 306-665-0252 Email: rkelln@bbk-eng.ca
Contact: Kelvin Cheung, MCSCE T. 011-852-9225-0304 Email: kelvin_cheung@wanchung.com
Northwestern Ontario
Contact: Gerry Buckrell, MCSCE T. 807-625-8705/807-623-3449 Email: gerald.buckrell@hatchmott.com
Canadian Civil Engineer | Winter 2017
CIVIL_Winter2017_LAZ.indd 29
29
2017-12-05 1:33 PM
CSCE PARTNERS & SPONSORS | ASSOCIÉS ET COMMANDITAIRES DE LA SCGC We invite you to consult our web page (https://csce.ca/membership/corporate) to discover all the benefits associated with our Corporate Engagement Program. PREMIUM PARTNERS | PARTENAIRES PRÉMIUM
logo
Become a distinctive CSCE Corporate Partner and add your logo here.
MAJOR PARTNERS | PRINCIPAUX PARTENAIRES
SENIOR PARTNERS | PARTENAIRES PRÉMIUM
logo
Become a distinctive CSCE Corporate Partner and add your logo here. PARTNERS | PARTENAIRES
AFFILIATES | AFFILIÉS
30
CIVIL_Winter2017_LAZ.indd 30
Hiver 2017 | L’Ingénieur civil canadien
2017-12-05 1:33 PM
CIVIL_W
EXCLUSIVE FINANCIAL SECURITY PROGRAM
For engineers, geoscientists, students and their families Participants get
FREE INVESTMENT GUIDANCE
Just starting to save?
Retiring?
Somewhere in between?
Angela Harvey can help you: Create a plan for your savings goals Invest wisely Retire with confidence
Contact Angela
1-866-788-1293 ext. 5786 or angela.harvey@gwl.ca, or visit www.infosite.grs.grsaccess.com/engineers-canada Sponsored by:
Great-West Life and key design are trademarks of The Great-West Life Assurance Company (Great-West Life), used under licence by its subsidiaries, London Life Insurance Company (London Life) and The Canada Life Assurance Company (Canada Life). As described in this advertisement, group retirement, savings and income products are issued by London Life and payout annuity products are issued by Canada Life.
CIVIL_Winter_GWL.indd 1 CIVIL_Winter2017_LAZ.indd 31
2017-11-10 2017-12-05 3:21 1:33 PM PM
CIVIL_Winter2017_LAZ.indd 32
2017-12-05 1:33 PM