8 minute read
RESEARCH: PREDICTING PARKINSON'S USING SPEECH ANALYSIS


PREDICTING PARKINSO by N'S Jessic USI a Qiu NG SPEECH ANALYSIS
Introduction
Advertisement
Having no laboratory biomarkers and clear clinical diagnoses, Parkinson’s is a difficult disease to detect. Parkinson’s Disease (PD) is a progressive disorder of the central nervous system that affects thought and movement and is characterized by insufficient dopamine production in the midbrain region. Because dopamine is a significant neurotransmitter, aiding involuntary movements, its reduction can cause a wide range of motor and non-motor symptoms that may differ for every patient. For the motor group, PD may come with speech disorders, which can lead to changes in the voice, such as monotone speech, volume reduction, and loss of normal inflection. However, these changes in speech may be helpful in the detection of PD with the development of technologies such as machine learning [1]. Machine learning (ML) is extremely beneficial in detecting Parkinson’s. ML algorithms seem promising in diagnosing the disease through speech analysis, as voice degeneration is possibly one of the first detectable symptoms of the disease. Because of this, multiple studies have been considering the application of computational tools to analyze vocal patterns as a viable and timely way of diagnosing PD [5][6]. Works using voice signal have continued with contributing new feature extractors and data sets, and researchers have also used these voice measurements to estimate the severity of the disease [2]. Researchers have experimented with many forms of artificial intelligence algorithms such as neural network construction (NNC) in discriminating PD patients from healthy volunteers [7]. However, while studies have shown that speech features can be automated and assessed with diagnostic reliability, it is necessary to expand on previous research to support this method. In this paper, the idea of using machine learning algorithms to detect PD was built upon, and this technique was explored in greater depth. This paper’s goal was to determine the effectiveness of speech analysis on predicting whether a person has Parkinson’s or not using SVM and NNC models.
Methods
Data
The dataset used was acquired by Max Little and the National Centre for Voice and Speech, who recorded the voice signals from thirty-one subjects, twenty-three of which have Parkinson’s [4][3]. The data included an average of six sustained vowel phonations from each individual, resulting in 195 phonations in total, in which each column was a specific voice feature and each row was one of the 195 voice recordings from these subjects. Healthy subjects were identified with a 0, while those with PD were given a 1 under the status column. Before creating the model, it was necessary to preprocess the data, normalizing the numbers so that they were scaled down but still proportional to each other. To do so, the column with all the subject names had to be deleted because they did not consist of numbers. The dataset was split into a training set being 146 samples and testing set as 49 samples.
SVM
The Radial Basis Function (RBF) kernel formula for the SVM algorithm utilized in the experiment is presented below:
where ||X1 − X2||2 is the Euclidean Distance between the two points X1 and X2, and σ is the variance and hyperparameter. This equation calculates how close two points X1 and X2 are to each other. The RBF kernel is a helpful approach when the data is not linearly separable as it can generate optimal decision boundaries by doing non-linear transformations on the features and transforming them into higher dimensional space using the kernel-trick. This algorithm is best for the dataset as compared to other classifiers because SVM performs better with larger features and less data, and it is not as computationally expensive because it only needs to store support vectors during training and not the full dataset.
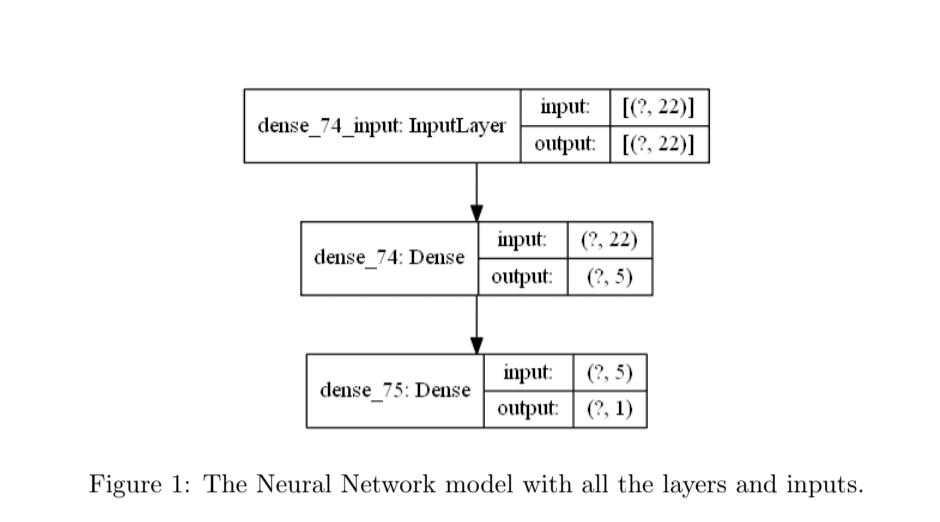
Neural Network
The neural network model consists of two layers, with five neurons in the hidden layer with a sigmoid activation function, and a binary cross-entropy loss function, and it was found that a learning rate of 0.07 and a batch size of 2 gave the best results, as the accuracy scores were the highest.
The model was then. trained for 500 epochs. The neural network algorithm is a suitable choice for the dataset because it is able to construct functions that can explain even the complex patterns in data, making it a good classifier. Using Python 3 with libraries numpy, pandas, matplotlib, and tensorflow, the code for all experiments can be found here: https://github.com/awesomejessica/Parkinsons
Results
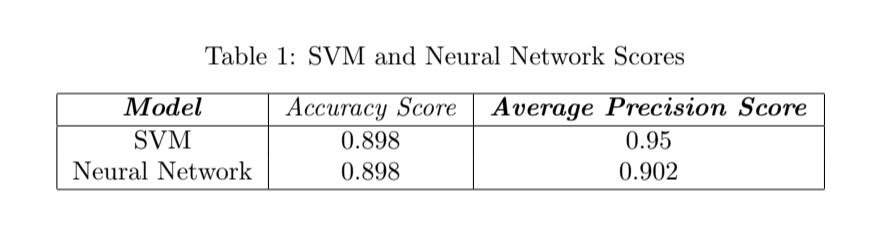
As shown in Table 1, the SVM and neural network models have similar accuracy scores of 0.898, but the SVM model has a higher average precision score (AP), since the SVM model has an AP of 0.95, more than the neural network model’s AP of 0.902. This means that although both models are good at overall accurately predicting Parkinson’s, the SVM model handles positives better, the cases that have a status of one, by correctly identifying more positives and making less mistakes of identifying false positives.
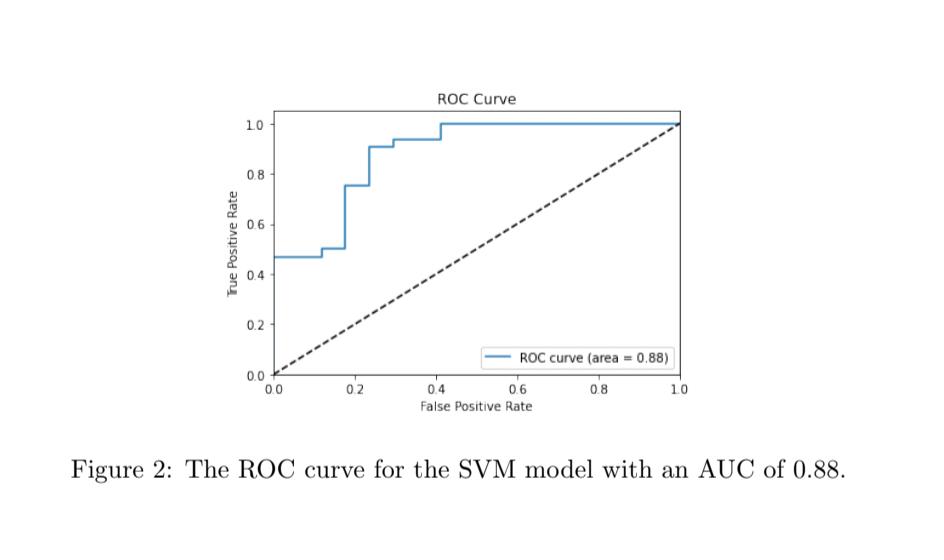
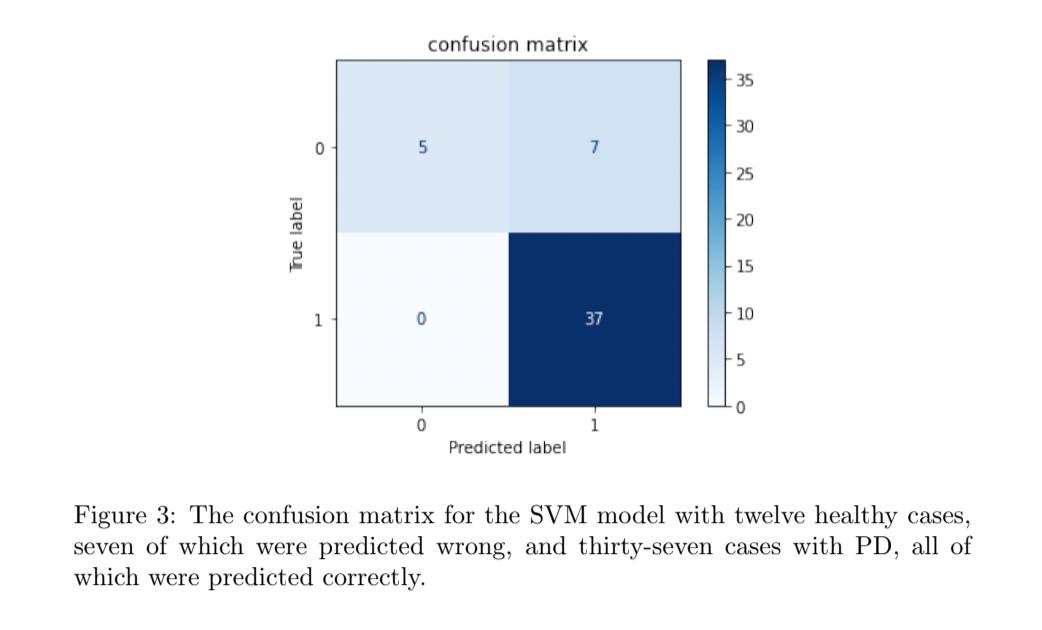
The ROC curve of the SVM model in Figure 2 shows that the classifier performed well. The curve is close to the top-left corner, the spot for perfect performance, since that is where the false positive rate is the lowest and the true positive rate is the highest, and it is far away from the dotted diagonal line, which is the baseline for a random classifier and is expected to be the worst or least accurate performance. The area under the graph (AUC) can also be an indicator of how good the SVM classifier is, as it summarizes its performance into a single measure of 0.88. This value is very close to 1, meaning the model has a high measure of separability. In Figure 3, the confusion matrix for the SVM classifier shows that the model is better at identifying true positives correctly than true negatives. Out of the thirty-seven cases of which the subjects actually had Parkinson’s, the model predicted all of them correctly. However, out of the twelve cases of which the subjects were healthy, the model only predicted five correctly, and identified the other seven as having Parkinson’s. This could be because the preprocessing was not done enough, or it could be because of the random state that was put as a parameter into the creation of the SVM model, since the default should be none when the probability parameter is default, or equal to false. Even though the AP score for the SVM model is pretty high, there are still errors the model make in identifying true negatives.
Discussion
When compared to other works which used machine learning techniques and speech signals to detect Parkinson’s such as Almeida’s experiment [1], the results concede. In Almeida’s research using smartphones, the number of false positives was higher than false negatives, meaning that more healthy subjects were confused with those who had PD and that the chance of someone with PD who was diagnosed as healthy was lower, according to their confusion matrix. The confusion matrix shows the same results, as the SVM model identified more false positives than false negatives as well.
The accuracy scores in the experiment are also close to the percentages of other works [7]. In both of the models, the accuracy scores were around 89.8%, which is close to Tsoulos’s 93.11%, even though they is a bit lower, possibly because the preprocessing was not sufficient, or the random state parameter not being set to default while creating the model. In the neural network model, it could have been because the batch size was too small and more higher sizes were not tried enough. Although the classifiers used in the experiment were effective and performed well as shown by the results, the number of models could have been expanded such as including decision trees or KNN so that there would be more models to compare with each other instead of only two. More errors could have been minimized, especially the number of false positives as shown in Figure 3, or the number of healthy subjects who were mistaken for those with PD. In the future, these concerns can be addressed by using a variety of classification models and employing a bigger dataset, from which more insight can be extracted.
References
[1] Jefferson S Almeida et al.
“Detecting Parkinson’s disease with sustained phonation and speech signals using machine learning techniques” . In: Pattern Recognition Letters 125 (2019), pp. 55–62.
[2] Daria Hemmerling and Magdalena Wojcik-Pedziwiatr. “Prediction and Estimation of Parkinson’s Disease Severity Based on Voice Signal” . In: Journal of Voice (2020).
[3] Max Little et al.
“Exploiting nonlinear recurrence and fractal scaling properties for voice disorder detection” . In: Nature Precedings (2007), pp. 1–1.
[4] Max Little et al.
“Suitability of dysphonia measurements for telemonitoring of Parkinson’s disease” . In: Nature Precedings (2008), pp. 1–1.
[5] Betul Erdogdu Sakar et al.
“Collection and analysis of a Parkinson speech dataset with multiple types of sound recordings” . In: IEEE Journal of Biomedical and Health Informatics 17.4 (2013), pp. 828–834.
[6] Shimon Sapir et al.
“Formant centralization ratio: A proposal for a new acoustic measure of dysarthric speech” . In: (2010).
[7] Ioannis G Tsoulos et al.
“Application of machine learning in a parkinson’s disease digital biomarker dataset using Neural Network Construction (NNC) methodology discriminates patient motor status” . In: Frontiers in ICT 6 (2019), p. 10.
ABOUT THE AUTHOR
Jessica Qiu is a senior at Lynbrook High School who enjoys playing volleyball, listening to music, and playing the ukulele in her free time. Two things that make her happy are her dog Lucky and making Spotify playlists. Her favorite subjects in STEM are computer science, math, and chemistry, and she hopes to pursue CS in her future.
ABOUT US