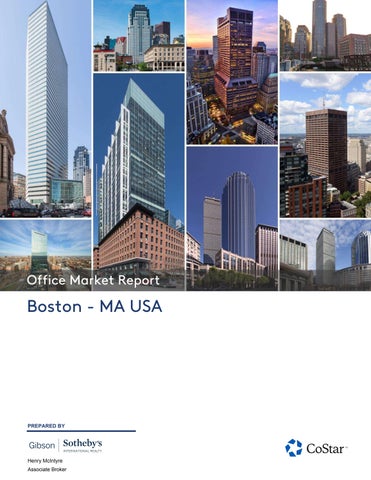
Office Market Report
Boston - MA USA
PREPARED BY
Henry McIntyre Associate Broker
Boston Office
OFFICE MARKET REPORT
Market Key Statistics
1
Leasing
2
Rent
7
Construction
10
Under Construction Properties
12
Sales
14
Sales Past 12 Months
16
Economy
18
Market Submarkets
23
Supply & Demand Trends
30
Rent & Vacancy
32
Sale Trends
34
© 2026 CoStar Group - Licensed to Gibson Commercial - 1361278
1/8/2026
Overview Boston Office 12 Mo Deliveries in SF
12 Mo Net Absorption in SF
Vacancy Rate
Market Asking Rent Growth
4.9M
(1.5M)
15.3%
2.0%
Stagnant demand has weighed on the Boston office market. Formerly a major driver of office leasing, the life sciences sector remained dormant through 2024. The stalwart industries of technology, finance, and professional services maintain their holding pattern with few large block leases signed this year. The lack of leasing is compounded by the wave of new deliveries, a volume of new space not seen in a generation. As a result, the metro has reached a record-high vacancy of 15.3%, tracking with the 14.1% national figure. Boston has outperformed the national average every quarter since 07Q3. However, the vacancy rate has more than doubled from the relative low of 6.7% in 19Q4. The delta between Boston and the national rate has closed in 25Q1, having peaked at a 2.6 percentage point spread, as seen five years prior. The forecast calls for Boston vacancy to eclipse the national mark by mid2025. According to foot traffic data from Placer.AI, midsummer highs had Boston office attendance improve 10.3% year over year, the largest percent increase among the major US metros. Despite this marked improvement, Boston trails the 70% national average for office attendance. The metro has recovered to 67.4% of pre-pandemic levels, a new high. Boston still has room to run; the 12-month figures show positive momentum as area companies solidify their return-to-office plans.
With attendance not yet fully recovered, tenants have given back -1.5 million SF of space in the past 12 months. This is the largest negative absorption year since 2001. Availability has now passed 18%, which includes over 13 million SF of available sublease space. Meanwhile, 17 million SF of new supply was delivered in the three-year period ending at year-end 2024. This glut of new space is delivering at a rate not seen in over 20 years and has been a driving factor behind the spike in space availability. Further, Boston faces future headwinds with an additional 7.6 million SF slated to deliver by year-end 2026; much of this space is laboriented development. Transaction volume was muted through 2024, showing the lowest total sales volume in any of the last 15 years. Only a few trades have reached the 9-figure mark this year: one was a leasehold on a pair of lab-oriented office buildings and another was a new construction asset in the urban core. Both buildings were largely leased at the time of sale. Liquidity has yet to return to the market despite the rate cuts at year-end 2024. Repricing is likely among distressed assets throughout the metro, even as new construction assets set $/SF records in the CBD.
KEY INDICATORS RBA
Vacancy Rate
Market Asking Rent
Availability Rate
Net Absorption SF
Deliveries SF
Under Construction
4 & 5 Star
144,901,400
21.2%
$61.85
26.1%
(197,644)
0
4,019,000
3 Star
165,733,817
14.2%
$34.83
16.7%
(512,190)
0
172,210
1 & 2 Star
62,779,930
4.7%
$26.73
5.5%
(53,899)
0
0
Market
373,415,147
15.3%
$44.14
18.6%
(763,733)
0
4,191,210
12 Month
Historical Average
Forecast Average
Peak
When
Trough
When
Current Quarter
Annual Trends
Vacancy
1.3% (YOY)
9.4%
14.7%
15.3%
2026 Q1
2.9%
2000 Q2
(1.5M)
1,696,136
1,727,340
12,815,570
2000 Q2
(8,166,941)
2001 Q4
Deliveries SF
4.9M
4,027,645
1,593,389
9,535,529
2002 Q1
960,249
2012 Q1
Market Asking Rent Growth
2.0%
2.1%
1.6%
19.0%
2000 Q4
-14.2%
2002 Q3
Sales Volume
$2B
$4.7B
N/A
$15.3B
2007 Q2
$949.4M
2010 Q1
Net Absorption SF
© 2026 CoStar Group - Licensed to Gibson Commercial - 1361278
1/8/2026 Page 2
Leasing Boston Office Life science demand led market leasing activity in the years after the onset of the pandemic recovery, but this demand has now evaporated. Thus, a sharp pullback in life science activity no longer offsets the slowdown in requirements from the more traditional office-using sectors. Tenants are active in the market, but a net reduction in overall demand still exists. Net absorption for the past 12 months has been -1.5 million million SF, and the forecast calls for an additional -6 million square feet of absorption over the next four quarters. Small tenants are most active in the region, but their net demand falls short of what would be needed to backfill the space becoming available. The average deal size in 2024 fell below 5,000 SF, 27% below the five-year average. Companies have continued their space reduction efforts across the metro. One example is LEGO's relocation from Enfield, CT, to 1001 Boylston St. in Fenway. Another is Toast's sublease from GoTo at 333 Summer St. in the Seaport's Fort Point neighborhood, which constitutes a reduction of over 15,000 SF from the firm's former location at 401 Park Drive in Longwood. That property is now being repurposed for lab use by Alexandria Real Estate Equities. The largest leases have primarily been renewals, accounting for eight of the ten largest transactions in 2024. Vertex Pharmaceuticals renewed for 1.1 million SF at their Seaport campus, and Takeda Pharmaceuticals
extended their Kendall Square lease through 2040. Boston remains a hub for life science innovation in the US and globally, with 11 of the 15 largest biotechnology companies having a local presence. There have been bright spots in the Boston leasing market. Healthtech company Veeva Systems doubled its footprint in downtown Boston, committing to having a common ground for its workforce while having a selfdescribed “work anywhere” policy. Bain Capital renewed and expanded its lease at 200 Clarendon Street, growing its footprint by 20% and keeping its headquarters in Back Bay. Hasbro is also said to be mulling over a potential move from the Rhode Island suburbs into the Boston area – a move they contemplated pre-covid but is now seeing renewed interest. Market participants indicate upwards of 3 million SF of active requirements in the market, including several touring for at least 100,000 SF of space. Boston availability has climbed over the last three years, reaching an all-time high of 18.6% in 25Q1. In 2024, Boston eclipsed the national availability rate after outperforming this metric for 67 straight quarters. 4 & 5 star space has been a major driver of availability, now reaching 26.1% available due to new supply coming online without full lease-up and a net reduction of space from existing tenants. Further deliveries and depressed demand are expected to continue in the coming years, with vacancy forecasted to eclipse the national vacancy and peak near 16% in 2026 to 2027.
© 2026 CoStar Group - Licensed to Gibson Commercial - 1361278
1/8/2026 Page 3
Leasing Boston Office NET ABSORPTION, NET DELIVERIES & VACANCY
VACANCY RATE
© 2026 CoStar Group - Licensed to Gibson Commercial - 1361278
1/8/2026 Page 4
Leasing Boston Office AVAILABILITY RATE
© 2026 CoStar Group - Licensed to Gibson Commercial - 1361278
1/8/2026 Page 5
Rent Boston Office Boston's rents have held flat in the 2020s, contrasting with an average growth of 5% annually in the ten years following the Great Financial Crisis from 2009 to 2019. Market asking rent currently sits at $44.00/SF; had this kept pace with headline CPI in the metro area, it would now be closer to $50/SF. This indicates that rents have fallen in real terms even as operating expenses have climbed along with consumer prices. Market participants report that the gap between asking and taking rents, which had all but disappeared in the late 2010s, is now around 10%. They also say that offers of 12 months of free rent and tenant improvement allowances above $180 per SF are now available for a 10-year new lease for first-generation space. Such a package could represent about half of the total lease value over that term, as much as twice the impact of a typical concession package in 2019. Concessions seem to be softening in early 2025, but they are expected to linger as Boston faces supply pressures. The Cambridge life science clusters lead the metro in rents, with rates around $81/SF and $70/SF in the Kendall and Harvard submarkets, respectively. But even here, rents have stagnated, with less than half a percentage point of change in the last 12 months, which is in line with the broader metro. The three major CBD submarkets – the Financial District, Back Bay, and
Seaport – all post rates in the $50/sf range, though all have seen slight negative movement in the trailing 12 months. The suburban submarkets have fared somewhat better, with nearly all posting marginal rent growth in the same period. The two suburban submarkets with rent contraction are those with more active construction pipelines; Somerville/Everett has 1.9 million SF underway that will grow inventory by 26% at delivery, and Watertown has 321,000 SF in the pipeline, which will deliver a 6% bump in supply. Given the wealth of available space, the outlook for rent growth is poor and likely to be outpaced by even cooling inflation figures. There is also pressure from the large amount of high-quality sublease inventory, typically available at discounts of 25-30% from direct rents. Of the 70.1 million SF currently available, 18.1% is sublease, down from the peak of 22% in Q323. Considering these stresses, the CoStar house view is that market asking rents will fall through 2025, with the average declining to around $41/SF in mid-2026. This would be about 2% below their current level, in contrast to marginally positive national growth over the same period. The projected decline is closer to 4% among 4 & 5 Star properties, which will face additional pressures from the construction pipeline, delivering competitive space in the near term.
MARKET ASKING RENT GROWTH (YOY)
© 2026 CoStar Group - Licensed to Gibson Commercial - 1361278
1/8/2026 Page 8
Rent Boston Office MARKET ASKING RENT PER SQUARE FEET
4 & 5 STAR EXPENSES PER SF (ANNUAL) Market / Cluster
Boston
Utilities
Cleaning
Insurance
Taxes
Other
Total
$3.61
$1.26
$0.45
$7.56
$7.40
$20.28
Boston/Suffolk County
$3.41
$1.60
$0.57
$10.11
$8.19
$23.87
Cambridge
$5.03
$0.88
$0.51
$10.15
$8.56
$25.13
Close-In Suburbs North
$3.20
$1.26
$0.53
$3.83
$6.12
$14.93
Route 128 North
$2.32
$1.23
$0.29
$5.57
$5.18
$14.59
Route 128 South
$3.09
$1.17
$0.34
$4.93
$6.30
$15.83
Route 128 West
$4.19
$1.22
$0.39
$6.67
$8.55
$21.02
Route 3 North
$4.38
$0.90
$0.31
$3.81
$5.40
$14.81
Route 495 North East
$2.15
$0.63
$0.30
$4.24
$5.06
$12.38
Route 495 South
$3.98
$1.48
$0.34
$1.81
$4.90
$12.51
Route 495/Mass Pike West
$2.52
$1.24
$0.30
$5.08
$5.46
$14.60
Route 495/Route 2 West
$1.35
$0.58
$0.28
$2.20
$5.65
$10.06
Southern New Hampshire
$2.74
$0.92
$0.33
$2.28
$6.11
$12.38
Expenses are estimated using CMBS, NCREIF, Trepp, IREM, and CoStar data using the narrowest possible geographical definition from Zip Code to region.
© 2026 CoStar Group - Licensed to Gibson Commercial - 1361278
1/8/2026 Page 9
Sales Boston Office Office investment activity remains muted after the banner year 2021 when a record $12.6 billion traded in the Boston metro. The $2.0 billion traded in the trailing 12 months marks an 80% drop from the 2021 high and the lowest annual total since 2010. Fewer transactions and smaller deals have contributed to the sharp pullback in activity. 2024 saw only two deals transact at a value over $100 million compared to six such deals in 2023. In sharp contrast to prior years, there had been a significant pullback in the sale of lifescience-oriented buildings in 2024. Only two of the ten largest building sales this year were labs, compared to eight of the ten largest in 2023. The fourth quarter of 2021 delivered an all-time high for market sale price per SF at $485. Three years later, this figure contracted to $ $350/SF in 25Q1, a 28% drop. This reduction has been driven by fewer urban assets trading. The slowdown in investment activity coincided with major buyer and seller mix shifts. Institutional buyers were involved in 52% of transactions in 2023, but that figure fell to 18% in 2024. Private equity was largely absent from the market in 2023 but captured 33% of 2024 sales volume on the buy side. REITs dominated the seller side in 2023, responsible for 57% of volume. The two major players were Alexandria and BXP, which sold life science assets. Users and private groups were the primary sellers in 2024, responsible for 34% and 39% of volume, respectively. MIT was the largest seller of the year, continuing the life science sell-off with a two-property leasehold acquired by Blackstone portfolio company
BioMed Realty for $361 million. Institutional investors have been involved in some of the largest purchases of the year. Azora Exan closed on two properties in Back Bay for a combined $140 million, including 149-155 Newbury Street, which sold for a record-setting $2,220/SF. Azora plans to invest in the assets looking to grow rents in the medium to long term. Boston has long been a destination for foreign capital, but these trades represent a return to traditional office after being concentrated in life science assets in recent years. Suffolk University acquired 101 Tremont Street with 18% occupancy at the time of sale: the University plans to convert the building to student housing. Similarly, 400 Atlantic Avenue was sold after being vacated, and the mortgage matured. Luxembourg-based JAJ Investment Group acquired the building as their first foray into Boston. The firm is planning a hotel a conversion, citing distress in the office market. JAJ has a track record of converting offices to residential and hospitality. Through 2025, Boston's beleaguered office market will likely continue seeing depressed sales volume. The Federal Reserve cut rates in 24Q4, reducing the federal funds rate by 1.0 percentage points. This move has yet to unleash a flood of liquidity into capital markets, and the Fed has paused further cuts thus far in 2025. Highvacancy buildings will continue to attract the interest of opportunistic buyers eyeing conversion or longer-term holds. Still, intensive capital requirements could limit what buyers will be willing to pay for office properties in the near term.
© 2026 CoStar Group - Licensed to Gibson Commercial - 1361278
1/8/2026 Page 15
Sales Boston Office SALES VOLUME & MARKET SALE PRICE PER SF
MARKET CAP RATE
© 2026 CoStar Group - Licensed to Gibson Commercial - 1361278
1/8/2026 Page 16
Sales Past 12 Months Boston Office Sale Comparables
Avg. Cap Rate
Avg. Price/SF
Avg. Vacancy At Sale
553
7.2%
$169
15.5%
SALE COMPARABLE LOCATIONS
SALE COMPARABLES SUMMARY STATISTICS Sales Attributes
Low
Average
Median
High
Sale Price
$4,000
$7,028,690
$1,375,000
$227,000,000
Price/SF
$0.03
$169
$190
$1,928
Cap Rate
2.4%
7.2%
7.4%
10.6%
Time Since Sale in Months
0.0
6.3
6.4
12.0
Property Attributes
Low
Average
Median
High
Building SF
642
38,211
9,129
731,204
Stories
1
3
2
32
Typical Floor SF
534
10,676
4,500
159,000
Vacancy Rate At Sale
0%
15.5%
0%
100%
Year Built
1750
1946
1965
2026
Star Rating
2.5
© 2026 CoStar Group - Licensed to Gibson Commercial - 1361278
1/8/2026 Page 17
Submarkets Boston Office SUBMARKET INVENTORY Inventory
12 Month Deliveries
Under Construction
No.
Submarket
Bldgs
SF (000)
% Market
Rank
Bldgs
SF (000)
Percent
Rank
Bldgs
SF (000)
Percent
Rank
1
Allston/Brighton
102
4,056
1.1%
33
2
549
13.5%
4
2
530
13.1%
3
2
Amesbury/Ipswich
186
1,922
0.5%
41
0
0
0%
-
0
0
0%
-
3
Back Bay
172
17,533
4.7%
5
1
232
1.3%
7
0
0
0%
-
4
Burlington/Woburn
309
14,340
3.8%
7
0
0
0%
-
0
0
0%
-
5
Charlestown/East Boston
104
4,414
1.2%
32
1
99
2.2%
11
0
0
0%
-
6
Chelsea/Revere
130
2,045
0.5%
40
1
30
1.5%
15
0
0
0%
-
7
Concord/Maynard
365
10,952
2.9%
12
0
0
0%
-
0
0
0%
-
8
Danvers/Beverly
215
6,172
1.7%
21
0
0
0%
-
0
0
0%
-
9
E Cambridge/Kendall Sq
126
23,068
6.2%
2
0
0
0%
-
4
2,210
9.6%
1
10
Essex/Gloucester
101
1,019
0.3%
46
0
0
0%
-
0
0
0%
-
11
Financial District
245
45,483
12.2%
1
1
693
1.5%
2
0
0
0%
-
12
Framingham/Natick
400
10,603
2.8%
13
0
0
0%
-
0
0
0%
-
13
Groton/Townsend
139
1,149
0.3%
44
0
0
0%
-
0
0
0%
-
14
Hopkinton/Holliston
82
1,882
0.5%
42
0
0
0%
-
0
0
0%
-
15
I-95 Corridor South
356
5,309
1.4%
24
0
0
0%
-
0
0
0%
-
16
Lawrence/Andover
481
12,294
3.3%
9
0
0
0%
-
0
0
0%
-
17
Lexington/Arlington
249
5,037
1.3%
26
0
0
0%
-
0
0
0%
-
18
Longwood/Fenway
89
11,150
3.0%
10
2
472
4.2%
5
1
660
5.9%
2
19
Lowell/Chelmsford
489
19,212
5.1%
3
0
0
0%
-
0
0
0%
-
20
Lynnfield/Wakefield
104
2,364
0.6%
39
0
0
0%
-
0
0
0%
-
21
Marlborough
124
6,810
1.8%
18
0
0
0%
-
0
0
0%
-
22
Medford/Malden
160
3,415
0.9%
37
1
128
3.8%
9
1
88
2.6%
6
23
Mid-Cambridge/Harvard Sq
229
9,363
2.5%
14
0
0
0%
-
0
0
0%
-
24
Midtown
90
4,783
1.3%
28
0
0
0%
-
0
0
0%
-
25
Newton/Brookline
340
8,741
2.3%
15
0
0
0%
-
0
0
0%
-
26
North End/Waterfront
44
1,358
0.4%
43
0
0
0%
-
0
0
0%
-
27
North Station/Beacon Hill
79
8,117
2.2%
17
0
0
0%
-
0
0
0%
-
28
Peabody/Salem
251
3,426
0.9%
36
1
4
0.1%
18
0
0
0%
-
29
Quincy/Braintree
401
11,141
3.0%
11
1
122
1.1%
10
0
0
0%
-
30
Rockingham
989
12,380
3.3%
8
2
31
0.2%
14
2
44
0.4%
7
31
Route 1 South
265
8,331
2.2%
16
0
0
0%
-
1
320
3.8%
4
32
Route 24
386
4,695
1.3%
29
0
0
0%
-
1
20
0.4%
8
33
Route 3 Corridor
451
5,940
1.6%
23
0
0
0%
-
0
0
0%
-
34
Route 3 South
572
5,967
1.6%
22
0
0
0%
-
0
0
0%
-
35
Roxbury/Dorchester
190
4,606
1.2%
30
0
0
0%
-
0
0
0%
-
36
Saugus/Lynn
231
3,169
0.8%
38
0
0
0%
-
0
0
0%
-
37
Seaport
90
18,275
4.9%
4
1
571
3.1%
3
1
319
1.7%
5
38
Somerville/Everett
171
6,446
1.7%
20
3
1,215
18.8%
1
0
0
0%
-
39
South Boston
62
683
0.2%
47
0
0
0%
-
0
0
0%
-
40
South End
68
3,717
1.0%
34
0
0
0%
-
0
0
0%
-
41
South Suffolk County
94
1,042
0.3%
45
0
0
0%
-
0
0
0%
-
42
Strafford County
323
5,006
1.3%
27
1
17
0.3%
16
0
0
0%
-
© 2026 CoStar Group - Licensed to Gibson Commercial - 1361278
1/8/2026 Page 25
Submarkets Boston Office SUBMARKET INVENTORY Inventory
12 Month Deliveries
Under Construction
No.
Submarket
Bldgs
SF (000)
% Market
Rank
Bldgs
SF (000)
Percent
Rank
Bldgs
SF (000)
Percent
Rank
43
W Cambridge/Alewife
123
4,489
1.2%
31
2
394
8.8%
6
0
0
0%
-
44
Waltham
237
16,106
4.3%
6
1
71
0.4%
12
0
0
0%
-
45
Watertown
109
5,222
1.4%
25
1
63
1.2%
13
0
0
0%
-
46
Wellesley/Needham
232
6,469
1.7%
19
1
210
3.2%
8
0
0
0%
-
47
Wilmington/Reading
129
3,682
1.0%
35
1
8
0.2%
17
0
0
0%
-
© 2026 CoStar Group - Licensed to Gibson Commercial - 1361278
1/8/2026 Page 26
Submarkets Boston Office SUBMARKET RENT Market Asking Rent
12 Month Market Asking Rent
QTD Annualized Market Asking Rent
No.
Submarket
Per SF
Rank
Growth
Rank
Growth
Rank
1
Allston/Brighton
$45.32
10
1.9%
34
90.9%
6
2
Amesbury/Ipswich
$25.86
36
2.5%
6
68.6%
44
3
Back Bay
$64.66
3
1.4%
46
98.3%
2
4
Burlington/Woburn
$33.31
23
2.1%
24
87.5%
11
5
Charlestown/East Boston
$38.46
18
2.3%
13
84.3%
17
6
Chelsea/Revere
$34.60
21
2.2%
21
71.8%
37
7
Concord/Maynard
$24.88
41
2.5%
7
75.9%
30
8
Danvers/Beverly
$24
44
1.7%
38
74.8%
32
9
E Cambridge/Kendall Sq
$80.99
1
1.7%
39
96.0%
3
10
Essex/Gloucester
$23.76
46
1.9%
32
81.2%
23
11
Financial District
$62.40
4
2.0%
31
99.4%
1
12
Framingham/Natick
$30.22
27
2.4%
10
84.2%
18
13
Groton/Townsend
$23.99
45
2.3%
11
70.4%
41
14
Hopkinton/Holliston
$25.49
38
2.6%
4
80.9%
24
15
I-95 Corridor South
$26.90
34
1.8%
36
70.5%
40
16
Lawrence/Andover
$27.44
31
2.9%
2
71.7%
38
17
Lexington/Arlington
$40.52
16
2.3%
15
81.5%
22
18
Longwood/Fenway
$53.71
8
1.5%
45
85.3%
16
19
Lowell/Chelmsford
$25.22
39
2.8%
3
80.4%
25
20
Lynnfield/Wakefield
$27.75
30
2.0%
27
86.3%
13
21
Marlborough
$25.50
37
2.6%
5
84.1%
19
22
Medford/Malden
$34.05
22
2.0%
30
78.9%
28
23
Mid-Cambridge/Harvard Sq
$71.73
2
2.2%
20
83.4%
21
24
Midtown
$37.93
19
2.4%
9
79.6%
27
25
Newton/Brookline
$39.11
17
1.9%
35
70.0%
42
26
North End/Waterfront
$42.80
13
2.3%
12
91.0%
5
27
North Station/Beacon Hill
$53.74
7
3.1%
1
75.2%
31
28
Peabody/Salem
$23.59
47
1.6%
43
72.5%
35
29
Quincy/Braintree
$30.84
25
2.1%
23
83.9%
20
30
Rockingham
$27.30
32
1.0%
47
72.1%
36
31
Route 1 South
$27.86
29
2.1%
22
80.3%
26
32
Route 24
$24.91
40
2.0%
28
73.1%
34
33
Route 3 Corridor
$27.15
33
1.8%
37
68.1%
45
34
Route 3 South
$26.30
35
1.9%
33
62.1%
47
35
Roxbury/Dorchester
$36.24
20
2.3%
17
85.5%
15
36
Saugus/Lynn
$24.47
42
1.5%
44
70.9%
39
37
Seaport
$61.42
5
2.0%
29
94.6%
4
38
Somerville/Everett
$42.66
14
1.6%
41
85.9%
14
39
South Boston
$31.78
24
2.2%
19
69.1%
43
40
South End
$44.71
11
2.3%
14
86.9%
12
41
South Suffolk County
$30.36
26
2.1%
26
62.2%
46
42
Strafford County
$24.24
43
1.6%
42
73.7%
33
© 2026 CoStar Group - Licensed to Gibson Commercial - 1361278
1/8/2026 Page 27
Submarkets Boston Office SUBMARKET RENT Market Asking Rent
12 Month Market Asking Rent
QTD Annualized Market Asking Rent
No.
Submarket
Per SF
Rank
Growth
Rank
Growth
Rank
43
W Cambridge/Alewife
$53.86
6
2.5%
8
90.7%
7
44
Waltham
$42.85
12
2.2%
18
88.4%
10
45
Watertown
$45.51
9
1.6%
40
90.1%
8
46
Wellesley/Needham
$40.54
15
2.3%
16
78.0%
29
47
Wilmington/Reading
$28.73
28
2.1%
25
88.5%
9
© 2026 CoStar Group - Licensed to Gibson Commercial - 1361278
1/8/2026 Page 28