Market Insights
20 23
EA ST ERN M A S S A C H U S ET T S
I N REV I EW
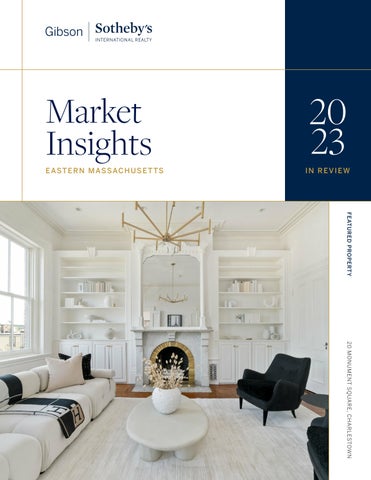
FEATURED PROPERTY 20 M ONUM ENT SQUARE, CHARLESTOWN
M A RK ET I N S I GH T S
TA B L E O F C O N T EN T S
04 State of the Market
08
12 Greater Boston 12
S I N GL E FA M I LY
14
CON D OM I N I U M
Boston 08
S I N GL E FA M I LY
10
CON D OM I N I U M
16 MetroWest 16
S I N GL E FA M I LY
20 North Shore 20
S I N GL E FA M I LY
22 South Shore 22
S I N GL E FA M I LY
24 South Coast 24
S I N GL E FA M I LY
26 Cape Cod 26
S I N GL E FA M I LY
28
CON D OM I N I U M
State of the Market As we look ahead to 2024, the word ?inventory?
As for the rental market, it remains quite
continues to dominate the real estate market.
competitive as consumers wait for mortgage rates
and
inflation
to
come
down. Amid
Over the last five years, we?ve seen a 37%
record-low inventory in the Boston metropolitan
reduction in inventory, a 33% reduction in sold
area, renters are finding themselves in bidding
listings, and a 48% increase in price in MLSpin.
wars and offering to pay over asking price.
Inventory remained tight throughout 2023, while rising interest rates forced some potential home
Perhaps our most important prediction for 2024
buyers and sellers to stay put even when they're
is that election years tend to be frontloaded, with
in desperate need of a change. Even so, recently
many buyers and sellers growing more uncertain
renovated single-family homes remained in high
about their real estate decisions as the election
demand and outpaced all sectors at a staggering
draws nearer. We anticipate greater consumer
rate. The luxury real estate market also remained
confidence and activity in the spring and, if
steady as high-end home seekers had the means
interest rates drop as expected, a 10-15%
to buy multi-million dollar homes in cash. And as
increase in sales by the end of this year. If you
trillions in assets flow to heirs over the next two
plan to list your home in 2024, we recommend
decades, their investing preferences could create
you do so in the first few months while buyers are
new opportunities.
eager to purchase.
For now, there continues to be some economic uncertainty in 2024, but many market watchers predict an overall positive year for the real estate market marked by strong demand, as people move both because they?re experiencing major
life
events? such as new jobs and growing families? or simply because they want to upgrade their homes and lifestyles. In spite of market fluctuations, Gibson Sotheby?s
Colleen Barry Chief Execut ive Officer Gibson Sotheby's International Realty
International Realty continues to diversify and expand. We look forward to continuing on this path in 2024, educating our clients on buyer-agent relationships, and leading the industry with stability and expertise. In the pages ahead, we?ll explore what you need to know in order to make a smart real estate decision at any moment. We know that buyers, sellers and renters
want
to
spend
wisely,
and
staying
well-informed is just the way to do it. It would be our privilege to help you on your journey.
Nicole Rideout Hart wick Chief St rat egy Officer Gibson Sotheby's International Realty
L U X U RY B EG I N S W I T H S ERV I C E
White Glove Gibson Sotheby?s International Realty?s White Glove program is designed to provide luxurious and comprehensive home preparation services with professional project management and no upfront costs. White Glove offers our clients value at every stage of the home selling or buying process with an exclusive suite of seamless services powered by Zoom Casa. Curious to learn more? Contact us today.
20 23 M ARKET INSIGHTS
Boston
SINGLE FAMILY SNAPSHOT | 20 23
747
?
-20 % YOY
LISTINGS TAKEN
21 MEDIAN DAYS ON MARKET
$900,000
?
+3% YOY
MEDIAN SALE PRICE
?
+5% YOY
546
?
-25% YOY
SOLD LISTINGS
Featured Listing: 8 Byron Street, Beacon Hill | Source: MLSPin 01/ 01/ 2023 ? 12/ 31/ 2023. Data pulled on 01/ 23/ 2024. For the purpose of this report Boston includes: Allston, Back Bay, Bay Village, Beacon Hill, Brighton, Charlestown, Chinatown-Leather District, Dorchester, East Boston, Fenway-Kenmore, Jamaica Plain, Midtown, Mission Hill, North End, Roslindale, Roxbury, Seaport, South Boston, South End, Waterfront, West End, West Roxbury
8
REGION | BOSTON
Single Family LISTINGS TAKEN
MEDIAN SALE PRICE
MEDIAN DOM
SOLD LISTINGS
Town
20 23
YOY% Change
20 23
YOY% Change
20 23
YOY% Change
20 23
YOY% Change
Allst on
8
-20%
$899,000
660,0 0 0
21
-40%
7
0%
Back Bay
10
11%
$5,000,000
4%
33
-72%
1
-50%
Bay Village
2
-50%
$3,200,000
106%
10
-68%
2
100%
Beacon Hill
37
48%
$3,962,500
11%
19
-71%
16
-43%
Bright on
27
-13%
$909,000
9%
15
-21%
22
-8%
Charlest own
64
-18%
$1,570,000
12%
20
43%
49
17%
Chinat own/ Leat her
0
0%
$-
0%
0
0%
0
0%
Dorchest er
93
-40%
$769,250
-3
27
17%
72
-35%
East Bost on
27
-27%
$730,000
4%
18
47%
18
33%
Fenway/ Kemore
2
-33%
$1,867,500
-39%
111
185%
2
0%
Jamaica Plain
63
-23%
$1,092,500
-11%
18
0%
52
-21%
Midt own
0
0%
$-
0%
0
0%
0
0%
Mission Hill
4
0%
$1,162,500
25%
41
14%
4
300%
Nort h End
2
100%
$1,145,000
0%
19
0%
1
0%
Roslindale
89
-30%
$775,000
2%
17
-6%
71
-31%
Roxbury
14
-13%
$683,750
12%
34
31%
8
-11%
Seaport
0
0%
$-
0%
0
0%
0
0%
Sout h Bost on
60
-21%
$1,100,000
11%
38
81%
37
-20%
Sout h End
40
33%
$4,800,000
49%
44
-48%
13
-38%
Wat erfront
0
0%
$-
0%
0
0%
0
0%
West End
0
0%
$-
0%
0
0%
0
0%
West Roxbury
205
-18%
$818,500
2%
20
5%
170
-23%
Source: MLSPin 01/ 01/ 2023 ? 12/ 31/ 2023. Data pulled on 01/ 12/ 2024.
9
20 23 M ARKET INSIGHTS
Boston
CONDOMINIUM SNAPSHOT | 20 23
4,763
?
-20 % YOY
LISTINGS TAKEN
23 MEDIAN DAYS ON MARKET
$769,900
?
+4% YOY
MEDIAN SALE PRICE
?
+0 % YOY
3,226
?
-19% YOY
SOLD LISTINGS
Featured Listing: 201 W Brookline U: 202, South End | Source: MLSPin 01/ 01/ 2023 ? 12/ 31/ 2023. Data pulled on 01/ 23/ 2024. For the purpose of this report Boston includes: Allston, Back Bay, Bay Village, Beacon Hill, Brighton, Charlestown, Chinatown-Leather District, Dorchester, East Boston, Fenway-Kenmore, Jamaica Plain, Midtown, Mission Hill, North End, Roslindale, Roxbury, Seaport, South Boston, South End, Waterfront, West End, West Roxbury
10
REGION | BOSTON
Condominiums LISTINGS TAKEN
MEDIAN SALE PRICE
MEDIAN DOM
SOLD LISTINGS
Town
20 23
YOY% Change
20 23
YOY% Change
20 23
YOY% Change
20 23
YOY% Change
Allst on
80
-36%
$654,321
25%
23
5%
75
12%
Back Bay
504
-1%
$1,487,500
13%
28
-10%
332
3%
Bay Village
10
-17%
$1,725,000
-40%
82
447%
4
-71%
Beacon Hill
157
-29%
$983,000
-2%
25
-14%
108
-26%
Bright on
290
-28%
$713,537
37%
21
-5%
293
58%
Charlest own
228
-27%
$840,000
2%
19
-5%
169
-33%
Chinat own-Leat her
28
-18%
$879,000
-12%
29
-34%
17
21%
Dorchest er
451
-9%
$599,500
6%
21
-13%
284
-23%
East Bost on
344
-41%
$636,250
2%
34
36%
232
-36%
Fenway-Kenmore
104
-9%
$667,500
13%
21
-9%
74
-15%
Jamaica Plain
372
-20%
$675,000
-3%
21
11%
292
-22%
Midt own
243
36%
$1,800,000
32%
22
-61%
103
30%
Mission Hill
17
-41%
$710,000
1%
20
5%
6
-65%
Nort h End
102
3%
$680,000
-3%
29
-22%
49
-31%
Roslindale
143
-32%
$583,750
-4%
21
11%
132
-20%
Roxbury
44
-56%
$518,000
-3%
70
94%
27
-64%
Seaport
200
2%
$1,435,000
13%
42
14%
65
-44%
Sout h Bost on
535
-13%
$820,000
1%
26
8%
332
-29%
Sout h End
549
-35%
$1,212,500
15%
23
10%
378
-27%
Wat erfront
168
-6%
$1,220,000
-2%
45
13%
93
-26%
West End
41
-23%
$485,000
-10%
88
126%
29
-3%
West Roxbury
121
-9%
$566,500
11%
21
5%
104
-14%
Source: MLSPin 01/ 01/ 2023 ? 12/ 31/ 2023. Data pulled on 01/ 12/ 2024.
11
20 23 M ARKET INSIGHTS
Greater Boston
SINGLE FAMILY SNAPSHOT | 20 23
3,417
?
-19% YOY
LISTINGS TAKEN
19 MEDIAN DAYS ON MARKET
$941,000
?
+4% YOY
MEDIAN SALE PRICE
?
+12% YOY
2,704
?
-21% YOY
SOLD LISTINGS
Featured Listing: 76 Claremont Ave, Arlington | Source: MLSPin 01/ 01/ 2023 ? 12/ 31/ 2023. Data pulled on 01/ 23/ 2024. For the purpose of this report Greater Boston includes: Arlington, Belmont, Brookline, Burlington, Cambridge, Chelsea, Dedham, Everett, Medford, Milton, Newton, Revere, Somerville, Waltham, Watertown, Winchester, Winthrop, Woburn
12
REGION | GREATER BOSTON
Single Family LISTINGS TAKEN
MEDIAN SALE PRICE
MEDIAN DOM
SOLD LISTINGS
Town
20 23
YOY% Change
20 23
YOY% Change
20 23
YOY% Change
20 23
YOY% Change
Arlingt on
241
-28%
$1,150,000.00
0%
13
30%
205
-29%
Belmont
134
-15%
$1,500,000.00
-4%
18
29%
123
-8%
Brookline
191
16%
$2,425,000.00
1%
17
-6%
113%
-5%
Burlingt on
196
-1%
$800,000.00
9%
21
5%
162
-6%
Cambridge
174
-13%
$2,000,000.00
7%
10
33%
86
-23%
Chelsea
18
-63%
$545,000.00
-6%
24
20%
17
-58%
Dedham
221
-25%
$689,500.00
2%
18
0%
194
-26%
Everet t
85
-19%
$615,000.00
3%
15
-25%
71
-13%
Medford
240
-27%
$799,500.00
-2%
17
0%
228
-22%
Milt on
183
-33%
$925,000.00
3%
19
-5%
150
-38%
Newt on
654
-7%
$1,750,000.00
8%
19
12%
432
-19%
Revere
168
-18%
$600,000.00
2%
20
5%
142
-13%
Somerville
101
-17%
$1,000,000.00
-9%
28
40%
69
-12%
Walt ham
272
-20%
$800,000.00
8%
20
5%
250
-15%
Wat ert own
72
-27%
$919,950.00
8%
16
7%
58
-23%
Winchest er
197
-26%
$1,467,500.00
0%
22
29%
148
-30%
Wint hrop
61
-41%
$683,500.00
1%
25
14%
49
-41%
Woburn
210
-30%
$702,000.00
6%
19
12%
203
-21%
Source: MLSPin 01/ 01/ 2023 ? 12/ 31/ 2023. Data pulled on 01/ 12/ 2024.
13
20 23 M ARKET INSIGHTS
Greater Boston
CONDOMINIUM SNAPSHOT | 20 23
4,072
?
-13% YOY
LISTINGS TAKEN
20 MEDIAN DAYS ON MARKET
$780,000
?
+8% YOY
MEDIAN SALE PRICE
?
+0 % YOY
3,003
?
-18% YOY
SOLD LISTINGS
Featured Listing: 136 Hancock Street U: 136, Cambridge | Source: MLSPin 01/ 01/ 2023 ? 12/ 31/ 2023. Data pulled on 01/ 23/ 2024. For the purpose of this report Greater Boston includes: Arlington, Belmont, Brookline, Burlington, Cambridge, Chelsea, Dedham, Everett, Medford, Milton, Newton, Revere, Somerville, Waltham, Watertown, Winchester, Winthrop, Woburn
14
REGION | GREATER BOSTON
Condominiums LISTINGS TAKEN
MEDIAN SALE PRICE
MEDIAN DOM
SOLD LISTINGS
Town
20 23
YOY% Change
20 23
YOY% Change
20 23
YOY% Change
20 23
YOY% Change
Arlingt on
226
-23%
$830,000.00
13%
14
13%
207
-10%
Belmont
73
-25%
$781,000.00
7%
20
7%
51
-38%
Brookline
521
-15%
$900,000.00
-1%
21
0%
389
-14%
Burlingt on
36
9%
$755,000.00
0%
17
-15%
31
11%
Cambridge
735
-8%
$920,000.00
1%
20
5%
514
-13%
Chelsea
189
12%
$435,000.00
4%
21
-28%
79
-46%
Dedham
38
-22%
$487,500.00
7%
20
-20%
35
-20%
Everet t
58
-15%
$442,500.00
4%
23
-12%
46
-37%
Medford
304
-18%
$659,900.00
5%
17
6%
250
-21%
Milt on
66
29%
$765,000.00
-10%
46
31%
48
37%
Newt on
411
-12%
$985,000.00
9%
21
5%
289
-10%
Revere
117
-30%
$479,900.00
4%
22
10%
80
-47%
Somerville
553
-17%
$873,750.00
8%
28
40%
393
-16%
Walt ham
179
-25%
$630,000.00
15%
17
-11%
153
-27%
Wat ert own
200
-21%
$700,000.00
3%
19
-5%
176
-20%
Winchest er
72
-12%
$795,000.00
4%
21
-9%
52
-32%
Wint hrop
102
-26%
$517,500.00
16%
22
-4%
86
-20%
Woburn
192
32%
$651,250.00
35%
15
-21%
120
3%
Source: MLSPin 01/ 01/ 2023 ? 12/ 31/ 2023. Data pulled on 01/ 12/ 2024.
15
20 23 M ARKET INSIGHTS
MetroWest
SINGLE FAMILY SNAPSHOT | 20 23
2,603
?
-21% YOY
LISTINGS TAKEN
18 MEDIAN DAYS ON MARKET
$967,405
?
+6% YOY
MEDIAN SALE PRICE
?
+13% YOY
2,157
?
-23% YOY
SOLD LISTINGS
Featured Listing: 78 Arnold Rd, Wellesley | Source: MLSPin 01/ 01/ 2023 ? 12/ 31/ 2023. Data pulled on 01/ 12/ 2024. For the purpose of this report MetroWest includes: Ashland, Dover, Framingham, Holliston, Hopkinton, Medfield, Medway, Millis, Natick, Needham, Sherborn, Sudbury, Wellesley, Weston
16
REGION | M ETROWEST
Single Family LISTINGS TAKEN
MEDIAN SALE PRICE
MEDIAN DOM
SOLD LISTINGS
Town
20 23
YOY% Change
20 23
YOY% Change
20 23
YOY% Change
20 23
YOY% Change
Ashland
114
-29%
$696,500.00
8%
14
-13%
104
-54%
Dover
82
-5%
$1,672,500.00
-2%
21
0%
62
-19%
Framingham
389
-32%
$645,000.00
5%
13
-7%
346
-32%
Hollist on
144
-36%
$683,500.00
5%
18
13%
138
-34%
Hopkint on
212
-4%
$950,000.00
5%
19
19%
171
-9%
Medfield
133
-15%
$904,000.00
-7%
16
-6%
109
-22%
Medway
133
-16%
$690,000.00
11%
20
5%
115
-8%
Millis
89
-3%
$679,900.00
13%
20
5%
67
-21%
Nat ick
299
-16%
$900,000.00
0%
19
19%
233
-21%
Needham
299
-13%
$1,495,000.00
0%
18
29%
247
-8%
Sherborn
68
-15%
$1,250,000.00
12%
12
-8%
50
-22%
Sudbury
186
-36%
$1,125,000.00
-2%
20
5%
161
-33%
Wellesley
290
-16%
$1,915,000.00
2%
12
9%
226
-26%
West on
165
-19%
$2,222,500.00
-9%
25
47%
128
-1%
Source: MLSPin 01/ 01/ 2023 ? 12/ 31/ 2023. Data pulled on 01/ 12/ 2024.
17
FI N D A H O M E YO U L OV E W I T H
Real Scout RealScout is the industry's # 1 collaborative home search app. Our clients rave about this innovative, mobile-friendly search tool! Want to try the future of the home buying search process? Contact our team to get started today.
20 23 M ARKET INSIGHTS
North Shore
SINGLE FAMILY SNAPSHOT | 20 23
3,727
?
-20 % YOY
LISTINGS TAKEN
20 MEDIAN DAYS ON MARKET
$685,000
?
+7% YOY
MEDIAN SALE PRICE
?
+0 % YOY
3,103
?
-23% YOY
SOLD LISTINGS
Featured Listing: 146 Bridge St, Manchester | Source: MLSPin 01/ 01/ 2023 ? 12/ 31/ 2023. Left page: Data pulled on 01/ 23/ 2024. Right page: Date pulled on 01/ 12/ 2024. For the purpose of this report North Shore includes: Amesbury, Beverly, Boxford, Danvers, Essex, Georgetown, Gloucester, Groveland, Hamilton, Haverhill, Ipswich, Lynn, Lynnfield, Manchester, Marblehead, Merrimac, Middleton, Nahant, Newbury, Newburyport, Peabody, Rockport, Rowley, Salem, Salisbury, Saugus, Swampscott, Topsfield, Wenham, West Newbury
20
REGION | NORTH SHORE
Single Family LISTINGS TAKEN
MEDIAN SALE PRICE
MEDIAN DOM
SOLD LISTINGS
Town
20 23
YOY% Change
20 23
YOY% Change
20 23
YOY% Change
20 23
YOY% Change
Amesbury
124
-21%
$685,000.00
18%
19
-5%
107
-20%
Beverly
223
-23%
$720,000.00
14%
18
-5%
206
-23%
Boxford
99
-24%
$927,000.00
1%
21
5%
94
-15%
Danvers
168
-29%
$670,000.00
6%
18
-5%
157
-23%
Essex
27
13%
$925,000.00
24%
31
107%
23
28%
Georget own
66
-31%
$750,000.00
13%
17
-11%
61
-31%
Gloucest er
157
-14%
$689,500.00
5%
21
5%
124
-23%
Groveland
59
-17%
$635,000.00
10%
21
5%
45
-36%
Hamilt on
84
-22%
$773,250.00
5%
22
22%
64
-24%
Haverhil
316
-24%
$527,500.00
6%
18
-5%
282
-25%
Ipswich
118
-13%
$874,950.00
18%
20
0%
92
-23%
Lynn
379
-26%
$550,000.00
8%
20
0%
341
-25%
Lynnfield
120
-7%
$1,100,000.00
15%
19
0%
94
-19%
Manchest er
53
-13%
$1,595,000.00
18%
35
67%
37
-31%
Marblehead
187
-17%
$964,875.00
3%
21
0%
162
-16%
Merrimac
59
-2%
$568,750.00
-17%
22
10%
40
-23%
Middlet on
73
-5%
$948,000.00
10%
25
19%
50
0%
Nahant
44
-8%
$930,075.50
-2%
33
38%
28
12%
Newbury
81
-8%
$840,000.00
-8%
19
0%
56
-11%
Newburyport
198
2%
$950,000.00
0%
18
-10%
125
-20%
Peabody
248
-26%
$625,000.00
4%
19
0%
234
-24%
Rockport
73
-8%
$849,500.00
8%
32
52%
46
-23%
Rowley
59
-20%
$850,000.00
0%
21
-9%
47
-33%
Salem
144
-35%
$600,000.00
-2%
18
-5%
133
-35%
Salisbury
70
-18%
$588,500.00
13%
16
-20%
47
-31%
Saugus
240
-16%
$610,000.00
-2%
19
6%
208
-15%
Swampscot t
89
-40%
$855,000.00
8%
22
5%
76
-35%
Topsfield
62
-9%
$872,500.00
8%
22
0%
48
-25%
Wenham
43
-12%
$960,000.00
7%
18
-18%
33
-33%
West Newbury
65
14%
$785,000.00
2%
22
5%
41
5% 21
20 23 M ARKET INSIGHTS
South Shore
SINGLE FAMILY SNAPSHOT | 20 23
3,749
?
-20 % YOY
LISTINGS TAKEN
20 MEDIAN DAYS ON MARKET
$660,000
?
+4% YOY
MEDIAN SALE PRICE
?
+5% YOY
3,213
?
-19% YOY
SOLD LISTINGS
Featured Listing: 21 River Lane, Duxbury | Source: MLSPin 01/ 01/ 2023 ? 12/ 31/ 2023. Data pulled on 01/ 12/ 2024. For the purpose of this report South Shore includes: Abington, Braintree, Carver, Cohasset, Duxbury, Halifax, Hanover, Hanson, Hingham, Hull, Kingston, Marshfield, Norwell, Pembroke, Plymouth, Plympton, Rockland, Scituate, Weymouth, Whitman
22
REGION | SOUTH SHORE
Single Family LISTINGS TAKEN
MEDIAN SALE PRICE
MEDIAN DOM
SOLD LISTINGS
Town
20 23
YOY% Change
20 23
YOY% Change
20 23
YOY% Change
20 23
YOY% Change
Abingt on
126
-22%
$535,000.00
-1%
20
19%
108
-27%
Braint ree
223
-21%
$680,000.00
1%
19
0%
191
-25%
Carver
88
-17%
$575,000.00
13%
25
25%
69
-35%
Cohasset
91
-30%
$1,474,000.00
7%
22
5%
67
-26%
Duxbury
166
-6%
$1,025,000.00
7%
20
18%
131
-14%
Halifax
60
-40%
$510,000.00
2%
21
5%
55
-35%
Hanover
131
-23%
$775,000.00
9%
20
0%
112
-17%
Hanson
91
0%
$525,000.00
3%
21
0%
74
-9%
Hingham
248
-21%
$1,199,000.00
-4%
20
18%
187
-21%
Hull
115
-16%
$670,000.00
13%
20
13%
81
-24%
Kingst on
121
-25%
$652,450.00
5%
19
-21%
118
-9%
Marshfield
241
-13%
$742,500.00
12%
19
0%
205
-10%
Norwell
120
-35%
$905,000.00
4%
18
0%
109
-34%
Peabody
248
-26%
$625,000.00
4%
19
0%
234
-24%
Pembroke
140
-24%
$577,500.00
2%
20
0%
130
-25%
Plymout h
677
-10%
$610,000.00
6%
22
5%
568
-6%
Plympt on
18
-53%
$620,000.00
6%
26
37%
15
-48%
Rockland
112
-22%
$492,500.00
-1%
19
6%
104
-10%
Scit uat e
233
-17%
$865,000.00
-5%
20
5%
183
-19%
Weymout h
402
-23%
$605,000.00
5%
19
12%
377
-20%
Whit man
98
-32%
$488,000.00
2%
19
0%
95
-22%
Source: MLSPin 01/ 01/ 2023 ? 12/ 31/ 2023. Data pulled on 01/ 12/ 2024.
23
20 23 M ARKET INSIGHTS
South Coast
SINGLE FAMILY SNAPSHOT | 20 23
958
?
-20 % YOY
LISTINGS TAKEN
23 MEDIAN DAYS ON MARKET
$492,000
?
+1% YOY
MEDIAN SALE PRICE
?
+5% YOY
795
?
-18% YOY
SOLD LISTINGS
Featured Listing: 18 Middle St, Dartmouth | Source: MLSPin 01/ 01/ 2023 ? 12/ 31/ 2023. Data pulled on 01/ 29/ 2024. For the purpose of this report South Coast includes: Dartmouth, Fairhaven, Mattapoisett, Marion, Wareham, Westport
REGION | SOUTH COAST
Single Family LISTINGS TAKEN
MEDIAN SALE PRICE
MEDIAN DOM
SOLD LISTINGS
Town
20 23
YOY% Change
20 23
YOY% Change
20 23
YOY% Change
20 23
YOY% Change
Dart mout h
215
-30%
$520,000.00
-1%
23
5%
189
-23%
Fairhaven
132
-25%
$450,000.00
2%
22
-12%
122
-14%
Marion
64
-17%
$765,000.00
21%
20
-26%
53
-17%
Mat t apoiset t
81
-20%
$699,950.00
0%
27
-4%
68
-14%
Wareham
298
-22%
$419,700.00
0%
23
10%
240
-26%
West port
169
14%
$634,750.00
5%
31
3%
122
2%
Source: MLSPin 01/ 01/ 2023 ? 12/ 31/ 2023. Data pulled on 01/ 12/ 2024.
20 23 M ARKET INSIGHTS
Cape Cod
SINGLE FAMILY SNAPSHOT | 20 23
3,140
?
-17% YOY
LISTINGS TAKEN
34 AVERAGE DAYS ON MARKET
$730,000
?
+6% YOY
MEDIAN SALE PRICE
?
+25% YOY
2,646
?
-18% YOY
SOLD LISTINGS
Featured Listing: 30 Hayward Ln, Orleans | Source: CCIMLS 01/ 01/ 2023 ? 12/ 31/ 2023. For the purpose of this report Cape Cod includes: Barnstable, Bourne, Brewster, Chatham, Dennis, Eastham, Falmouth, Harwich, Mashpee, Orleans, Provincetown, Sandwich, Truro, Wellfleet, Yarmouth
26
REGION | CAPE COD
Single Family LISTINGS TAKEN
MEDIAN SALE PRICE
AVERAGE DOM
SOLD LISTINGS
20 23
YOY% Change
20 23
YOY% Change
20 23
YOY% Change
20 23
YOY% Change
Bourne
146
-28%
$660,000
12%
36
38%
135
-21%
Falmout h
403
-23%
$789,000
9%
29
26%
374
-13%
Mashpee
234
-19%
$780,000
4%
43
26%
197
-11%
Sandwich
278
-17%
$676,000
5%
26
-3%
241
-10%
Barnst able
579
-19%
$672,500
3%
35
9%
434
-34%
Dennis
262
-15%
$650,000
4%
32
10%
199
-29%
Yarmout h
356
-21%
$591,000
9%
21
16%
326
-22%
Brewst er
124
-20%
$780,077
0%
27
35%
113
-14%
Chat ham
156
-14%
$1,312,500
-2%
83
118%
126
-19%
Harwich
208
-7%
$760,500
8%
28
64%
185
-1%
Orleans
112
7%
$1,235,000
8%
47
0%
93
5%
East ham
111
-15%
$779,500
4%
34
88%
102
-4%
Provincet own
39
0%
$2,075,000
0%
73
21%
19
-38%
Truro
49
0%
$1,212,500
-8%
58
56%
36
9%
Wellfleet
83
15%
$965,000
2%
39
105%
66
4%
Town UPPER CAPE
MID CAPE
LOWER CAPE
OUTER CAPE
27
20 23 M ARKET INSIGHTS
Cape Cod
CONDOMINIUM SNAPSHOT | 20 23
844
?
-9% YOY
LISTINGS TAKEN
42 AVERAGE DAYS ON MARKET
$469,950
?
+4% YOY
MEDIAN SALE PRICE
?
+27% YOY
740
?
SOLD LISTINGS
Featured Listing: 350 Bradford St U: 12, Provincetown | Source: CCIMLS 01/ 01/ 2023 ? 12/ 31/ 2023. For the purpose of this report Cape Cod includes: Barnstable, Bourne, Brewster, Chatham, Dennis, Eastham, Falmouth, Harwich, Mashpee, Orleans, Provincetown, Sandwich, Truro, Wellfleet, Yarmouth
28
-16% YOY
REGION | CAPE COD
Condominium LISTINGS TAKEN
MEDIAN SALE PRICE
AVERAGE DOM
SOLD LISTINGS
20 23
YOY% Change
20 23
YOY% Change
20 23
YOY% Change
20 23
YOY% Change
Bourne
35
-30%
$420,125
-23%
34
-35%
32
-37%
Falmout h
72
-6%
$532,500
-6%
26
44%
60
-10%
Mashpee
136
-5%
$527,500
1%
41
70%
120
-10%
Sandwich
22
-26%
$392,000
0%
36
227%
21
-22%
Barnst able
72
-7%
$357,450
11%
32
23%
64
-12%
Dennis
76
-13%
$310,000
-9%
36
-33%
69
-21%
Yarmout h
92
-15%
$362,000
11%
21
0%
86
-21%
Brewst er
63
26%
$465,000
23%
19
18%
51
-3%
Chat ham
31
24%
$479,000
-11%
66
0%
27
35%
Harwich
31
-8%
$362,250
9%
30
-40%
28
-22%
Orleans
34
13%
$330,250
-17%
24
-55%
30
-3%
East ham
14
-33%
$510,500
-6%
324
561%
20
5%
Provincet own
126
-16%
$884,500
14%
40
11%
100
-25%
Truro
25
-10%
$450,000
-4%
58
132%
24
-4%
Wellfleet
14
-22%
$584,750
46%
37
8%
8
-46%
Town UPPER CAPE
MID CAPE
LOWER CAPE
OUTER CAPE
29
D I S C OV ER T H E EA S E O F
Deposit Link DepositLink is a simple, secure and efficient way for real estate companies and escrow holders to collect earnest money deposits and commissions electronically through the ACH network.
DepositLink is a Game Changer -
With Same Day ACH, payments clear in less than 24 hours.
-
Safely request deposits from anywhere
-
Securely connect to more than 16,000 banks and credit unions nationwide
-
Unique workflows and reporting for sales and rentals
-
Divide payments among multiple buyers or tenants
-
Track the status of transfers in real-time with your phone
-
Issue refunds and co-broke payments electronically in seconds
Security is Our # 1 Priority -
We NEVER save or store any banking info
-
Clients?contact information is NEVER shared
-
Bank-level 256-bit key data encryption
-
Two-factor authentication login
-
2-step identity and account verification
GI B S O N S OT H EB YS REA LT Y.C O M
FEATURED PROPERTY
29 PINE SUM M IT CIRCLE, WESTON
Nothing compares to what's next.
© 2024 Sotheby?s International Realty. All Rights Reserved. Sotheby?s International Realty® is a registered trademark and used with permission. Each Sotheby?s International Realty office is independently owned and operated, except those operated by Sotheby?s International Realty, Inc. This material is based upon information which we consider reliable but because it has been supplied by third parties, we cannot represent that it is accurate or complete and it should not be relied upon as such. All offerings are subject to errors, omissions, changes including price or withdrawal without notice. If your property is listed with a real estate broker, please disregard. It is not our intention to solicit the offerings of other real estate brokers. We are happy to work with them and cooperate fully. Equal Housing Opportunity.