13 minute read
PART 4 Assessing Portfolio-wide Deforestation Risk and Prioritizing Engagements


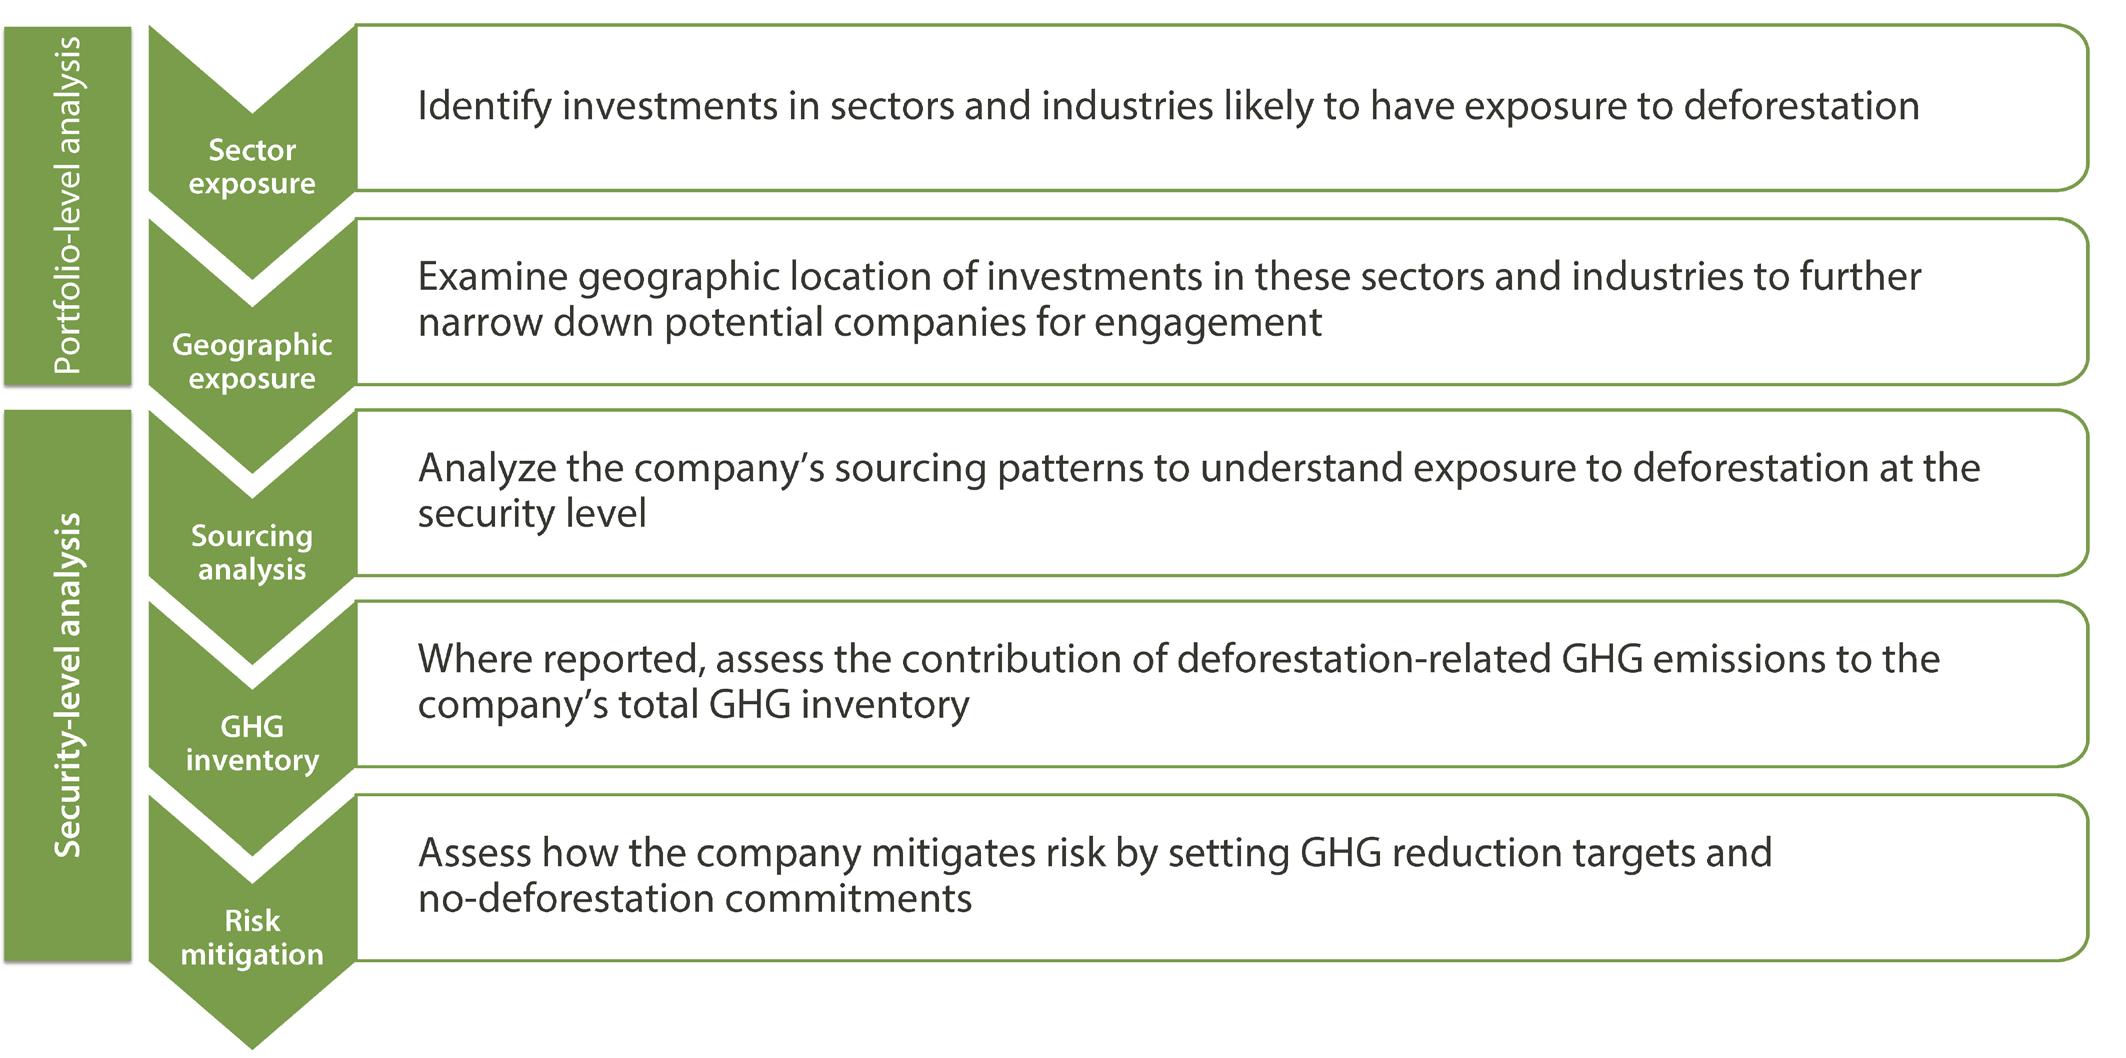
Translating deforestation-driven climate risk at the security/company level requires understanding a company’s exposure to deforestation. To assess these risks and prioritize company engagements, investors should analyze their exposure based on the sectors and industries represented in their portfolios, as well as the geographic location of the securities in those sectors and industries. Once potential companies have been identified, investors should consider their commodity sourcing patterns to highlight specific risks and actions companies are taking to mitigate those risks (Figure 5).
Advertisement
Figure 5 Framework for assessing deforestation-driven climate risk
Portfolio-level analysis
Sector exposure to commodity-driven deforestation Companies in many sectors and industries are exposed to deforestation through their sourcing of commodities that are drivers of deforestation (Table 2). Consumer staples are exposed to nearly every commodity associated with deforestation. Within this sector, the food products and food & staples retailing industries are likely to have high exposure due to the prevalence of all forest risk commodities across their supply chains. However, deforestation exposure is not unique to these food industries. Palm oil is also used widely in soaps, detergents and makeup, creating exposure in household products and personal products industries.
The consumer discretionary sector has several industries that are exposed to deforestation due to their reliance on leather, rubber, timber and paper. Textiles, apparel and luxury goods are exposed to deforestation from cattle due to leather sourcing as well as wood pulp used to make fabrics. Hotels, restaurants & leisure companies are exposed through food sourcing for restaurants.
In the materials sector, containers and packaging and paper and forest products are exposed to deforestation associated with forest plantations, as well as additional emissions from forest degradation due to logging. Finally, the financial sector is exposed to deforestation risk through financing of the industries described above.
The number of different commodities sourced by an industry is indicative of the breadth of potential exposure of individual companies within the industry, but it is not numerically proportional to the exposure of companies within that industry. Deforestation risk depends on the particular commodities and the volume of those commodities being sourced since some commodities are bigger drivers of deforestation than others. Deforestation risk further depends on the geographies from which companies are sourcing their commodities and the company’s approach to managing deforestation in their supply chains. Assessing these components of deforestation risk generally requires company engagement. Guidance on this is described under company/security-level analysis.

Sector
Consumer staples Industry
Food Products
Household Products; Personal Products
Commodities associated with deforestation
Beef, cocoa and coffee are relatively easy to spot in grocery products, but palm oil and soybeans may be hidden in processed products. Palm oil and its derivatives are widely used in food processing and show up in products such as bread, pastries, cereal, peanut butter, chocolate and margarine. Soybeans are made into soybean oil for cooking and are consumed by pigs and poultry as soy meal, so emissions from soy-related deforestation are embedded in those products.
Palm oil and its derivatives are widely used in soaps, detergents and makeup. Cocoa butter is also used in personal care products.
Food & Staples Retailing Food distributors and retailers source all food commodities associated with deforestation, as well as paper products for packaging and shipping.
Consumer discretionary
Textiles, Apparel & Luxury Goods Footwear and luxury goods companies source leather and rubber. Textiles and apparel industries use woven fiber from wood pulp, often sourced from deforested areas, into rayon, viscose and modal fabrics.
Household Durables Home furnishings use leather and timber.
Hotels, Restaurants & Leisure Hotels, restaurants and resorts source paper and food commodities, as well as timber used in furniture.
Auto components Tire manufacturers source over 70 percent of the world’s rubber. Leather is also used in automobile interiors.
Internet & Direct Marketing Retail Internet and direct marketing retailers source products containing all commodities associated with deforestation, such as food products, footwear, apparel and furniture. They also use large amounts of paper packaging in their shipping operations.
Multiline retail; Specialty retail Retailers of shoes, apparel, office supplies, auto parts and home furnishings are exposed to deforestation through products using leather, rubber, timber and paper.
Materials
Containers & Packaging Forest plantations for wood pulp (paper and cardboard) production, are a major driver of deforestation.
Paper & Forest Products Forest plantations for wood pulp (paper and cardboard) and timber are a major driver of deforestation.
Energy
Oil, Gas & Consumable Fuels Soybean oil and palm oil are used for production of biodiesel.
Utilities
Independent Power and Renewable Electricity Producers Biomass power plants burn wood pellets. Claims that this process is carbon neutral have been disputed by scientists.44
Financials Banks Finance institutions are exposed to deforestation through their financing of companies in all of the above industries.
Identifying investments in key sectors that source commodities associated with deforestation is an important first step in assessing portfolio-level deforestation exposure. To further narrow securities for engagement, investors should examine the countries where they are invested in these industries.
Most GHG emissions from tropical commodity-driven deforestation occur in emerging economies such as Indonesia, Brazil and Malaysia. Investors may therefore have significant exposure through their investments in these emerging markets. However, due to global trade of forest-risk commodities, emissions are also embedded in the supply chains of companies in developed markets, as well as other emerging market economies where deforestation is less prevalent. All told, up to 39 percent of deforestation-related GHG emissions are driven by international trade. The top six economies—the United States, European Union, Japan, China, India and Pakistan—collectively “import” about 17 percent of global GHG emissions from tropical commodity-driven deforestation through their use of commodities produced on deforested land (Figure 6).45
The balance of exposure between emerging and developed economies varies by commodity. Beef from tropical countries with high deforestation is primarily consumed domestically. Exposure to beef-related deforestation in the food products, food retail and hotel industries is more likely to be concentrated in emerging economies. The same holds true for timber and pulp products from tropical countries. (Developed economies may be exposed to emissions related to forest degradation in northern latitudes, but that data is not represented or used in this report.) Deforestation-related emissions from other commodities such as soybeans and palm oil are primarily exported, and are more likely to be embedded in products sourced by companies in developed markets.
Deforestation driven by domestic consumption, as well as exports to other emerging markets, may still be a source of exposure for equities listed in developed markets. Companies based in the U.S. and EU have manufacturing operations all over the globe, and produce food, beverages and other products for consumption in emerging markets. For example, while most chocolate produced in Brazil is consumed domestically, the Brazilian chocolate market is dominated by multinational companies such as Nestlé and Mondelez, which are headquartered in Switzerland and the U.S., respectively. Data on the location of company headquarters and operations may be available in 10-K filings.
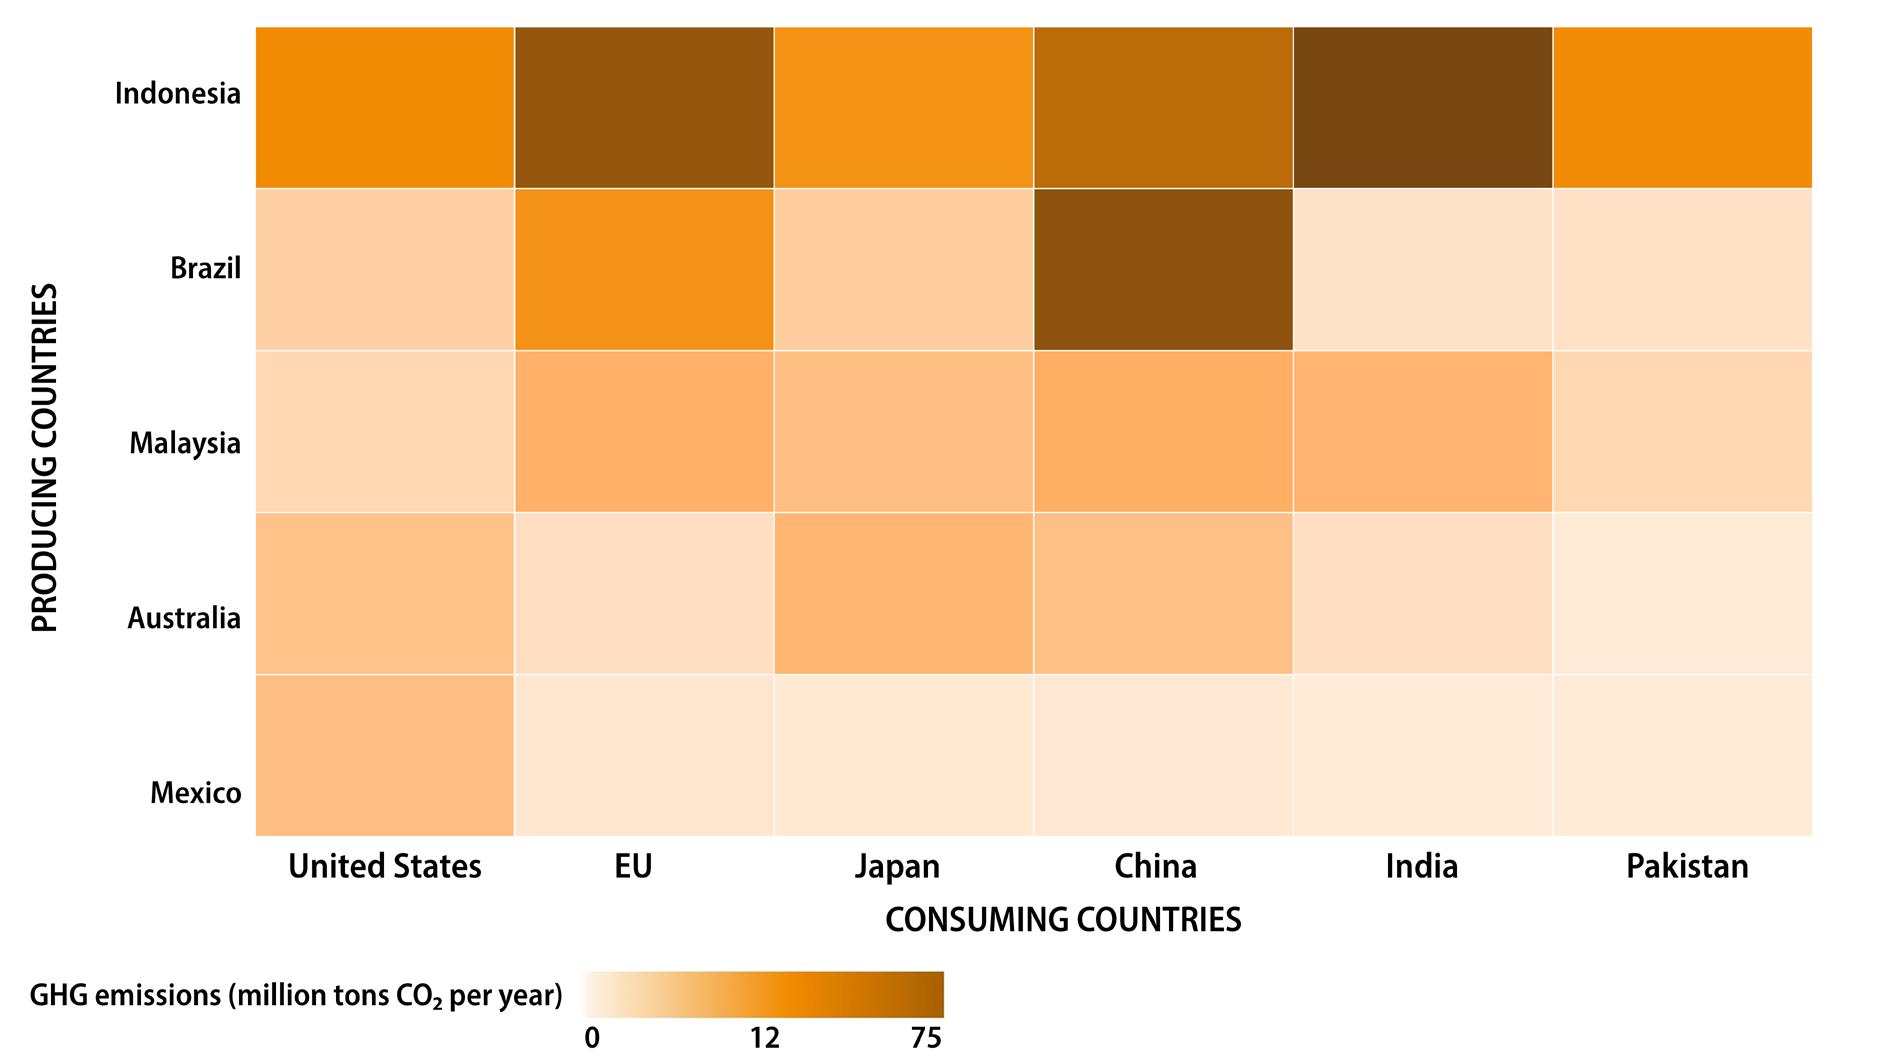
Figure 6 Heatmap showing flow of deforestation-related GHG emissions from producing to importing countries, covering 50 percent of emission flows embedded in trade. The importing country is not necessarily the country of final consumption, but rather where the agricultural or forest commodity is used for manufacturing. Data from Pendrill et al. (2019). 46 Data table available on the companion website.
Once priority companies have been identified for engagement, investors can scrutinize the exposure of each company in three ways: analyzing the company’s sourcing patterns; examining the company’s GHG inventory; and evaluating the company’s deforestation mitigation strategy.
Sourcing analysis In the previous section, we described how to assess portfolio-level exposure based on production and trade patterns of forest-risk commodities. At the security level, investors can further assess company-specific risks based on the countries—and even locations within those countries—from which companies source particular commodities.
Commodities that drive deforestation-related emissions differ widely between countries. Information on these commodity-country combinations can be used to conduct an initial screening for deforestation exposure at the security level by examining from where companies are sourcing their commodities and comparing it against the countries in which each commodity is a driver of deforestation (Figure 7). For example, companies sourcing beef and soybeans from Brazil or palm oil from Indonesia are likely to have deforestation exposure; these commodity-country combinations are collectively responsible for about 37 percent of GHG emissions from tropical commodity-driven deforestation.47 Companies sourcing soybeans from Brazil are far more likely to be exposed to deforestation than companies sourcing soybeans from the United States.
Many companies, especially in the food and beverage sector, include a list of key commodities they source in their 10-Ks and other financial filings. This data may also be available in sustainability reports and other public sustainability disclosures such as CDP reports, as well as in materials that Ceres provides to its investor network members.
While some companies disclose more detailed sourcing information—such as from what countries and in what volumes they source these commodities—this information is not widely available. Disclosures are often limited to direct (tier 1) suppliers that provide raw materials and inputs and fail to include indirect (tier 2) suppliers—from whom their suppliers purchase raw materials and inputs—that are also sources of exposure. Investors should consider seeking this tier 2 data to better understand a company’s sourcing patterns.
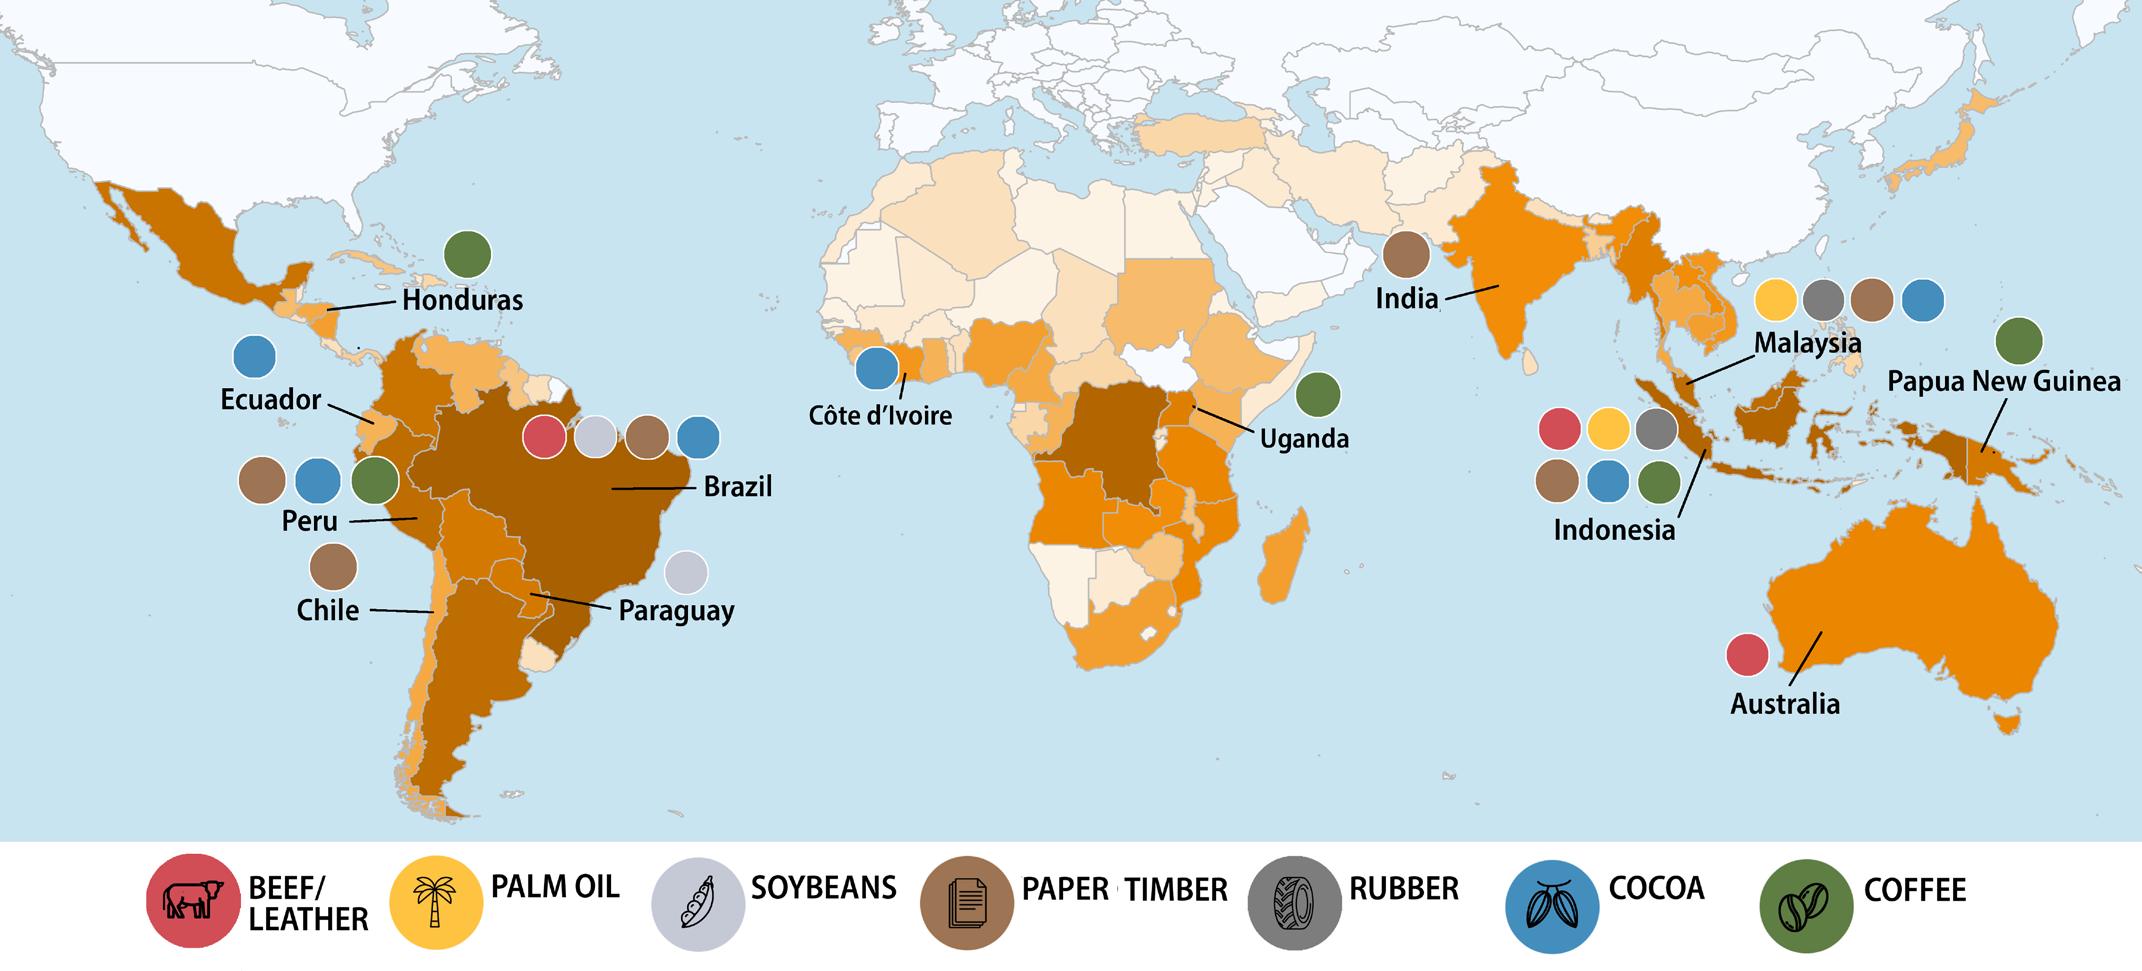
Figure 7 Geography of deforestation-related GHG emissions due to each of the major commodities that are drivers of deforestation. Countries are shaded according to the total deforestation-related GHG emissions occurring in that country. Commodity icons are shown for each country that contributes at least 5% of the total tropical deforestation-related emissions for that commodity. Data from Pendrill et al. (2019). 48 Data table available on the companion website to this guide.
ENGAGEMENT OPPORTUNITIES TO REDUCE DEFORESTATION ON THE GROUND Investors should urge companies that source commodities from high-risk countries to adopt and implement a robust no-deforestation commitment and engage constructively with suppliers before moving sourcing away from these regions. While moving sourcing away from high-risk areas reduces company exposure to deforestation risk, it doesn’t always reduce deforestation on the ground because producers involved in deforestation may simply find less scrupulous buyers—sometimes called “leakage markets”—for their products. Engagements with traders and banks are a potentially effective tool to address leakage markets.
Within supply chains, deforestation exposure is often concentrated with traders, meatpackers (beef) and refiners (palm oil). Most traded commodities are handled by a relatively small group of traders, many of whom are active in several commodities and in multiple countries. For example, of the 2,500 traders exporting forest-risk commodities from Latin America, just three-dozen account for over half of those exports.49 Because of their major role in supplying commodities to thousands of companies, engagements with traders are an especially effective way to reduce demand for commodities from deforestation-sensitive areas. More information on this activity can be found in Ceres’ Engage the Chain website.
A banking engagement strategy is another way for investors to address leakage markets. Key players in leakage markets, especially in the palm oil industry, tend to be debt-financed by banks.50 A 2019 study by Boston Common Asset Management found wide-ranging disparities in how 58 banks were managing climate risk associated with deforestation and biodiversity loss. Only 16 percent of the banks required clients to adopt no-deforestation policies and even fewer had expanded policies covering all soft commodities beyond palm oil. The data showed a systematic reluctance by banks to demand higher client standards.51
GHG inventory analysis
In line with recommendations of the Task Force on Climate-related Financial Disclosures, company disclosure of GHG emissions has become a core baseline expectation of global investors. In theory, a company’s GHG inventory should be a key source of information to understand its exposure to potential deforestation risk. A full GHG inventory, including emissions from deforestation, would allow a company and its investors to determine if deforestation-related emissions are a material risk. However, most company GHG inventories that are reported to CDP and other organizations are inadequate for this purpose. Corporate accounting and disclosure of GHG emissions from deforestation is currently extremely poor. As a result, analysis of a company’s sourcing patterns, as described in the previous section, is currently a more accurate way to gauge exposure. Nonetheless, it will be useful for investors to understand where to look for GHG emissions from deforestation and conversion in a company’s GHG inventory, and how reporting expectations on these emissions are changing.
Most companies use the framework of “scopes,” developed by the GHG Protocol,52 to track and report GHG emissions (Figure 8). Scope 1 emissions are from sources owned or controlled by the company. Scope 2 are emissions released in generating electricity, heating or cooling used by a company. Scope 3 are other indirect emissions from a company’s supply chain, including emissions from agricultural and forest products. For most companies—packers and processors, traders and distributors, food manufacturers and retailers—GHG emissions from agricultural production, deforestation and conversion fall under scope 3. These emissions would fall under scope 1 for companies owning or controlling agricultural and forestry operations. This is especially relevant for the palm oil industry, which tends to be vertically integrated; traders and distributors of palm oil generally own plantations as well as sourcing product from independent producers.
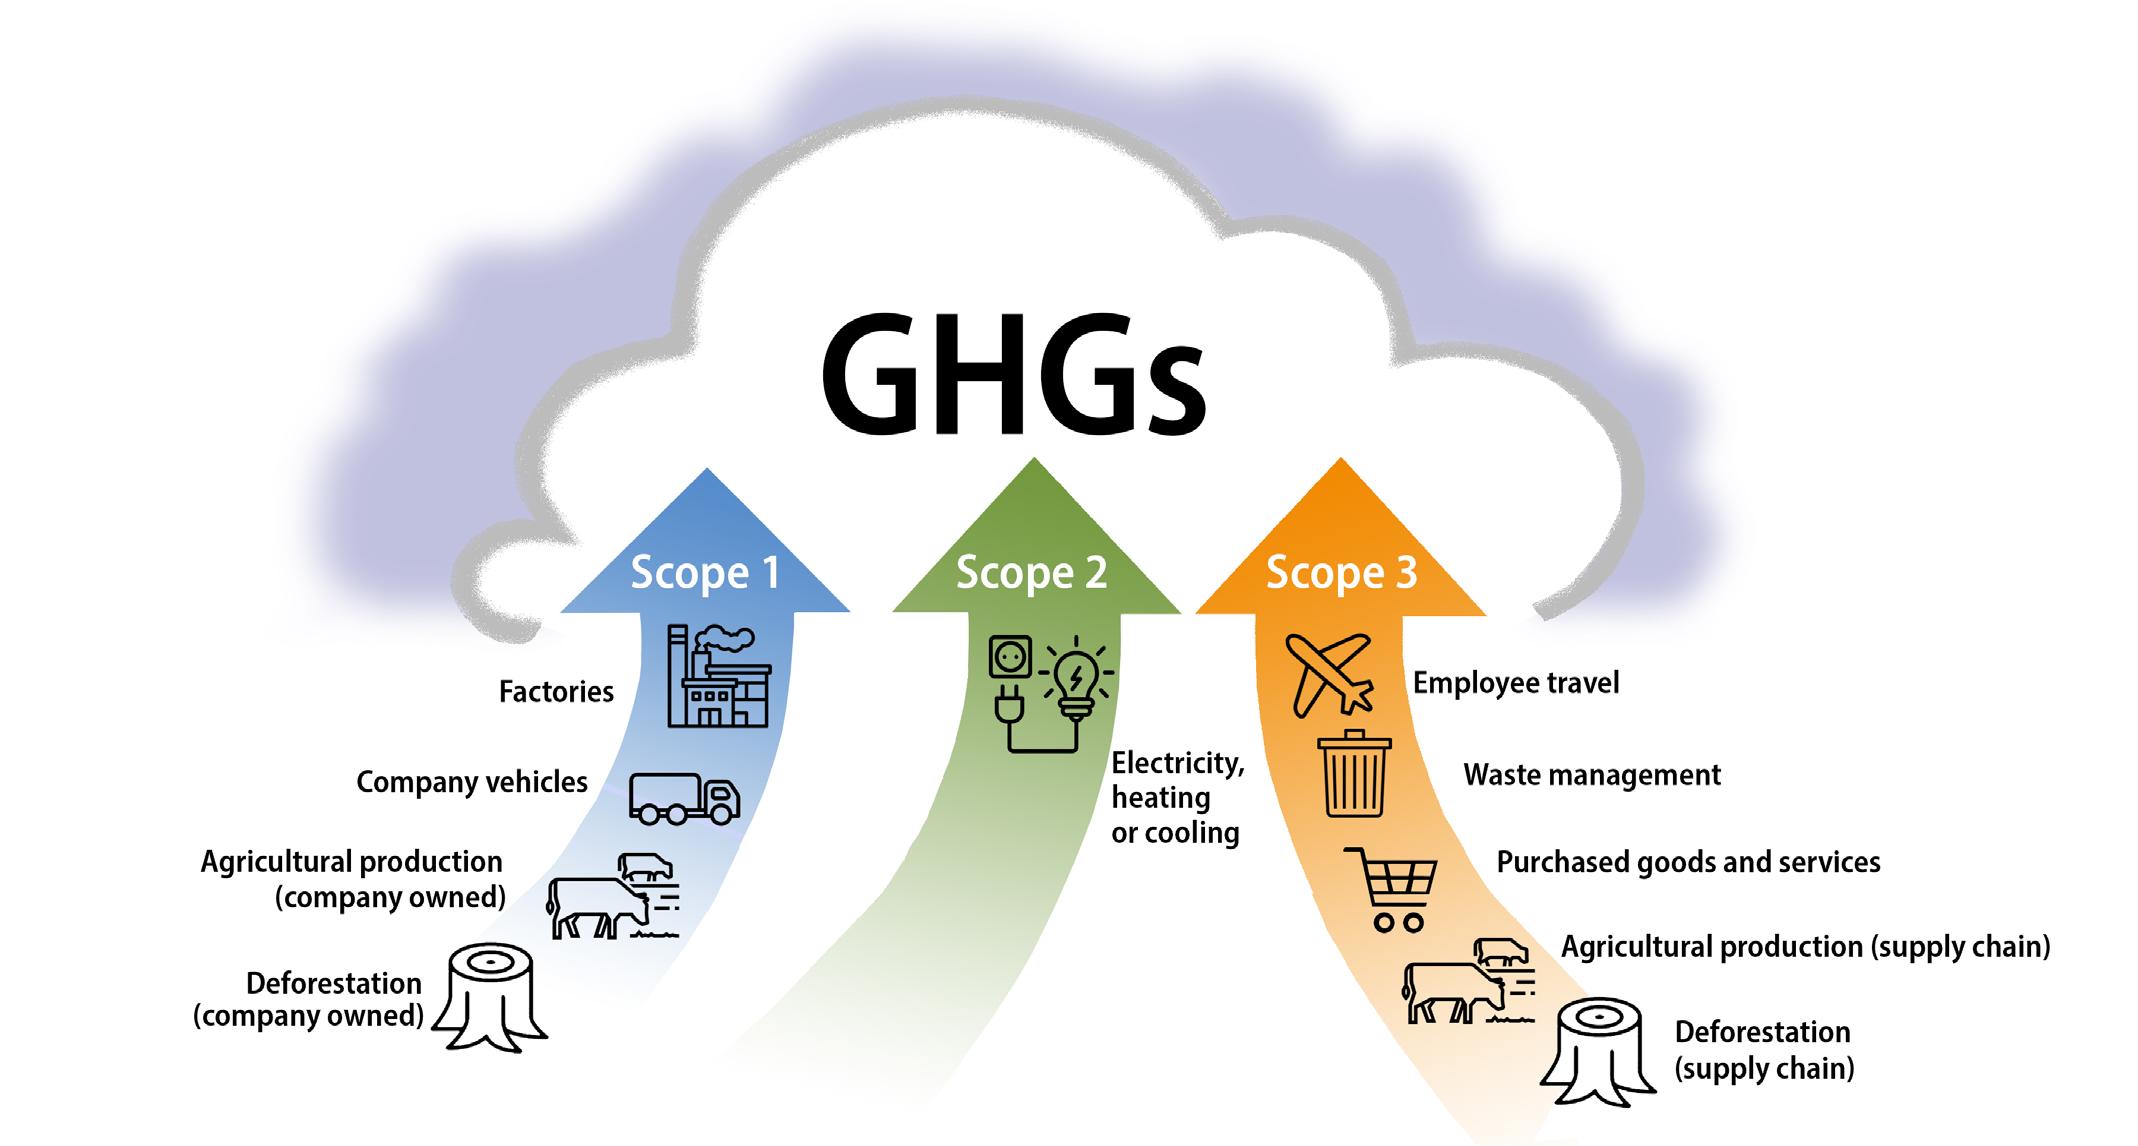
Figure 8 How deforestation-related GHG emissions show up in corporate GHG inventories and disclosures. For most companies, GHG emissions from agricultural production, deforestation and conversion would fall under purchased goods and services, with the exception of companies who own their own agricultural production operations.
Existing standards for corporate GHG emissions disclosures do not provide detailed guidance for companies to report emissions from deforestation and conversion. As a result, most companies do not include these emissions in GHG inventory reporting. And even when companies include these emissions, the calculations often rely on global or regional averages because they don’t have sufficient visibility into their supply chains to estimate deforestation-related emissions embedded in their own sourcing. Part 5 further describes the importance of supply chain traceability and how to engage companies on this topic.
Standardized methods to appropriately account for land-based emissions will be included in forthcoming guidance from the GHG Protocol.53 The World Wildlife Fund (WWF) is also developing sector-specific guidance for emissions from forests, land and agriculture as part of requirements for setting science-based GHG targets validated by the Science-Based Targets Initiative (SBTi).54 (The SBTi is a partnership between CDP, the UN Global Compact and other groups.) Together, these actions will help shift industry standard towards inclusion of land-based emissions, including deforestation emissions, in science-based targets. They will also ensure more consistent accounting and disclosure of deforestation-related GHG emissions.
Assessment of broader climate risk mitigation by companies Deforestation-driven climate risk is a function of a company’s exposure to deforestation based on its commodity sourcing patterns and the way in which the company responds to manage exposure and mitigate risk. To address the systemic risk of climate change, all companies should have a broader climate strategy with ambitious greenhouse gas reduction targets for all of its emissions. For companies with direct exposure to deforestation, a robust no-deforestation commitment must be a part of the overall strategy a company employs to achieve its climate commitments. Investors can use the framework outlined in Part 5 to assess whether a company’s climate and no-deforestation commitments and policies are sufficiently rigorous to reduce overall climate and deforestation risks.


