1 minute read
business gettingback to business


Employment Cost Index
The ECI measures the change in the hourly labor cost to employers, independent of the influence of employment shifts among occupations and industries. Labor costs include wages and salaries and the cost of employee benefits. As the economy began to open back up after shutdowns from the COVID-19 pandemic, employers struggled to fill positions and retain workers. Employers reported using higher wages to hire more workers and reduce turnover. However, the CPI increased at a faster rate than nominal wages. Consequently, the real wage index began to trend downwards. In March 2022, real wages for private industry workers were 3.8% higher than in March 2005, but 3.3% lower than in March 2021.
Unemployment Rates
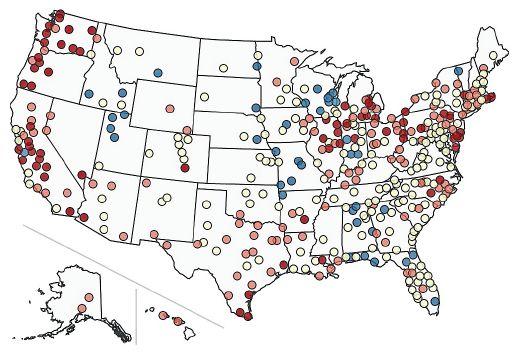
Unemployment rates were lower in December 2022 than a year earlier in 244 of the 389 metropolitan areas, higher in 115 areas, and unchanged in 30 areas. A total of 172 areas had jobless rates of less than 3.0% and 2 areas had rates of at least 10.0%. In December, Madison, Wisconsin, had the lowest unemployment rate, 1.6%, nearby included Fargo, North Dakota, 1.9%, and Sioux Falls, South Dakota at 2%
Source: U.S. Bureau of Labor Statistics
Source: U.S. Bureau of Labor Statistics
Projected Percentages

The U.S. Bureau of Labor Statistics produces long-term projections of the economy, labor force, and employment in industries and occupations each year. The development of the projections depends on many assumptions, BLS notes. One assumption is that the economy is at full employment in the target year. That assumption allows the bureau’s analysis to focus on structural instead of cyclical factors, according to its website. However, some of the projected 2021–31 growth is expected to stem from cyclical recovery after the COVID-19 pandemic and resulting recession. From 2021 to 2031, the U.S. Bureau of Labor Statistics projects total employment to increase by 5.3%. The chart shows total projected change for each occupational group, as well as the share of projected growth that had already been realized in available data as of August 2022, according to the organization’s website, which allows it to highlight some distinctions across groups that otherwise might seem similar.

Projected percent change, 2021-31, beyond realized employment growth
Projected percent change, realized as of August 2022
Source: U.S. Bureau of Labor Statistics


