
1 minute read
Biochemical Analysis of Forests using Hyperspectral Remote Sensing

The vision is to facilitate automatic identification and quantification of various vegetation types in a region by credibly correlating spectral signatures collected on field and spectral reflectance measured using space-borne hyperspectral sensors.
Advertisement
Stakeholders Involved
The project team from Lab for Spatial Informatics, International Institute of Information Technology, Hyderabad, Telangana, and Indian Institute of Space Technology, Thiruvananthapuram, Kerala, India.
Solution and Implementation
The project used spectra extracted from multi-temporal CHRIS PROBA Hyperspectral data.
The spectra extracted for the selected species from satellite data are correlated with canopy spectra derived from leaf reflectance spectra obtained from the field using SEMULS.
The outputs of the model are validated for their applicability by comparing with upscaled spectra derived from popular PROSPECT.
The SEMULS model is unique in retaining the
Objective
1. To estimate the chlorophyll and nitrogen content of various species with integrated field and satellite-based methods.
2. To correlate spectral variations with that of canopy biochemical patterns under stress conditions (factors leading to a decrease in chlorophyll, and nitrogen constituents).
Species Canopy Upscaling Model
minute dips and peaks of the spectra, which are important in discriminating (80% matching at 5deg or less threshold) species, unlike other models that smoothen spectra using different filters.
The upscaled canopy spectra (SEMULS) are further used to classify selected species in the study area from CHRIS-PROBA satellite data, using the SAM method and validated based on GPS locations observed from the field.
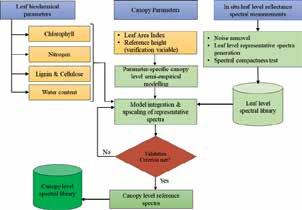
A spectral database was developed for selected tree species using hyperspectral satellite imagery and to build a canopy upscaling model. The SEMULS model is created for upscaling the leaf spectrum to the canopy level. Parameters like LAI, chlorophyll, nitrogen, lignin, cellulose, protein, water content and the leaf spectrum from the field are inputs for the model. The model converts the leaf biochemical parameters at the canopy level and upscales the spectrum with the canopy biochemical parameters.
Disclaimer: These case studies have been extracted from the Integrated Geospatial Information Framework report.
