
22 minute read
Exploring the Marine Environment in South Africa

Using Machine Learning to Derive Benthic Habitat Maps
The South African Council for Geoscience recently launched an initiative to optimize marine geophysical data collection in South African waters. The main aim of the initiative is to produce marine offshore maps with 100% seafloor coverage in the highest resolution currently possible, according to International Hydrographic Organization (IHO) standards. Scientists set to work and developed a tool to classify seafloor bathymetry and a predictive tool that classifies geological data into substrate maps using machine learning techniques.
In the recent history of southern Africa, there has not been a large-scale systematic marine geophysical offshore mapping project. This lack of data resulted in the Council for Geoscience initiating its own offshore mapping programme to optimize marine geophysical data collection. The main aim of the initiative is to produce marine offshore maps with 100% seafloor coverage in the highest resolution currently possible, according to International Hydrographic Organization (IHO) standards. One of the main focuses of the strategy has been technology and innovation in mapping, to better inform research projects and build on the collective knowledge in the marine sphere. The programme also plans to advance the public understanding of science exposing the character of the seafloor, which has been underrepresented up to now.
As South Africa collates and acquires new hydrospatial data, it is imperative that these datasets are used for a range of applications. Benthic habitat mapping considers the distribution of biological habitats, as chiefly governed by morphology and geological substrate, and lends itself to applications of machine learning, and the South African seafloor is both vast and variable in composition. This method of mapping using machine learning in combination with marine geophysical and biological data, tested in multiple sites across the South African coastline, will aid in improving our current understanding of the relationships between biota and physical habitats.
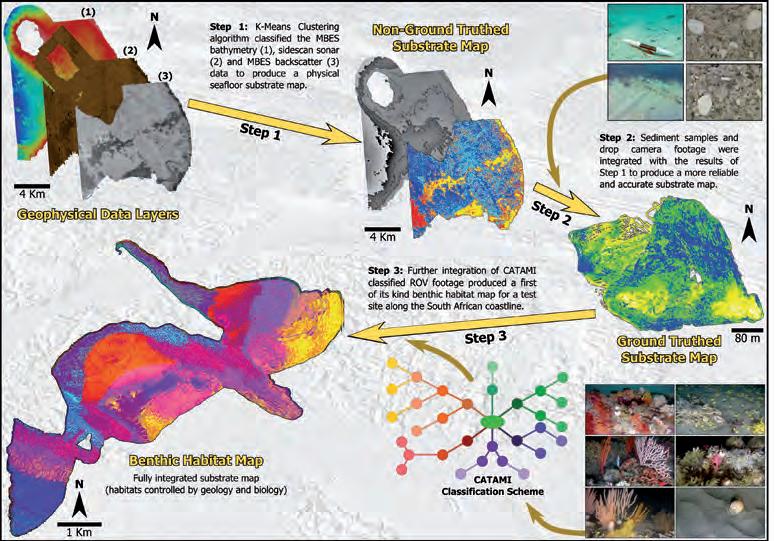
Figure 1: Combining machine learning and marine geophysical data in an innovative way to enhance benthic habitat mapping techniques.
Technical SpecificaTionS for DaTa collecTion
The multibeam bathymetry and backscatter data acquired from the investigations undertaken so far were collected using a pole-mounted 400kHz R2Sonic 2024 multibeam echosounder, with motion correction and dynamic positioning for the system provided by an Applanix POS M/V Oceanmaster inertial motion reference unit (IMU). Positioning was derived from a differential correction from a C-Nav 3050 DGPS. Survey line planning facilitated full seafloor coverage. The acquisition of data close to the coastline or in shoaling areas was not possible because of the presence of thick kelp beds and/or dangerous surf conditions. It took approximately 70 days to process and interpret ~5,000 kilometres of data, with all data acquired and processed using QPS Qinsy and Qimera software. The bathymetric data was levelled to Mean Sea Level using an SBET solution relative to the SAGEOID2010 orthometric model. The final bathymetric grid was resolved into 1m (shoalest depth) bins/tiles/pixels.

Figure 2: Locality map of Koeberg, and Clifton and Table Bay found along the Western Cape, as well as Cape St Francis found along the Eastern Cape of South Africa.
Figure 3: Data collection offshore of Table Bay in April 2017.
Conventional sidescan backscatter data was acquired using a dual-frequency (500/100 kHz) Klein 3000 sidescan sonar, which was towed behind the survey vessel using a CSW-9V winch. Lines were acquired using a scan range of 75m with 15% overlap of adjacent lines and full ensonification of the seafloor. The position of the towfish was determined using the reciprocal-layback method, transmitted in real time to the acquisition software via a radio modem. This data was processed using NavLog proprietary software to produce four sidescan sonar mosaics with a pixel resolution of 10cm. The multibeam derived backscatter data was processed using QPS FMGT™ to generate a final mosaic with a 0.5m resolution.
DifferenTiaTion of Machine learning TechniqueS
Over the past two decades, machine learning has become a cornerstone in information technology, as increasing amounts of data are now available to scientists in various fields. This accumulation of data along with the need for efficient data analysis will become a necessary component for technological advancement in the future. Machine learning is based on computer modelling processes and their multiple manifestations; it combines taskorientated studies, cognitive simulations and theoretical analysis to interpret and understand a wide variety of datasets.
In machine learning, there are two main categories of data classification: namely supervised and unsupervised. Supervised classification refers to the use of image processing software that is guided by the user to specify the categories into which the data should be classified. During supervised classification, ground-truthed data is classified and then used to constrain the interpretation of the acoustic data. Unsupervised classification refers to a method where the outcomes (groupings of pixels with common characteristics) are based on the software’s analysis of an image without the user providing sample classes. The software then determines which pixels are related and groups them into classes.
In the first phase of an initiative to develop capability to do semi-automated benthic habitat mapping in South Africa, three different machine learning techniques were tested in Table Bay, South Africa to find out which would be the most cost-effective, efficient, easy-to-use algorithm for the multibeam bathymetry, backscatter and sidescan sonar data collected by the Council for Geoscience, as part of a national offshore mapping programme. Initially, an unsupervised method of classification was chosen, with these results being compared to historical data interpreted in the area, to ensure a level of accuracy.
Decision Tree Classifiers, Random Forests and k-means clustering algorithms were used to classify the hydroacoustic data. These unsupervised classification methods were combined with a classification accuracy measure to ensure the validity of the results. The advantages and disadvantages of each algorithm were identified and the k-means clustering method was understood to be the best suited for our multibeam bathymetry and backscatter applications. This algorithm was conceptually simple and easy to implement, versatile, easily updated, efficient and computationally fast, and could store large amounts of data. The Decision Tree Classifier tended to over-fit data, did not work well with


machine learning k-means clustering. Eight ROV dives took place along the three transects, ranging from 30-80m in depth and the ROV footage was classified using the CATAMI substrata classification scheme. The most common Phyla ordered from most abundant to least abundant were; Cnidaria, Mollusca, Echinodermata, Chordata (fish species), Arthropoda (Subphylum Crustacea), Bryozoa, Porifera and Chordata (Class Ascidiacea). These species were identified both on rocky substrate and sand. Using this scheme, each species class was assigned a colour and input into the k-means clustering algorithm, which linked each sediment class of the substrate map to a species class. This was done using the k-means clustering algorithm as the intensity of the backscattered waves for species classes could be linked to the intensity of similar seafloor substrates. The algorithm was able to create a map with ten different benthic habitats that combined all the input datasets (multibeam bathymetry, backscatter data and ROV footage). The benthic habitat map of the area was able to
Figure 4: Above: Data acquisition in Table Bay, including sidescan sonar, multibeam and pinger data. Below: The Council for Geoscience survey vessel R/V Nkosi at sunrise.
complex data or noisy data, whereas the Random Forest algorithm was slow in the pre-processing stages, and in generating predictions due to the multiple decision trees being output, the model is difficult to interpret.

creaTion of SuBSTraTe anD BenThic haBiTaT MapS uSing K-MeanS cluSTering
The k-means clustering algorithm was then used to create substrate maps in two contrasting study areas (Clifton and Koeberg, in South Africa), with differing geological settings. Drop camera footage and sediment grab samples were collected from the sites for the purposes of ground-truthing and improving the accuracy of the k-means clustering algorithm. Drop-camera footage was classified using the Collaborative and Automated Tools for Analysis of Marine Imagery (CATAMI) substrata classification scheme and sediment grab samples were processed using a settling tube. The statistics from the samples were used to define the sediment categories that were input into the clustering algorithm, in order to validate the results and reinforced by determining the measure of classification accuracy. The algorithm results reiterated that if it is supplemented with new data, with differing seafloor characteristics, and a combination of different input datasets, it can create more reliable and accurate final substrate map products.
The k-means clustering algorithm was further refined in an area that has significant variability in geology and terrain, in comparison to the first test sites that were composed mainly of unconsolidated sediment. Multibeam bathymetry, backscatter and ROV footage were collected in Cape St Francis, South Africa, and the hydroacoustic data was processed using Dr Talicia Pillay. Talicia Pillay is a Scientist within the Marine Geoscience Unit at the Council for Geoscience with a PhD focusing on benthic habitat mapping using machine learning techniques. She has both theoretical and practical experience in a number of marine geophysical datasets, as well as being proficient in Python coding and algorithm writing, with an emphasis on artificial intelligence.
Dr Hayley Cawthra - Pr.Sci.Nat. Hayley Cawthra is a Chief Scientist in marine geoscience at the Council for Geoscience, South Africa, and a Research Associate at the Nelson Mandela University. She has a PhD from the University of Cape Town and specializes in past sea-level change, palaeoscience research from seafloor proxies, and interpreting human use of ancient coasts.
Michael MacHutchon – MSc (Geology),
Pr.Sci.Nat. “Mac” is a specialist marine geophysicist with over 17 years of experience in advanced geophysical post-processing and coastal, near- and offshore morphodynamics. He is a specialist in the use of all marine geophysical instrumentation suites and a variety of acquisition and post-processing software. Internationally published, including a substantial amount of commercial scientific reports, he is passionate about marine geoscience and always open to new ideas and techniques to improve our understanding of this dynamic environment.
use machine learning to identify and quantify different habitat types, accounting for geology, topography, sediment cover and species distribution.
concluSion
Like most coastal nations, South Africa is exploring avenues to grow its oceans’ economy and better understand the marine environment, yet relatively little is known about the distribution of the country’s offshore benthic biodiversity. Given the considerable expense of sampling deep benthic biodiversity, models created from hydroacoustic data can be helpful in creating benthic habitat maps, which can in turn be used as surrogates for unsampled bioregions. With high quality and accurate modern hydroacoustic systems in combination with machine learning techniques, the ability to survey and sample in logistically challenging areas, with small operating budgets, can now be achieved. Furthermore, this study has demonstrated the importance of implementing machine learning techniques to improve map accuracy and reduce processing time.
Figure 5: An overview of the processes and methods used to classify the multibeam bathymetry and multibeam backscatter data. This image highlights the multiple steps and input datasets required in order for the machine learning algorithm to create a reliable and accurate benthic habitat map.
SWiFT CTD
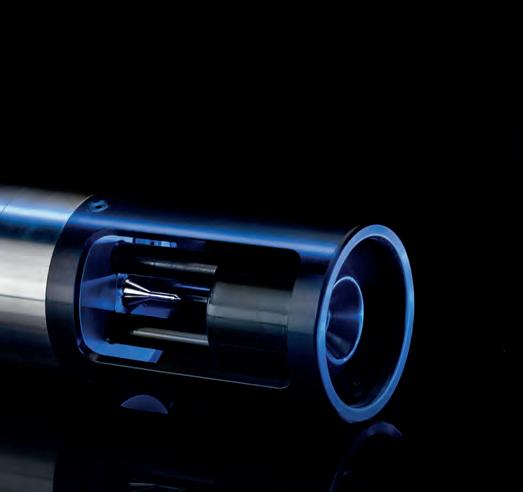
Measured CTD, with all the benefits of the SWiFT

CTD & Environmental • Current • Echosounders & Bathymetry • Sound Velocity • Tide and Wave
AUV R OV & ASV HY DROGRA P HY H Y DROM ETRY M E TRO L OG Y & POS ITI O NI NG OC EAN OGRA PHY PO RTS , H A RB O UR S & DREDGING REN EW ABL E ENERG Y

Visit valeport.co.uk to find out more +44 (0) 1803 869292 sales@valeport.co.uk
Combination of Strengths
Proclaimed in 2017 by the United Nations General Assembly and after yearlong preparations by UNESCO’s Intergovernmental Oceanographic Commission (IOC) to coordinate the later implementation, the first week of June saw the official opening of the UN Decade of Ocean Science for Sustainable Development (2021-2030).
The Ocean Decade provides a convening framework for scientists and stakeholders from diverse sectors to develop the scientific knowledge and the partnerships needed to accelerate and harness advances in ocean science. This will lead to a better understanding of the ocean system and deliver science-based solutions to achieve the overarching UN agenda on sustainable development goals to create a better world by 2030.
Being a longstanding partner of IOC, it was clear from the beginning of this programme that IHO would be among the stakeholders to proactively contribute. IHO’s official definition of hydrography suggests that our discipline is an “applied science” and it seems to me that this is the best precondition to be part of the Ocean Decade, since the request to undertake ocean science for sustainable development is exactly the call for the productive application of new insights gained.
The known strengths of the IHO´s expertise lie in ocean mapping and standardization. For the latter, IHO´s S-100 universal hydrographic data model framework offers a unique opportunity to merge hydrographic measuring of the ocean´s physics such as seabed topography, sea level, tides, currents, and also elements like temperature and salinity with marine chemistry and marine biology in a new way. Emphasising that “all the physics of the seas” are under the remit of hydrography sheds light on a new balance between the general scopes of hydrography and oceanography. There is no sharp categorization but, to my understanding, hydrography measures the phenomena and oceanography delivers the interpretation of the effects observed. If this is becoming the common understanding, the classic question for hydrographers “What does the seafloor look like?” can be supplemented by “What is in the water?”.
The self-concept of hydrographers as being more engineers of the blue than scientific observers of the marine environment delivers an ideal combination of both strengths. I was recently invited to contribute to a broadcast named “Planet beyond”. The moderator asked me for practical examples of the outcome I expect from the Ocean Decade in relation to our corporate activities. Here they are: • I hope to see an all-embracing digital data model in place for all kinds of marine geoinformation based on IHO´s S-100 framework. If, in the future, all sorts of marine data is formatted according to this paradigm, it would be fully interoperable and could be easily combined. • For our GEBCO ocean mapping programme in collaboration with the Seabed2030 project,
I hope we can receive nearly full global coverage in a decent accuracy and resolution. For that we need more and better data. We are hoping for contributions from all actors, including ships of opportunity. For them, we have developed our crowdsourcing bathymetry campaign. Seafarers and shipping companies are very motivated to contribute but, so far, only thirteen coastal states allow this sort of citizen science in their respective waters of national jurisdiction. I hope that by the end of the decade all of the almost one hundred IHO Member States will have given permission for the use of crowdsourced bathymetry. • For the blue water, I hope that IOC´s ARGO
programme can establish a regular routine and that the descending floats report depths and positions back to us. This would be particularly helpful in remote areas such as the Southern Ocean. • I note that the matter of microplastic monitoring is currently entering the global agenda. I hope that research & development can feed us with smart through-flow measuring sensors to be mounted on autonomous units. The hydrographic offices of the world are champions in repetitive in-situ measurements and the collective processing of the results. If plastic pollution can be monitored, we will be able to contribute.
The collaboration of GEBCO and ARGO and the monitoring of microplastics would be perfect examples of how engineers and scientists could collaborate to find new answers to “What does the seafloor look like?” and “What is in the water?”!

Mathias Jonas, Secretary-General, IHO.
High-density Airborne Lidar Sensor Ideal for Challenging Coastal Survey of Sylt
Arctia-Meritaito has efficiently produced a seamless digital terrain model of land and water along the shallow coastal areas of the German island of Sylt, using a Leica Chiroptera 4X airborne bathymetric sensor.
Bathymetric surveying offers a unique opportunity to capture Lidar point clouds and images of the transitional zone comprising shallow water and coastal land. This information provides valuable insights into environmental conditions, supports research and planning to protect vulnerable locations and aids marine navigation.
Coastal surveys are greatly influenced by the quality of the water, which can be degraded by swirling sand, algae, and seaweed. Difficult conditions in the North Sea compound these issues and increase the importance of fast data collection and reliable operations. Finnish company Arctia-Meritaito Ltd. successfully completed an airborne topographic and bathymetric survey on Sylt, a popular German island known for its vacation resorts and 40-kilometre-long sandy beach, using a Leica Chiroptera 4X as its surveying instrument.
ThreaTs To The Island
The German island of Sylt lies on the outer edge of the Schleswig-Holstein Wadden Sea, between 9–16 km off the mainland. While other islands in the North Sea are surrounded by extensive intertidal sand and mud flats - called wadden - that protect the coastlines, the west coast of Sylt is completely unprotected and exposed to the forces of the water. Harsh weather conditions such as strong currents from tidal ebb and flow, frequent sea storms, and waves up to 10 metres high continuously reshape the island, despite attempts to reduce erosion along its sandy beaches. Since the 1980s, preservation efforts have focused on pumping sand back onto the beaches every year, rather than constructing unnatural concrete structures.
The Landesbetrieb für Küstenschutz, Nationalpark und Meeresschutz Schleswig-Holstein (National Office for Coastal Protection, National Park and Marine Protection Schleswig-Holstein) is responsible for drawing up coastal protection plans and implementing appropriate measures. In recent decades, the organization has experimented with different technologies to identify the most effective methods of maintaining the coastlines.
In the past, surveying vessels carried out the bathymetric mapping of the seabed. For profile lines with a total length of approximately 1,100km, about four weeks was required to allow for the daily varying tide. Mapping was complicated by an underwater reef about 400 – 500m off Sylt’s west coast, where the depths rise from about -6m up to 3m. Outside the reef, the depths in the open North Sea fall again to a depth of about -10m. This reef has always been an obstacle to measuring the whole area with a vessel due to potential damage to the ship and equipment.
In 2020, Arctia-Meritaito was selected to survey Sylt with a Leica Chiroptera 4X airborne bathymetric scanner. The Chiroptera 4X can typically penetrate down to 25m and has even reached 30m depth in ideal conditions. The elliptical scan pattern captures a forward and backward view to provide two datasets of the same point, which reduces noise caused by waves and increases depth penetration. In addition, the oblique view of the laser beam captures data of vertical objects. Despite the turbidity and waves around Sylt, the Chiroptera 4X successfully penetrated 10m to reach the seabed, meeting all project requirements. Sylt Island in northern Germany on the border with Denmark.
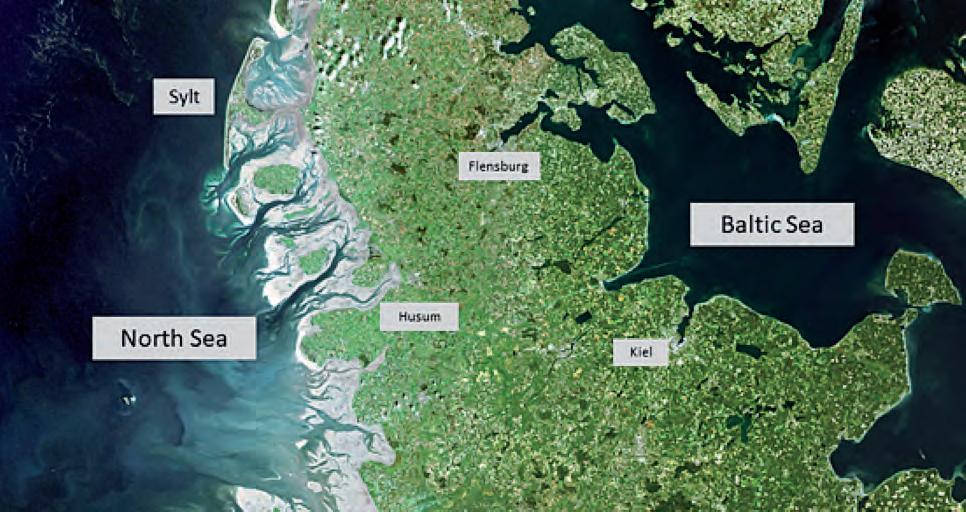
Photo of Sylt, taken from the survey aircraft.
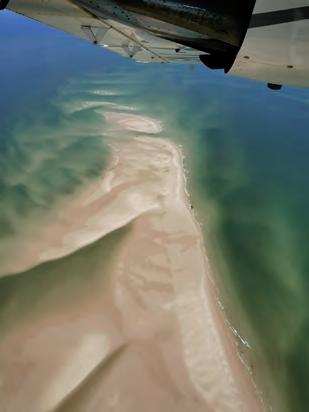

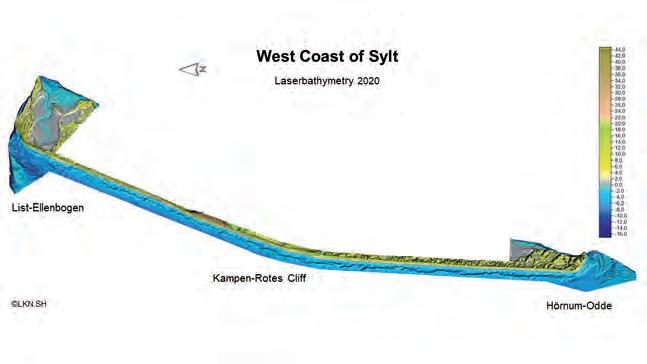
The west coast of Sylt, captured with the Leica Chiroptera 4X airborne bathymetric system.
“Bathymetric laser surveying from the air is a more suitable method to capture the coastal area of Sylt,” says Lutz Christiansen, head of surveying, topography, and morphology at the National Office for Coastal Protection, National Park and Marine Protection Schleswig-Holstein. “By conducting the survey under favourable weather conditions at low tide, Arctia-Meritaito successfully met the required depth and accuracy with an airplane rather than risking running aground with a ship. Based on these results, the measurements will be performed every three years in the future using airborne bathymetry.”
lImITed WIndoW of opporTunITy
The most notable challenge of collecting airborne bathymetric data is timing. Perfect timing produces a clean dataset that is fast to process, while bad timing results in a very noisy dataset that does not fulfil the specification, or even no data at all. In the area around Sylt, there are multiple issues. Too much wind causes white water and waves, while algae floating on the surface blocks the laser and fine sand stirred up from the seabed interferes with data collection.
“Being ready at the right time and making the best of the good weather window requires dedication and effort,” explains Mikko Ojala, head of airborne Lidar bathymetry, Arctia-Meritaito. “The weather and water conditions can change very rapidly. We cannot perform topographic surveys when it is raining, and airborne bathymetric surveys are impacted by inflows of water from the land that increase turbidity. When conditions are finally right, the equipment needs to be functioning and ready to go.”
Spring and autumn, when there is no algae and no ice in the North Sea, typically offer the most favourable conditions. However, seabed material consisting of fine sand is always moving and causing turbidity. As the seabed is frequently changing, overlapping data collected many days apart will not match and will take longer to process. It is crucial to cover the whole project area as quickly as possible to maximize consistency. To capture topographic and bathymetric data of Sylt’s west coast and south and north ends, Arctia-Meritaito targeted June 2020. In two days and a total of five flight hours, the team collected 70 square kilometres.
“We flew the whole area with only two flights, with one day between, and still the seabed topography had changed between the flights,” says Ojala. “This created a processing challenge because there were two seabeds in some places where the data from the previous flight overlapped.”
In addition to Terrasolid for point cloud processing and the QPS hydrographic software suite, Arctia-Meritaito used Leica Lidar Survey Studio (LSS) to process all waveform and position data and incorporate four-band camera data from the Chiroptera 4X. Arctia has a Lidarspecific processing setup based on recommendations from Leica Geosystems.
survey resulTs supporT analysIs
To ensure high quality results that guide preservation decisions for the future, the surveying contract stipulated that measurements should only be carried out under favourable conditions (easterly winds). Deliverables included point clouds with classifications (1m and 10m grid) and orthophotos. The height accuracy had to be better than 20cm and the positional accuracy better than 50cm. Processing was done completely by Arctia-Meritaito, with results delivered about eight weeks after data collection.
“We achieved a minimum point density of 5 points per square metre in the water, thus demonstrating the Chiroptera 4X fulfils general industry requirements in shallow water,” says Ojala. “In addition, simultaneous collection of the bathymetric and topographic point cloud along with aerial imagery is highly efficient and produces a seamless dataset from the land to sea bottom.”
The dataset confirms the status of the coastline and allows for further analysis. When compared with previous measurements, the 2020 survey indicates that the sand deposits added to the beach have contributed to the protection of the coast since the 1980s. Lutz Christiansen intends to continue monitoring Sylt with periodic bathymetry measurements.
“I am very satisfied with the results. The Chiroptera 4X reached the necessary depth,” says Christiansen. “The data
density, accuracy and type of processing met all of our requirements. It was an excellent project that provides an up-to-date status of the west coast and shore area. Now we have a digital terrain model (DTM) from the steep coast of +20m down to -10m water depth.”
developmenT of BaThymeTrIc mappIng
Arctia-Meritaito specializes in hydrographic mapping, fairway maintenance and maritime navigation, carried out with a fleet of ice-breaking ships and surveying vessels. With its roots reaching back to the Finnish Maritime Administration and its predecessors, the company has highly skilled professionals familiar with the unpredictable waters of the Finnish archipelago and surrounding region.
Traditionally, Arctia-Meritaito surveyed shallower depths with vessels equipped with a single beam echosounder that resulted in depth profiles at defined interval distances rather than complete coverage. This approach left significant data gaps between the survey lines in a single beam dataset.
More recently, the multibeam echosounder addressed the data gap issue; however, a multibeam echosounder is not always efficient in shallow waters. The survey swath gets narrower as the seabed rises toward the sensor. Other disadvantages include an increased risk of equipment damage or loss in shallow water if the vessel collides with an uncharted shoal, and the echosounder cannot produce seamless data from water to land.
In 2015, a pilot project was conducted by the Finnish Hydrographic Office that compared the performance of several airborne bathymetric sensors. This project proved that airborne Lidar surveys could meet required mapping standards in
shallow water. A subsequent project in 2016 favourably compared airborne Lidar results to single beam and multibeam echosounders. To adapt to changing industry demand and remain technologically up to date, ArctiaMeritaito replaced its single beam echosounder service with airborne bathymetric Lidar.
“There were other sensors in the 2015 pilot project, but we saw that the Leica Chiroptera 4X provided the most promising results,” says Ojala. “By replacing single beam vessels with airborne Lidar, we get full coverage in shallow waters with depth penetration down to 25m depending on the conditions, while minimizing the risk of losing sensors. Now we collect land and water in one effort, instead of executing a separate survey for the land portion.”
The Schleswig-Holstein national agency for coastal protection has been evaluating airborne bathymetric technology since 1992. By 2015, results from deep-sea airborne Lidar sensors compared to other types of sea measurements showed that airborne Lidar was suitable and able to penetrate the water up to 3x Secci depth. Secci depth refers to a measurement of the turbidity of water, i.e., the depth at which light can no longer penetrate the water.
Thanks to improvements in laser technology and more sophisticated algorithms, today it is possible to reach depths of -25m or more with a shallowwater sensor, such as the Chiroptera 4X, previously attainable only with a deep-sea sensor or echosounder.

Results of the airborne bathymetric survey with the Leica Chiroptera 4X.
