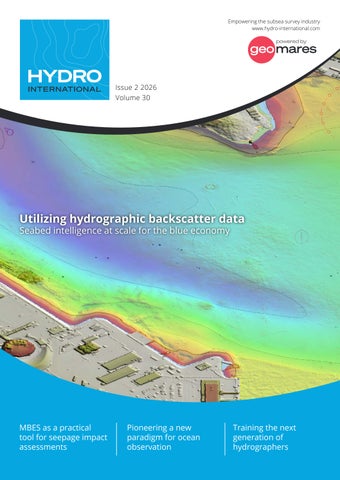
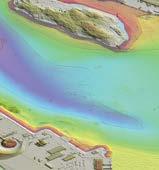
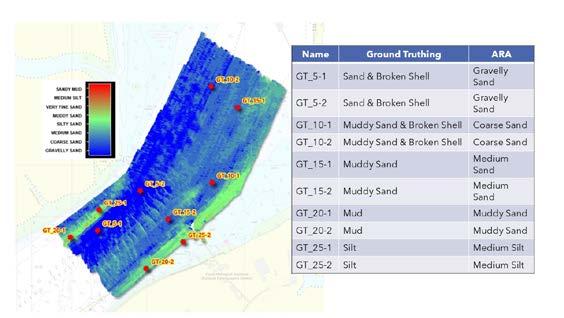
MBES as a practical tool for seepage impact assessments
Pioneering a new paradigm for ocean observation
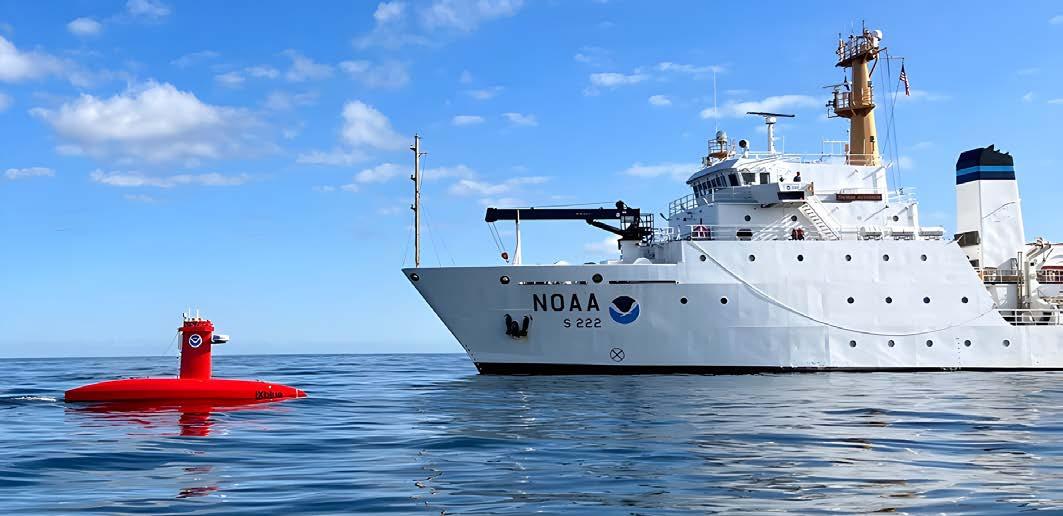
Training the next generation of hydrographers
Director Strategy & Business Development
Durk Haarsma
Financial Director Meine van der Bijl
Editorial Board Huibert-Jan Lekkerkerk, Mark Pronk, BSc, Marck Smit, Auke van der Werf
Head of Content Wim van Wegen
Copy Editor Lynn Radford
Marketing Advisors Myrthe van der Schuit, Sandro Steunebrink
Circulation Manager Adrian Holland
Design Persmanager, The Hague
Hydro International is an independent international magazine published by Geomares. The magazine and related e-newsletter inform worldwide professional, industrial and governmental readers of the latest news and developments in the hydrographic, surveying, marine cartographic and geomatics world. Hydro International encompasses all aspects, activities and equipment related to the acquisition, processing, presentation, control and management of hydrographic and surveyingrelated activities.
Subscriptions
Hydro International is available on a subscription basis. You can subscribe at any time via www.hydro-international.com/ subscribe. Subscriptions will be automatically renewed upon expiry, unless Geomares receives written notification of cancellation at least 60 days before the expiry date.
Advertisements
Information about advertising and deadlines are available in the Media Planner. For more information please contact our marketing advisor (myrthe.van.der.schuit@geomares.nl) or go to www.geomares-marketing.com.
Editorial Contributions
All material submitted to the publisher (Geomares) and relating to Hydro International will be treated as unconditionally assigned for publication under copyright subject to the Editor’s unrestricted right to edit and offer editorial comment. Geomares assumes no responsibility for unsolicited material or for the accuracy of information thus received. In addition, Geomares assumes no obligation for return postage of material if not explicitly requested. Contributions must be sent to the head of content wim.van.wegen@geomares.nl.
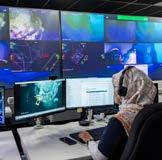
In this exclusive interview, Fugro’s Marco Filippone and EOMAP’s Knut Hartmann discuss how hydrography and satellite technology are converging, the role of AI, and how their collaboration is opening up new markets in ocean data.
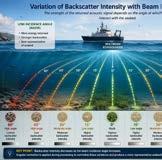
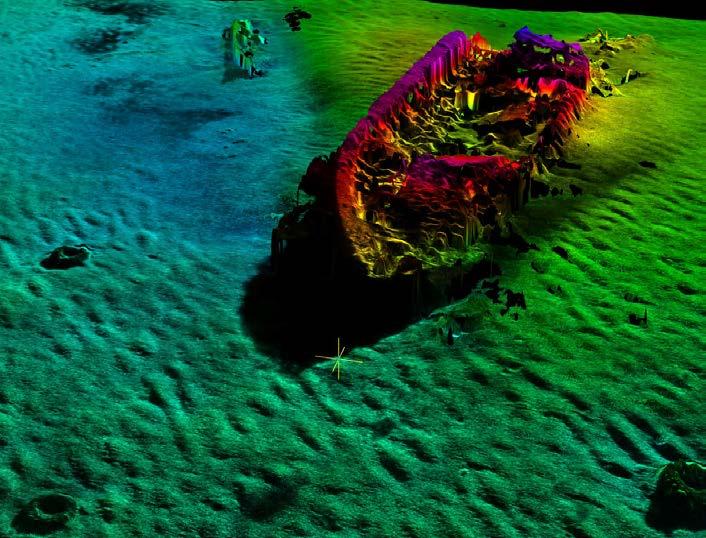
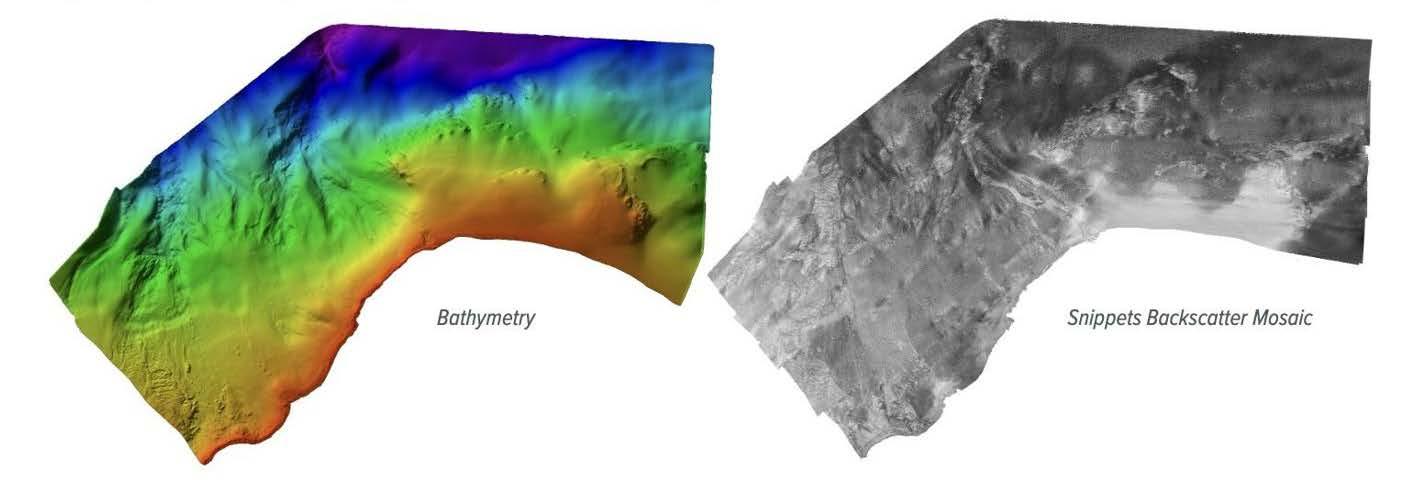
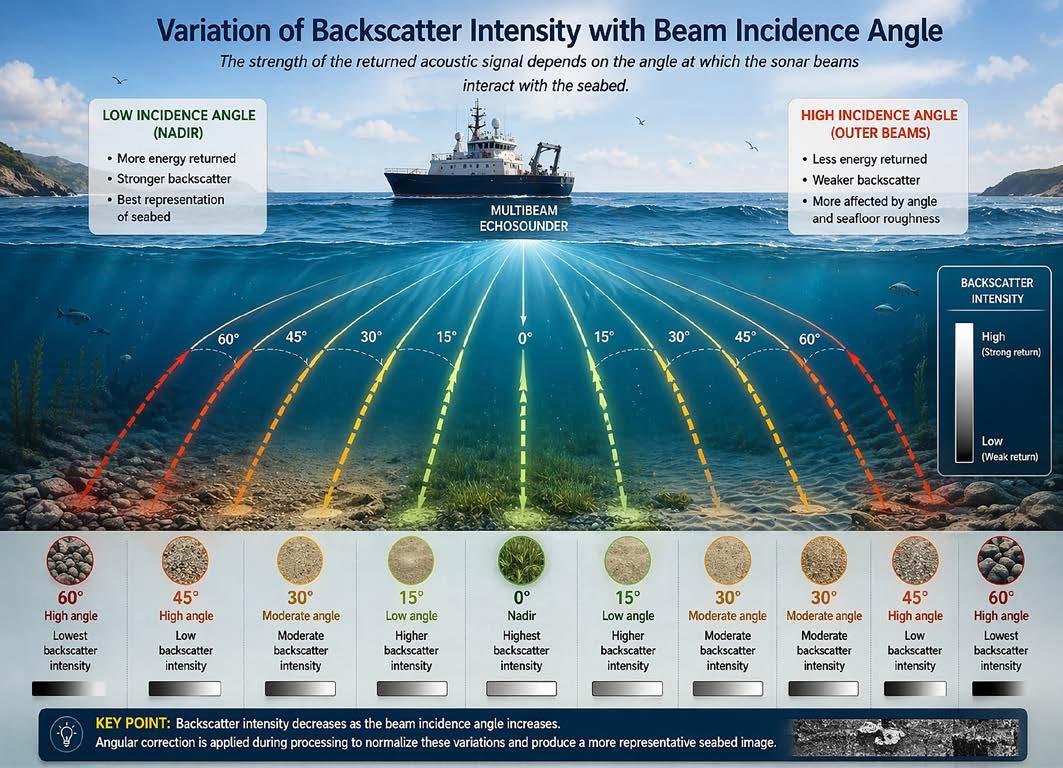
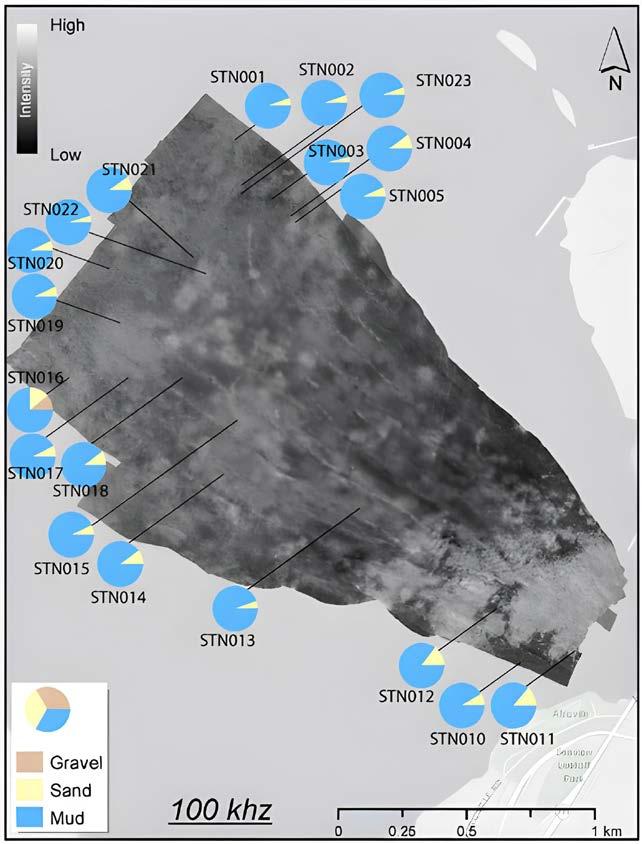
Bathymetry has long defined hydrography, but blue economy activities like marine spatial planning need more than depth. They need to know what the seabed is made of. Backscatter holds this answer yet remains underutilized. A missed strategic opportunity, writes Onogateoghene Idoge.
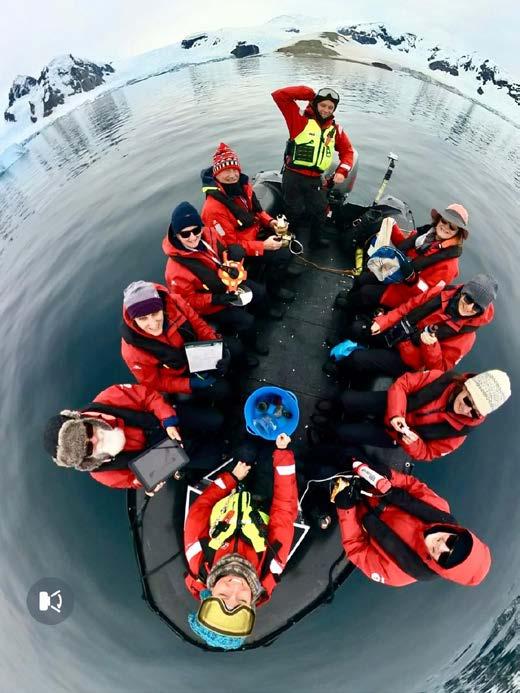
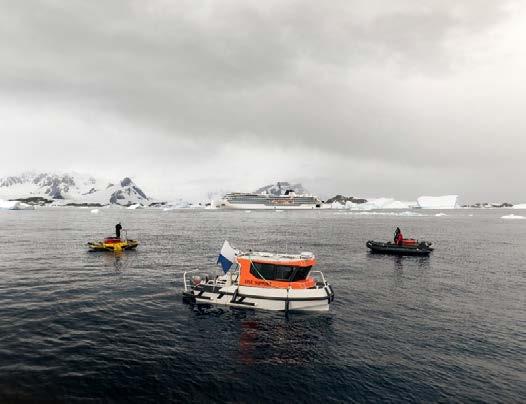
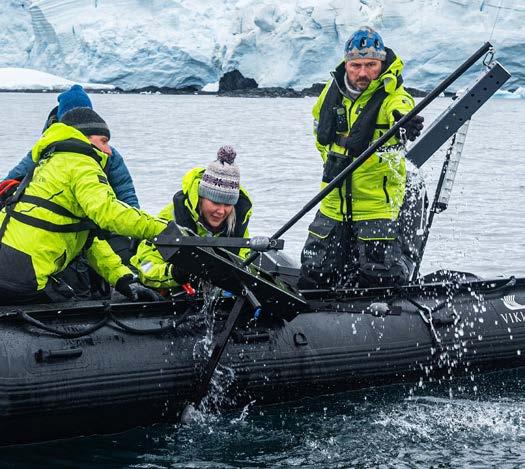
By the end of this year, Viking’s two expedition vessels will have accumulated over 2,800 days of continuous scientific activity. This article outlines how Viking has reimagined the pioneering spirit of a century ago to improve the understanding of the world’s oceanographic environments.
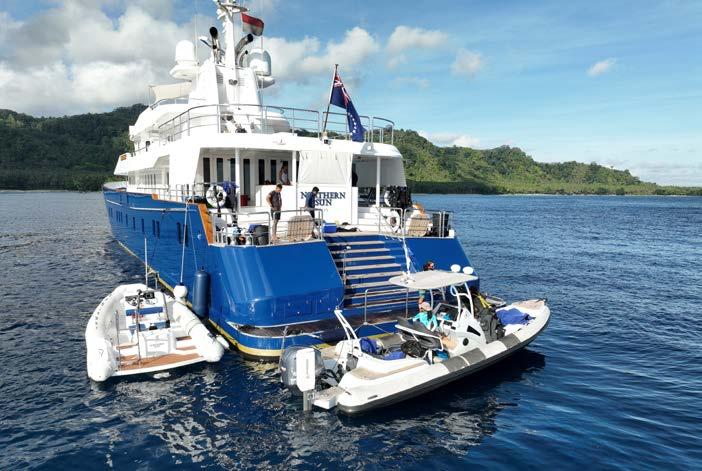
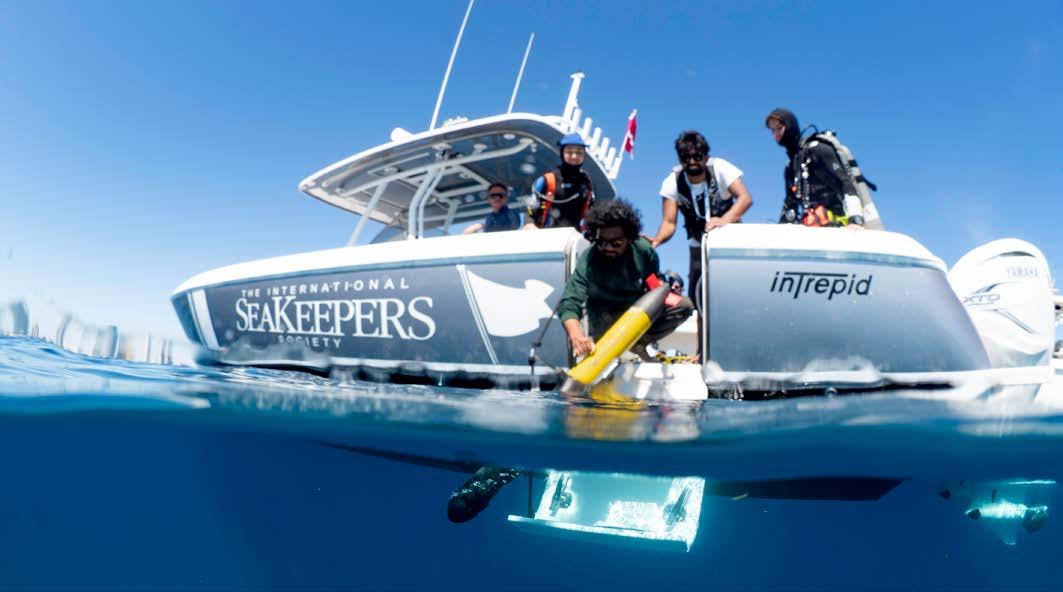
What if every yacht at sea could double as a scientific research vessel – quietly collecting critical data about the health of our oceans?
The International SeaKeepers Society is turning that idea into reality, transforming privately owned vessels into platforms for ocean research, education and conservation.
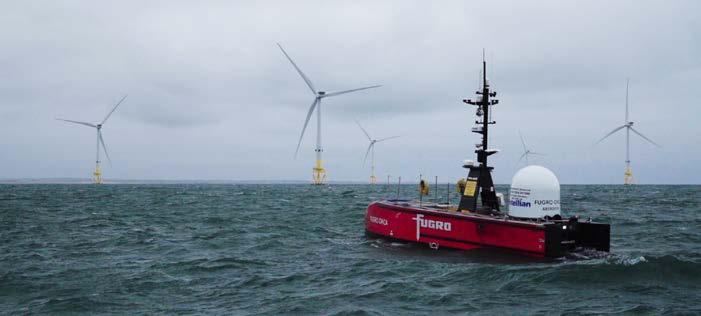
Drawing on deployments in Danish waters, this article explores how edge computing and federated learning can enable automated anomaly detection, freeing hydrographic experts to focus on the most relevant observations for seabed monitoring.
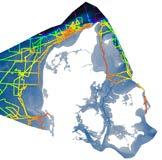
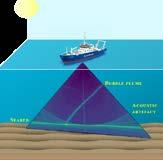
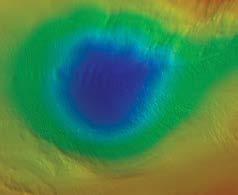
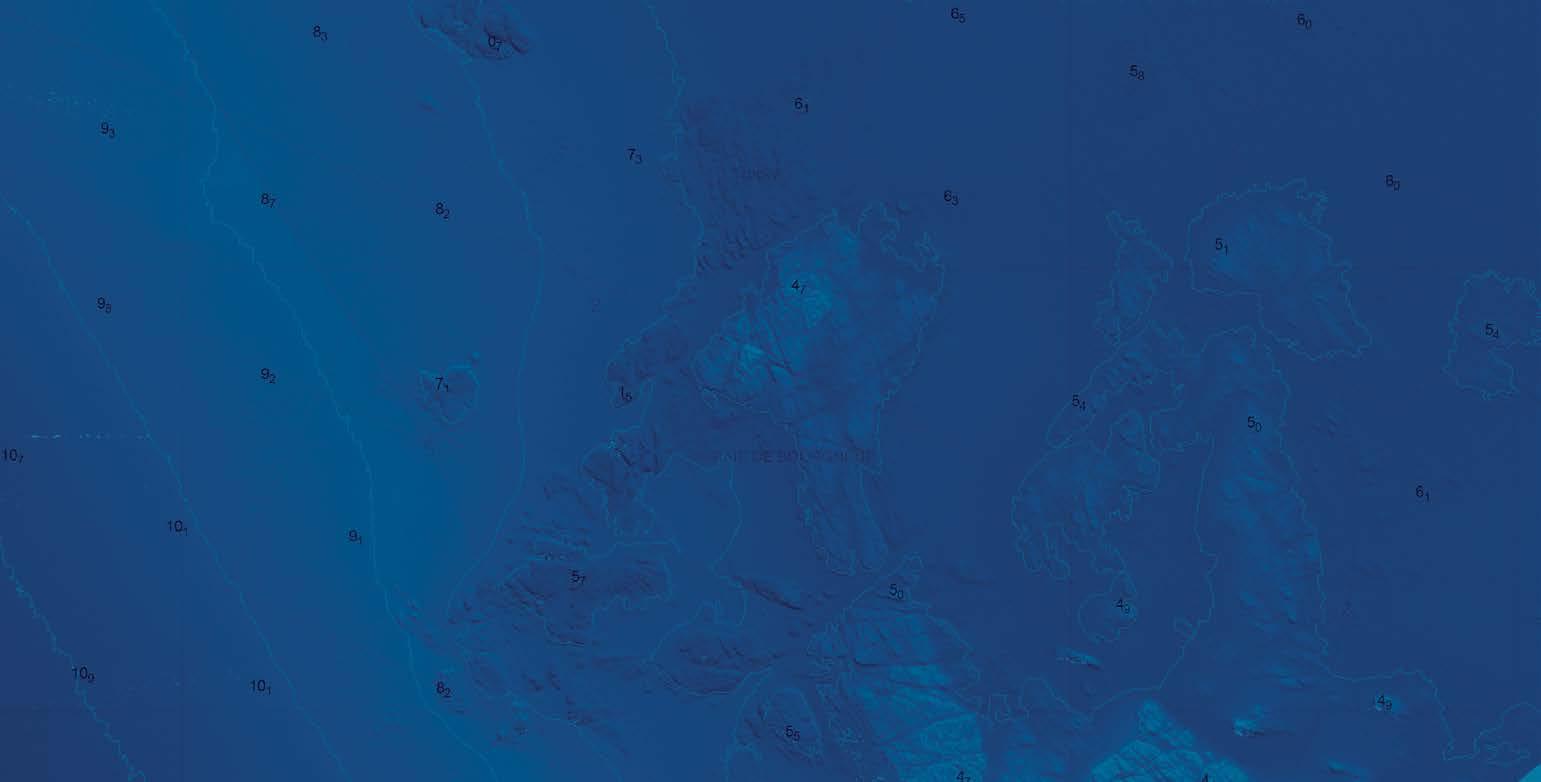
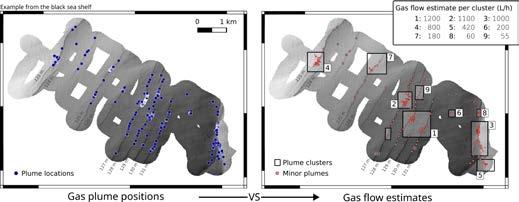
Water column data deserves a closer look from the hydrographic community for estimating gas emission rates remotely. Though it requires acoustic calibration expertise, this approach enables cost-effective classification of seepage sites at scale. This article shows how and why.
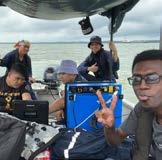
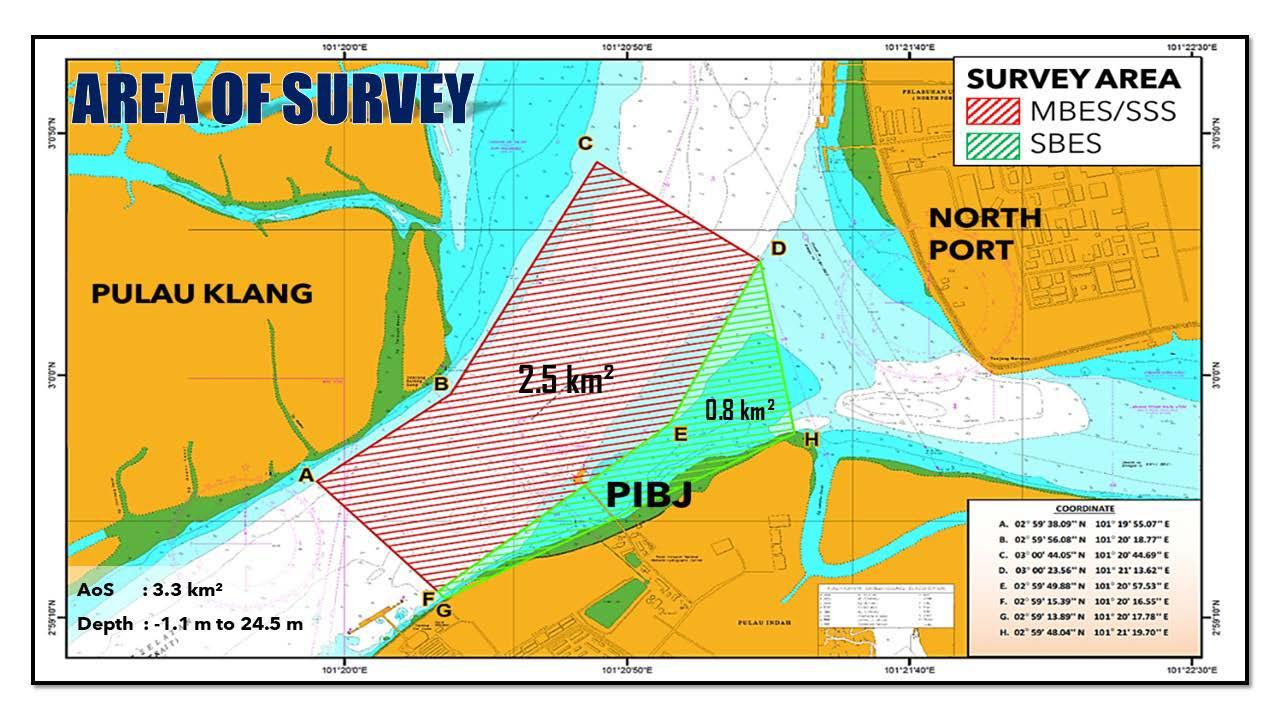
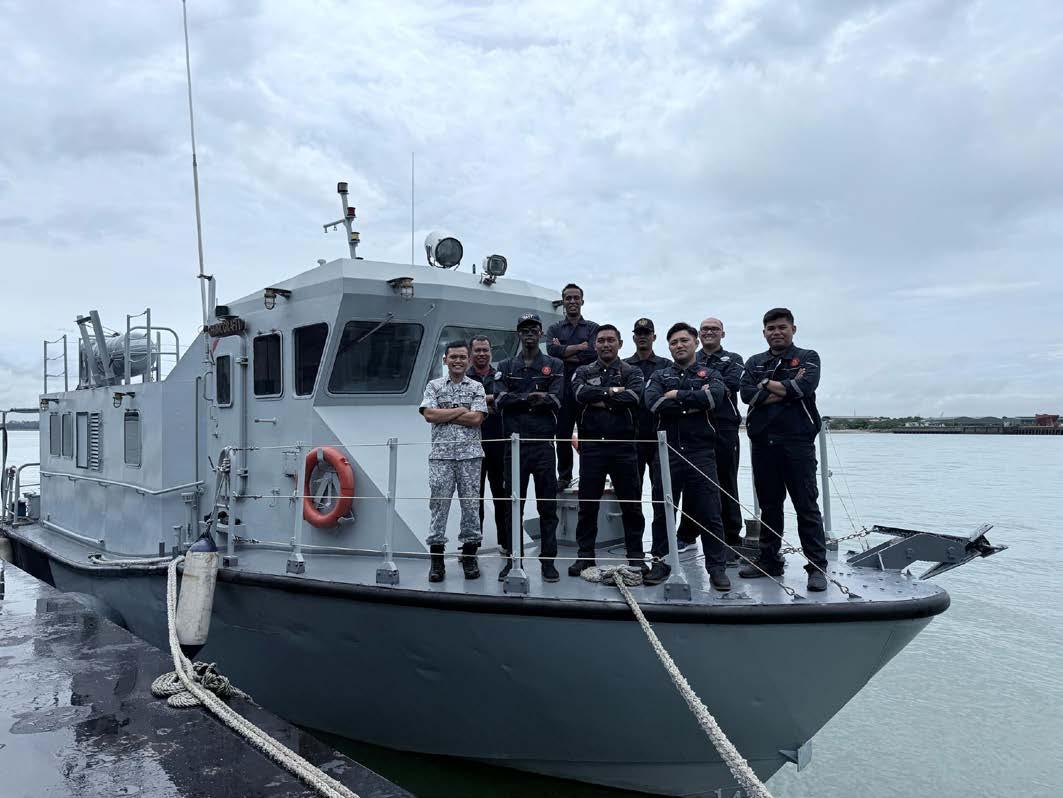
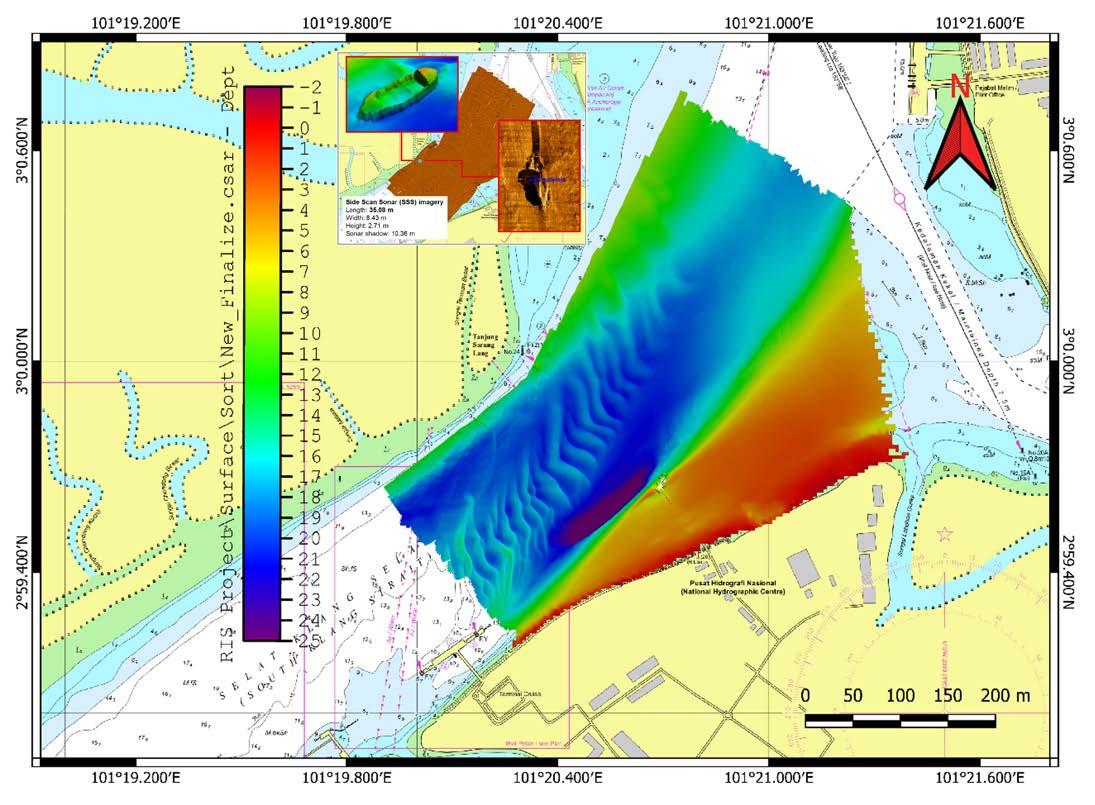
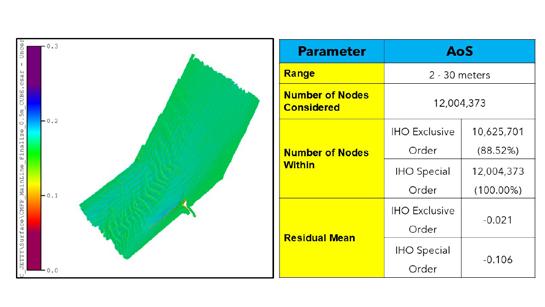
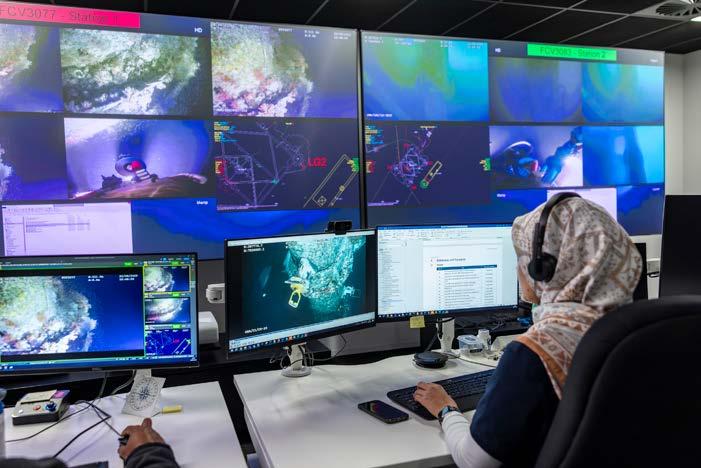
During a complex multidisciplinary field project in Malaysia, trainees gained hands-on experience with MBES, SBES and sidescan sonar within a real hydrographic survey context. This article shows why a CMFP is such an effective platform for developing competency in hydrography.
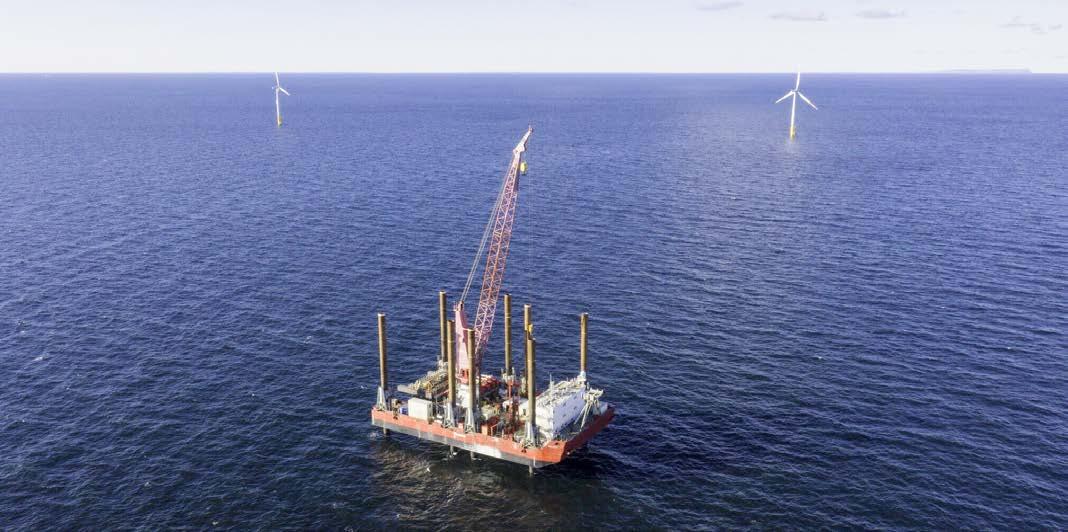
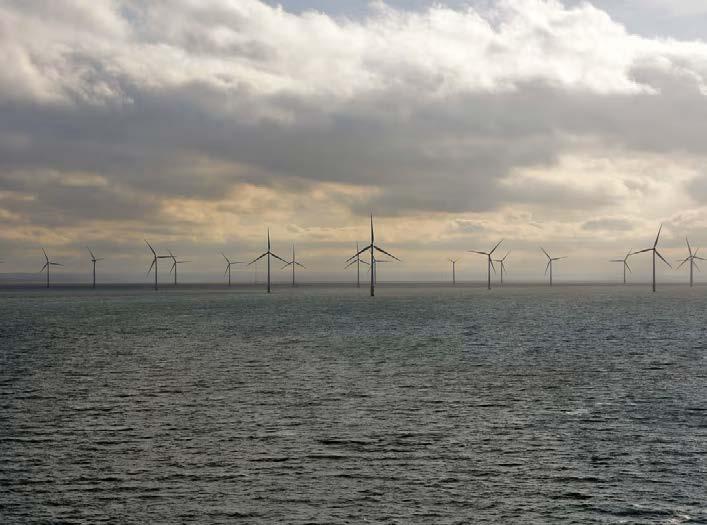
Advances in technology and richer datasets are helping wind farm developers and operators focus beyond daily operations on long-term structural health. As offshore wind scales up, extending existing infrastructure is just as important as building new.
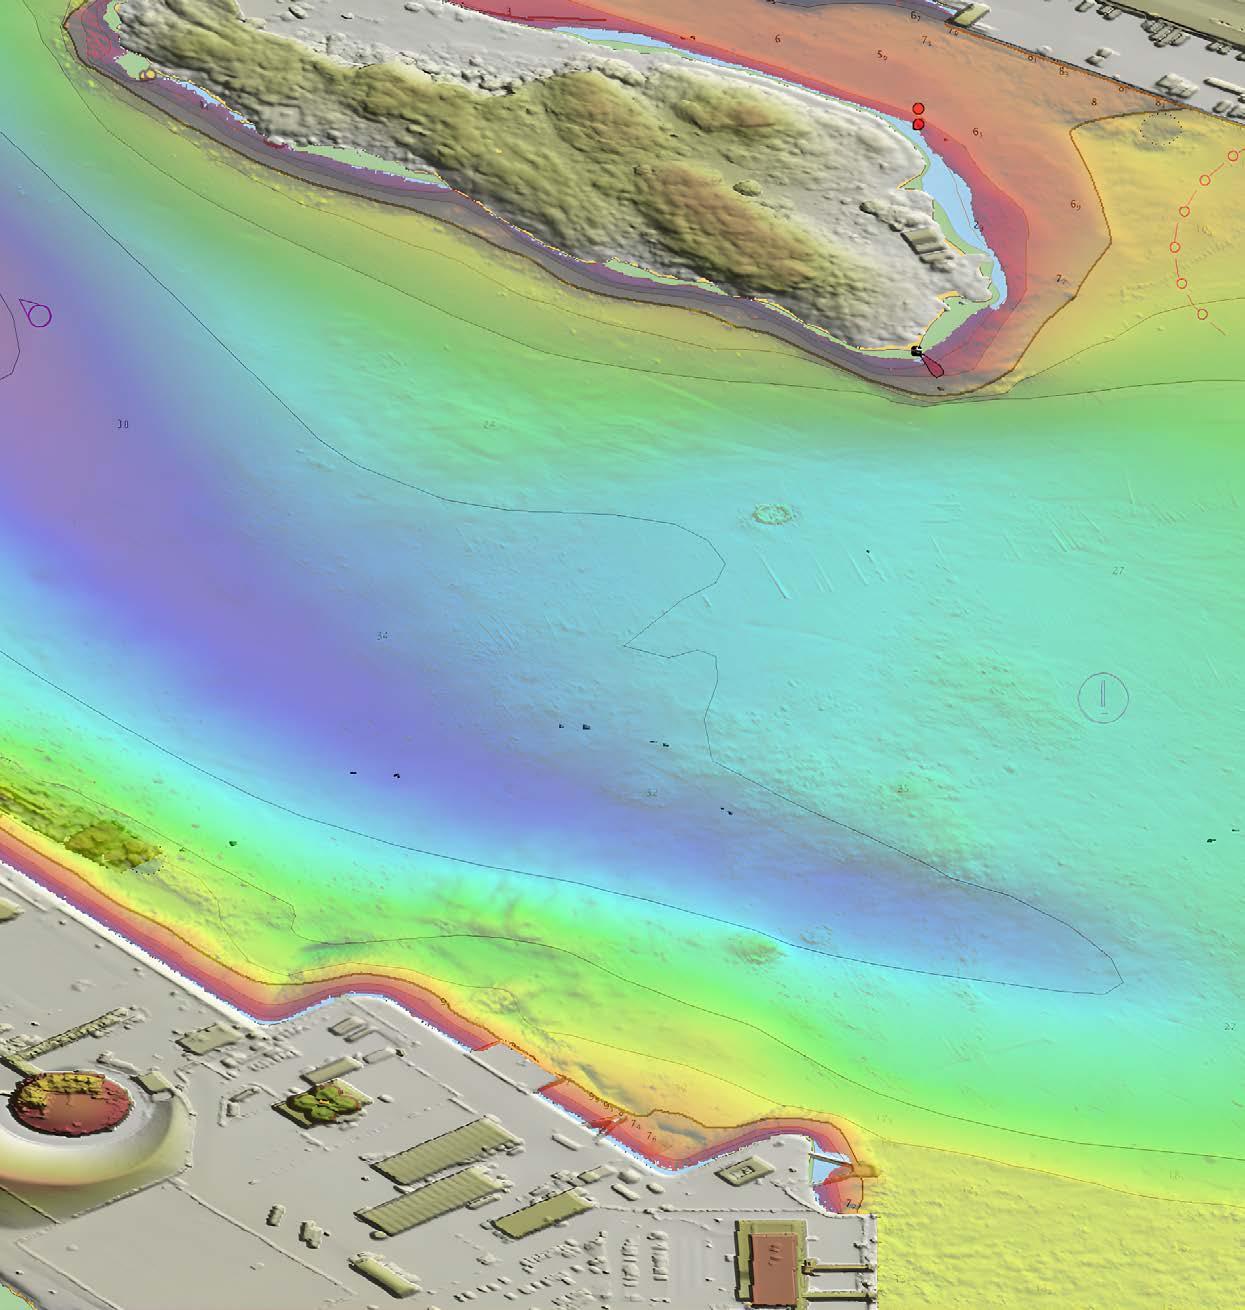
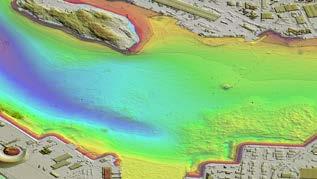
The Norwegian Mapping Authority has recently expanded its digital navigation portfolio with S-104 and S-111, marking a significant step forward in Norway’s digital maritime navigation offering. Pictured here is bathymetric surface data (S-102) which is already available for several Norwegian coastal areas, including Risavika in Rogaland county. (Image courtesy: Kartverket)
Online Company Profile
Premium company membership
Secure
year-round visibility with Hydro International
Online Company Profile
Online Company Profile
Add info like, images, videos, downloads and connect your products on Geo-matching to your profile.
Homepage Highlight
Your logo on the home page (rotates with other partners).
Member Highlight
Your logo will be featured year-round on our members' page, categorized by package.
Company Highlight
Advertorial based on your company profile in newsletter with over 32,500+ subscribers.
4x Social Post
Your post to 38,500+ followers/groups.
1/1-page Ad
In Business Guide, the most important issue of the year.
Company Profile
In Business Guide (100 words, logo and URL).
EUR 3,495
Add info like, images, videos, downloads and connect your products on Geo-matching to your profile.
Homepage Highlight
Your logo on the home page (rotates with other partners).
Member Highlight
Your logo will be featured year-round on our members' page, categorized by package.
Company Highlight
Advertorial based on your company profile in newsletter with over 32,500+ subscribers.
2x Social Post
Your post to 38,500+ followers/groups.
1/2-page Ad
In Business Guide, the most important issue of the year.
Company Profile
In Business Guide (100 words, logo and URL).
EUR 2,595
Add info like, images, videos, downloads and connect your products on Geo-matching to your profile.
Homepage Highlight
Your logo on the home page (rotates with other partners).
Member Highlight
Your logo will be featured year-round on our members' page, categorized by package.
Company Highlight
Advertorial based on your company profile in newsletter with over 32,500+ subscribers.
1x Social Post
Your post to 38,500+ followers/groups.
Company Profile
In Business Guide (100 words, logo and URL).
EUR 1,395
Meet our members
Candid conversations
I recently found myself in an idyllic setting – from a hydrographer’s perspective, at least. Various survey vessels were moored on the River Thames, while another was cutting through the water for an active demo. I was standing outside the ExCeL exhibition centre in London’s Docklands, where Oceanology International was in full swing. It would be hard to imagine a more fitting backdrop to conduct an interview about the future of hydrography. And my conversation that afternoon with Marco Filippone, global director hydrography & ocean science at Fugro, and Knut Hartmann, who leads the EOMAP team, did not disappoint (see page 9).
Several themes emerged during that interview, each one highlighting a topic that genuinely matters to the sector right now. Take the talent paradox. As one of the biggest players in its field, Fugro employs more certified hydrographers than a typical medium-sized hydrographic office. Marco Filippone acknowledged that the company is feeling the effects of the talent shortage. Perhaps it should come as no surprise that they are wrestling with the same problem as everyone else. But he had an interesting take on where the solution could lie. He believes that technology – remote operations, USVs, AI – won’t only change how the work gets done, but can also have a positive effect on how the work is perceived. Young people who were previously discouraged from a career in hydrography because they didn’t fancy spending weeks at sea may actually be very drawn to running sophisticated projects from a remote operations centre. That’s a new twist on the usual ‘AI will take jobs’ debate: autonomous systems and robots could attract people rather than replace them.
Another thing that struck me in our conversation was what I’d describe as ‘technological humility’. Knut Hartmann spoke about satellite-derived bathymetry with refreshing honesty. It isn’t the answer to everything, he said, but it is uniquely strong where other technologies are falling short: affordable, large-scale continuous monitoring. No overselling, just a clear-eyed account of where Earth observation adds value. This kind of positioning is rarer than it should be.
The story of how Fugro and EOMAP found each other was equally revealing, with Filippone describing how their partnership was sparked by necessity. When COVID-19 forced ports across Africa to close mid-survey, Fugro turned to Earth observation data out of sheer operational need. And guess what… it worked brilliantly. Following on from that success, a merger became the natural next step. Not just strategic boardroom decisionmaking, but two teams that had already proven they could work together, and then made it official.
In another moment of quiet honesty, the interview touched on open data. Filippone has argued publicly, in a paper tied to the UN Ocean Decade, that deep-water bathymetric data should be freely shared. This position has raised eyebrows in some parts of the sector. But he makes his case carefully, grounded in public benefit and the ambitions of Seabed 2030, while being clear about where commercial interests legitimately begin.
This is one of the things I love most about trade journalism. Conversations like these –layered, frank, full of ideas that aren’t afraid to go against the grain – are precisely why the work matters. And I know that, as a member of the Hydro International community, you appreciate reading these kinds of interviews just as much as I enjoy making them. So if you have a story worth telling: please, let me know. I’m ready to listen!
Wim van Wegen Head of content, Hydro International wim.van.wegen@geomares.nl
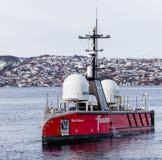
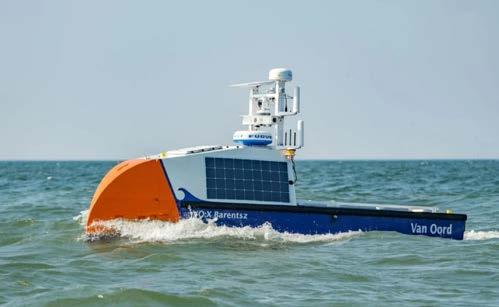
Van Oord completes first multi-day offshore deployment with VO:X Barentsz
For the first time, an uncrewed survey vessel purpose-built for offshore operations has completed a multi-day deployment at an active wind farm construction site. Van Oord’s VO:X Barentsz supported monopile and cable installation works at Ecowende’s Hollandse Kust West offshore wind farm, operating alongside installation vessels Boreas, Nexus and Subsea Viking. The VO:X Barentsz is the fifth uncrewed survey vessel in Van Oord’s fleet and the first specifically designed for open-sea operations. Developed in close collaboration with Demcon Unmanned Systems, the vessel builds on the same hardware and software platform as its four predecessors, while expanding that foundation with new technologies and functionalities tailored to offshore conditions. It is capable of sustained survey activities lasting several weeks and suited to a range of applications, including support for dredging operations, offshore wind farm installation and maritime infrastructure projects. John van der Marel, USV lead at Van Oord, commented on the significance of the deployment: “With the deployment of VO:X Barentsz, we demonstrated how unmanned survey vessels can operate remotely over multiple days, delivering highquality data while continuing to advance innovation in offshore surveying.”
Sinapi elected IHO secretary general as new directing committee takes shape
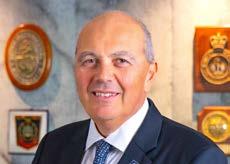
Rear Admiral Luigi Sinapi has been elected secretary general of the International Hydrographic Organization (IHO), with Adam Greenland of New Zealand voted in as the new director. The elections took place on 23 April at the fourth IHO Assembly, held at the Rainier III Auditorium in Monaco. Sinapi, an Italian naval officer and hydrographer, has served as IHO director for the past six years, having previously led the Italian Hydrographic Institute as director and national hydrographer from 2015 to 2020. His career spans more than three decades in naval command, scientific research and international diplomacy, and he holds advanced qualifications in physics, international diplomacy and marine geomatics. In his new role, he will head up the IHO Directing Committee for the next three years, succeeding Mathias Jonas as secretary general. Greenland brings over 45 years of maritime and hydrographic experience to his new position. He has served as New Zealand’s national hydrographer since 2010, during which time he led awardwinning initiatives including the country’s first high-density electronic navigational chart and the Pacific Regional Navigation Initiative, which strengthened maritime safety across five Pacific Island nations. He was recognized with the Alexander Dalrymple Award back in 2017 for his outstanding contributions to world hydrography. Greenland will serve alongside continuing
Director John Nyberg.
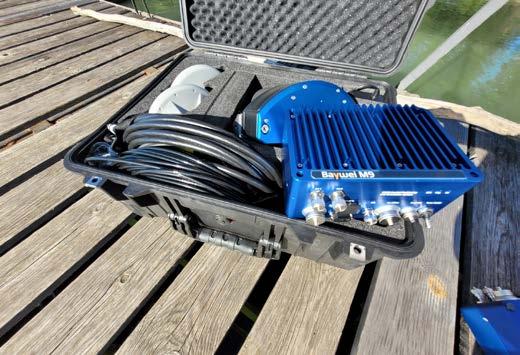
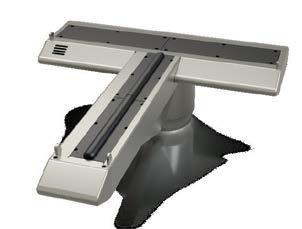
BayweiSonar expands options for its M9 multibeam sonar
BayweiSonar has announced a significant upgrade to its flagship M9 integrated multibeam sonar system. With immediate effect, the M9 is available with three new factory options: electronic beam tilt, water column data collection, and snippets collection. All Baywei systems share a common technical foundation, featuring 512 fixed beams, a depth measuring range of 0.2-200m, a range resolution of 10mm and a pressure rating of 60m. The sonar technology is sourced from a leading Norwegian supplier. The company’s integrated systems – the M1, M7 and M9 – utilize a Trimble/Applanix AP+ 18 GNSS/IMU. The M9 is BayweiSonar’s top-of-range system, offering 1.0 × 1.0 degrees of angular resolution. The base configuration collects bathymetry and sidescan data in s7k files.
The M9 multibeam echosounder system is the top-of-range offering from BayweiSonar. (Image courtesy: BayweiSonar)
VO:X Barentsz has completed its first multi-day offshore deployment. (Image courtesy: Van Oord)
Rear Admiral Luigi Sinapi.
Norwegian Mapping Authority expands digital navigation portfolio with S-104 and S-111
Two newly launched products – Water Level Information (S-104) and Surface Currents (S-111) – mark a significant step forward in Norway’s digital maritime navigation offering. For the first time, mariners and developers can access standardized, real-time forecasts of water levels and currents as data products ready to integrate directly with electronic charts. Built for next-generation Electronic Chart Display and Information Systems (ECDIS), both products give software developers immediate access to standardized, up-to-date data. The ultimate beneficiaries are mariners, who gain more accurate and reliable information for safer, more efficient voyages. “By providing forecasts of water levels and currents as products that can be combined with charts, the maritime sector gains a stronger basis for decision-making. Mariners can better understand the conditions they will encounter when planning a voyage – for example when passing through a strait or entering a port,” says Gudmund Jønsson, director of the Norwegian Mapping Authority (Kartverket), Hydrographic Service. Both products are part of the S-100 framework – a suite of international standards developed by the International Hydrographic Organization (IHO) to enable seamless data sharing across systems and drive the digitalization of maritime information.
Bathymetric surface data (S-102) is already available for several Norwegian coastal areas, including Risavika in Rogaland county. (Image courtesy: Kartverket)
UK and Portugal join forces to advance deep-sea research in the North Atlantic
The National Oceanography Centre (NOC) has agreed a landmark partnership with Portugal’s Regional Agency for the Development of Research, Technology and Innovation (ARDITI). The deal combines a €4.3 million transfer of advanced marine robotics with a long-term scientific collaboration in the North Atlantic. Under the agreement, ARDITI has acquired two autosub long-range (ALR) autonomous underwater vehicles, designed and developed by the NOC in the UK. The deal, supported by the British Embassy in Lisbon, marks the first time that NOC has transferred ALR technology to a public research agency rather than through a commercial contract, establishing a new model for international partnerships and exports of UK marine technology. The two vehicles are rated for very different operating environments. The first, certified to depths of 1,500 metres, is set to support oceanographic and biogeochemical research. The second, rated to 6,000 metres, is intended for deep-sea mapping. Both are equipped with modular sensor systems, allowing them to collect data throughout the water column and across the seabed. They also run on an open-source operating system compatible with existing marine platforms. This enables rapid integration into ARDITI’s existing research infrastructure, which includes uncrewed surface vessels and conventional research ships.
Both partners benefit from shared missions and data exchange, with implications for regional governance and global deep-sea research.
Record-breaking five million square kilometres of seabed mapped last year
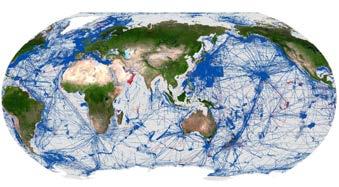
The Nippon Foundation-GEBCO Seabed 2030 Project has announced that 28.7% of the world’s ocean floor has now been charted, with nearly five million square kilometres of new data added in the past year, setting a new record for the project. While this is certainly strong progress, with nearly three quarters of the global seabed still uncharted and the year 2030 approaching rapidly, the pace will need to accelerate. The progress announcement was made at the IHO Assembly in Monaco, where delegations from 104 nations convened to assess global hydrographic progress and set priorities. The gathering reflects growing institutional recognition that ocean mapping is no longer a niche scientific endeavour; it is critical infrastructure. Monaco is an apt setting. It was Prince Albert I who in 1903 first championed a coordinated global effort to chart the seafloor, laying the foundation for what became GEBCO. More than a century later, the map is filling in, but the work – and the opportunity – remains vast. Ocean mapping has long been the preserve of a handful of wealthy maritime nations. That is changing. Over the past year, 15 new organizations joined the effort to chart the world’s seabed, with first-time contributions from Malaysia, Morocco, Papua New Guinea and Saudi Arabia, among others.
Red indicates bathymetric data added in the past year; blue shows previously mapped seafloor. (Image courtesy: Seabed 2030)
Headlines
Singapore hydrographer receives highest international honour in the
field
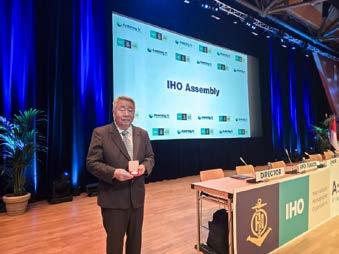
Dr Parry Oei, senior adviser for hydrography at the Maritime and Port Authority of Singapore (MPA) and former chief hydrographer of Singapore, has been awarded the Prince Albert I Medal for Hydrography by the International Hydrographic Organization (IHO). This is regarded as one of the most prestigious recognitions in the field. Conferred at this year’s IHO Assembly, the medal is awarded to individuals whose work has made a lasting impact on international hydrographic standards, practices and cooperation. It recognizes exceptional contributions to the safety and efficiency of global maritime navigation. Dr Oei’s career in hydrography spans nearly four decades. Among his early contributions was advancing the use of satellite positioning and real-time current measurement in hydrographic surveys, work that has significantly improved the accuracy and the reliability of marine data. He also played a key role in international efforts at the International Maritime Organization to strengthen navigational safety, including supporting adoption of electronic chart display systems on commercial vessels. His influence extends well beyond technology. Dr Oei has been an unswerving advocate for international cooperation in hydrography, chairing key regional and global bodies under the IHO and contributing to coordinated survey and charting efforts in some of the world’s busiest waterways, including the Straits of Malacca and Singapore.
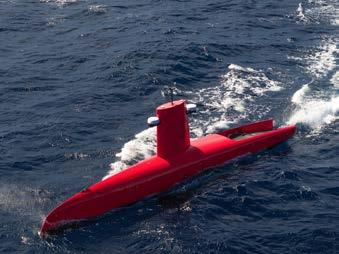
OMS Group is adding a second Exail DriX O-16 to its autonomous survey fleet. (Image courtesy: Exail)
OMS Group acquires second Exail DriX O-16 to scale subsea cable survey operations
As global demand for subsea cable infrastructure continues to grow, OMS Group is expanding its autonomous survey fleet to meet the increasing requirements of large-scale seabed projects worldwide. In this context, the company has announced the acquisition of a second Exail DriX O-16 uncrewed surface vessel (USV). The move follows the purchase of a first DriX O-16 last year, set to launch as USV Elite in mid-2026, and brings OMS Group’s uncrewed surface capability to a new operational scale. Operating in tandem, the two vessels will conduct seabed surveys, route verification and infrastructure monitoring in support of critical telecommunications cable projects across the globe. At the heart of this expansion is a platform purposebuilt for the demands of modern subsea survey. The DriX O-16 offers up to 30 days of operational endurance and a range of approximately 3,500 nautical miles, enabling long-duration missions with minimal dependence on crewed support vessels. Equipped with advanced sensors including the Kongsberg EM124 multibeam echosounder, it delivers the highresolution seabed mapping precision that large-scale subsea infrastructure projects require.
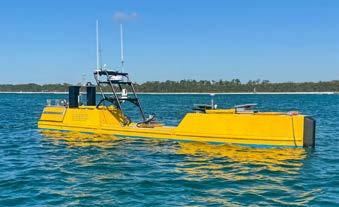
Woolpert and Chance Maritime pioneer fully uncrewed offshore hydrographic survey off Florida’s Gulf Coast
To carry out the mission, Woolpert partnered with Chance Maritime, deploying its new highpower, extreme long-endurance 12m uncrewed survey vessel, the Chance MC40. (Image courtesy: Chance Maritime/Woolpert)
Woolpert is conducting the first fully uncrewed offshore hydrographic survey mission on behalf of the National Oceanic and Atmospheric Administration (NOAA). Operating off the coast of Pensacola, Florida, multiple uncrewed survey vessels designed and piloted by Chance Maritime and equipped with Woolpert’s multibeam sonar are mapping deep-sea corals and ocean habitats across 1,391 square nautical miles. The high-resolution data collected will be used to explore deep-sea corals and sensitive marine habitats, identify seafloor hazards, detect changes to the underwater environment and update NOAA’s nautical charting products to enhance maritime safety. According to Chris Taylor, PhD, ecologist with NOAA’s National Centers for Coastal Ocean Science, the project will fill gaps in modern seafloor mapping data in the Gulf region: “New maps of seafloor bathymetry and texture will be used by NOAA and our partners to develop new habitat maps and characterizations supporting the restoration of mesophotic and deep benthic communities in the region that were damaged during the Deepwater Horizon oil spill.” Two uncrewed survey vessels form the backbone of the operation. Chance Maritime’s Chance MC40, a highpower, extreme long-endurance 12m vessel, leads the mission, supported by the Chance MC29 to boost efficiency and accelerate data collection. Together, they enable continuous remote hydrographic survey operations with no crew on board.
Dr Parry Oei pictured with the Prince Albert I Medal at the IHO Assembly, Monaco. (Image courtesy: Maritime and Port Authority of Singapore)
Hydro International interviews Marco Filippone (Fugro) and Knut Hartmann (EOMAP)
From specialized science to strategic global force
By Wim van Wegen, Hydro International
Perhaps surprisingly, the COVID-19 pandemic could be seen as the trigger for Fugro’s recent acquisition of EOMAP. To continue its major subsea telecom fibre-optic cable survey across the African continent, Fugro turned to Earth observation data to address the land and marine interface – and on the back of the success of that integration, the merger became a natural step. In this exclusive interview, Marco Filippone, global director hydrography & ocean science at Fugro, and Knut Hartmann, who leads the EOMAP team, discuss the convergence of hydrography and satellite technology, and how their new-found synergy is supporting expansion into new markets. They also reflect on the role of artificial intelligence, and the future of ocean data.
Marco Filippone did not plan to become a hydrographer. Having been “born by the sea”, as he puts it, and growing up in the ci ty of Genova, he set his sights on becoming a helicopter pilot for the Italian navy and joined the Naval Academy in 2002. But five year s later, life redirected him towards hydrography, a pivot that would shape a remarkable career. “I had a stint as an officer on navy vessels around the world, mostly in the Middle East and Africa –including during the outbreak of piracy in East Africa, as well as on a peacekeeping mission – before starting my career within the Hydrographic Office,” Filippone recalls. There, he worked aboard Italian naval hydrographic vessels, including two catamarans Aretusa and Galatea and the oceangoing Ammiraglio Magnaghi This helped him develop fluency across satellite, acoustics, underwater technology and even aerial drones.
What the navy instilled above all, he says, was an ability to think across disciplines rather than inside them. “Defence and hydrographic offices drive innovation in the industry. We really pushed the envelope, integrating technologies at a time when it was not at all straightforward.” Just as he felt the pull towards working on a larger, more global scale, Fugro was undertaking what was then the biggest-ever shallow-water survey in the Red Sea – and the company needed exactly his skill set.
In parallel with his navy career and his early years at Fugro, Filippone completed a PhD in System Engineering based on acoustics. This helped him further develop his hydrographic contribution across the wider Fugro portfolio. He went on to work with colleagues in the Americas on mapping the entire Gulf of Mexico – a project that, in his view, illustrates just how much hydrography can achieve. For Filippone, that kind of scope is precisely what keeps the work compelling: “Participating in mapping the entire Saudi Arabian side of the Red Sea, totalling
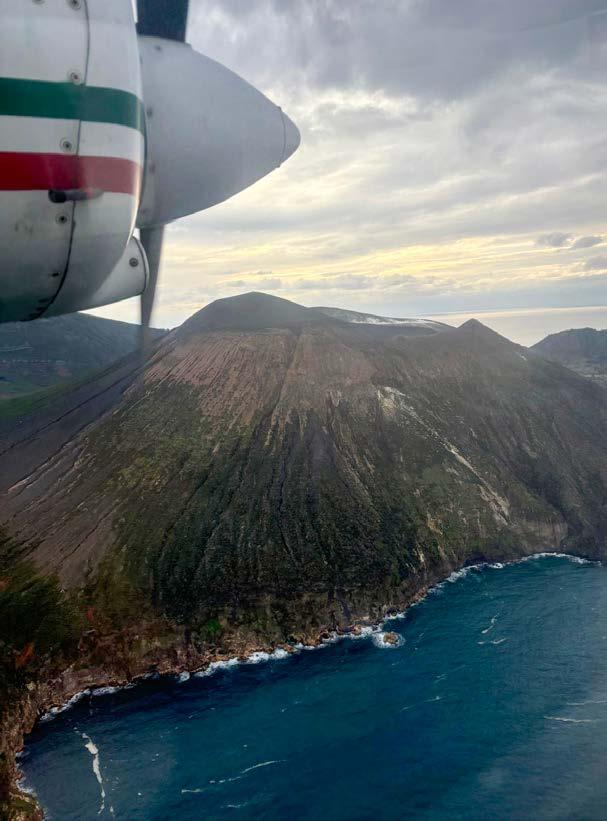
Airborne Lidar capturing the Aeolian Islands as part of the MER project.
over 100km 2, as well as the Gulf – these are the things that make me proud to be part of Fugro, and to be a hydrographer in the first place.”
Fugro’s acquisition of EOMAP Fugro describes itself as a geodata specialist, with hydrography as a core capability. Filippone sees that positioning as both accurate and strategically significant, particularly given today’s landscape. The current geopolitical situation and the threat posed to linear infrastructure are, in his view, driving a new demand for hydrographic expertise going well beyond traditional chart production. “Hydrography really is the go-to place to solve those problems, and we support those efforts,” he states. “We know what is the best technology, and how to create a mesh and the connection to make data available in real time – from satellites, from underwater and also from fast-moving Lidar assets.”
Against this backdrop, it was a logical step for Fugro to acquire EOMAP, a specialist in satellite-derived bathymetry and Earth observation data. For Knut Hartmann, who leads the EOMAP team and joined Fugro through the acquisition, the strategic fit is clear. “What we bring to hydrography is the skill of mapping huge areas remotely by using satellite data,” Hartmann explains. “Besides de-risking shallow-water operations and improving the efficiency of surveys, we can also support clients that typically cannot afford all types of survey programmes. This fills a genuine gap in the market.”
Filippone gives a vivid example of how Earth observation had already proved its value before the formal merger took place. When the COVID-19 pandemic started, Fugro was engaged in the largest subsea cable survey across the entire continent of Africa. As ports were forced to close and land deployment became impossible,
Earth observation data was integrated into operations out of sheer necessity. “That necessity stimulated the uptake of new technology and customers’ desire to adopt it. That really helped Earth observation to become fully integrated, and on the back of that success it became a natural thing for us to merge.” Meanwhile, Fugro’s involvement in Italy’s Marine Ecosystem Restoration (MER) project – led by the Italian Institute for Environmental Protection and Research (ISPRA) and supported by NextGenerationEU funding (see box) –combined conventional hydrographic methods with Earth observation to deliver an environmental assessment of the entire Italian coastline. For Filippone, this stands as another example of what a combined offering makes possible, and a template for the kind of work both companies see ahead. “The ISPRA project fantastically showcased how hydrographic expertise can expand beyond traditional navigation safety to provide a high standard of knowhow and create genuine value for the wider community,” he says.
Now roughly a year into the EOMAP integration, Hartmann sees a positive
NextGenerationEU investment projects
The activities are carried out within the framework of the NextGenerationEU investment projects – Mission 2: ‘Green Revolution and Ecological Transition’, Component 4: ‘Protection of Land and Water Resources’, Measure 3: ‘Safeguard air quality and biodiversity through the protection of green areas, soil, and marine areas’. Investment 3.5 has been planned: ’Restoration and Protection of Seabeds and Marine Habitats’.
trajectory. He describes the acquisition and merger process as having been “very proactive and very motivating”. Growth has continued through Fugro’s global network, and their new-found synergy is opening doors into markets neither company could reach alone. “We see more opportunity than ever before in the topics that matter today – related not only to nature and climate, but also maritime surveillance and security.” Water management is another area both men identify as a particular growth opportunity, with the combination of conventional survey capability and satellite-derived data allowing the company to reach new clients and engage with an expanding market.
Investing in the ecosystem with USVs
As part of its commitment to remote and autonomous operations, Fugro has invested heavily in uncrewed surface vessels (USVs). Filippone has been involved from the start of that journey, ever since the company built its first USV with a partner yard in 2019. He describes the subsequent years as a valuable learning curve, shared with customers. “Building a boat is actually just half the story,” he comments. “You need to invest in the ecosystem. You can only really support the uptake of USVs with a fully functional ecosystem.” He emphasizes that Fugro is agnostic, and the ambition is not to replace conventional crewed operations. Instead, USVs are meant to support emission reduction and make operations more efficient, acting as
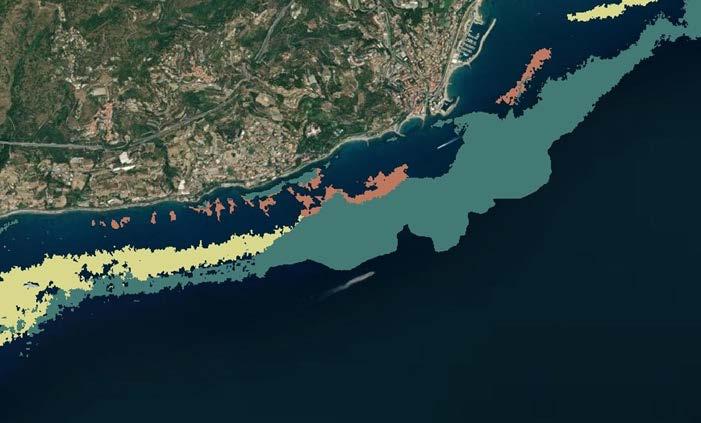
EOMAP’s high-resolution, satellite-derived bathymetry for the MER project.
what he calls a “force multiplier” in the hydrographic industry.
Fugro’s 2024 launch of a USV-only bathymetric survey in partnership with the Norwegian Hydrographic Service – a relationship that dates back to 2006 –illustrates just how far the company has come in its journey. It was the first project of its kind for Fugro, conducted in a demanding environment. “We still need to prove ourselves,” Filippone acknowledges. “But this is only the beginning. We are increasing the size of our USV capability, making it multi-purpose, and that is consistent with our purpose and with the technology uptake.”
The role of Lidar
In recent years, the annual Hydro International industry survey has consistently shown that industry professionals are broadly optimistic about artificial intelligence, with the caveat that automation does not replace expertise. Filippone is in full agreement with this sentiment, mentioning airborne bathymetric
Lidar as a topical example: “This form of Lidar is by definition a very niche and challenging technology that really raises the bar of hydrographic expertise. If you realize that one hour of Lidar collection may translate into 40 hours of processing, this is where machine learning, AI and everything in between play a major role.” Without that processing power, the technology would not be viable at scale, he says.
What is key, according to Filippone, is that the hydrographic review itself remains unchanged. Fugro participates in training the models to support quality assurance against hydrographic standards, monitors operations as they happen, and then deploys certified hydrographers for the final review. “They focus on the product rather than the means, from acquisition to end product. That is how we use hydrographic certification and knowhow where it adds most value.” This model, he argues, is how Lidar can become a genuine solution for large-scale nearshore coastal mapping. This opens up exciting new possibilities in mapping areas
of interest in a way that would simply be unworkable without machine learning to help meet the timelines.
Data as a public good
On the topic of the status of ocean data, Fugro has taken a somewhat controversial stance in recent years. Filippone attracted attention when he co-authored a paper, tied to the United Nations Ocean Decade, arguing publicly in favour of data sharing –particularly centred around bathymetric data from the open ocean. “We need to empower and support data sharing for public knowledge,” he says. “When it comes to bathymetry in the open ocean, we are happy to share the data, because wider use of it can provide a lot of value. The line for us is mostly that we view data below the surface as commercially valuable, whereas deep-water bathymetry is something we are really fostering to make available. Collecting the data is half the story.”
Fugro’s CEO and a number of ambassadors, including Filippone himself, have a seat at
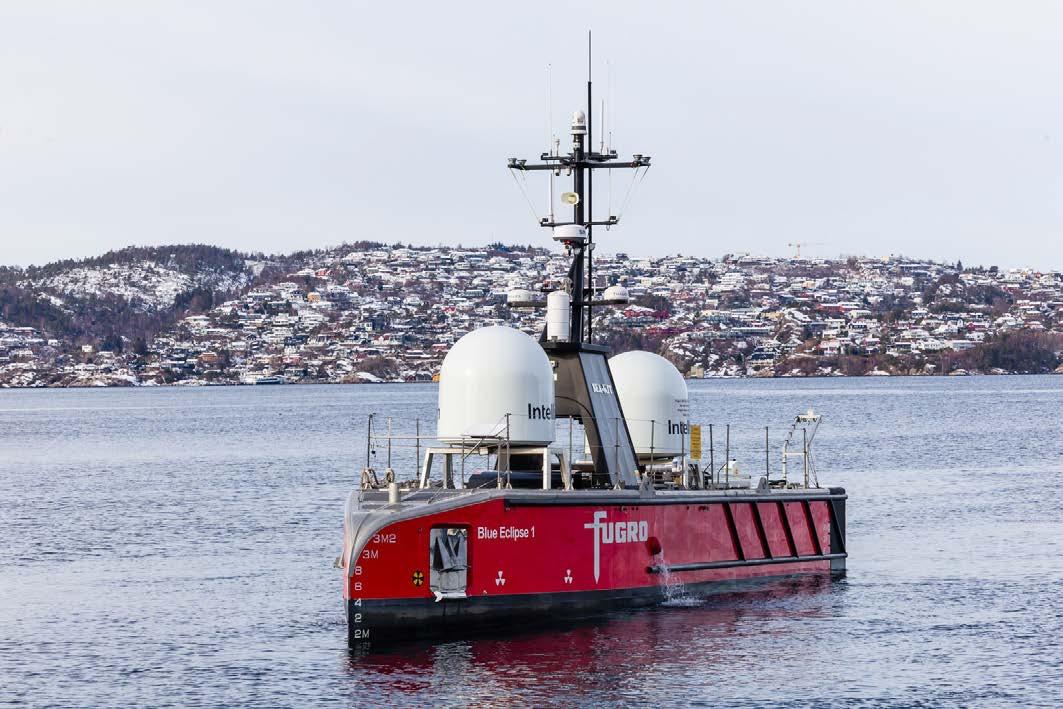
Fugro’s Blue Eclipse USV gathering data for the Norwegian Hydrographic Service in support of the MAREANO seabed mapping programme.
the UNESCO table as part of the Seabed 2030 initiative to completely map the floor of the world’s oceans. With only around 28% of the seabed currently mapped, Filippone has a clear view on what full coverage requires. “You need around 50 vessels, the right echosounders, and every year you delay, you increase the number of vessels needed by around 10%. Technology uptake will help, but only a private, public and philanthropic coalition will make the budget available to do this at scale,” he states. As for the 2030 deadline, he remains cautiously optimistic: “It is still within reach, but the funds need to be mobilized almost immediately.” The company’s own contribution to Seabed 2030 now amounts to three million square kilometres of ocean data – roughly equivalent to an area the size of India. That total comes both from data Fugro collects directly and from data gathered on behalf of clients who have been shown the value in making it publicly available.
The talent challenge
Perhaps the most pressing issue facing the hydrographic sector for the foreseeable future is the shortage of skilled professionals. Education providers, often universities, are losing their accreditations to deliver specialized hydrographic certifications, and the pipeline of new talent is narrowing. Filippone is candid about the scale of the problem. “I am always proud to work for Fugro because the company has probably more certified hydrographers than a bigger-sized hydrographic office. And yet we still feel the scarcity of talent with the right expertise.” Internally, Fugro runs its own academy delivering Category B classes and has recently partnered with a prominent university in the AsiaPacific region to support Category A courses. Through broader initiatives with institutions, professional societies and private individuals, the company is also working to create regional accreditation and build awareness of what he describes as a genuinely exciting field. Filippone predicts that technology may also help to change the perception problem.
“The concerns young people may have had when it comes to going to sea for several days or a month are now being overcome by what can be done from a remote operations centre. When that is
About Marco Filippone and Knut Hartmann
Marco Filippone is director ocean science and hydrography at Fugro. He brings a multidisciplinary background to the role, with a PhD, an EMBA and advanced qualifications in system engineering, marine geomatics (IHO/FIG/ICA Cat A) and maritime science. With over 23 years of experience, including 13 in the Italian Navy and ten at Fugro, he has served as chief hydrographer and regional ambassador for Seabed 2030. Filippone contributes to the IHO and UNESCO IOC and sits on the Hydrographic Professional Accreditation Scheme Steering Committee. He is also Fugro’s chief hydrographer and operations manager.
Knut Hartmann is Earth observation manager for EOMAP, a Fugro company, leading its operations and business activities. Since joining in 2011, he has brought a wealth of experience from his previous roles as a scientist in research and at an engineering firm. Recognized with academic awards for excellence, Hartmann has served as an expert advisor on Earth observation in an ITLOS case. He currently chairs the IHO Earth Observation Project Team and is an active member of hydrographic societies. Additionally, he contributes to international capacity-building initiatives, promoting the use of aquatic Earth observation and geospatial solutions globally.
fully implemented and clear, I believe more talents will be attracted to the hydrographic industry.”
Hartmann agrees that the technology is fascinating, and could even help to attract people who – like him – don’t have an educational background in hydrography. “You have big boats, robots underwater and on the water surface, satellites, airborne systems... Everything is in there, and then you add AI and remote operations on top. I mean, how cool is that?” he says. Despite such enthusiasm, Filippone urges the sector to communicate its value more effectively: “We should be focusing on the value we create in making our skills available for the community, rather than
just the technologies or the science. We implement the technology in a meaningful way. I think that is what we need to explain better.”
S-100: the nexus for hydrography
Beyond the operational and commercial shifts reshaping the sector, the move to S-100 – the next-generation data framework from the International Hydrographic Organization (IHO) – is also causing a significant transition in terms of standards. “Moving from nautical charts towards S-57 was already a paradigm shift. S-100 is really going to be the nexus,” comments Filippone. The new framework takes hydrography beyond bathymetry to become a major contributor to a digital twin of all marine activities. He describes
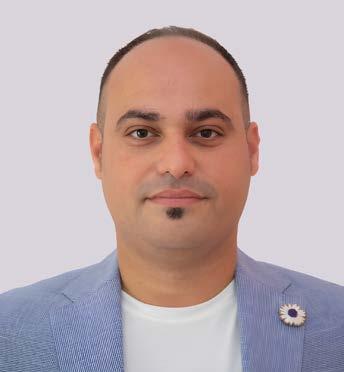
Marco Filippone.
Knut Hartmann.
the different data products that can sit within the framework as “essentially unlimited”. Different users, from port operators to defence agencies to environmental managers, can all benefit from the same underlying architecture.
The vessel ecosystem will change too. This implementation will shape all the technology on board, and also the way people approach activities at sea, according to Filippone. He recognizes the significant groundwork done by charting and software companies in supporting the IHO’s ambitions, and says Fugro is actively contributing data that can be standardized within the new framework.
Satellite-derived bathymetry
When it comes to satellite-derived bathymetry, recent editions of Hydro International ’s annual industry survey reveal an interesting gap: professionals across the hydrographic sector express significant interest in it, yet the knowledge of what the technology can actually
deliver still lags behind their enthusiasm. Hartmann finds this both telling and familiar. “It is always this way with new technology, which also comes with different specifications,” he observes. “It’s about dissemination of the knowledge, and describing the pros and cons, just as it is with Lidar or acoustics.” EOMAP and Fugro work closely with the IHO and contribute to guidance, working groups and regional hydrographic committees, in part to help the sector develop a clearer and more grounded understanding of the technology, he says.
In particular, satellite-derived bathymetry has a uniquely strong positioning for applications where frequency of observation matters as much as its precision, according to Hartmann. “This is because it allows for continuous monitoring, which is not actually affordable by any other technology,” he states. Therefore, it is a natural fit not just for safety of navigation surveys, but also for coastal monitoring and coastal
protection. Filippone adds a forwardlooking note on where the technology is heading: “Physics is physics, but the payload within the satellite keeps improving, so I trust this will push the boundaries. The EOMAP acquisition and Fugro’s global reach will foster the wider adoption of Earth observation data. On its own, that may not be enough to solve the entire problem, but paired with the integrated solution that Fugro can offer, it can really help.”
These insights from Marco Filippone and Knut Hartmann point towards a sector that is in motion: technically more capable than at any point in its history, commercially expanding into new markets, and increasingly called upon to address questions of environmental stewardship, infrastructure security and global data equity. Once a specialized branch of marine science, Earth observation is slowly but surely becoming something much larger.
Pioneering a new paradigm for ocean observation
Reimagining data collection to safeguard the seas
By Damon Stanwell-Smith and Richard Bates, Viking Expeditions
By the end of this year, the two expedition vessels in Viking’s science-at-sea programme will have accumulated over 2,800 days of continuous scientific activity. This article outlines how Viking has reimagined the pioneering spirit of over a century ago to generate evidence aimed at improving the understanding of – and ultimately safeguarding – the world’s oceanographic environments.
In 1872, HMS Challenger embarked on the first true global oceanographic expedition, transforming human understanding of the seas. Spanning three and a half years and covering more than 70,000 nautical miles, she mapped the deep ocean and laid the foundation for modern oceanography. More than a century later, Viking has reimagined that pioneering spirit for the 21st century.
Launched in 2020, Viking’s Polar Class 6 expedition vessels – Viking Octantis and Viking Polaris – combine advanced exploration capability with a permanent, at-sea scientific programme. Designed for polar operations yet slender enough to transit the Great Lakes, each vessel serves as a mobile research platform equipped for multidisciplinary environmental observation. By their first major refit in late 2026, the ships will have accumulated over 2,800 days of continuous scientific activity – surpassing the operational duration of Challenger’s legendary voyage.
Sustained observing
The Viking Science Program has a single, uncompromising aim: to gather the evidence needed to understand, and ultimately safeguard, the environments it traverses. As the vessels move from Antarctic to Arctic waters, they operate as continuously moving observatories, logging how natural systems function and how human pressures are reshaping them. Established and regularly repeated itineraries and near-continuous operations provide the systematic, highfrequency sampling needed to track spatial and temporal change, with year-on-year returns to the same remote sites building an increasingly powerful time series. In doing
so, they deliver a style of sustained observing that stands in contrast to many national programmes, which are still largely built around short, one-off research itineraries.
Global scientific collaboration
Each vessel, measuring just over 205 metres in length with a 23.5m beam, hosts both wet and dry laboratories fitted with a range of specialized equipment to support diverse research operations. A permanent team of Viking scientists operates alongside partner institutions including UC San Diego’s Scripps Institution of Oceanography, the Scott Polar Research Institute at the University of
Cambridge, the University of St Andrews, the University of Western Australia, Cornell University, NOAA and the Norwegian Institute of Water Research (NIVA). The ships carry 378 passengers with a crew of 261.
Off-ship operations are conducted using 17 Mk5 Zodiacs, two 9m rigid-hull jet boats and a 7m dive-support boat. These deploy a range of instruments – including conductivity, temperature and depth (CTD) arrays, remotely operated vehicles (ROVs) and baited remote underwater video systems (BRUVS) – for taking water samples and conducting plankton tows. Sonar capacity includes both
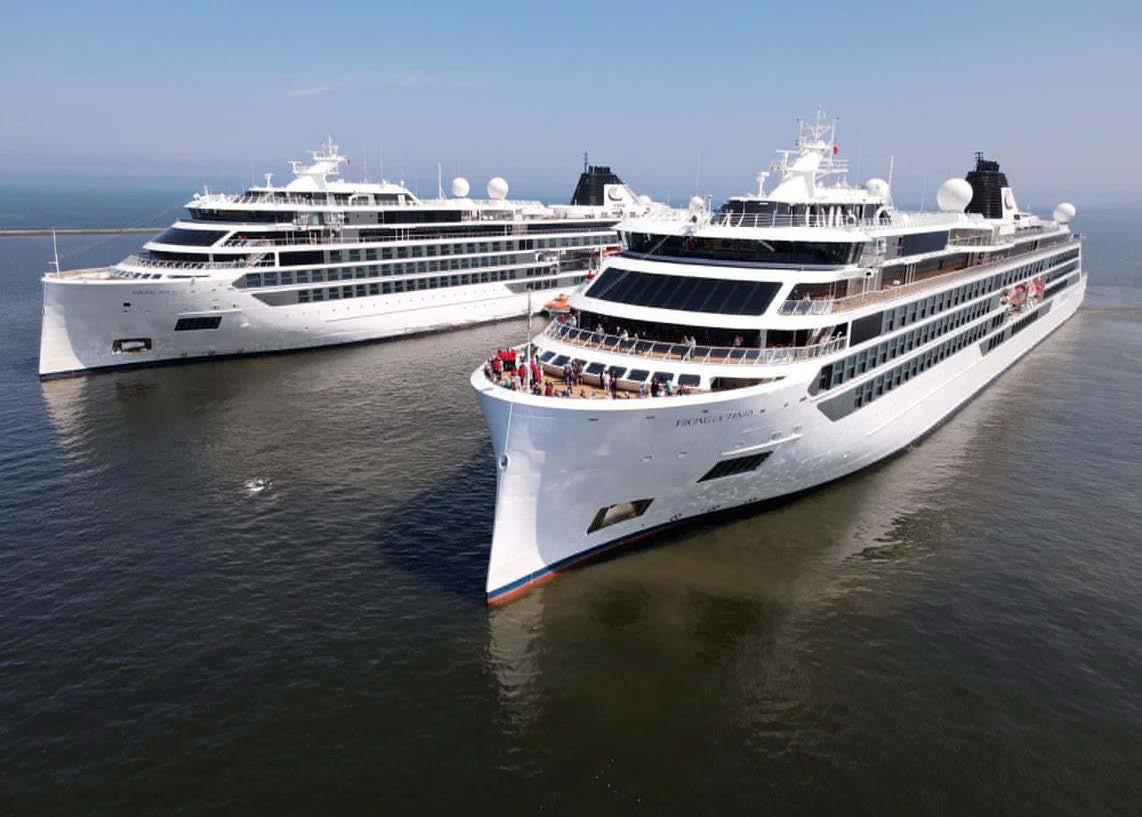
The expedition vessels Viking Octantis and Viking Polaris. (Image courtesy: Jack Buckingham)
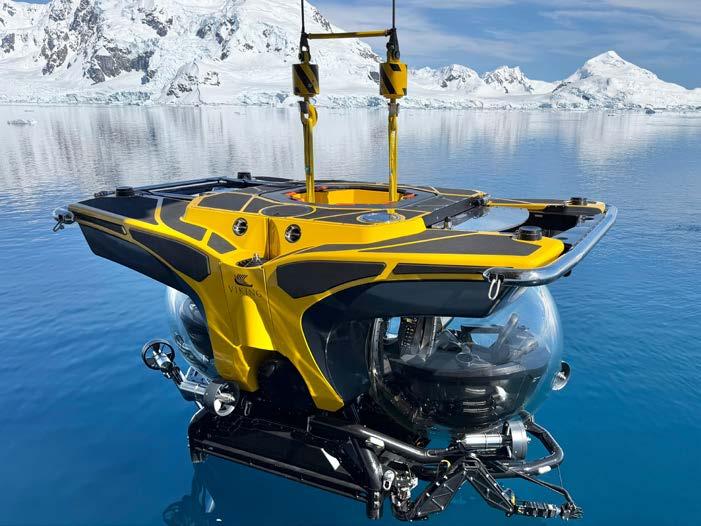
multibeam (Kongsberg 2040 and WASSP) and sub-bottom systems (INNOMAR) for hydrological mapping and to collect data on benthic habitats, geological features and submerged archaeology. Both ships also support a pair of U-Boat Worx Cruise Sub 7-300 Mk II submersibles for both scientific observations and guest experiences. The submarines operate to 300m depth and are fitted with CTD, platforms for water sampling, very high-resolution image capture and manipulator arms for sampling.
Scientific themes
The Viking Science Program integrates research across five principal themes: atmosphere, oceanography, geoscience, biology, and culture. To ensure wide scientific access, all collected data is shared freely both with partners and with global open-access databases such as EMODnet.
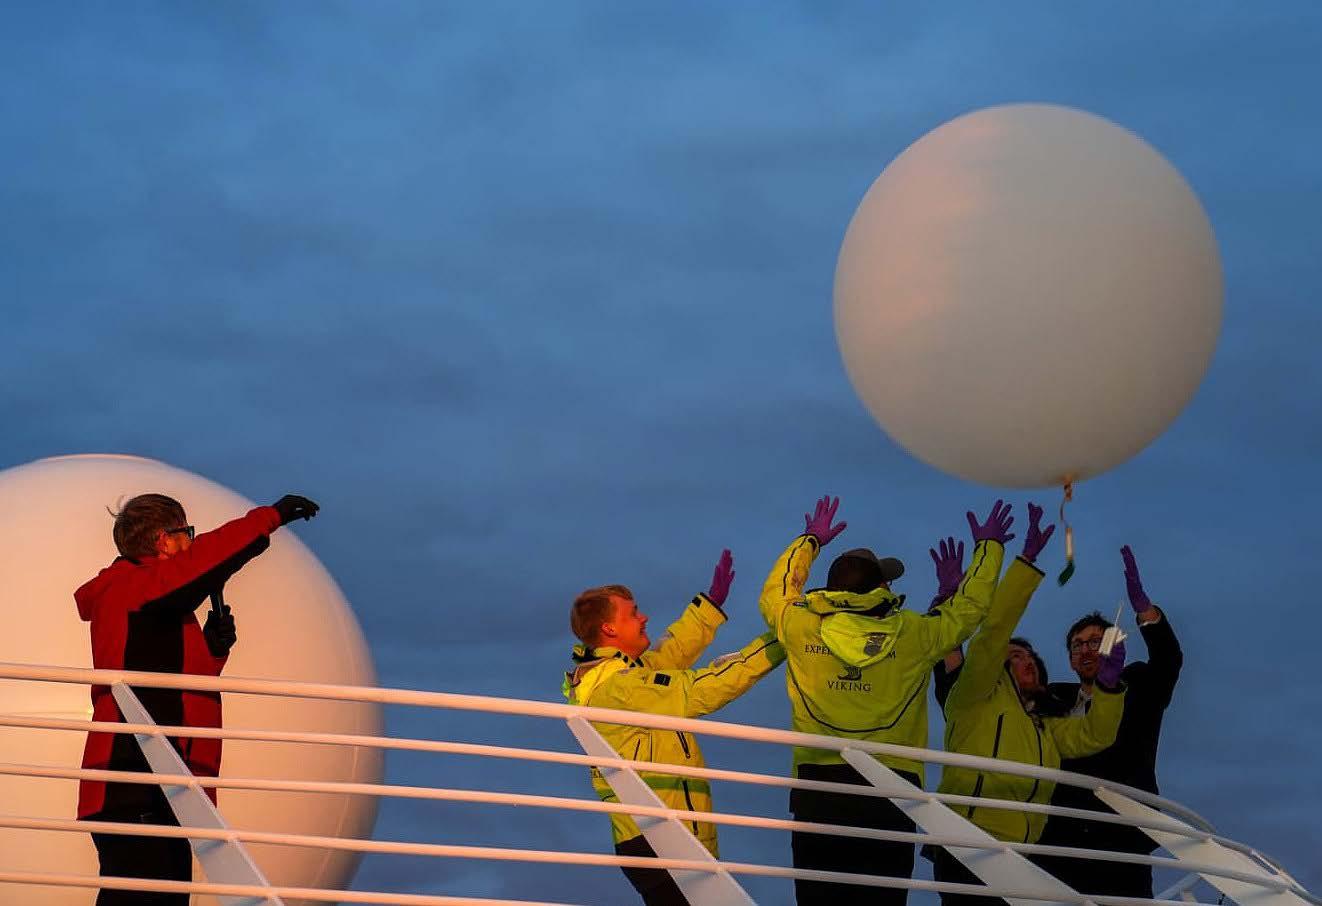
The Atmosphere programme is marked by a weekly launch of atmospheric weather balloons as part of the global programme for short-term weather predictions and long-term climate modelling. This data is shared with partners at NOAA and the Canadian Metrological Office, but also forms an important global input to the World Meteorological Organization’s data gathering. Complementary to weather balloon launches, Viking guests regularly collect cloud observations to contribute to a NASA citizen science initiative: the Global Learning and Observations to Benefit the Environment (GLOBE) programme. Observations are logged using an app-based tool to supply the ground-truth information on cloud conditions to complement and calibrate satellite-derived data. These observations are particularly important in the snow-covered areas, notably in polar regions where Viking spends over six months a year.
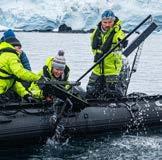
Guest participation in plankton sampling in the Antarctic. (Image courtesy: Jack Buckingham)
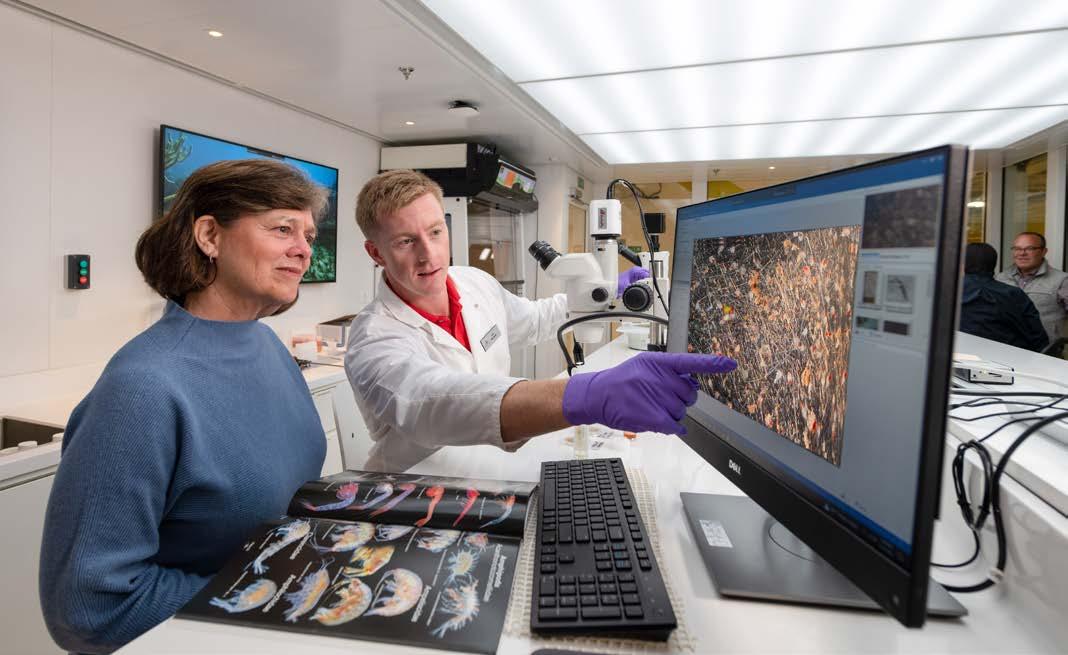
Guests in an onboard science laboratory. (Image courtesy: Viking)
Both ships are fitted with a Ferrybox system that continuously samples the water through which the ships move. This monitoring is part of a programme run in conjunction with partners at the Norwegian Institute for Water Research. The Ferrybox records sea temperature, conductivity (salinity), oxygen concentration and saturation, chlorophyll-a, phycoerythrin and phycocyanin fluorescence (proxies for phytoplankton biomass), CDOM fluorescence and turbidity (linked to suspended particulate matter such as sediment, detritus and plankton) and oil mist (a pollution proxy).
Filtered water samples are also used for the study of microplastics. In the North American Great Lakes, where the ships spend May to September each year, all this data is initially analysed onboard in the wet lab using a Fourier Transform Infra-Red (FTIR) spectrometer system. However, further detailed analysis onshore is conducted by partners at Dalhousie University.
Ecosystem monitoring
A core element of Viking science is aimed at
ecosystem monitoring. This typically involves the use of multiple scientific techniques including BRUVS and high-definition video using ROVs to assess different aspects
of marine and freshwater habitats. In the Antarctic, many of the locations that the ships visit have had a paucity of ecosystem evaluations and so, together with partners at
Launching a weather balloon. (Image courtesy: Martin Halvorsen)
U-Boat Worx Cruise Sub 7-300 Mk II submersibles. (Image courtesy: Antony Gilbert)
British Antarctic Survey Global Ocean Wildlife Analysis Network and the University of Western Australia Marine Futures Lab, baselines are being established for future monitoring. With over 4,000 submarine dives now completed (to depths inaccessible for SCUBA divers) in waters that have seen negligible previous operations, the team and guests have been able to make regular observations on unusual species in rarely observed marine habitats. During Viking’s first Antarctic season, for example, recordings were made of the elusive Giant Phantom Jellyfish (Stygiomedusa gigantea) and hitherto unrecorded behaviour of icefish in their nursery breeding habitats. Meanwhile, in the Great Lakes, projects using the BRUVS, ROV images and multibeam survey are also evaluating fish behaviour in relation to the effectiveness of constructed reefs as ecosystem restoration nodes. The optimal recovery conditions of the white fish stock are being assessed through long-term monitoring and comparison of the artificial reefs with natural ones.
In 2024, in collaboration with partners at Scripps Institution of Oceanography and the J. Craig Venter Institute, an onboard PCR laboratory was repurposed after COVID-19 testing and fitted with an Oxford Nanopore DNA sequencer in order to perform real-time environmental DNA sequencing at sea. This facility, the first on any global ocean cruise vessel, allows for samples to be analysed onboard rather than transporting them to shoreside facilities. Samples are collected using towed nets deployed from zodiacs to assess how the base of the food web is changing in response to shifts in oceanic temperature and salinity. The project follows on from a collaboration with Fjord Phyto, a NASA-funded programme which enabled guests to participate in research and public education through sampling of polar phytoplankton for genetic population analysis.
Small-area, high-resolution surveys
For the geoscience programme, Viking is focusing deployment on high-resolution surveys with repeat monitoring aimed at understanding seafloor detail to reveal areas of change, such as in
regions where iceberg scour is an issue, for example. In the Antarctic, where climate change is having some of the most profound impacts globally, marine benthic habitats are being rapidly affected by the changes in both continental ice calving and sea-ice extent. Sites are repeatedly visited each season, and recordings of the changes have sometimes even been made on a weekly basis.
In the Great Lakes, sub-bottom sonar systems are being used within the geoscience and culture programme to map drowned palaeolandscapes. These were last seen as land over 7,000 years ago when the first hunter-gatherers migrated across the region following the end of the last ice age. There, and in the Arctic, offshore mapping is being combined with shoreline maps made using multispectral drones. These results allow for an evaluation of key archaeological sites and an assessment of the impact of climate change, e.g. increased coastal erosion. Recording the archaeology before it is lost forever is a major goal of the programme, and is of great concern not only to local communities but also among Viking guests.
Submarines prove their value
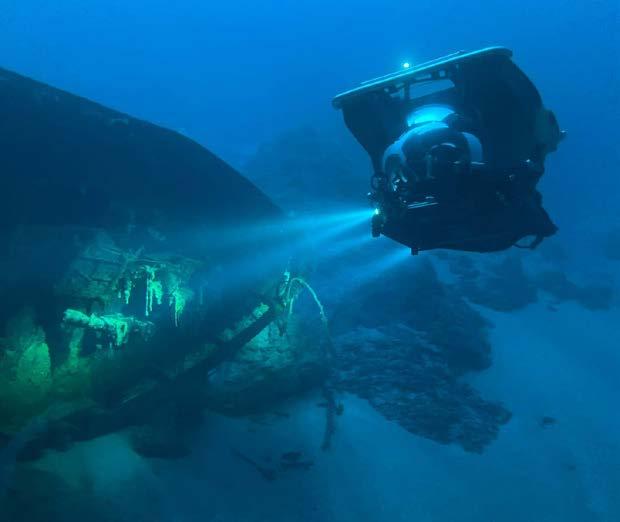
With all the marine-based programmes, the submarines are proving valuable in providing seafloor ground-truth observations at depths down to 300m. For many wreck sites in the Great Lakes, this allows Viking and its partners in NOAA to monitor the archaeological sites and their unfortunate demise over time as wood-boring fauna takes its toll. Using the high density of photographic images taken during each dive, 3D modelling is routinely undertaken of the wrecks. The submarines are important tools for this monitoring as the visual recording is backed up by physical water data from the fitted CTDs.
Citizen science
Citizen science is a key component of the guest outreach programme. By participating in the science, and through dedicated science workshops, guests gain hands-on experience in scientific research that fosters lifelong skills. Besides the cloud observations for the NASA initiative, the programme includes a daily wildlife watch for birds and sea mammals, with the results uploaded to global community projects such as ‘eBird’ and ‘iNaturalist’. To date, the Viking Expeditions Biodiversity Project has seen the upload of over 3,000 observations of 1,400 species.
Surveying shipwrecks. (Image courtesy: Viking)
Dive boat operations in Antarctica. (Image courtesy: Viking)
An early project undertaken by Cornell University assessed the efficacy of citizen science observations compared to those made by trained ornithological observers. The results highlighted the value of the citizen science, and the programme has since gone on to demonstrate this. In fact, some verified observations have extended the known range for certain species, such as the ‘furthest north’ observation of the Brown Noddy (Anous stolidus).
A modern legacy
Damon Stanwell-Smith, head of science at Viking Expeditions, is a marine biologist with a PhD in Antarctic Research. His career spans field management in Africa and Asia, expedition leadership and executive roles at the UN and IAATO.
Richard Bates is Viking Expeditions’ corporate science advisor and a Geosciences Professor at the University of St Andrews. His interests span industry and academia with interdisciplinary research across land and sea, from Pole to Pole.
Like HMS Challenger in the past, Viking’s science-at-sea initiative is reshaping how ocean research is conducted. The integration of permanent laboratories, multidisciplinary partnerships and active guest participation creates a highly capable, mobile platform for sustained global monitoring, from Pole to Pole. Through its continuous operations, Viking is not only advancing environmental science but also redefining how and where ocean data is gathered, ushering in a new paradigm for – and a new era of – accessible, longterm ocean observation.
Go Deeper. Stay Flexible.
Designed for deep-water Vessel of Opportunity operations, the SeaBat D100 brings trusted SeaBat data quality and reliability into a compact, flexible system capable of surveying depths down to 3000 meters.
Why the SeaBat D100 stands out
• The compact deep-water system with portable sonar head makes flexible deployment for temporary mobilizations possible.
• Beam stabilization and multi-ping capability for consistent swath coverage and higher survey productivity.
• All available in a modern, intuitive user interface for the operators.
Get deep-water capability - without the need for large dedicated survey vessels. Scan QR code for datasheet.
About the authors
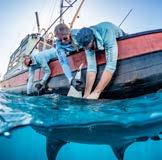
Recovery of a baited remote underwater video system. (Image courtesy: Viking)
Ireland greenlights final phase of INFOMAR seabed mapping programme
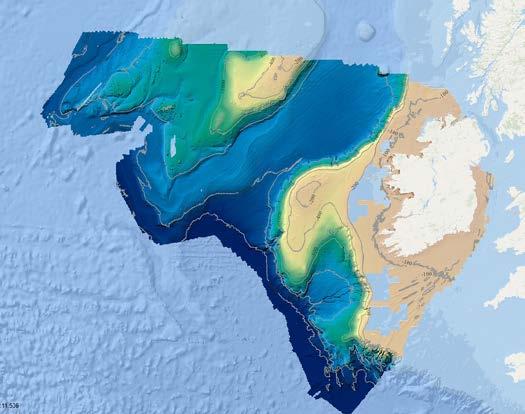
Covering an area of just under one million square kilometres, the INFOMAR seabed mapping programme is one of the most ambitious marine survey projects in Ireland’s history. Following government approval for completion, it is now moving into its final phase. A joint venture between Geological Survey Ireland and the Marine Institute, INFOMAR is working to chart the full extent of Ireland’s offshore territory, which is nearly 10 times the size of the country’s landmass.
The final phase, running from 2027 to 2029, will focus on the most technically demanding and shallowest remaining areas, covering 125,000 square kilometres to complete what has become known as The Real Map of Ireland. Survey operations are scheduled to run from March to October each year in 2026, 2027 and 2028, with a final year dedicated to data processing in 2029. Three state-of-the-art research vessels, the RV Tom Crean, RV Keary, and RV Mallet, will be deployed across the remaining unmapped areas of the Celtic Sea, the Atlantic Ocean and the Irish Sea.
Renewable energy and marine security
The programme brings benefits in several, impactful areas. For the offshore renewable energy (ORE) sector, the data will assist in identifying the best locations for offshore wind energy and will guide the laying of subsea cables and the construction of tidal generators, essential for meeting Ireland’s target of 37GW of offshore wind by 2050. Also, from the perspective of security and sovereignty, the mapping protects critical international telecommunications cables and energy interconnectors and reinforces Ireland’s jurisdiction and management of its Exclusive Economic Zone (EEZ).
From the perspective of marine safety, the data is used to update hydrographic charts, reducing the risk of groundings. Over 420 shipwrecks have already been identified, helping to preserve maritime heritage and notify mariners of potential underwater hazards.
Economic and environmental necessity
For environmental protection, the mapping allows for a ‘plan-led’ approach to conservation and identifies sensitive habitats (like cold-water coral reefs) to ensure they are excluded from industrial development. The seabed data improves oceanographic and ecosystem models, informing storm surge and flood forecasting, coastal erosion prediction and the long-term impacts of rising sea levels.
Commenting on government approval for the completion of the INFOMAR programme, Minister for Climate, Energy and the
Environment Darragh O’Brien stated: “This final push to complete the mapping of our seabed is not just a scientific achievement; it is an economic and environmental necessity. We are unlocking the secrets of our ocean wealth to ensure a sustainable future for our coastal communities and our energy security. Recent events in the Middle East have shown the importance of reducing Ireland’s dependence on imported fossil fuels. We can achieve this by deploying homegrown renewable energy at scale. This is essential for securing our long-term energy security and ensuring price stability for Irish households and businesses.”
Minister of State at the Department of Climate, Energy and the Environment Timmy Dooley commented: “Ireland will become the first nation in the world with a significant maritime area to meet the objective of mapping all of its offshore territory. The completion of the programme will solidify Ireland’s position as a global leader in seabed mapping and marine high-resolution data, underpinning policy and future sustainable development.”
Ireland’s landmark INFOMAR seabed mapping programme is moving into its final phase. (Image courtesy: INFOMAR)
Crowdsourced seafloor mapping: federated learning at the edge
Addressing the bottleneck of data overload
By Niels Bo Nielsen, Ove Andersen and Anita Graser
Crowdsourced bathymetry is increasingly seen as a way to expand seabed coverage by collecting depth measurements from vessels during routine operations. Yet as data volumes grow, the primary challenge shifts from acquisition to validation: how can large amounts of opportunistic, heterogeneous measurements be processed efficiently and reliably? Drawing on deployments in Danish waters, this article explores how edge computing and federated learning can address this bottleneck, enabling automated anomaly detection while allowing hydrographic experts to focus on the most relevant observations for seabed monitoring and survey prioritization.
According to the latest Seabed 2030 update, only 27.3% of the seabed has been mapped to modern standards. With dedicated vessels operating along dense, controlled track lines, today’s hydrographic surveys produce high-quality data, but also at high cost and on a limited scale. As a result, survey efforts focus on high-priority areas for navigational safety, leaving large regions unmapped or covered by older surveys. Further complicating matters, the seabed is far from static. Currents and waves continually reshape sandy or soft bottoms, while human activities – such as port expansions, channel dredging and the construction of offshore wind farms –introduce further changes to the marine environment.
Crowdsourcing to increase capacity
Addressing the limitations of current survey capacity cannot be achieved by dedicated survey vessels alone. Instead, broader participation and innovation are required. Therefore, for Danish waters, where nearly three quarters of the seabed remain unmapped to modern standards, the Danish Geodata Agency (DGA) has been exploring the possibility of leveraging crowdsourced bathymetry. This approach, in which ordinary vessels contribute depth measurements during routine operations, offers the potential to increase coverage,
keep pace with dynamic seabed changes and gradually validate older datasets. It can also serve as a decision-support tool to prioritize resurveying efforts and, where data quality meets required standards (e.g. IHO S-44), contribute to official charting.
To address these challenges, the DGA joined the Horizon Europe MobiSpaces project, which developed data governance, analytics and edge computing solutions across mobility domains. In the ‘CrowdSeaMapping’ use case, the DGA and the Austrian Institute of Technology (AIT) explored how crowdsourced depth data can be integrated into workflows using machine learning to detect errors and anomalies.
In the geospatial domain, projects such as OpenStreetMap have mapped large parts of the world through voluntary contributions –in some cases surpassing the detail available in official national or commercial datasets. A comparable approach in the marine sector is defined by the International Hydrographic Organization (IHO) as Crowdsourced Bathymetry (CSB). Most vessels are already equipped with echosounders and GNSS, but the lack of dedicated systems for data capture and transmission remains a key limitation. High-speed 4G or 5G connectivity is largely confined to coastal waters, while satellite bandwidth is costly. Practical
solutions therefore rely on onboard storage of raw data with deferred transmission when connectivity becomes available.
Processing at the edge
Crowdsourcing introduces additional challenges. Data collection is unsupervised, and as participation scales, so do data volumes and processing demands, making cleaning labour-intensive. To address this,
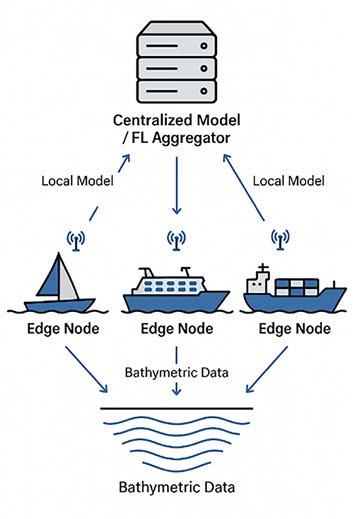
Figure 1: The federated learning data pipeline.
the DGA and AIT explored a federated learning approach in which processing is performed directly at the data collector. This reduces transmission requirements and shifts data cleaning to the edge nodes of the system (Figure 1). This architecture avoids the need to centralize large volumes of raw sensor data while still allowing model updates to benefit from distributed observations.
Raw CSB data is prone to artefacts such as false bottoms from double returns, spikes from aeration or cavitation, offsets from unmodelled draught or tides, and occasional timing or sensor errors. Normally, manual data cleaning is necessary but this is unfeasible at scale. Therefore, the CrowdSeaMapping approach proposes that data collectors employ an onboard artificial intelligence (AI) model termed ‘MapFed’ which enables continuous modelling of the seafloor as well as automatic detection of anomalies.
Detecting anomalies in real time
MapFed learns the expected depth distribution for each location using an adaptive prototype approach. The model is initialized from an existing bathymetric grid (in this case, the Danish Depth Model) and can be continuously trained with incoming survey and/or CSB data. Measurements that deviate significantly from the learned
distribution are flagged locally. Flagged points are then submitted for expert review. Hydrographers assess whether these represent true artefacts to be discarded or valid deviations that should be assimilated into updated bathymetric grids. This workflow creates a feedback loop; domain expertise continuously improves both the anomaly detection model and the underlying bathymetric reference.
Several system components were evaluated both at sea and in controlled environments. The data collector was field-tested aboard a vessel, demonstrating reliable operational performance. Meanwhile, the MapFed anomaly detection model and federated learning setup were validated in the lab, confirming feasibility and potential to reduce data storage and transmission requirements. Together, these trials demonstrate the technical feasibility of the approach and its potential for scalable crowdsourced bathymetry.
The edge device
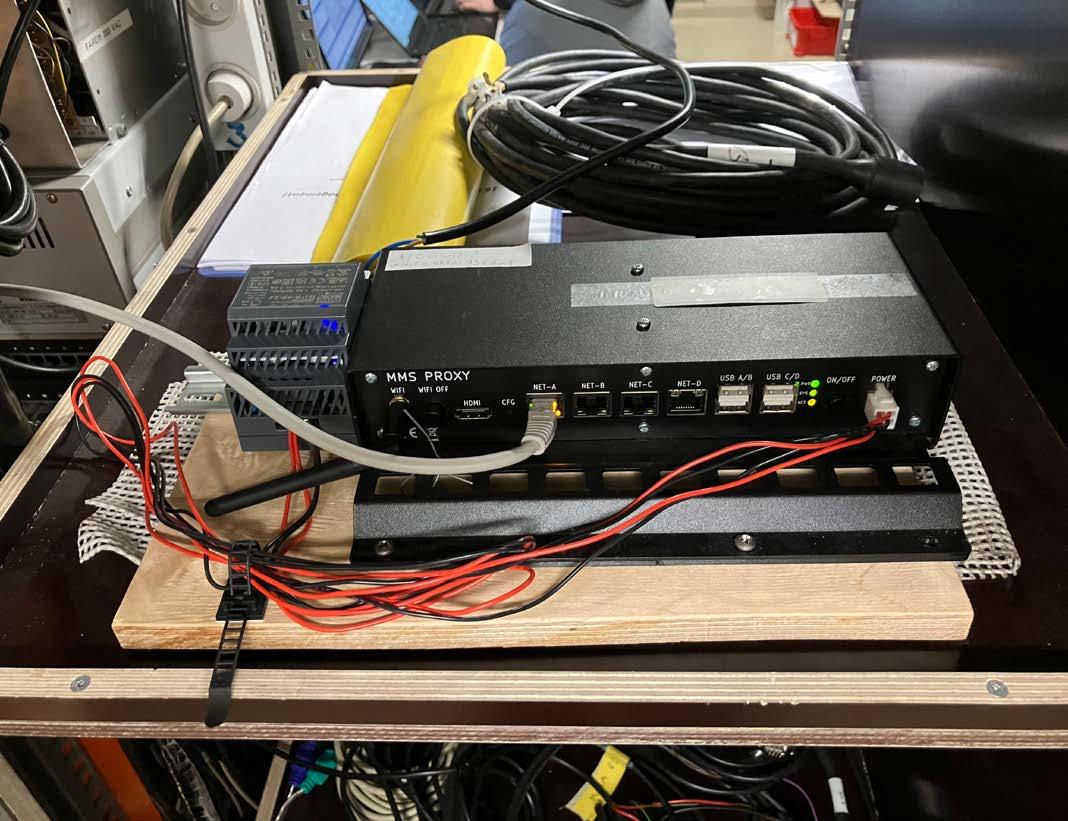
The data collector, developed by the Danish company Sternula, interfaces with a vessel’s NMEA network, listening to the onboard sensors such as echosounder and GNSS. It incorporates a Raspberry Pi compute module for running the MapFed model (Figure 2), with geofencing applied to restrict data collection to the Danish Exclusive Economic Zone (EEZ).
Figure 2: Edge device installed aboard RV Dana IV
Testing at sea
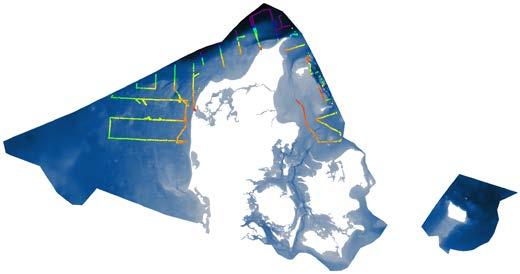
The system was first tested in the summer of 2023 on board the research vessel Dana IV (DTU Aqua). During this trial, the data collector operated continuously and without failure for 37 days (Figure 3). The collected CSB data proved immediately useful in resolving discrepancies between two conflicting surveys of Skagerrak. In addition, the results were later incorporated into the second version of the Danish Depth Model (DDM) which was released in August 2024, demonstrating that cleaned CSB data provided better input than interpolated estimates. While the coverage was limited –approximately 8,500 grid cells (50×50m), corresponding to approximately 21km² –this represented a significant first step for the DGA.
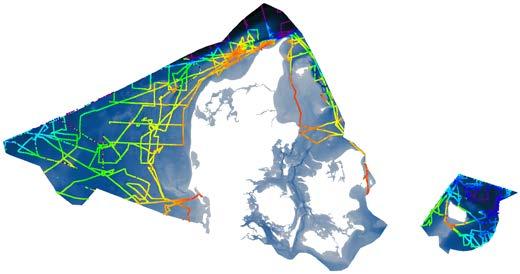
A second, longer deployment took place between April 2024 and March 2025. Over this period, the system again proved robust, operating for nearly one year (300 days at sea) without intervention. During this test, depth data from large areas of the North Sea was collected which has the potential to be used in future versions of the DDM.
Comparing AI and expert cleaning
To assess MapFed’s performance, data from the second deployment was manually cleaned by a hydrographic expert and compared with the model output. The results showed strong agreement with expert cleaning (over 85% of records),
indicating that most artefacts can be reliably identified without manual intervention.
The model was trained on the public DDM, which has 50m resolution and variable data quality – from high-quality multibeam surveys to interpolated estimates based on historical lead-line measurements. To avoid propagating uncertainty, interpolated values were excluded during training, leaving gaps where no reliable reference data existed. As expected, model performance was lowest in areas of low DDM reliability, where limited training data led to misclassifications.
Since no comprehensive ground truth dataset exists for Danish waters, validation
Further reading
relies on expert review, supported by contextual information beyond the public DDM. This feedback not only provides a benchmark for anomaly detection but also supports iterative improvement of both the bathymetric grids and the MapFed model. Over time, these gaps can be reduced through additional CSB contributions, while the MapFed approach enables continuous model improvement as participation increases.
Towards scalable seabed mapping
Initial tests of the data collector and the MapFed model demonstrate that crowdsourced bathymetry is both technically
Graser, A., Heistracher, C., & Pruckovskaja, V. (2022). On the Role of Spatial Data Science for Federated Learning, Spatial Data Science Symposium (SDSS2022). https://doi. org/10.25436/E24K5T
MobiSpaces – New data spaces for green mobility. https://cordis.europa.eu/project/ id/101070279
Graser, A., Weißenfeld, A., Heistracher, C., Dragaschnig, M., & Widhalm, P. (2024) Federated Learning for Anomaly Detection in Maritime Movement Data. 25th IEEE International Conference on Mobile Data Management (MDM2024), 24-27 June 2024, Brussels, Belgium. doi:10.1109/MDM61037.2024.00030
Graser. A., Widhalm, P., & Dragaschnig, M. (2020). The M³ massive movement model: a distributed incrementally updatable solution for big movement data exploration, International Journal of Geographical Information Science, 34(12), 2517-2540. doi:10.1080 /13658816.2020.1776293
Masetti, Giuseppe & Rondeau, Mathieu & Barón, Belén & Wills, Peter & Petersen, Yvonne & Salmia, Juho. (2020), Trusted Crowd-Sourced Bathymetry: From the Trusted Crowd to the Chart. 10.13140/RG.2.2.36642.86722.
Figure 3: The track line of the first sea trial, with the Danish Depth Model v2 as the background.
Figure 4: Track line from second sea trial in 2024-2025, with the Danish Depth Model V2 as the background.
feasible and operationally valuable. Even limited deployments have already shown how CSB can validate existing surveys, improve national bathymetric models and highlight discrepancies that would otherwise remain hidden. Across the two deployments, more than 5.7 million depth points were collected, covering approximately 4.3% of the 50×50m grid cells in the DDM. This demonstrates that, at sufficient scale, CSB can make a measurable contribution to national mapping.
With broader participation from merchant vessels, fishing boats and larger yachts, CSB could provide a continuous stream of depth data that keeps pace with the dynamic seabed. Combined with federated learning and edge processing, this creates a sustainable model for large-scale, data integration. Rather than replacing national hydrographic surveys, CSB complements them, supporting prioritization of resurveys. In the future, if quality thresholds are met, it could also serve as an input to nautical charts. Therefore, with sufficient adoption and coordination, CSB has the potential to significantly accelerate progress toward global initiatives such as Seabed 2030, while also giving hydrographic offices a practical way to keep bathymetric reference data up to date. It represents not just a method to close mapping gaps, but a shift toward a more dynamic, participatory and data-rich approach to understanding and managing the marine environment.
Acknowledgements
This work was carried out as part of the EU Horizon Europe project, MobiSpaces (Grant Agreement No. 101070279).
About the authors
Niels Bo Nielsen is a hydrographic specialist at the Danish Geodata Agency (DGA), where he works with bathymetric data management and crowdsourced bathymetry, including project coordination of DGA’s activities in the Horizon Europe project MobiSpaces.
Ove Andersen is working with designing and developing systems for bathymetric data management and processing at the Danish Geodata Agency (DGA). He has a PhD in Computer Science.
Anita Graser, PhD, is a senior scientist at the AIT Austrian Institute of Technology in Vienna with a research background in geoinformatics and spatial data science. She serves on the QGIS project steering committee and is the lead developer of MovingPandas (a Python library for analysing movement data).
How topo-bathymetric Lidar for drones became a game-changing technology for erosion monitoring
By Florian Caravéo
Water shapes our environment as it flows from source to sea. This essential element – both peaceful and turbulent – created the conditions for life on Earth to emerge. While water covers 70% of the planet, continental water ecosystems represent less than 1% of that total. Given the vast diversity of geological and human-influenced contexts, understanding these environments is critical.
Today, 50% of the world’s population live within 100 km of the coast, a figure likely to rise in the coming decades despite climate change. As a result, hydrographic and topographic data near the coastlines has become strategically vital. These insights help monitor coastal development and identify flood-prone areas, knowledge that is increasingly indispensable.
Between 1980 and 2024, extreme weather events caused approximately €822 billion (about US$890 billion) in economic losses across the European Union.
At YellowScan, we believe Lidar technology for UAVs delivers more than just data; it also provides actionable intelligence.
“Extreme climate conditions now demand a new discipline from European regions: faster decision-making, but on a stronger foundation. In this equation, aerial data is no longer just a technical tool for experts. It has become a quiet cornerstone of economic stability, intersecting urban planning, public finance, and collective security. With risks set to persist, better measurement isn’t a luxury – it’s a governance requirement.” –
Tristan
Allouis, founder and CEO, YellowScan
Lidar Technology: a game-changing advancement
In recent years, the mapping industry has undergone a major transformation thanks to Lidar. Deployed from aircraft, this laser-
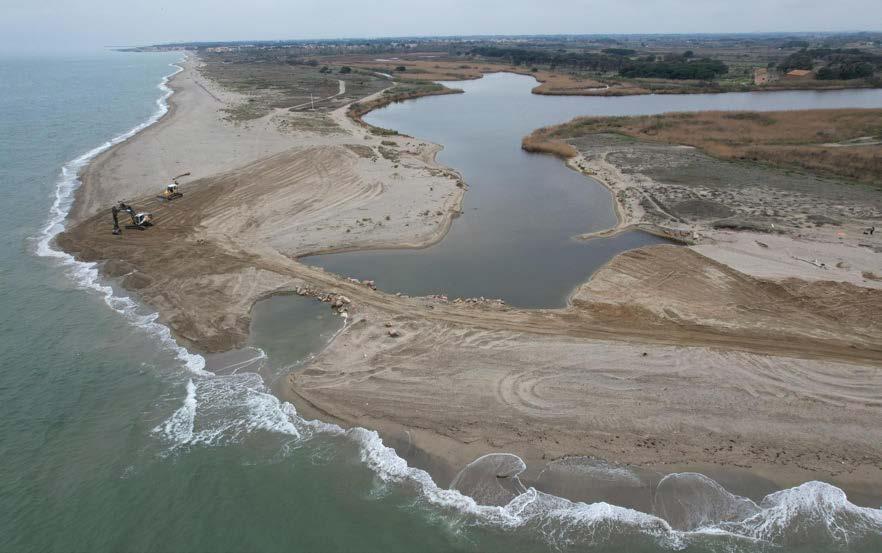
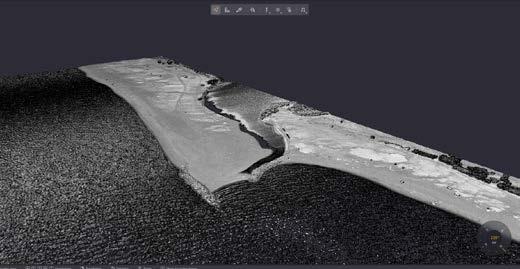
The site in the photo is the location of an experimental rewilding project to restore the sandy beach after removing ripraps built with tons of blocks.
based technology measures precise distances and creates accurate 3D digital models of reality – even through vegetation or water. As part of France’s national Lidar HD programme, the IGN (National Geographic Institute) produces and freely distributes 3D maps of the entire country’s surface and subsurface. These datasets are invaluable for local government authorities, particularly those lacking resources to commission custom surveys.
Case study: restoring coastal sand flow with topo-bathymetric Lidar
The YellowScan team supported a rewilding project led by CEFREM (Center for Training and Research on Mediterranean Environments), a joint research unit in geosciences, oceanography, biology, ecology, and sedimentology affiliated with the University of Perpignan Via Domitia (UPVD) and CNRS. The project aimed to restore the natural flow of sand along the coast.
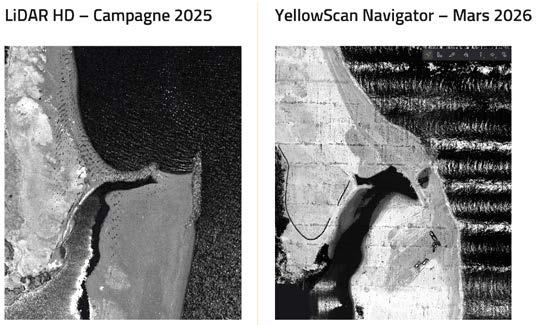
the left, the Lidar HD base from the campaign in 2025 with the ripraps in the estuary. On the right, the new situation without the ripraps just after the works to remove the blocks. The YellowScan Navigator created a new dataset with the topography and the bathymetry in two hours of flight to cover 56 hectares.)
In the 1970s, ripraps (artificial rock barriers) were constructed to stabilize the estuary of a small river, halting the movement of thin sediments. Fifty years later, the effects are measurable: sand has accumulated south of the ripraps, while the northern beach has eroded by one metre per year for the past two decades.
To monitor these changes, a baseline dataset (T0) was created before the restoration work began, using multiple methods:
• Bathymetry with an echo sounder
• Drone photogrammetry
Topographic and bathymetric Lidar
Data acquisition was coordinated within 24 hours to minimize topographic and bathymetric changes during the survey. After weeks of wind, the sea was calm and the turbidity was not so important. The researchers decided to coordinate the different acquisitions in a short time to compare the different methods and technologies with a minimum of changes due to the wind and the streams.
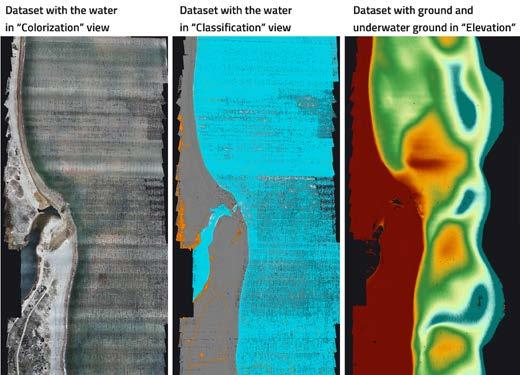
Three views of the dataset processed with the YellowScan CloudStation. In the Colourization and Classification views, the water class is shown. In the Elevation view, the water class is removed; the colour variations made it possible to identify the deepest places in blue and the sand bars in orange and red.)
Mission specifications
• Study area: 56 hectares
• Number of flights: 6
Drones: DJI M600 and M400
• System: YellowScan Navigator
• Altitude: 60 m maximum (near an airfield) Overlap: 50%
Point density: >20 points/m²
• Highest point: 3.5 m
• 1 Secchi depth: 2.5 m
Maximum underwater depth reached: -5.38 m
Comparing datasets: before and after riprap removal
A key challenge in coastal monitoring is connecting topographic and bathymetric datasets. Traditional boats cannot safely approach shallow shorelines, often leaving critical gaps between land and sea data. Topo-bathymetric Lidar bridges this divide, creating seamless datasets that integrate both environments.
In this project, the Lidar HD mission coordinated by the IGN captured data before (2025) and the YellowScan Navigator captured the same place after (February 2026) the ripraps were removed. The Lidar HD base (2025, shown in green) was overlaid with the Navigator dataset (2026, shown in blue) in YellowScan CloudStation software using LAS files to detect changes.
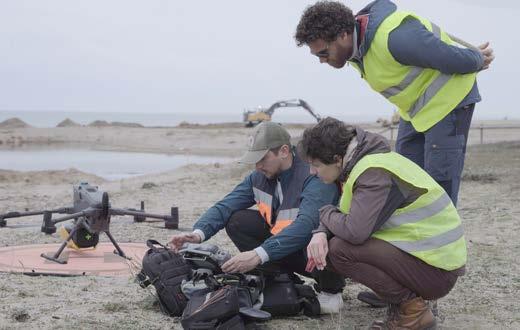
The YellowScan team supports researchers in the field with the deployment of the topo-bathymetric Lidar YellowScan Navigator.
On
The results were impressive:
The new topo-bathymetric dataset revealed subtle shifts in underwater topography.
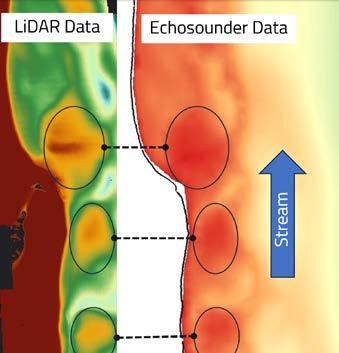
• Without the water surface, comparisons with the echo sounder bathymetric base became possible.
• Elevation colourizations exposed underwater depth variations, highlighting similarities between the Lidar and echo sounder datasets, particularly in large sedimentary bars.
On the left, the topo-bathymetric dataset from the YellowScan Navigator, on the right the bathymetric dataset from the echosounder. The elevation colourizations revealed the underwater depth variations. We can easily identify the similarities between both datasets with regard to the biggest sedimentary bars. In this case, the northern part may move a lot to restore the sandy cost thanks to the rewilding works.
The northern section, which had previously eroded, now shows signs of restoration thanks to the rewilding efforts. Future missions will repeat the same flights to assess long-term benefits, creating new seamless datasets from coast to sea.
Advantages and limitations
Topo-bathymetric Lidar is a highly effective tool for scientists monitoring coastlines. Its ability to merge topographic and bathymetric data fills critical gaps left by traditional methods. However, two key limitations remain:
1. Water turbidity can reduce laser penetration, affecting data quality.
2. Mission scale must be carefully planned to ensure coverage and accuracy.
Despite these challenges, the technology’s ability to connect land and sea in a single, comparable dataset makes it invaluable for erosion monitoring, flood risk assessment, and coastal management.
Conclusion: a new era for coastal monitoring
As climate change intensifies, the demand for precise, actionable geospatial data will only grow. Topo-bathymetric Lidar for drones is not just a technological advancement – it is a necessity for
sustainable coastal development. By providing seamless, high-resolution datasets, it empowers scientists, governments, and communities to make informed decisions in the face of an uncertain future.
About the author
Florian Caravéo: With a background in hydrobiology and habitat surveying, I have built a cross-functional career in marketing and business, always driven by a commitment to ecosystem preservation. Today, I specialize in Lidar technologies for drones at YellowScan, where I can bridge innovation with environmental and societal impact. By advancing projects that protect communities and support research, I believe in sustainable solutions – proving that technology can serve both progress and nature.
This view shows a slice in the overlay of Lidar HD base with the Navigator dataset. It is easy to show the first changes after removing the blocks of the ripraps. We can observe in blue the new topography with the bathymetry in a seamless dataset.
ZeroUSV autonomously deploys ocean glider at Atlantic Bastion exercise
In a demonstration supporting the Royal Navy’s Atlantic Bastion programme, ZeroUSV has recently launched a Slocum glider from an autonomous USV for the first time. The milestone demonstrates how autonomous USVs can act as launch and support platforms for long-endurance underwater systems, reducing the need for larger crewed ships during subsea operations.
The launch of the Teledyne Slocum Glider was conducted from a ZeroUSV Oceanus12 USV, which operated as the autonomous host platform for subsea technology provided by Teledyne Marine. The trial showed how autonomous vessels can launch and support long-endurance underwater systems without the need for larger crewed ships.
Atlantic Bastion forms part of a wider UK Ministry of Defence (MOD) effort to explore how autonomous systems can support maritime security tasks, including subsea monitoring and the protection of critical undersea infrastructure. The programme is expected to involve multiple industry teams as capability is developed and refined.
New possibilities for persistent subsea monitoring
Two Oceanus12 USVs were deployed during the demonstration as part of the wider trial activity. The event brought together several partners to explore how autonomous USVs, subsea vehicles and specialist sensors can be integrated for maritime security and subsea operations.
Matthew Ratsey, managing director and co-founder of ZeroUSV, said: “This is an incredible milestone. For the first time, the world has seen the launching and operating of an ocean glider from an uncrewed vessel, which opens up new possibilities for persistent subsea monitoring and longendurance operations at sea.”
“This ushers in a new operational model for persistent, distributed ocean data collection,
directly relevant to defence ISR, ASW and REA missions, as well as commercial and scientific oceanographic applications,” he continued.
Wider
collaboration across the autonomous maritime sector
The demonstration also reflects wider collaboration across the autonomous maritime sector. Teledyne Marine and MSubs recently announced a strategic partnership focused on integrating autonomous surface vessels, underwater vehicles and advanced sensing technologies for future naval programmes. The Oceanus platform provides a flexible host for these systems, enabling a range of subsea capabilities to be deployed from autonomous vessels.
Arnar Steingrimsson, vice president of sales, marine vehicles at Teledyne Marine, said: “The ability for our Slocum gliders to be rapidly and safely deployed into an operating
area from another unmanned platforms is a major capability enhancement and opens the door for more effective and focused use of gliders and USVs especially for time sensitive defence applications like ASW, ISR or REA. We look forward to continued cooperation with MSubs and Zero USV in realizing gamechanging marine capability.”
The Oceanus class is designed as a modular autonomous vessel capable of supporting a wide range of sensors and subsea systems, including sonar, survey equipment and autonomous underwater vehicles. A larger platform, Oceanus17, is also in development and will offer increased payload capacity and endurance for longer missions.
ZeroUSV plans to continue demonstrating its autonomous vessel technology during 2026, including displaying the Oceanus17 platform at SeaWork in Southampton (UK) in June.
Two Oceanus12 USVs were deployed during the demonstration as part of the wider trial activity. (Image courtesy: ZeroUSV)
From classroom to chart: why CMFP matters
Training the next generation of hydrographers in Malaysia
By Lieutenant Ts Nizam Azhan RMN, Malaysia
Trainees were exposed to operations including the use of multibeam echosounding (MBES), singlebeam echosounding (SBES) and sidescan sonar (SSS) during a complex multidisciplinary field project (CMFP) conducted at Pulau Indah Base Jetty (PIBJ) in Malaysia. The project gave them valuable hands-on experience and a practical understanding of modern survey techniques, as well as highlighting key aspects of an integrated hydrographic survey supporting a proposed jetty extension. By providing a concise overview of the project, this article demonstrates why a complex multidisciplinary field project is such a practical training platform for developing operational competency in hydrography.
Modern hydrographic education must extend beyond theoretical instruction. As maritime operations grow increasingly complex, hydrographers are expected not only to understand technical principles, but also to operate under real-world constraints, comply with international standards and deliver reliable data that supports critical
decision-making. The CMFP conducted under the University Technology Malaysia (UTM) HYDRO II FIG/IHO/ICA Category ‘A’ Programme is designed to bridge this gap. It requires trainees to undertake a complete hydrographic survey cycle – from planning and data acquisition to processing, analysis and final product delivery.
From 21 April to 22 May 2025, a CMFP hydrographic survey was carried out at Pulau Indah Base Jetty, which serves as the homeport of Malaysia’s National Hydrographic Centre (NHC) and supports Royal Malaysian Navy (RMN) operations. The survey area is located within the South Klang Strait, a busy maritime corridor that provides
The survey team members: Lieutenant Mohammad Nizam bin Azhan RMN, Lieutenant Mohd Fakhrurazzi bin Mohd Shukeri RMN and Lieutenant Muhammad Hafidz bin Abd Halim RMN (National Hydrographic Centre of Malaysia), Muhamad Sahaullah bin Kassim (Marine Department of Sarawak), and Kassim Talib Khatib (Zanzibar Commission for Lands).
access to Port Klang. With increasing operational demands and future fleet requirements, the expansion of jetty infrastructure has become necessary.
To support the jetty extension, the survey aimed to acquire highresolution bathymetric data, identify seabed features and hazards, and provide a reliable dataset for planning and decision-making. The survey was conducted within Malaysian Nautical Chart MAL 5307, covering approximately 3.3km² including 2.5km² MBES and 0.8km² SBES coverage. The area is subject to continuous vessel traffic, sediment movement and dredging activities, making accurate and up-to-date hydrographic data essential for both navigation safety and engineering design. All survey activities were conducted in accordance with the International Hydrographic Organization (IHO) S-44 standards (Edition 6.2.0), achieving Special Order requirements for multibeam data and Order 1 standards for supporting datasets.
Project progression and equipment
The project progressed through key phases, including planning and survey design, establishment of horizontal and vertical control, and multi-sensor data acquisition (MBES, SBES, SSS), followed by data processing, analysis and final product generation to support the proposed jetty extension. The survey was conducted using two dedicated platforms: Bot Hidrografi 1 (BH1), which served as the primary platform for MBES and SSS operations, and a Surf Launch Boat (SLB), deployed for SBES surveys in shallow and confined areas. An integrated system comprising the Kongsberg EM2040P MBES, Odom Echotrac MKIII SBES and C-MAX CM2 SSS was deployed for bathymetry and seabed imaging. Positioning and motion were supported by the Kongsberg Seapath 130 GNSS/INS with MRU5, alongside Fugro Marinestar G2+ and Atlas Hemisphere corrections, while sound velocity data was obtained using the Valeport SWIFT
SVP. Additional equipment, including the Trimble R580 GNSS receiver, Leica NAK2 level, Valeport TideMaster tide gauge and Ponar Grab sampler, supported control, tidal referencing and seabed validation. Careful calibration and system integration ensured accurate and reliable survey data.
Horizontal control was established using integrated GNSS techniques, including Fugro Marinestar and Atlas Hemisphere correction services, supported by static observations with the Trimble R580 receiver and nearby CORS stations. A geodetic control network was developed to ensure high positional accuracy, with validation performed at benchmark BM 1001B confirming compliance with required tolerances. Vertical control was achieved through tidal observations and datum determination. A Valeport TideMaster tide gauge was installed and connected to BM 1001B through precise levelling, enabling accurate transfer of elevation and reduction of soundings to Lowest Astronomical Tide (LAT). Observed tidal data showed strong agreement with predicted values, confirming reliability.
Data acquisition and processing
The SBES survey was conducted primarily for shallow water depth acquisition near the shoreline. The system used was the ODOM Echotrac MKII along with a Valeport SWiFT SVP to measure sound speed and it was supported by the Fugro Marinestar for accurate positioning and movement adjustments. Before using the SBES system, the measurements were taken with an SLB to find the vertical distances between the GNSS antenna, the Common Reference Point (CRP) and the transducer. Data acquisition was conducted along survey lines perpendicular to the shoreline, with a planned line spacing of 25m following IHO S-44 guidance for Order 1b surveys in shallow areas. Data was recorded and logged using
Survey area at Pulau Indah Base Jetty within the South Klang Strait, Malaysia.
the Hypack Survey software, allowing real-time depth visualization and quality control. SBES data also served as a backup and validation reference for MBES coverage in overlapping zones. The processing was carried out using HYPACK 2025, where raw sounding data was imported, filtered and corrected for tidal variations and sound velocity. Crossline checks and contour generation were also performed to validate data consistency and produce final depth surfaces.
The MBES survey formed the core component of the bathymetric mapping effort. The system deployed was the Kongsberg EM2040P mounted on the pole on the port side of BH1. The system worked together with the Seapath 130 GNSS/INS and Kongsberg MRU5, and it received real-time position corrections from Seapath 130 and Atlas Hemisphere to ensure accurate location. Survey lines were spaced at approximately 29m and oriented parallel to the coastline to optimize seabed coverage. A 100% swath overlap between adjacent lines was maintained, with the aim to achieve Exclusive Order standards. Sound velocity profiles were regularly acquired using the Valeport SWiFT SVP, typically three times daily or when differences exceeded 2m/s compared to the real-time surface sound velocity sensor. The data acquisition was performed using Kongsberg SIS 5 software, while quality control and real-time coverage monitoring was conducted throughout the operations. Multibeam data
processing was conducted using CARIS HIPS and SIPS version 12.0.3. The workflow involved data organization, application of sound velocity and tidal corrections, Total Propagated Uncertainty (TPU) computation, and surface generation using the CUBE algorithm. Data cleaning and filtering were performed to remove noise and outliers, ensuring high-quality bathymetric surfaces suitable for analysis and charting.
The sidescan sonar survey was conducted using the C-MAX CM2 system, which was towed behind the BH1 to capture high-resolution acoustic imagery of the seafloor. This survey aimed to detect and classify both natural and man-made features, such as debris, rocks, anchor scars or potential obstructions to construction activities. The C-MAX CM2 system was operated with SonarWiz for acquisition, set at 325kHz and 50m sonar range. During acquisition, the minimum operating depth for the towfish was maintained at 5m altitude and layback calculations were handled in real time through the SonarWiz automated system, accounting for both vertical and horizontal offsets relative to the virtual Common Reference Frame (CRF). Survey lines were designed with 10% side overlap between adjacent lines to ensure complete seabed imaging.
After data collection, post-processing was done using SonarWiz version 7.12.03, which included data import, bottom tracking using
Survey team on board Bot Hidrografi 1 (BH1).
a threshold detection algorithm, and noise removal. An Empirical Gain Normalization (EGN) mosaic algorithm was applied to combine and smooth the sonar imagery. Feature interpretation was then conducted to classify seafloor elements as natural features, such as sand ripples and rocks, and man-made features, such as wrecks, anchor scars and debris. The SSS data was particularly valuable in confirming seafloor conditions for engineering risk assessment and in guiding precise dredging requirements.
Data analysis
Bathymetric analysis was conducted using the MBES and SBES datasets, focusing on depth distribution, surface generation and cross-comparison. MBES provided high-resolution coverage, while SBES supported validation in shallow areas and ensured data consistency. Quality control included surface uncertainty evaluation, Total Vertical Uncertainty (TVU) assessment
and crossline analysis to verify agreement between mainlines and check lines. Data density and coverage checks confirmed full seabed coverage and identified any gaps. Comparisons between MBES and SBES surfaces were also performed to validate data integrity.
Seabed characterization utilized backscatter data SSS imagery, supported by groundtruthing through sediment sampling. This analysis enabled classification of seabed types and improved interpretation of acoustic responses. Feature detection identified underwater objects such as wrecks, pipelines and seabed formations, supporting hazard identification and navigation safety.
Detailed results
Bathymetric results revealed detailed seabed morphology, with depth variations from shallow nearshore zones to deeper mid-channel areas. High-resolution outputs,
including sounding maps, contour maps and fair sheets, were generated, providing accurate seabed representation for charting and infrastructure planning. Comparison with existing datasets, including MAL Chart 5307 and post-dredging data from Lembaga Pelabuhan Klang (LPK), showed noticeable seabed changes, highlighting the dynamic conditions of the South Klang Strait influenced by sediment transport and maritime activities.
Accurate representation of morphology
The hydrographic survey successfully produced a comprehensive set of deliverables that meet the requirements for engineering, navigation and charting applications. The primary outputs include high-resolution bathymetric surfaces, depth soundings, contour maps and fair sheets, all derived from integrated MBES and SBES datasets. These products provide an accurate representation of seabed morphology within the area of survey and
are suitable for supporting the desig and planning of the proposed jetty extension. In addition, SSS mosaics were generated to provide detailed seabed imagery, enabling effective identification and interpretation of underwater features. Backscatter data products further supported seabed classification, offering insights into sediment distribution and seabed composition.
Acknowledgements
The team members would like to extend their heartfelt appreciation to the chairman of the UTM Hydrography programmes and all esteemed lecturers of UTM HYDRO II Batch 2024/2025 for their continuous guidance, support and encouragement throughout their journey. Their sincere gratitude also goes to the director general of hydrography and all officers of the National Hydrographic Centre for their unwavering support and generosity. The provision of laboratory facilities, professional accommodation and technical assistance greatly enriched their learning experience and played a significant role in their successful completion of this programme.
Lieutenant Ts Nizam Azhan
RMN is a FIG/IHO/ICA Category ‘A’ hydrographer with over a decade of experience in hydrographic surveying. He currently serves as a staff operations officer at the National Hydrographic Centre of Malaysia, where he is responsible for coordinating survey operations, ensuring data quality in accordance with IHO standards, and supporting nautical chart production for safe navigation.
Feature detection outputs, including the identification of wrecks, pipelines, sand waves and submerged structures, were compiled into feature maps to support hazard assessment and navigational safety. The survey also verified and produced updated information on Aids to Navigation (ATONs) within the area of survey and identified potential obstructions. A Category of Zone of Confidence in Data (CATZOC) assessment confirmed that the dataset meets required standards for accuracy. Collectively, these hydrographic products form a reliable dataset for updating nautical charts, supporting marine operations and assisting engineering decisionmaking.
Conclusion
The hydrographic survey for the proposed Pulau Indah Base Jetty extension was successfully conducted in accordance with IHO S-44 standards, achieving its objectives of acquiring high-resolution bathymetric data, detecting seabed features and producing reliable hydrographic products. The integration of advanced survey systems, supported by accurate control, systematic data acquisition and rigorous processing, ensured the quality and reliability of the results. The findings provide valuable insights into seabed conditions and serve as a strong foundation for engineering design, chart updating and ensuring safe navigation within the survey area. As a multidisciplinary real-world assignment, the CMFP also gave trainees an excellent opportunity to experience the full cycle of hydrographic survey operations in practice, helping to prepare the next generation of professionals for future challenges.
Further information
Scan the QR code to view the highlights of the activities carried out during the CMFP project.
About the author
MBES surface quality control.
Seabed classification.
NOAA returns to the Great Lakes to chart critical waters
To address a data gap in a key part of the USA’s nautical navigation infrastructure, the NOAA ship Thomas Jefferson is back in the Great Lakes. Western Lake Erie, a high-traffic corridor for commercial and recreational vessels, has not seen a hydrographic survey since the 1940s. That data gap represents a navigational liability across one of the most active stretches of the Great Lakes marine transportation system.
This season, the Thomas Jefferson and its crew are mapping western and central Lake Erie and eastern Lake Ontario, with additional survey work planned inside Lake Ontario National Marine Sanctuary to identify critical habitats. The deliverables feed NOAA’s broader portfolio of nautical navigation products and services, the infrastructure that keeps vessels safe, fishing operations efficient, and the region’s ocean economy on sound footing.
Addressing the mapping gap
The Great Lakes are the least mapped region of the United States, and the gap is significant. Only 17% of the lakefloor has been mapped at high density, with much of the remaining chart data dating back decades. Modern high-density bathymetric surveys produce a fundamentally different quality of information, enabling
detailed analysis that supports navigation safety, resource management and the growing blue economy throughout the region.
NOAA is addressing that gap from multiple directions. Navigation response teams deploy each year alongside larger vessel operations to survey priority areas, and this year their focus includes Thunder Bay National Marine Sanctuary, western Lake Erie, Braddock Bay and vicinity in New York, and Green Bay along the Michigan and Wisconsin shoreline. The surveys contribute to both the Lakebed 2030 collaborative mapping initiative and the Great Lakes Restoration Initiative’s habitat mapping programme, advancing a long-term effort to bring comprehensive, high-resolution coverage to a freshwater system of extraordinary regional and national importance.
The Thomas Jefferson will be joined this summer by a DriX H-8 uncrewed surface vehicle operating near Oswego, New York, adding autonomous survey capacity to the mission. The DriX carries high-resolution multibeam sonar capable of mapping the seafloor and detecting objects throughout the water column and along the bottom. Rather than operating fully autonomously, the system runs under a supervised autonomy model in which a NOAA pilot remains engaged at all times and retains the ability to assume direct control when needed. The vehicle can sustain operations for up to four days before returning to shore for routine checks and refuelling, making it a practical force multiplier for a mission covering expansive survey areas.
To bolster survey coverage this summer, the Thomas Jefferson will operate alongside a DriX H-8 uncrewed surface vehicle. (Image courtesy: John Doroba/NOAA)
Advanced sonar technology captures the USS Monitor in unprecedented detail
In collaboration with the National Oceanic and Atmospheric Administration (NOAA), Northrop Grumman has released never-before-seen images of the historic USS Monitor, a Civil War-era vessel that sank on 31 December 1862. The images were captured using Northrop Grumman’s highly advanced µSAS sonar technology.
The collaboration took place in September 2025, as part of Northrop Grumman’s Technology for Conservation initiative. Together, the two organizations scanned the historic ocean-floor site, capturing detailed shipwreck imagery and gaining new insights into the current health of the sanctuary.
Having first been discovered in 1973, the wreck was designated as the United States’ first National Marine Sanctuary by NOAA two years later. It rests 73m below the ocean’s surface. NOAA, which monitors the health of the sanctuary on an ongoing basis, had been searching
for readily available technology capable of evaluating the site in greater detail. Northrop Grumman’s µSAS technology, short for micro synthetic aperture sonar and pronounced ‘micro-SAS’, proved to be exactly the tool for the job.
High-resolution 3D models
Using acoustics, the high-performance sonar solution produced the highestresolution images of the USS Monitor wreck ever captured, delivering a remarkably detailed picture of the seafloor. The Northrop Grumman team went a step further, creating 3D digital and physical models for NOAA that trace the Monitor ’s
journey from its launch in 1862, through its sinking and subsequent major recoveries, to its current status as a protected national marine sanctuary.
Kevin Gallagher, sonar architect on the µSAS team at Northrop Grumman, commented: “Our advanced µSAS sensor technology gives us a clear, detailed look at the USS Monitor for the first time since 1862 – capturing the ship’s hull, interior, and surrounding debris through murky water. This breakthrough shows how Northrop Grumman’s leadership in cuttingedge sensing expands what’s possible, not just in aerospace and defense, but in exploring and preserving history.”
“Public-private partnerships like the one with Northrop Grumman help support NOAA’s role as steward of the USS Monitor ’s historic legacy and as a testbed for new technologies,” said John Armor, director of NOAA’s Office of National Marine Sanctuaries. “The Monitor was a technological marvel of its day, and it continues to serve the nation today by showcasing new technologies, scientific innovations and groundbreaking educational programmes. Thanks to Northrop Grumman’s advanced scanning and digital reconstruction capabilities, the public will now be able to view images of the Monitor with near-photographic resolution and extreme three-dimensional accuracy. These products provide a valuable baseline for future monitoring and will inspire the next generation of marine scientists and archaeologists alike.”
3D view of the USS Monitor resting on the seabed. (Image courtesy: Northrop Grumman/NOAA)
Seabed intelligence at scale for the blue economy
Utilizing hydrographic backscatter data
By Navy Lieutenant Onogateoghene Idoge
Hydrography has long been defined by depth. From nautical charting to navigation safety, bathymetry remains the primary deliverable. But many blue economy activities – offshore wind, subsea cables, marine spatial planning –demand more than depth; they also need to know what the seabed is made of. Backscatter, which is routinely collected alongside bathymetry, holds this answer – yet it remains underutilized. This is no longer a technical oversight. It is a missed strategic opportunity.
The global blue economy is valued at approximately US$2.5 trillion annually and continues to expand rapidly. Offshore wind capacity alone is projected to reach hundreds of gigawatts in the coming decade, while subsea infrastructure – telecommunications cables, power interconnectors and carbon capture systems – is being deployed at unprecedented rates. Each of these developments depends on reliable seabed characterization. Yet traditional methods such as grab sampling, coring and video inspection remain inherently limited in spatial coverage. They provide valuable point data, but cannot scale to meet modern demands.
Backscatter offers a different path. Acquired as part of routine hydrographic surveys, it provides continuous seabed information across entire survey areas without additional acquisition time. The data already exists. The real challenge lies in how effectively it is processed, interpreted and integrated into decision-making workflows.
Hydrography beyond depth
Hydrographic surveying has traditionally focused on accurate depth measurement to support safe navigation, guided by S-44 International Hydrographic Organization (IHO) standards for hydrographic surveys. Multibeam echosounding (MBES) has greatly advanced this objective, enabling high-
resolution mapping of seafloor morphology. However, MBES systems inherently collect more than depth; they record both bathymetry and backscatter simultaneously. While bathymetry defines the geometry of the seabed, backscatter provides insight into its composition and physical properties. As hydrography evolves to support broader applications, it is increasingly necessary to treat backscatter data not as a secondary output, but as a core hydrographic dataset.
What bathymetry alone cannot reveal
Backscatter represents the strength of acoustic energy returned from the seabed following sonar interaction. Its response is influenced by seabed composition (mud,
Comparison of bathymetry and backscatter from the same survey area, highlighting how similar depths can produce different acoustic responses due to seabed variability. (Image courtesy: NORBIT Subsea)
sand, gravel, rock), surface roughness and heterogeneity, acoustic frequency, incidence angle and environmental conditions.
Operational guidance from organizations such as the National Oceanic and Atmospheric Administration (NOAA) shows that areas of similar bathymetry can produce significantly different backscatter signatures. Whereas bathymetry describes geometry, backscatter reveals composition.
Why backscatter remains underutilized
There are various reasons why backscatter data is currently underutilized. First, backscatter quality depends heavily on consistent sonar settings, vessel motion and survey design. This sensitivity means that variations in acquisition parameters directly affect the reliability of the final mosaic. Second, the intensity of the returned signal varies with beam incidence angle. Without proper angular corrections, artifacts may obscure true seabed characteristics. Last but not least, processing backscatter data is complex. Unlike bathymetry, backscatter workflows lack full standardization. Differences in processing methodologies can lead to inconsistencies across datasets, complicating interpretation. However, these challenges are not limitations of backscatter itself, but indicators of the need for improved workflow discipline and training within hydrographic practice.
From data to insight: a practical workflow perspective
Transforming backscatter into a usable hydrographic product requires a structured and consistent workflow. In survey operations I have been involved in, bathymetric data is processed using software such as QPS Qimera, CARIS and so on. Backscatter is refined using tools such as QPS-FMGT to generate normalized mosaics. Key factors influencing output quality include consistent acquisition parameters, appropriate frequency selection, radiometric and geometric corrections, and robust mosaicking techniques. In other words, the transition from raw acoustic intensity to interpretable seabed information is not automatic. It requires both technical expertise and deliberate workflow design.
Delivering value across industries
Backscatter is fundamentally a hydrographic dataset, but its value extends across multiple maritime sectors, including:
• Offshore energy: backscatter supports foundation design, cable routing and scour assessment by identifying sediment type and seabed variability, directly reducing uncertainty and optimizing engineering decisions.
• Ports and navigation: it enables precise identification of dredgeable versus non-dredgeable materials, improving efficiency and reducing operational costs.
Conceptual illustration showing variation in backscatter intensity with beam incidence angle.
Further reading
International Hydrographic Organization (2020), Standards for Hydrographic Surveys (S-44)
National Oceanic and Atmospheric Administration – Office of Coast Survey, Multibeam Backscatter Resources
Lamarche, G., et al. (2011), Guidelines for Backscatter Acquisition and Processing
Brown, C. J., et al. (2011), Mapping Benthic Habitats Using Multibeam Backscatter
Buscombe, D. (2021), Machine Learning for Seabed Classification
• Subsea infrastructure: backscatter reveals hazards such as rock outcrops, boulders and mobile sediments that are not evident from bathymetry alone.
• Environmental management: it provides scalable habitat mapping to support environmental assessments, conservation planning, and regulatory compliance.
About the author
Onogateoghene Idoge is a naval officer and Category A hydrographic surveyor with the National Hydrographic Agency (Nigeria). He specializes in multibeam data processing, backscatter analysis and seabed characterization, advancing hydrographic practice through data-driven and innovative marine geospatial solutions.
These applications highlight how hydrographic data, particularly backscatter, directly supports critical blue economy sectors, transforming hydrography from a navigation-focused discipline into a key enabler of sustainable ocean development.
Processed backscatter mosaic showing tonal variations associated with different seabed compositions. (Image courtesy: Geosciences/Craig J. Brown)
The future: calibration, data and intelligence
Historically, backscatter has often been used as a qualitative dataset. However, advances in calibration, angular response analysis and processing workflows are enabling quantitative backscatter products. When properly calibrated and archived, backscatter becomes a time-series dataset capable of supporting long-term monitoring of seabed change and predictive analysis. Emerging machine learning techniques are further enhancing its value. As these models require large, high-quality datasets, organizations that invest in backscatter today will be better positioned to leverage automated seabed classification in the future. This is particularly critical in data-sparse regions where improved seabed intelligence can directly support national hydrographic development and sustainable ocean use.
Conclusion
Hydrography is no longer solely about measuring depth; it is about understanding the seafloor. Backscatter is not an optional by-product – it is a critical dataset that enables this transformation. Promoting hydrography in today’s context means demonstrating its value beyond navigation. Backscatter provides a clear example of how hydrographic data products support modern maritime operations and the global blue economy. In view of the expansion of the blue economy and the increasing demands on ocean data, the integration of bathymetry and backscatter will define the future of hydrographic surveying. The real question is no longer whether to collect backscatter. It is whether we are ready to use it to its full potential.
Mobilizing everyday maritime activity for meaningful impact
Where science meets the sea
By Ivonne Gamboa, SeaKeepers
What if every yacht at sea could double as a scientific research vessel – quietly collecting critical data about the health of our oceans? The International SeaKeepers Society is turning that idea into reality, transforming privately owned vessels into platforms for ocean research, education and conservation.
As a non-profit organization operating at the intersection of science and environmental stewardship, SeaKeepers works to make oceanographic research more accessible and collaborative. By leveraging a global network of yachts, scientists and volunteers – supported by chapters across the USA, United Kingdom, Singapore and New Zealand –the organization enables meaningful data collection and outreach in regions that are often difficult for traditional research institutions to access. In doing so, it invites boaters around the world to be part of something larger than themselves –supporting ocean conservation while helping shape the science and policy that guide it across industries and communities.
A global platform for ocean research
At the core of SeaKeepers’ mission is its ability to bridge the gap between scientific research and maritime operations. Through its DISCOVERY programme, the organization equips privately owned vessels with the tools and protocols needed to support scientific missions at sea. These vessels, ranging from small recreational boats to large superyachts, serve as cost-effective and flexible platforms for researchers studying biodiversity and ocean health.
This model allows scientists to access remote or under-sampled regions of the ocean without the significant expense typically associated with dedicated research vessels. In turn, vessel owners and crew become active participants in advancing ocean science, fostering a sense of shared responsibility for marine conservation.
Citizen science and data collection
SeaKeepers has emerged as a leader in citizen science initiatives, empowering individuals to
contribute meaningful data to global research efforts and the future of ocean health, even without a research background or a scientist on board. Through simple, structured programmes, citizen scientists help collect key oceanographic measurements – data that,
when combined, builds a clearer picture of changing marine conditions. What sets this work apart is the way it brings rigour and accessibility together. By standardizing data collection methods and integrating results into broader scientific networks, it opens the door for more people to take part in ocean science. SeaKeepers also offers an array of different projects for scientists and vessel participants to engage with, allowing involvement to be shaped by interest, location, accessibility and research focus.
Building future ocean stewards
Education is woven into nearly everything SeaKeepers does, but it becomes most tangible through its Educational Outreach programme. Rather than keeping learning confined to classrooms or textbooks, these initiatives bring students, educators and community members directly aboard participating vessels, where ocean science is
SeaKeepers facilitates an Ocean First Institute shark tagging expedition aboard DISCOVERY vessel Orca (a modern replica of the vessel featured in the film Jaws).
SeaKeepers facilitates a deep reef survey in the Far East with UNSEEN Expeditions aboard DISCOVERY yacht Northern Sun
experienced first-hand. For many students, these moments at sea are their first real exposure to marine research and conservation work. It is an approach that helps shift ocean science from something abstract into something lived.
Alongside these onboard and in-classroom experiences, SeaKeepers also provides practical educational resources, including sustainability guides for boaters. These tools help extend learning beyond a single trip or programme, encouraging more responsible practices across the broader maritime community. Together, these efforts reinforce a simple idea: education doesn’t just inform future ocean stewards – it helps shape them in real time, through experience.
Collective action in motion
The organization’s reach extends well beyond the maritime world. Through community-driven cleanups and outreach efforts, SeaKeepers has built a growing network of volunteers united by a shared goal: protecting the ocean from land to sea. To date, the organization has supported over 270 cleanups, engaged nearly 10,000 volunteers and helped remove more than 36,000 pounds (approx. 16,330kg) of marine debris from coastlines and waterways. The numbers reflect not just scale, but sustained participation – people returning again and again because they want to be part of tangible change.
Importantly, this work is not limited to the boating community. While vessels are a key platform for SeaKeepers’ scientific programmes, its community efforts are designed to be open and accessible to anyone. Students, families, local groups and individuals all play a role, reinforcing the idea that ocean conservation is not confined to those on the water; it is something everyone can contribute to, wherever they are.
Connecting science, partners and opportunities
SeaKeepers works closely with academic institutions, NGOs and research partners around the world to identify meaningful opportunities for its boating community to engage in real-world science. To make these opportunities accessible, SeaKeepers features
them on its website where they are shared with the Discovery Fleet, with clear details on location, requirements and the scientific background of each programme. The details include how the data will be used, published or contribute to future research. This approach allows boaters to better understand the scope of available work and choose opportunities that align with their interests and time at sea.
Looking ahead
SeaKeepers represents more than a shift in how ocean science is done. It reflects a new way of thinking about who gets to take part in it. By transforming time at sea into opportunities for discovery, education and conservation, the organization shows how everyday maritime activity can be mobilized for meaningful global impact.
Ivonne Gamboa holds a bachelor’s degree in Communications and a master’s degree in Marketing. She has been with SeaKeepers for the past seven years, where she currently serves as head of marketing. With her marketing background and experience in customer satisfaction and the non-profit sector, she focuses on informing and engaging supporters to strengthen the organization’s mission of advancing ocean science, conservation and education.
To get involved, contribute and become part of something larger than a single voyage: www.seakeepers.org
SeaKeepers facilitates a 3D mapping and survey of the 1000 Mermaids artificial reef aboard the SeaKeepers vessel DISCOVERY II & III
About the author
Unlocking the full potential of water column data
MBES as a practical tool for seepage impact assessments
By Peter Urban, Laurens van der Marel and Geert de Bruin
Recent research demonstrates that multibeam echosounder (MBES) water column data deserves closer attention from the hydrographic community, particularly for the remote estimation of underwater gas emissions. Although these acoustic estimates may initially appear coarse and require expertise in acoustic calibration, they enable cost-effective classification of seepage sites and scale efficiently to large areas with numerous bubble streams. This article explains how these measurements became possible and how they were validated.
Gas release from the seabed occurs in many forms, ranging from natural methane seepage to leakage from abandoned wells and subsea infrastructure. Multibeam echosounders (MBESs) that record water column data are proven tools for detecting marine gas bubble releases. They are used by scientists and professionals alike to map natural seeps and assess leaks from pipelines, wells or (future) carbon storage sites. The good area coverage and widespread availability on survey vessels makes them a practical choice for such investigations.
However, while detecting bubble release (Figure 1) is important, it is only the first step in gas seepage investigations and is often insufficient for decision-making. The real questions are: How much gas is being released? Does the seepage matter? Are further investigation or actions of any kind required? And, if so, where should efforts be focused?
The importance of quantifying gas release
Quantitative information enables prioritization: determining which sites matter most, which leaks warrant further investigation, and how emissions evolve over time. To answer these questions, data is traditionally obtained through direct in-situ measurements using remotely operated vehicles (ROVs) (Figure 2) or seabed landers. These methods can be accurate, but they are also expensive, operationally complex and do not scale well to investigate hundreds or even only dozens of bubble streams.
Multibeam echosounders, on the other hand, provide good area coverage and are already used to detect the seepage. Using them for quantification as well would minimize the need for these expensive operations. This would enable faster and more flexible gas emission monitoring, which could also be carried out from smaller vessels at significantly lower costs.
From plume counting to estimating gas flow
Gas bubbles are clearly visible in multibeam water column data as vertical columns of enhanced backscatter (which is also shown in Figure 1), known as acoustic plumes. These plumes are typically straightforward to identify, but their interpretation has been mostly qualitative (i.e. counting, describing size and/or shape).
It has long been established that the collective acoustic backscattering of a
column of gas bubbles can be used to estimate the gas flow of that plume if the statistical distribution of released bubble sizes is known. This inversion of the acoustic signals is based on a fundamental principle called echo integration, which is widely used in fisheries science to estimate fish stocks. However, applying echo integration to multibeam measurements of gas plumes is not straightforward. The overlapping and chaotic arrangement of acoustic samples smears the signal over multiple pixels, making it challenging to combine these measurements without introducing biases from factors like survey speed, depth or beam angle.
To address this, a new principle that integrates acoustic values on a threedimensional voxel grid and is referred to as ‘echo grid integration’ was developed at GEOMAR, Germany. Simulations confirmed that the echo grid-integrated acoustic energy
1: Bubble streams are easier to detect in acoustic data than in underwater video (right image). Quantification integrates a depth layer from the acoustic data. (Image/data courtesy: NIOZ/ TNO)
Figure
Figure 2: Quantifying gas release using an ROV-deployed inverted funnel is time-consuming per bubble stream and requires an ROV-capable vessel. (Image courtesy: NIOZ/TNO)
from a bubble stream scales linearly with the volumetric gas flow passing through horizontal layers of the water column. The main practical challenges of this approach are assumptions about stable bubble size distributions across varying flow rates and a requirement for acoustically calibrated multibeam systems.
Calibration challenges
Acoustic calibration means establishing a reliable reference for backscatter levels, which can vary due to differences between systems, transducer aging or changes in water temperature. The echo grid integration method enables quantitative comparisons of bubble streams from the same acoustic survey, even without calibration. For instance, it can determine that one bubble stream may release twice as much gas as another, assuming similar bubble sizes. Calibration, however, extends this capability by allowing comparisons between bubble stream measurements from different surveys and systems. Furthermore, calibration against an absolute reference enables the conversion of relative acoustic measurements into absolute gas flow estimates.
Several practical calibration approaches are available, though no single, universally simple method exists yet. Previous work combined multibeam data with simultaneous measurements from a calibrated singlebeam echosounder by targeting the same bubble stream or by using layers of high background turbidity. Another approach involves using seafloor reference areas where backscatter levels are stable. The most straightforward method is direct calibration against known gas flow rates from controlled bubble releases, although this requires the capability to deploy such a source in the field.
Bubble size uncertainty
While calibration addresses system-related variability, another critical factor in acoustic inversion is bubble size. Bubble sizes represent the largest source of uncertainty in acoustic measurements because acoustic backscattering does not increase linearly with bubble volume. As a result, gas sources with larger bubbles produce less signal per unit of released gas volume. To address this, reasonable limits for minimum and maximum bubble sizes must be estimated using cameras, passive acoustic hydrophones or literature values.
If bubble sizes are not measured directly, the resulting uncertainty can be significant and may reach a factor of two or more. However, even with this uncertainty, acoustic methods provide more accuracy than simple visual classification. With literature-based estimates for realistic bubble sizes, it is typically possible to constrain the flow to the right order of magnitude. For example, a weak seep releasing 50ml/min might be estimated between 20 and 150ml/min, but this uncertainty interval remains sufficient to distinguish it from bubble streams that release 200ml/min or more. With sufficient demand for developing practical methods, these uncertainties could be reduced further in the future. One option would be the remote estimation of bubble size distributions using broadband or multifrequency acoustic devices.
Validation through controlled field experiments
To move beyond theoretical feasibility, the method was tested in a field experiment carried out in collaboration with TNO and NIOZ in the Dutch North Sea (Figure 3). A seabed-deployed bubble generator produced gas plumes of consistent bubble size with adjustable flow rates. Independent measurements provided ground-truth reference
values for the actual gas release. During these experiments, bubble plumes were surveyed using a ship-mounted multibeam echosounder, the Kongsberg EM2040, and processed using the quantitative integration framework. The resulting flow rate estimates were compared directly with the known release rates.
Preliminary results showed a clear and reproducible linear relationship between
integrated multibeam backscatter and gas flow rate. For the tested conditions, deviations were on the order of 10%.
These experimental results provide strong empirical evidence that modern multibeam systems are capable of quantitative gas measurements under realistic survey conditions. Ongoing research at TNO and NIOZ is currently validating the bubble backscatter modelling by comparing measurements from two different bubble
sizes released by this lander. Once verified, the achieved calibration will be part of a larger work focused on estimating the gas flow from abandoned wells in the Dutch North Sea.
Conclusion
Water column data represents a valuable and often underused information source. In the right context, it can provide quantitative answers to questions that were previously
Further reading
Urban et al. (2017), Processing of multibeam water column image data for automated bubble/seep detection and repeated mapping, Limnol. Oceanogr. Methods, 15(1), 1-21, doi.org/10.1002/ lom3.10138
Urban et al. (2023), Echo grid integration: A novel method for preprocessing multibeam water column data to quantify underwater gas bubble emissions, Limnol. Oceanogr. Methods, lom3.10552, doi.org/10.1002/lom3.10552
Urban et al. (2023), Combining multibeam and singlebeam echosounders for quantifying gas bubble release from the seafloor, Limnol. Oceanogr. Methods, 24(2), e10722, doi. org/10.1002/lom3.10722
De Bruin et al. (2025), Methane leakage from abandoned wells in the Dutch North Sea, Mar. Pet. Geol., 171, 107184, doi.org/10.1016/j. marpetgeo.2024.107184
Presentation by Peter Urban et al. (2025), Quantifying gas bubble seepage using multibeam echosounders: a scalable workflow for monitoring, Methane Emissions in the North Sea Symposium, Utrecht, the Netherlands, www.nlog.nl/ media/3613
Poster by Laurens van der Marel et al. (2025), Calibration of multibeam echosounder bubble plume measurements using a controlled bubble plume generator, Methane Emissions in the North Sea Symposium, Utrecht, the Netherlands, 13-14 November 2025, www.nlog.nl/media/3613
Figure 3: NIOZ bubble generator producing bubbles at known flow rates at ~30m depth in the Dutch North Sea. (Image courtesy: Laurens van der Marel / TNO)
Figure 4: Gas plume positions (left) show locations but not flow rates. Quantitative multibeam estimates enable comparison and prioritization. 98% of the gas flow comes from the nine highlighted areas. (Illustration adapted from Urban et al. (2025) CC By 4.0)
considered outside the scope of acoustic surveys (Figure 4).
Quantitative multibeam approaches are particularly attractive where spatial coverage and efficiency matter. Large areas can be screened for emissions and temporal changes can be monitored. An important aspect is that the most interesting and important sites can be identified before deploying more expensive in-situ techniques.
The discussed method is not yet a push-button solution and requires careful planning, calibration and expert interpretation. When these conditions are met, however, it delivers substantial gains in spatial coverage, efficiency and cost reduction for marine bubble seepage assessments. Future advancements will further improve the accessibility of quantitative multibeam measurements, potentially enabling seepage assessment as part of routine hydrographic operations.
About the authors
Peter Urban is a hydroacoustic researcher at Ghent University, Belgium, and an independent consultant through Urcoustics in the Netherlands. He specializes in quantitative multibeam water column acoustics and highperformance data processing software to enable scalable marine monitoring solutions.
Laurens van der Marel graduated from the Ocean Technology course (Cat A) at the MIWB. After working as a hydrographic surveyor, he pursued a master’s degree in Earth Sciences at University Utrecht to bridge field data acquisition with data analysis.
Geert de Bruin is a geoscientist at TNO - Geological Survey of the Netherlands, where he works on shallow gas, methane emissions and subsurface geology. He is pursuing a PhD on methane leakage from abandoned wells in the Dutch North Sea at NIOZ, the Royal Netherlands Institute for Sea Research.
The pivotal role of technology in wind farm inspection and monitoring
Maximizing offshore wind lifespan with operations and maintenance
By Joe McCabe, Fugro
Thanks to major advances in both the technological methods used and the richness of the datasets available on the condition of wind farms, it is becoming easier for developers and operators to look beyond daily operations and take steps to ensure the long-term structural health of their assets. This supports the scaling up of overall energy production from offshore wind, which –alongside planning and constructing new capacity – will require the uptime and lifespan of the existing infrastructure to be maximized and extended.
The offshore wind industry continues to make steady progress to become a larger part of the global energy mix. While it is still an industry finding its feet and maturing in terms of its processes and structures, capacity is scaling up. The latest data from the Global Wind Energy Council (GWEC) found 2024 to be a record year for offshore wind construction, with 8GW of grid-connected capacity added worldwide. It also forecasts a compound average growth rate of 21% for
the industry, equating to 350GW of capacity to be added over the next decade.
As offshore wind portfolios expand, developers and operators – along with the broader supply chain – face mounting pressure to reduce the levelized cost of energy (LCOE) and deliver financially viable alternatives to fossil fuels. Achieving this is critical for meeting government-set net-zero targets and will require meaningful support through
government-backed incentives. As the ratio between total discounted lifetime cost and total discounted lifetime production, LCOE is the ‘holy grail’ in the offshore industry. It is relied upon by wind farm operators to demonstrate that they can provide the most cost-efficient solution in a highly competitive arena.
A changing O&M mindset
In offshore wind, operations and maintenance (O&M) has historically been
F ugro’s jack-up barge Excalibur at work in the North Sea. (Image courtesy: Fugro)
seen as a reactive function, with remedial work carried out only after damage to infrastructure. The market focus was primarily on reducing upfront capital expenditure, with operational expenditure (OPEX) receiving less attention. But in the face of new expectations placed on the industry, and with a more detailed understanding of the causes and impacts of offshore wind failures, mindsets are changing. The downtime and delays of the past are no longer acceptable, and O&M is now increasingly seen as offering real preventative value by identifying potential issues before they escalate. Asset monitoring, as part of a wider, more robust O&M strategy, is a prime example. This enables operators to maximize uptime and extend the overall lifespan of wind farms, while positively contributing to project OPEX.
Offshore conditions are notoriously unforgiving, and even more so in the case of floating wind farms located further out at sea. Wind farm operators must not only contend with continually shifting environments, but also ageing structures. They therefore need assurances that the benefits of wind farm developments will not be overshadowed by high O&M costs during an asset’s lifetime. To that end, a robust inspection and monitoring programme to identify and correct issues such as fatigue, corrosion and marine scour is vital to help ensure remediation work takes place before the asset’s integrity and – eventually – uptime is adversely impacted.
Inspection and monitoring technology
Technology plays a pivotal role in monitoring the condition of wind farms to keep them operational. Thanks to major advances in both the methods used and the richness of the datasets available on the condition of wind farms, it has been possible to reduce the frequency of subsea inspections. Automated data delivery, alongside visualization capabilities, now provides realtime access to data and supports continuous remote monitoring of assets.
To further enhance O&M insights, operators should also consider the long-term benefit of creating a digital twin of their offshore asset. This would integrate all the available geospatial data gathered from site investigations, asset inspections and monitoring.
More informed decision-making
With a rich dataset of this kind in place, decisions can be made much more quickly, and condition-based and preventative maintenance can be decided on a per-
turbine basis. Rather than selecting turbines at random to meet an acceptable inspection quota, operators can connect insights from geodata and inspection data to optimize the inspection regime.
Challenges when designing and locating wind farms
The design and location of wind farms can significantly influence the types of vulnerabilities that can emerge. Some examples include:
Marine scour: Water movement strips away sediment, leading to structural fatigue over time. Monopile foundations in shallow, high-current zones are particularly susceptible to scour.
Subsea cabling: Geographic factors such as continuous seabed mobility – the gradual shifting of sediment caused by wave and current action – can result in cable burial, exposure or displacement, potentially pushing systems beyond their operational limits. A cable may have been adequately buried at installation, but sections can become exposed months or years later, leaving them vulnerable to environmental degradation and external interference. Activities such as fishing and anchoring can inadvertently damage exposed cables. Frequent inspection and monitoring, along with close coordination with other seabed users, is essential to ensure adequate protection of affected sections.
Proximity-related challenges: When wind farms are built close to one another or near infrastructure from other sectors such as oil & gas or telecommunications, a range of O&M-related risks can emerge, including interference, vessel congestion and cable strikes. For example, the ‘wake effect’ reduces the wind speed behind turbines, directly impacting the energy output of nearby installations. Disputes over asset positioning are already becoming more common globally, and proximity-related challenges are expected to intensify in the coming years as the industry continues to grow. This underscores the importance of accurate measurement and modelling to support effective planning and mitigation.
Offshore wind infrastructure in the outer Thames Estuary. (Image courtesy: Fugro)
In an area of high seabed movement, for example, operators may decide to increase the inspection frequency to every two years. Conversely, for turbines in areas where seabed movement is minimal, they may reduce it to every four years. By utilizing the data from structural monitoring sensors embedded within infrastructure, targeted inspections can take place, checking for damage and deformation, or tracking marine growth and corrosion. If unusual vibration levels are detected, for example, the asset can be prioritized in the inspection programme.
The benefits of USVs
Alongside continuous asset monitoring, advances in marine vessel design, connectivity and remote operations have led to options like uncrewed surface vessels (USVs) emerging. These reduce the risk exposure for human crews, as well as transforming how inspection work is carried out, because they make continuous, 24/7 operations possible for extended periods.
USVs also allow for data collection from particularly hard-to-reach areas, whilst also providing contractors the option to carry out multiple scopes of work in one deployment, helping manage costs. Furthermore, by reducing fuel consumption and eliminating the need for large support vessels, USVs support significant reductions in carbon emissions.
About the author
Joe McCabe is Fugro’s global offshore wind solution manager – inspection & monitoring (I&M). This entails leading a team of market-facing experts with responsibilities including driving the strategic roadmap for Fugro’s offshore wind I&M solution, leading the development and application of Fugro’s offshore wind I&M solution portfolio, and overseeing the development of new I&M-related technologies.
Goal: 25 years of operation
Alongside planning and constructing new capacity, scaling up overall energy production from offshore wind will require the uptime and lifespan of the existing infrastructure to be maximized and extended. The goal should be for wind turbines to stay operational beyond 25 years.
The most progress towards this will come from the asset owners that continually push the boundaries. Forward-thinking developers will be those able to look beyond daily operations and take steps to ensure the long-term structural health of their assets. These organizations will see O&M as the source of competitive advantage and a way to maximize capacity factors, control LCOE, and extend asset life. They will gear their O&M strategies more towards riskbased inspection rather than scrambling to respond to emergencies. And extending the lifetime and value of their assets can really pay off for society too. With each additional year existing offshore wind farm capacity stays in operation in the UK alone, approximately 20GWh in renewable energy is generated – the equivalent of powering 14 million homes.
Further reading
Data from the Global Wind Energy Council (GWEC): www.gwec.net/news/ offshore-wind-installed-capacityreaches-83-gw-as-new-report-finds2024-a-record-year-for-constructionand-auctions
Fugro’s remote operations centre in Perth, Australia, where teams monitor and control offshore survey and inspection activities from shore. (Image courtesy: Fugro)
Uncrewed solutions, such as ROVs and USVs, reduce risk exposure for human crews and transform how inspection work is carried out, enabling continuous operations over extended periods.
We proudly present our premium members, the ambassadors of tomorrow's hydrography! Will you be next?
Gold members
Silver members
Bronze members
New!
AskGEOrge - your helpful
AI assistant for all surveying and geospatial questions
What factors matter most when choosing a handheld 3D scanner ?
How do I set up an accurate survey in a GNSS-denied environment ?
Which sensor-drone combination is the best fit for coastal mapping ?