Studying urban heat islands in Monterrey
Analysis of urban typologies using drone-based thermal imaging
3D visualization for post-earthquake heritage conservation
The status and future of the aerial camera If geospatial surveyors stopped tomorrow…


Analysis of urban typologies using drone-based thermal imaging
3D visualization for post-earthquake heritage conservation
The status and future of the aerial camera If geospatial surveyors stopped tomorrow…


Exhibitor Highlight Package
Logo on dedicated event page on website of GIM International
Logo and booth number in two extra dedicated Intergeo newsletters
Logo and booth number in GIM International Trail
1/4-page ad in Intergeo issue of GIM International

Logo on dedicated event page on website of GIM International
Logo and booth number in two extra dedicated Intergeo newsletters
Product spotlight for 1 month on home page and dedicated event page
3 social posts before, during and after the event Targeted remarketing campaign (>500 clicks)
EUR 2,950
1/4-page ad in GIM International Trail for Intergeo EUR 2,500
Logo and booth number in GIM International Trail
Logo and booth number in two extra dedicated Intergeo newsletters
1/2-page ad in GIM International Trail
Director Strategy & Business Development
Durk Haarsma
Financial Director Meine van der Bijl
Technical Editor Huibert-Jan Lekkerkerk
Contributing Editors Dr Rohan Bennett, Lars Langhorst
Head of Content Wim van Wegen
Copy Editor Lynn Radford, Englishproof.nl
Marketing Advisors Myrthe van der Schuit, Sandro Steunebrink
Circulation Manager Adrian Holland
Design Persmanager, The Hague
GIM International, one of the worldwide leading magazines in the geospatial industry, is published five times per year by Geomares. The magazine and related website and newsletter provide topical overviews and reports on the latest news, trends and developments in geomatics all around the world. GIM International is orientated towards a professional and managerial readership, those leading decision making, and has a worldwide circulation.
Subscriptions
GIM International is available five times per year on a subscription basis. Geospatial professionals can subscribe at any time via https://www.gim-international.com/subscribe/ print. Subscriptions will be automatically renewed upon expiry, unless Geomares receives written notification of cancellation at least 60 days before expiry date.
Advertisements
Information about advertising and deadlines are available in the media planner. For more information please contact our marketing advisor: myrthe.van.der.schuit@geomares.nl.
Editorial Contributions
All material submitted to Geomares and relating to GIM International will be treated as unconditionally assigned for publication under copyright subject to the editor’s unrestricted right to edit and offer editorial comment. Geomares assumes no responsibility for unsolicited material or for the accuracy of information thus received. Geomares assumes, in addition, no obligation to return material if not explicitly requested. Contributions must be sent for the attention of the head of content: wim.van.wegen@geomares.nl.
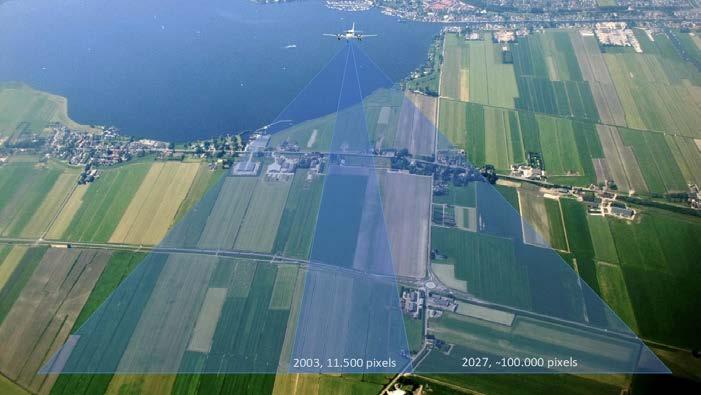
The remarkable evolution of digital airborne cameras began around 2003, with systems capable of capturing 11,500 pixels across the flight direction. Today’s technologies are approaching up to 100,000 pixels across, and there is more to come.
9 12 18 20 24 28 31 32
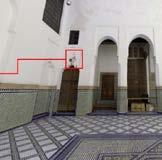
After the 2023 Al Haouz earthquake, a web platform was deployed to remotely assess damage at Morocco’s Dar Si Saïd Museum. The 3D interface unifies point clouds, panoramic views, and expert notes, letting users explore structural damage and generate preservation reports.
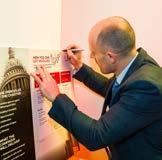
The Survey Association (TSA) is developing the Unity Charter, aiming to give the profession a shared voice, a clearer identity and a coordinated platform for influence. This UK-led initiative has the potential to contribute to a wider international discussion about the attitudes towards geospatial surveyors.
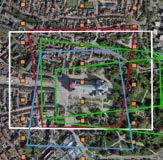
Oblique airborne cameras are a geospatial staple, and demand for highaccuracy 3D products from oblique data is rapidly expanding. This article traces that evolution and how a web-based platform is closing the gaps that once limited oblique imagery for urban management.
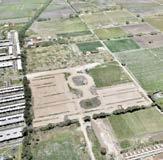
To support the design of pluvial and sanitary drainage infrastructure for a residential development in Mexico, a 1,700-hectare aerial survey was conducted, combining VTOL UAV technology with ground-based methods to overcome challenges related to terrain, sparse vegetation and atmospheric conditions.
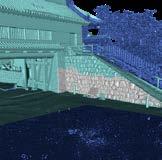
Using a combination of three scanning systems to produce a single, continuous point cloud, a team of 3D scanning engineers has completed a comprehensive digital survey of Odawara Castle, one of Japan’s most storied feudal landmarks.
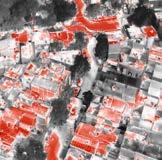
A Mexico-based study used thermal camera-equipped drones and geospatial analysis to measure and develop mitigation strategies for urban heat islands (UHI) – a phenomenon where rapid urbanization causes cities to run significantly hotter than surrounding rural areas.
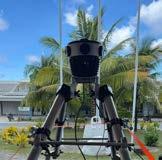
At just 26km² of low-lying coral atolls, Tuvalu faces an existential climate crisis. The island nation is now creating a georeferenced digital twin as evidence and collective memory of land that may be underwater within decades.
Geomares
The Netherlands
T: +31 (0) 514-56 18 54
F: +31 (0) 514-56 38 98 gim-international@geomares.nl www.gim-international.com
No material may be reproduced in whole or in part without written permission of Geomares. Copyright © 2026, Geomares, The Netherlands All rights reserved. ISSN 1566-9076
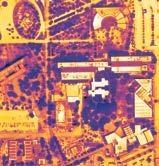
Cover story
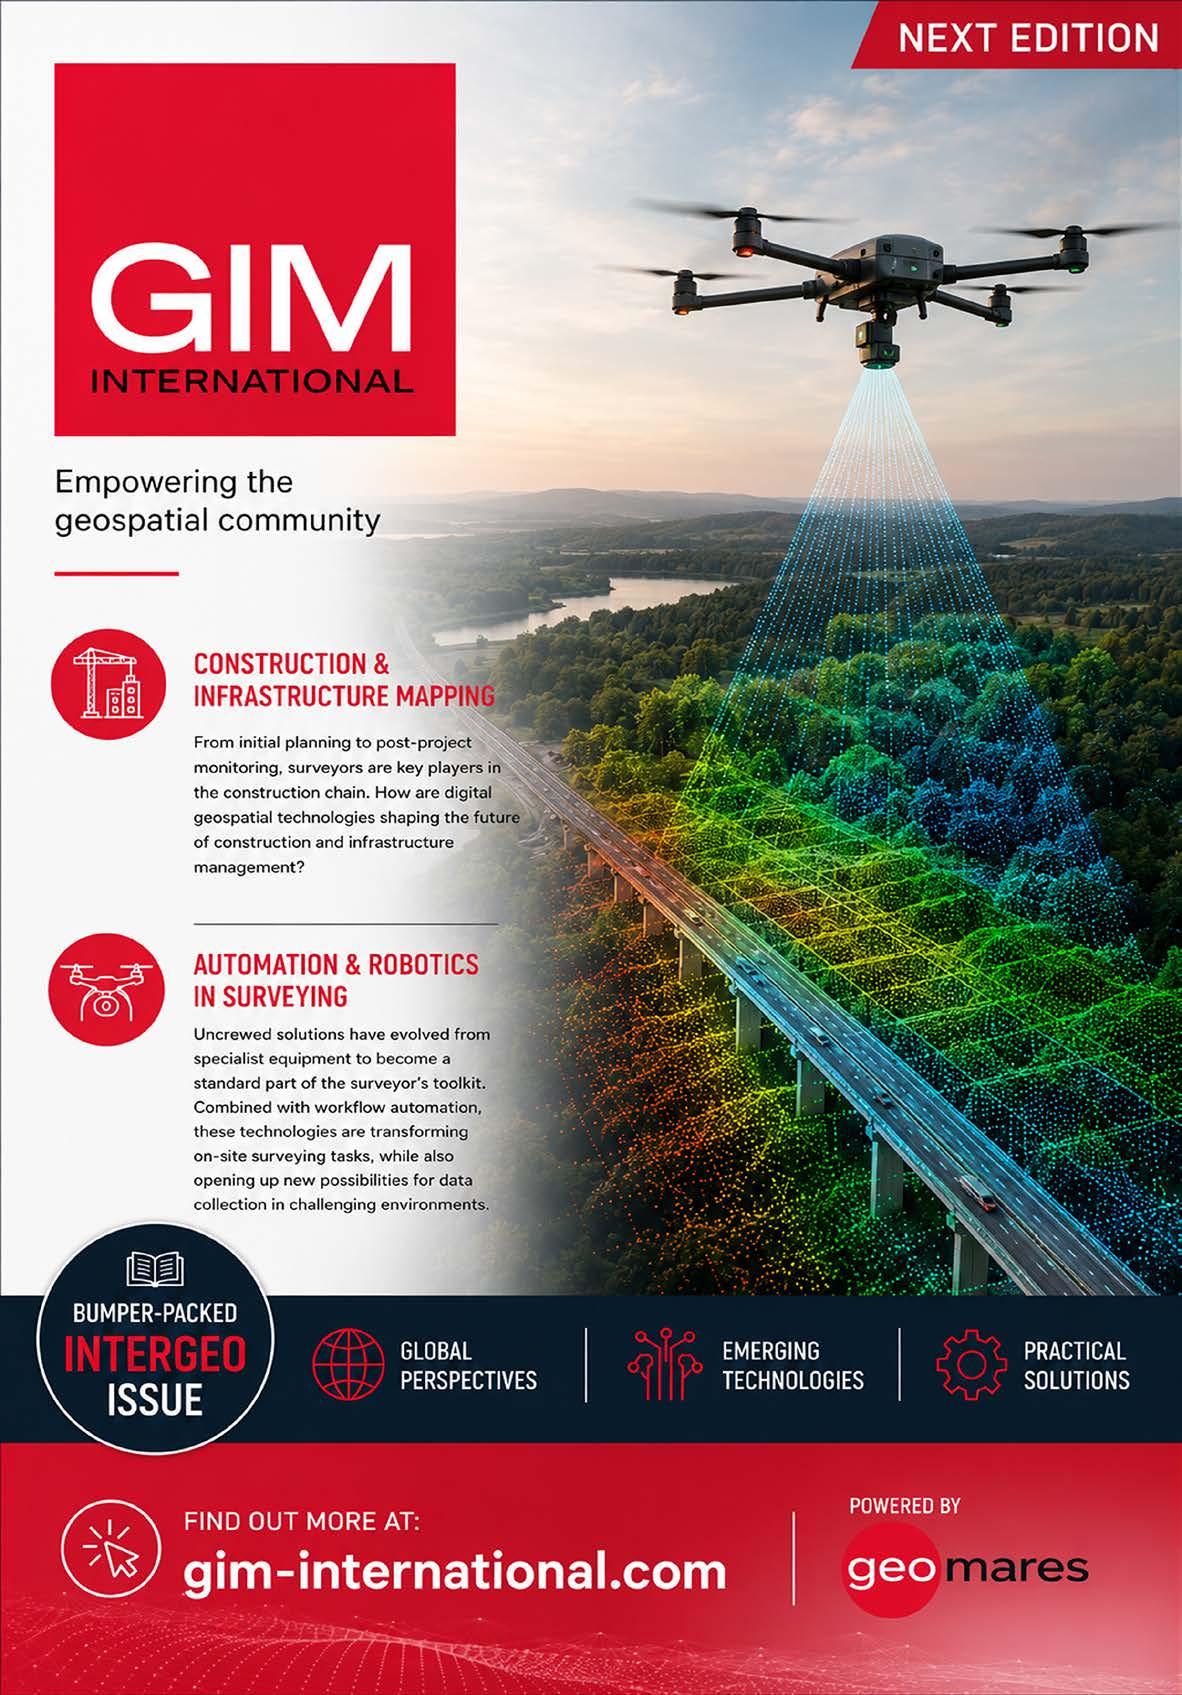
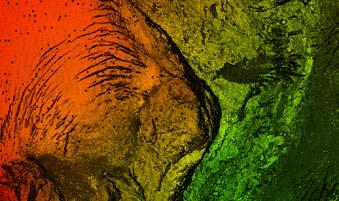
The front cover of this edition features a drone-derived orthomosaic of the Universidad de Monterrey (UDEM) campus in Mexico, revealing surface brightness temperatures spanning from 20°C to 60°C. Urban materials including concrete, metal roofing and asphalt stand out as the most intense heat-emitters. Meanwhile, vegetation – especially dense tree canopy –quietly works to steady the local microclimate.

We proudly present our premium members, the ambassadors of tomorrow's geomatics! Will you be next?










































“A well-functioning land administration system is the foundation of national stability and social welfare. A government can make a thousand promises, but without an efficient cadastre, those promises remain rather hollow.” I wrote that in GIM International eight years ago and, today, I have no desire to retract a single word. If anything, the intervening years have only deepened my conviction.
Fundamentally, nothing has changed. Unclear land rights are still fuelling conflict and poverty. Rural to urban migration is still producing overpopulated settlements with little legal certainty for the inhabitants. Too many countries still lack the spatial data infrastructure needed to establish who owns what, where. Hernando de Soto’s famous provocation – “Why do we insist it will take 80 years to build land recording systems, when we could do it in 20?” – remains as relevant and uncomfortable as ever.
But what gives me genuine hope is the quality and creativity of the work to reinforce the role of high-quality location data as the backbone of any functioning cadastral system. Consider, for example, what has been achieved in Benin. The Land Administration Modernization Project, supported by the Netherlands and driven by Kadaster International, VNG and local partners, showed that ‘fit for purpose’ doesn’t mean ‘second rate’. By involving local communities, using low-budget GNSS receivers and establishing presumed ownership as a pragmatic first step, the project registered more than 450,000 parcels in a three-year timeframe, building the foundation for a nationwide digital land registry from almost nothing. Geospatial data was the engine for this effort.
Similarly, in Ghana’s Western Region, a project to prepare a cadastral plan for 21,000 acres of mountainous, densely vegetated land was completed in just four months rather than the expected 20. The surveying team achieved this by putting geospatial data at the very centre of their approach. Local townsfolk were trained in Google Earth, GPS-enabled mobile apps and digital data collection tools. They navigated to boundary points using smartphones, captured parcel coordinates in the field and uploaded everything to a GIS database at the end of each working day. This is what it looks like when geospatial data is treated not as ‘nice to have’, but as the foundational layer for everything else.
The technical frontier continues to advance too. Research conducted by the University of Twente and Kadaster, presented through the CadastreVision benchmark dataset and the CadNet deep learning model, points towards a future where satellite and aerial imagery can dramatically accelerate cadastral boundary extraction, reducing manual effort, improving accuracy and bringing fit-forpurpose land administration within reach for all.
These examples remind me why I keep writing about this topic. The tools evolve, the collaborations grow more sophisticated, and the community’s understanding of what is possible expands year on year. But the underlying truth remains stubbornly constant: you can’t build a fair, prosperous and well-governed society without first knowing who holds rights to the land beneath it – and you can’t know that without solid geospatial data.
Some things are worth repeating. I believe this is one of them.
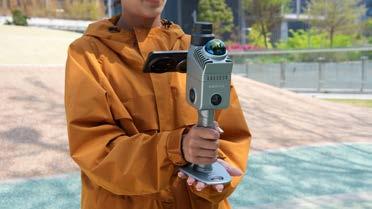
To address one of field surveying’s most persistent frustrations – the dependence on poles and data collectors – ComNav Technology has introduced the Mercury Laser RTK handheld GNSS measurement device. The product is the latest addition to the company’s SinoGNSS Universal Series. The device brings together GNSS positioning, laser measurement and inertial measurement unit (IMU) technology on a single platform, built around ComNav’s new K9 chip architecture. Its laser range extends to 50 metres, and an integrated long-focus camera supports remote operation. Connectivity options include Wi-Fi, Bluetooth and 4G. At approximately 500g and small enough to fit in a vehicle cup holder or a jacket pocket, the Mercury is a notably compact instrument for surveying-grade work. The Auto-IMU function initializes during movement, removing the need for a stationary calibration step, while a quick capture button and automatic image recording with coordinate logging keep data collection efficient in the field. A real-time laser visualization feature displays measurement points directly on screen, helping operators confirm positions and locate targets without the back and forth of traditional setups.

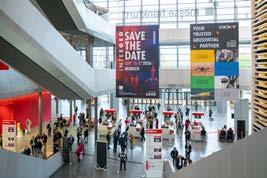
For the first time at Intergeo, all keynotes are open to every ticket holder, not just conference delegates. (Image courtesy: Nico Herzog Fotografie)
Intergeo 2026 will arrive this September as the sector’s principal forum for all the challenges facing the geospatial industry, just as it has for decades. This year, the sector is convening in Munich against a backdrop of mounting pressure: governments racing to digitize infrastructure, cities grappling with climate risk, and an AI wave reshaping how location data is collected, interpreted and acted upon. To bridge the gap between conference and expo, all ticket holders can attend the keynote addresses this year. Few industry gatherings can match the breadth of Intergeo. The three-day event, running from 15-17 September 2026 at Messe München, draws together geodesy professionals, software vendors, public-sector users and researchers under a single roof. This year’s edition has an even sharper focus around practical applications: digital twins, reality capture, geodata infrastructure, and the use of location intelligence in areas ranging from mobility planning to environmental management. One of the more striking structural changes this year concerns access. For the first time, the conference’s opening session and all keynote addresses will be open to every ticket holder rather than just registered conference delegates. The move is a deliberate attempt to bridge the expo and conference tracks, communities that have historically operated in parallel. Among the keynote speakers is Jack Dangermond, the founder and president of Esri, whose influence on the geographic information systems field spans more than five decades.
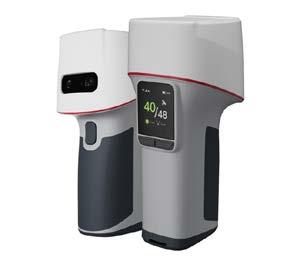
ComNav’s Mercury Laser RTK brings together GNSS positioning, laser measurement and IMU technology on a single platform. (Image courtesy: ComNav Technology)
After rigorously validating the Leica TerrainMapper-3, including while aerial mapping Mount Rainier, NV5 has integrated the system into its airborne survey fleet. The evaluation programme put it through some of the most demanding conditions yet, such as linear corridors and dense urban environments as well as steep mountain slopes. For field teams, the challenge has always been matching scan geometry to the ground. Complex topography forces a choice between multiple flight passes and the coverage gaps that slow down post-processing. The TerrainMapper-3 changes that equation with a configurable scan architecture – circular, elliptical and skew ellipse modes – that lets operators dial in the right pattern before wheels leave the runway. NV5 subjected the Leica TerrainMapper-3 to rigorous realworld validation across a broad range of production environments and terrain types, assessing data quality, system reliability, integration efficiency, processing throughput and overall acquisition performance. Among the most demanding tests was an aerial mapping project covering the Mount Rainier area in Washington State, USA – a region defined by glaciated slopes, steep gradients and more than 4,000 metres of elevation change from valley floor to summit. The project put the TerrainMapper-3’s configurable scan patterns under pressure, confirming the system’s ability to sustain point density and coverage across extreme elevation shifts while reducing redundant flight passes. The results translated directly to operational gains: faster acquisition cycles, lower mission costs and highquality data outputs supporting hazard modelling, emergency planning and public safety applications.
Equipped with a Lidar sensor offering a 60° field of view and three adaptable scan patterns, the Leica TerrainMapper-3 is further augmented by the Leica MFC250 camera system. (Image courtesy: Hexagon/Leica Geosystems)
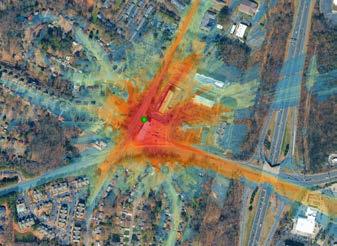
To transform people’s understanding and decision-making about the planet, the Google Maps Platform is increasingly leveraging innovation from the advanced geospatial artificial intelligence in Google Earth AI to expand its Imagery Insights portfolio. To complement Street View Insights, the firm has now announced the launch of an experimental version of Earth AI-powered Aerial and Satellite Insights based on high-resolution 3D imagery. According to Google, Aerial and Satellite Insights will put global, high-resolution imagery at people’s fingertips and broaden analysis from the fine details of a city street to a bird’s-eye view of the planet. Through the high resolution and angular view diversity of 3D aerial imagery or the flexible freshness of high-resolution satellite imagery, users will be empowered to make data-driven decisions at any scale covering a wide range of tasks. Aerial and Satellite Insights is integrated with Gemini Enterprise Agent Platform, enabling operational scaling while reducing in-the-field presence, risk and costs. Moreover, by utilizing BigQuery and Earth Engine, users can combine their proprietary data with high-resolution imagery context for detailed spatial analysis. To expand the Google Maps catalogue of aerial and satellite imagery and bring Aerial and Satellite Insights to organizations at scale, the firm has partnered with Airbus and Vexcel.
A new handheld reality capture instrument from XGrids, the Lixel K2, made its debut at 3DISE in Prague, the Czech Republic, in early May. Together with the release of LixelStudio 4.0, this illustrates that XGrids is striving to set a new benchmark for engineering-grade point cloud data. Weighing approximately 1.2kg, the Lixel K2 is a compact, lightweight scanner designed for extended field use without the complexity associated with traditional survey-grade equipment. Positioned as a portable solution for precision outputs and high-quality 3D Gaussian Splatting, it combines integrated cameras with Lidar technology to generate realistic, measurable 3D representations of the surrounding environment in real time. With a relative accuracy of up to 1cm and a point cloud density of less than 1cm, walls, openings, structures and objects are rendered with a high degree of sharpness and definition. The device is aimed at professionals across a broad range of sectors, including surveying, construction, real estate, heritage documentation, inspection and volume measurement. Whether measuring a building interior, scanning a site or calculating stockpile volumes, the K2 is designed to deliver reliable data without requiring complex workflows or specialist processing knowledge.
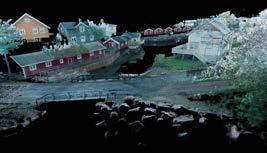
In what Ouster describes as the most significant advancement in Lidar’s history, it has recently unveiled Rev8, a new family of digital Lidar sensors. Powered by its next-generation L4 Ouster Silicon, the company claims this is the world’s first native colour Lidar. At the heart of the announcement is a fundamental shift in how colour and depth data are acquired. Rather than fusing camera imagery and point cloud geometry in post-processing, Rev8 captures both in a single photon event. Every point is generated with 48-bit colour and 3D geometry simultaneously, eliminating the calibration overhead and temporal misalignment that has long complicated multi-sensor workflows in mapping and SLAM applications. “Rev8 sets a new standard in sensing,” said Ouster CEO Angus Pacala. “With the L4 Ouster Silicon, we are delivering on the promise of our digital architecture to deliver exponential improvements in performance, doubling our core specs and simultaneously introducing the world’s first native colour Lidar to give machines 3D human-like sight for the next era of Physical AI.” For geospatial professionals, the implications for mobile mapping and reality capture are considerable. SLAM workflows that previously required separate Lidar and camera passes, followed by time-consuming fusion and drift correction in postprocessing, can now be executed in a single pass with a single sensor. Ouster demonstrated this capability using the OS1 Max in Lofoten, Norway, where the resulting colourized point cloud so closely resembled a photograph that the company used it to highlight the sensor’s colour fidelity and spatial accuracy.
To lower the barrier to entry for firms seeking a more efficient path from raw scan data to Revit-ready as-built models, ClearEdge3D has introduced a new licensing tier within its EdgeWise platform. The release of EdgeWise Lite marks a strategic expansion of the company’s product portfolio, aimed at broadening access to semi-automated point cloud modelling for architecture, engineering and construction (AEC) professionals. The new tier addresses a clear gap in the market: AEC professionals who require a reliable, streamlined workflow between point cloud and as-built model, but for whom existing solutions have fallen short on flexibility, whether in terms of project volume or cost structure. The workflow is straightforward: select features in a point cloud, extract geometry fit to standards and specifications, verify accuracy, and export native models directly to Revit. EdgeWise Lite supports six element types – pipe, structure, ducts, conduit, cable trays and walls – and is compatible with a wide range of SLAM and TLS point cloud datasets.
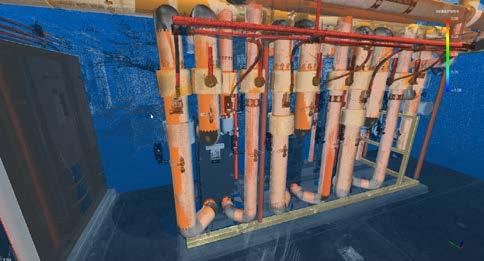
ClearEdge3D, a Topcon company, has expanded its EdgeWise platform with the introduction of EdgeWise Lite.
The World Geospatial Industry Council (WGIC) has announced its support for the Executive Doctor of Geospatial Leadership (DGEO), the first professional doctorate of its kind, to be offered jointly by Clark University and the University of Southern California, USA. The announcement was made at WGIC’s Horizons 2026 conference in London, UK. Developed in collaboration with WGIC and more than 50 member organizations, including Esri, Oracle, Amazon Web Services, TomTom, Trimble and Hexagon, the programme is aimed at mid-career professionals and will be delivered in a low-residency, cohort-based format. It is scheduled to begin in summer 2027. The doctorate addresses a recognized leadership gap in the geospatial sector. Graduates are expected to combine technical expertise with executive capability, preparing them to lead organizations that rely on geospatial technology, a field that underpins a broad range of industries including insurance, logistics, urban planning, agriculture and environmental monitoring. The initiative reflects WGIC’s ongoing commitment to geospatial workforce development. WGIC encourages its member organizations to support the development of the DGEO programmes, engage in doctoral capstone projects and classroom experiences to connect academic learning with industry practice, and help build worldwide recognition and demand for the degree.
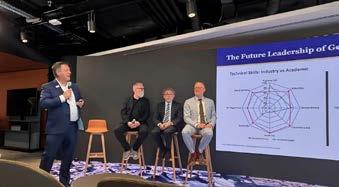
annual event, Horizons 2026, in London.
courtesy: World Geospatial Industry Council)
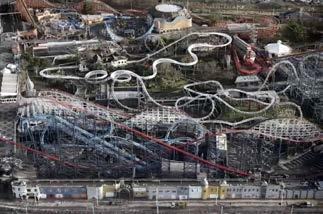
Marking the first time the iconic British seaside amusement park has been digitally mapped at this level of detail, Lancashire Fire and Rescue Service (LFRS) has created a detailed 3D model of Blackpool Pleasure Beach. The project was carried out in partnership with Ordnance Survey and the Lancashire Resilience Forum. Located on the northwest coast of England, Blackpool Pleasure Beach has drawn visitors since 1896 and now attracts over five million people a year. Its compact footprint of 125 rides and attractions, including structures such as The Big One rollercoaster reaching up to 65 metres in height, make traditional 2D maps inadequate for planning safe access routes, evacuation paths and staging areas. To address this, Ordnance Survey (OS), the UK’s national mapping agency, trained LFRS operators in aerial drone mapping techniques. This allowed the local fire service to capture high-overlap imagery of the entire site and process it into a high-resolution 3D mesh. The model was then extended to cover the surrounding town using existing OS data, creating a seamless digital environment for multi-agency planning and training. Tim Murrell, drone manager at LFRS and drone and robotics lead at the National Fire Chiefs Council, described the project as a step forward in capability. While his team had been operating drones for a decade, he said the complexity of the Pleasure Beach site pushed their techniques further. According to him, Ordnance Survey’s expertise in UAS mapping was “pivotal in allowing us to safely and effectively map the site”. The result, he added, provides “a highly visual platform for shared situational awareness”.
By Poul Nørgård, Denmark
The remarkable evolution of digital airborne cameras began around 2003, with systems capable of capturing 11,500 pixels across the flight direction. Today’s technologies are approaching up to 100,000 pixels across, and there is more to come. Looking ahead, the potential for even higher resolutions and more advanced capabilities is immense. With compact electronic camera units likely to gradually take over, it is time for the industry to rethink how aerial cameras for mapping are designed and used.
Today, aerial camera systems for photogrammetry are diverging into two main categories: systems for photogrammetry, and specialized systems for content programmes. The traditional photogrammetry approach is modernized but still with the same basic demands for cameras and processing as in the 1980s. For content, the diversity is significant with camera systems and processing both advancing strongly. The number of specialized camera systems already exceeds that of traditional cameras, and they often feature simpler workflows focused on fast, frequently fully automated processing.
At a fundamental level, all camera systems are inspired by the structure of the human eye. They consist of three core components: the image sensor (analogous to the retina), the lens (with the aperture mimicking the iris) and intelligent processing, where software interprets and extracts meaning from captured imagery (comparable to the brain’s visual cortex).
With this framework in mind, this article examines each of these elements, considers future developments and provides some practical guidance. The focus is specifically on airborne camera systems. While satellites and drones are also important imaging platforms, they involve significantly different
operational conditions and will be addressed separately.
From the very beginning, digital cameras have been able to match the performance of analogue systems. The first images from the Vexcel UltraCam D were truly impressive, marking a significant leap forward in quality. It also introduced simultaneous near-infrared (NIR) capture, which was a major advantage. At that time, the pixel size was 9µm. Today, pixel sizes have been reduced to less than one third of that, while achieving significantly higher sensitivity.
Photogrammetric cameras are complex systems that merge data from multiple sensors – colour, monochrome and
NIR – handled through sophisticated and demanding post-processing into a single eye view. In contrast, modern camera modules have largely standardized sensor technology, most notably the Sony IMX811, which offers 19,200 × 12,800 pixels. A single compact unit can now do what a photogrammetric camera system could do ten years ago. So the question is, do we need to follow the old way with complicated stitching or can we do something better?
In any camera, image quality is influenced by three main settings: ISO, shutter speed, and aperture. The SONY IMX811 sensor can handle the ISO setting electronically. The global shutter sensor IMX661 can, in addition to ISO, handle shutter speed electronically. Combined with a fixed aperture, this results in a fully electronic camera. This is an important next step, as such cameras can capture not just one image, but several with different settings in milliseconds. Gpixel delivers a true alternative to the abovementioned image sensors, but all camera manufacturers currently use the same IMX series.
Along with its mechanical shutter and aperture, the lens is often the most overlooked components of aerial cameras, yet also one of the most technically challenging. As image sensors improve, the demand on the lens increases linearly with the growing number of pixels.
While the optics are the key element in utilizing the increased number of pixels, this seems to be the hardest element for customers to understand. Optics have improved significantly, with better glass, coating and manufacturing, but merely assessing the classic values for lens quality –such as the maximum aperture – is no longer enough. To truly evaluate the quality, the lens must be considered in combination with the image sensor and software.
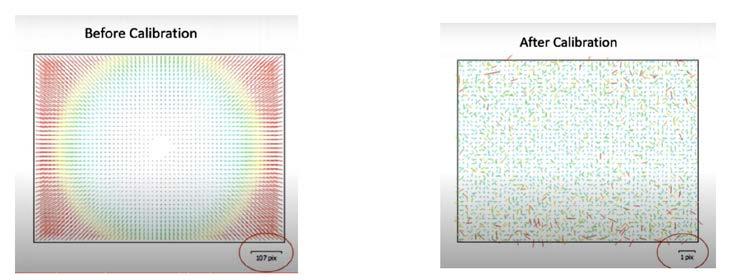
As a physical object, the lens is highly influenced by temperature and pressure. The longer the focal length, the more it is affected, which is why classical calibration remains essential. Lens distortion, even in the best lenses, requires corrections of 50150 pixels to achieve metric accuracy, and both eccentricity and focal length vary with temperature. The most stable parameter is
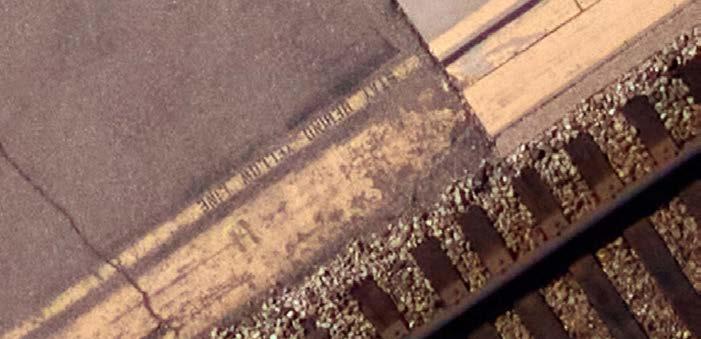
3: An image at 1cm ground sampling distance (GSD)
the distortion pattern (see Figure 2), and the final result remains stable within half a pixel.
Every single camera unit needs calibration, and full-system calibration is needed if several cameras are used. Single-head calibration is typically done in a laboratory, while system calibration is done in the air when the system is ‘warm’ (operational for at least 20 minutes).
In addition to the optics, lenses also include mechanical components such as the aperture and shutter. These are largely based on designs originating from the first analogue cameras. The most common shutters, such as Prontor, have a maximum shutter speed of 1/500s and have been produced in almost the same way for decades. If these two mechanical components could be eliminated, lenses could be smaller, more stable and capable of transmitting more light.
The 250MP Sony sensors and similar models are a significant improvement from the 150MP sensors but are still very traditional in that their rolling shutters expose the sensor line by line. In contrast, global shutter sensors (e.g. IMX661) offer significant new possibilities as they expose the full image at once. Besides enabling electronic control of ISO, they also feature electronic shutters with speeds up to 1/16,000s.
Another important advantage of global shutter sensors is their ability to capture multiple images of the same object in milliseconds. This makes it possible to use
different ISO and shutter speed settings for each image – one optimized for sharpness and another for maximum colour information, for instance – and then combine them. Blur between the images is no longer a problem, even when captured by the fastest aircraft, and image quality is significantly improved in low-light conditions.
The aperture is the only remaining issue to be addressed to achieve a fully electronic camera system. A practical approach to this would be to fix the aperture at a single value and control the amount of light using the shutter speed. This capability can also reduce the need for a dedicated camera operator, as automatic camera settings become easier to implement.
Image processing and adjustment cannot be avoided, but information is lost each time. It is better to say as close to the raw information as possible. Therefore, processing would ideally be limited to a final adjustment of coverage.
The traditional large-format camera consists of up to 12 individual sensors capturing images that are combined into a single image after several advanced adjustments, including calibration. In other words, what is often seen as a single image is far from raw data. Moreover, this is a time-consuming post-processing step that is not possible until after landing. If the single images were to be used from IMX811 or IMX661, for example, they could be processed into a final image on the fly, so the results would be ready upon landing. The new generation of AI processing units could even perform

Poul Nørgård holds an MSc in Surveying, Planning and Land Management (1983) from Aalborg University, Denmark. He specialized in aerial mapping for many years, and was head of aerial mapping at COWI for more than ten years. In 2017, he became product manager at Leica Geosystems, focusing on aerial cameras. In 2020, he continued at Phase One, also as a product manager. He is now retired.
advanced adjustments, enabling the images to be used immediately for purposes such as emergency response.
How aerial images are utilized is changing fast, but traditional photogrammetry is developing slowly. Mesh modelling is increasingly taking over and Gaussian Splatting seems to be the next step. The cameras need to support all these technologies and AI-driven feature extraction. In existing image sensors, we can expect the trend towards more pixels to continue. However, as the major markets for sensors, the focus has shifted to commercial and industrial use and partly for AI.
For aerial mapping, the most important development will be access to fully electronic cameras. They are more electronically stable, more affordable and achieve better performance. Moreover, electronic cameras are more compact. They are also the key to a simplified workflow that retains more basic information from images, making it easier to use machine learning and AI. We are there almost with automatic production of large coverages with a high accuracy; now, we need AI-ready images to enable detection of precisely the right information to meet a specific need.
The human eye is truly impressive, and cameras designed as an ‘electronic eye’ have made a lot of sense so far. But it is time for a different way of thinking. For instance, a fly’s eye (Figure 4) consists of thousands of different sensors, enabling it not only to see beyond our visual spectrum, but also to sense temperature, judge speed and navigate in darkness.
The first step towards this approach could be a freer and easier merging of current image sensors. Sensors with different resolutions, angles, lenses, etc., could be combined more freely using AI’s new processing capabilities. The next step would be to combine sensors outside the visual spectrum (e.g. Lidar, thermal), covering much more than what the human eye can see. This will take time, but it is important to set the wheels in motion now. If the industry only further improves traditional aerial cameras, the future will be challenging. A good starting point would be flexible systems that leverage modern sensors for both photogrammetry and broader content capture.
By Andy Beardsley, UK
Despite underpinning the built environment, the geospatial discipline is still misunderstood, undervalued and inconsistently embedded in decision-making. This disconnect creates tangible risk, from talent shortages and fragmented standards to commercial pressures that undermine quality and long-term outcomes. As a response to these challenges, The Survey Association (TSA) is developing the Unity Charter, aiming to give the profession a shared voice, a clearer identity and a coordinated platform for influence. This UK-led initiative has the potential to contribute to a wider international discussion about the attitudes towards geospatial surveyors. The Charter will provide a shared framework for collaboration, investment and advocacy, aligning efforts across the sector and strengthening the profession’s ability to influence awareness, talent, standards and decision-making.
Geospatial surveying is one of the essential but often unseen disciplines behind the built and natural environment. Across the world, it supports infrastructure, housing, utilities, heritage, construction, transport, environmental management, mining, land administration, disaster response, asset recording, digital twins and national resilience. Almost everything around us has either been surveyed by a geospatial surveyor, or will need to be surveyed to support future development, maintenance, safety and progress.
Their work is often most successful when it goes unnoticed. Accurate survey control, reliable data, clear spatial understanding and robust measurement quietly enable better design, safer construction, more effective maintenance and more informed decisionmaking. But invisibility has consequences. When the value of geospatial surveying is not properly understood, the service can be treated as a commodity. Procurement can become dominated by lowest-price thinking. Surveyors can be appointed too late in the project lifecycle. Poor specifications can lead to poor data. Technology can be mistaken for competence. The result is that a discipline which should reduce risk
can itself become exposed to risk through misunderstanding, underinvestment and weak professional recognition.
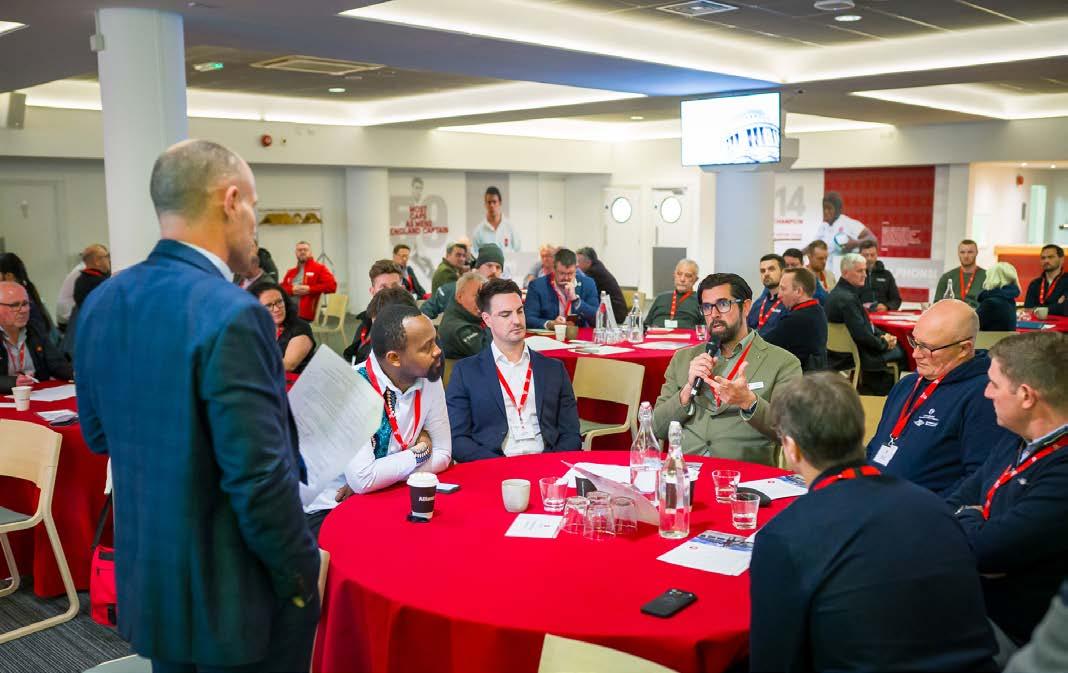
The Survey Association’s stakeholder event, held on 25 March 2026 after the 46th Annual General Meeting at the Allianz Stadium in Twickenham, UK, confirmed this wider concern. The event brought together more than a hundred TSA members and key
industry players, including representatives from government, industry, education, infrastructure, professional bodies, manufacturers and the wider supply chain.
Attendees described feeling undervalued, misunderstood and brought into projects too late for them to maximize impact. Discussions highlighted concern around the erosion of perceived value, fragmented standards, skills shortages and limited
awareness of the expertise required to deliver high-quality survey data. These issues are familiar far beyond the UK. Around the world, geospatial professionals face similar pressures: shrinking education pathways, a lack of young talent, inconsistent regulation, procurement driven by lowest price, and a growing belief that access to equipment is the same as professional competence. This is not a capability problem. The profession has the technology, skills, experience and evidence to support some of the world’s most complex built and natural environment challenges. It is a visibility and value problem.
The TSA stakeholder event was designed not as a broadcast, but as a working forum – a place for honest discussion, shared challenges and the co-creation of a national response to this problem. The resulting Unity Charter is intended to turn this shared concern into coordinated action. OAgency, which is supporting the development of the campaign, summarized the issue clearly: the profession is doing work that is foundational to infrastructure, development, conservation, resilience and decision-making, but much of that value is invisible to the people who rely on it. That invisibility has affected how the profession is perceived. Too often, geospatial surveying is seen as a technical service or project cost, rather than as a strategic discipline that reduces risk, improves outcomes and underpins progress. Therefore, the Unity Charter is not simply a campaign. It is an attempt to give our diverse profession a shared voice, a clearer identity and a coordinated platform for influence, contributing to a wider international conversation about how geospatial surveyors are recognized, valued, represented and understood.
The stakeholder report describes the next step as the formation of a unified Geospatial Collective, powered by a formal industry Charter. The Charter will provide a shared framework for collaboration, investment and advocacy, aligning efforts across the sector and strengthening the profession’s ability to influence awareness, talent, standards and decision-making. For me, the need for this is well overdue. The importance of geospatial surveying has never gone away. What has changed is the environment around it. Technology has become more accessible. Procurement has become more pricesensitive. Project teams have become more complex. The language of the profession has become fragmented. The result is a blurred understanding of what good geospatial practice looks like, what professional surveyors actually contribute, and what can go wrong when accurate data and expert judgement are missing.
The Charter has to help re-establish that narrative. It should support clients in understanding what they are buying and why professional geospatial input matters. It should help the profession explain its role as a consultative discipline that can save cost, reduce risk and improve decisions throughout the project lifecycle. It should help survey businesses, professional bodies, educators, manufacturers and governments speak with greater consistency about the value of the profession. Most importantly, it should help unite a broad profession under one clear professional name: geospatial surveyors. Because while land surveyors, utility surveyors, engineering surveyors, hydrographic surveyors, mapping professionals, GIS specialists, monitoring specialists, 3D reality capture specialists, remote sensing practitioners, deformation analysts and spatial data managers may all have different methods, markets and deliverables, they are connected by spatial data, measurement, interpretation, quality and professional responsibility. That is not a slogan for uniformity. It is a statement of professional identity.
The Charter should also make a clear distinction between access to technology and professional competence. One of the most damaging misconceptions is that anyone can buy a drone, scanner or piece of survey equipment and complete a survey. Equipment is important, but equipment does not provide professional judgement. It does not define methodology, assess risk, interpret results, understand tolerances, integrate data, challenge assumptions or stand behind the consequences of poor information. That is where the profession must lead.
The stakeholder event was important because it showed that the Unity Charter is not the concern of a small group of individuals. It reflects a broader mood across the sector. The event report states that stakeholders demonstrated strong alignment on the need for unified messaging, stronger standards, earlier engagement in projects and a better talent pipeline. It also records clear recognition that the industry must take ownership of its positioning, working collectively to elevate its voice and influence. The poll data reinforced this. When attendees were asked about the biggest risks to the geospatial profession, the top concern was skills and talent shortage. This was followed by race to the bottom on price, low fees and commoditization; internal behaviours and complacency; and lack of regulation and standards.
That combination is significant. It shows that the profession is not only concerned about external misunderstanding. It is also aware of its own internal challenges: fragmented messaging, inconsistent standards, low professional confidence in some areas and the need for greater collaboration. This self-awareness matters. A campaign of this kind cannot simply tell the outside world to value surveying more. The profession itself has to become more consistent in how it communicates, behaves, collaborates and advocates.
The same polling also identified the top three skills every surveyor needs: problem-solving, attention to detail, and communication. That is a powerful finding because it moves the conversation beyond equipment and technical operation. It reminds us that the best geospatial surveyors are critical thinkers and decisionenablers, not simply data collectors. Again, this is not only a UK observation; it reflects a wider global truth. The geospatial profession is becoming more technical, more digital and more data-rich, but the need for human judgement, interpretation and responsibility has increased, not reduced.
The word ‘unity’ can sometimes make people nervous. A diverse profession may worry that a shared message will flatten specialisms, dilute technical identity or ask very different businesses to sound the same. That is not the purpose of the Unity Charter. Unity does not mean uniformity, and the phrase Geospatial Surveyors should not narrow the profession. It should widen public understanding of it. Around the world, the profession contains many specialisms. A hydrographic surveyor working in a coastal environment, a utility surveyor mapping buried infrastructure, a GIS specialist managing spatial datasets, a reality capture specialist producing 3D data, a monitoring specialist measuring structural movement, and an engineering surveyor supporting major infrastructure all work in different contexts, but they are all part of a connected professional landscape. They all help society understand position, place, measurement, change, risk and evidence. These are not competing identities. They are specialisms within a broader professional umbrella.
In that sense, the profession can learn from medicine or law. There are many types of doctors and many types of solicitors, but they sit within recognized professional identities. Their specialisms do not weaken the collective identity; they strengthen it. Geospatial surveying needs the same confidence. The Unity Charter should allow different organizations and specialisms to retain their individuality while aligning around shared principles: visibility and standards, talent and inclusion, collaboration, innovation and impact, and advocacy. These are identified in the stakeholder report as the core principles of the Charter.
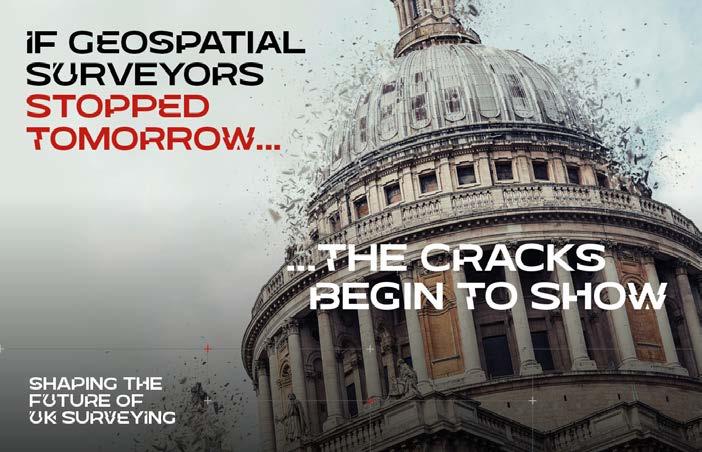
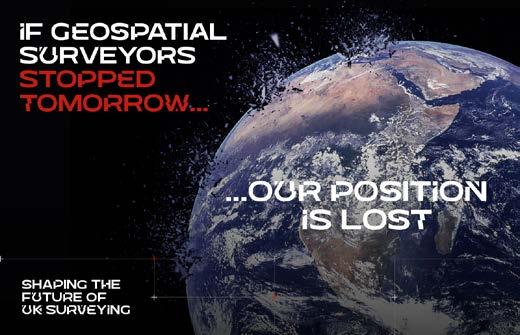
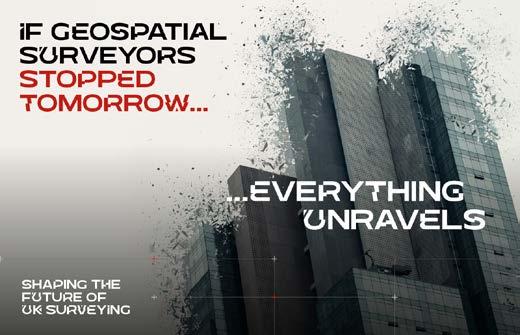
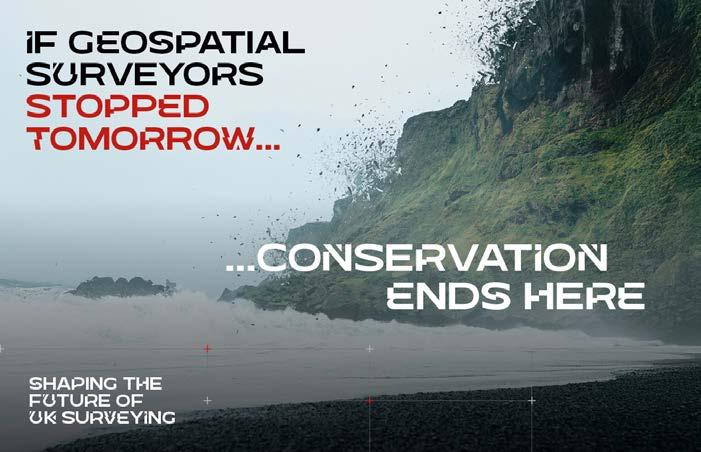
If geospatial surveyors stopped tomorrow…
The campaign platform developed with OAgency gives the Charter a strong and memorable hook: ‘If geospatial surveyors stopped tomorrow...’. It is provocative because it asks people outside the profession to imagine the consequences of absence. What happens when accurate measurement, reliable spatial data and professional survey judgement disappear? Buildings fail. Infrastructure stalls. Utilities become riskier to manage. Conservation suffers. Development slows. Confidence collapses.
The stakeholder report describes the creative platform as a way to bring to life the fragility of the UK without accurate data and measurement, making visible the often-invisible role of surveyors in keeping the nation functioning. The same idea works internationally because the consequences
would not stop at national borders. Infrastructure would stall, construction risk would increase, climate resilience would weaken, utilities would become more dangerous to manage, land and property decisions would become less certain, and the digital systems now shaping cities, infrastructure and assets would lose their spatial reliability.
For too long, geospatial surveying has often explained itself through methods, instruments and deliverables. Those things matter, but they are not where the story should begin for wider audiences. The campaign needs to move from ‘what surveyors do’ to ‘what surveyors make possible’. OAgency’s response captured this well. The campaign also recognizes that different audiences need different messages.
The stakeholder mapping exercise identified three priority groups for phase one:
• Where value is decided: clients, procurement teams, purchasers and commissioning professionals
• Where change is mandated: government, local authorities, legislators and regulators
• Where the future begins: educators, universities, teachers, careers advisors and families
That framing is useful because it recognizes that the profession’s challenges sit at the intersection of perception, policy and pipeline. Clients and procurement teams influence value, scope, appointment and commercial behaviour. Government influences policy, regulation, investment and
recognition. Education influences the long-term sustainability of the profession. The Charter needs to reach all three. In every country, in different ways, those same audiences shape whether geospatial surveyors are understood as strategic professionals or treated as a technical afterthought.
The Task Force reflections echoed the event findings. One of the strongest themes was the need to reposition geospatial surveyors as consultants who can rightfully sit on consultancy frameworks alongside architects, structural engineers and building surveyors, not simply technical suppliers. This matters because surveyors are often appointed after key decisions have already been made. The Charter should help clients understand why early involvement leads to better outcomes. Geospatial surveyors can help define scope, manage risk, improve specifications, support design decisions and prevent expensive mistakes. That role belongs at the beginning of the project, not as an afterthought.
Another theme was procurement. The profession needs to engage more directly with the people who define scope, budget and value If procurement teams do not understand the difference between a robust professional survey and a cheaper but weaker alternative, the whole project carries the risk. The stakeholder report reflects this concern. It identifies clients and procurement teams as the group “where value is decided”, noting that they control budget, specification and appointment decisions and can drive price pressure through “cheapest is best” behaviours.
A third theme was standards. The sector has to respond to technology-led simplification without sounding defensive or protectionist. The answer is not to resist technology, but to lead its appropriate use. Professional judgement, best practice, standards and accountability must sit alongside innovation. Technology should strengthen the profession, not replace the need for expertise.
A fourth theme was the next generation. The Charter needs to make geospatial surveying visible, exciting and accessible to young people. That means more than a careers leaflet. It means schools engagement, videos, games, storytelling, real project examples, outdoor learning, summer schools, digital content and career pathways that speak to the motivations of a new generation. It also means strengthening collaboration between professional bodies, and lobbying government for the profession to become regulated. That combination of talent, standards and advocacy is exactly why the Charter needs to become more than a marketing initiative.
The stakeholder report is clear that this is not simply an awareness campaign. It describes the initiative as an intervention at a critical moment for the profession. Without action, the sector risks continued talent shortages, reduced influence in key decisionmaking spaces and further erosion of perceived value. That is why the ambition must be long term. The report proposes a UK-wide, three-to-five-year umbrella campaign, delivered with OAgency, designed to unify existing initiatives, amplify impact and deliver consistent, high-impact messaging across the sector.
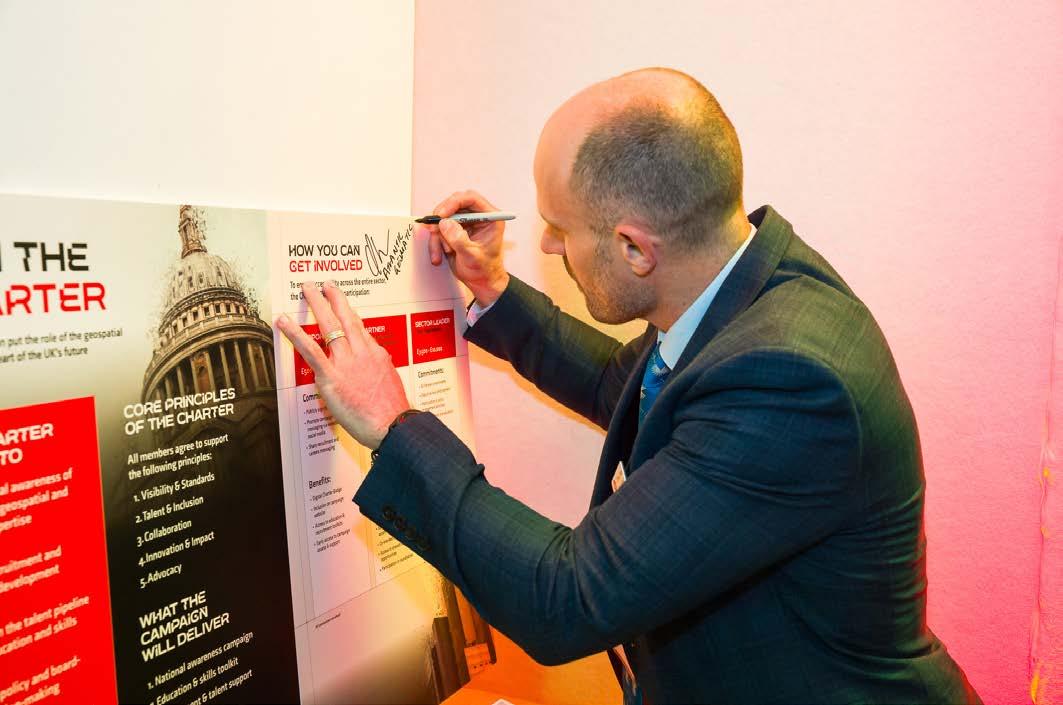
The UK focus is important because every movement needs a starting point. But the ambition should not stop there. The challenges that prompted the Unity Charter are recognizable across the international geospatial community. If the campaign succeeds, it can provide a model for others: a way to bring survey businesses, professional bodies, educators, technology providers and clients into a shared conversation about the role of geospatial surveyors in modern society. There is already good work happening across the profession worldwide. The problem is not always a lack of activity. It is that activity is often fragmented. Different bodies, businesses, educators, influencers and manufacturers may all be doing positive things, but without a shared platform the impact is diluted. The Unity Charter can help connect those efforts.
The stakeholder report identifies three big measures of success: stronger regulation and industry standards, a shift in the perceived value of surveying, and a sustainable talent pipeline for the future. Those are the right measures because they go beyond campaign visibility to focus on structural change. Success will not simply mean more social media posts, better graphics or a moment of short-term attention. Success will mean clearer standards, stronger expectations, improved specification, better procurement behaviours, earlier involvement in project lifecycles, increased government engagement and more young people understanding geospatial surveying as a modern, purposeful and rewarding career. It will also mean surveyors themselves speaking with greater confidence.
For too long, the profession has relied on others to explain its value. That has not been enough. If the profession wants clients, government, educators and young people to understand why geospatial surveying matters, it must be prepared to say so clearly, consistently and collectively. The world does not need a fragmented profession explaining itself in dozens of disconnected ways. It needs geospatial surveyors speaking with greater clarity about the value they bring to safety, resilience, development, sustainability and progress.
The Unity Charter is now an invitation. It asks businesses, educators, professional bodies, technology providers, clients, influencers and public-sector stakeholders to help shape the future of geospatial surveying. It asks the profession to move from fragmented concern to collective influence. The stakeholder report sets out the immediate next steps: refining campaign messaging, developing stakeholder engagement plans for priority audiences, preparing national lobbying and communications activity, and convening founding Charter members to guide governance, advocacy priorities and rollout. It also identifies what the campaign will deliver: a national awareness campaign, education and skills toolkit, recruitment and talent support, policy and advocacy, business toolkits, governance and transparency, and an annual national geospatial day.
Those outputs are important, but the Charter will only succeed if the profession uses them. This cannot be something that sits on a website or is launched once and forgotten. It has to become part
Andy Beardsley MRICS is a Chartered Geospatial Surveyor, TSA Council Member, and Unity Charter Task Force member. He is the founder and managing director of Terra Measurement, bringing over three decades of professional surveying experience with a strong background in innovation and operations.
of how survey businesses speak to clients, how educators explain career opportunities, how professional bodies collaborate, how manufacturers support standards and how the wider industry understands risk, value and quality. The profession does not need to become identical. It does need to become more clearly understood.
The Unity Charter is an opportunity to re-establish geospatial surveying as a critical professional discipline: one that underpins the built environment, supports resilience, enables better decisions and creates the spatial certainty on which so much else depends. If geospatial surveyors stopped tomorrow, the consequences would quickly become visible – not only in the UK, but around the world. The task now is to make sure their value is visible today.

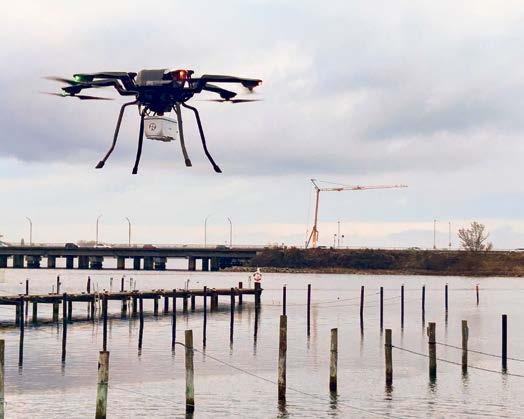



Combining a powerful laser scanner, RIEGL’s RiLOC-Finside INS/GNSS system and an RBG camera, the RIEGL VUX-820-G offers a fully integrated solution for topobathymetric data acquisition.
What sets it apart:
• up to 2.2 Secchi depths
• 15mm precision



• including RIEGL software for georeferenced and refraction-corrected point clouds
• effortless integration and reliable performance from small drones
It allows the mapping of near-shore zones, rivers, coastal infrastructure and harbour environments that are difficult for vessels or larger aircraft to access. By deploying it on a lightweight UAV, users reduce costs, improve safety and capture highquality data for environmental monitoring, hydrographic surveying and coastal management purposes.


Unlock the power of RIEGL Lidar for your surveying application!





By Luis Felipe Medina Cabrera, Mexico
To support the design of pluvial runoff and sanitary drainage infrastructure for a large-scale residential development in Mexico, a 1,700-hectare aerial survey was conducted. The team overcame challenges associated with terrain conditions, sparse vegetation and atmospheric factors by combining VTOL UAV technology with ground-based survey methods. The project highlights key considerations from a photogrammetric perspective in terms of data acquisition, processing workflows and the generation of engineering-ready deliverables.
The approximately 1,700-hectare project site is located in a semi-arid region of Querétaro, Mexico. The terrain is characterized by low vegetation density, exposed soil and heterogeneous surface textures, all of which influence both image acquisition and photogrammetric processing. The primary objective was to generate highresolution topographic data to support hydrological analysis, specifically for pluvial runoff modelling and the design of sanitary drainage systems for a future residential development. These applications require accurate representation of terrain morphology, including natural channels, slopes and water flow paths.
Operational challenges in semi-arid environments
Semi-arid conditions introduce additional constraints such as high reflectance variability, limited natural feature contrast in some areas, and atmospheric interference
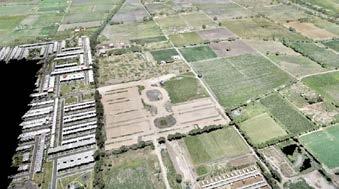
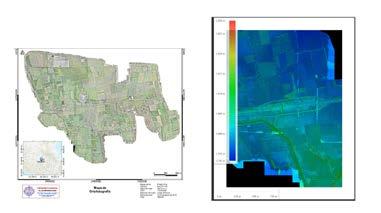
Classified point cloud of the survey area, illustrating ground and non-ground elements used for terrain modelling.
from dust and haze, all of which can impact data quality and processing reliability. Lighting conditions represented a significant challenge during data acquisition. High solar radiation and minimal cloud cover produced strong contrasts and hard shadows, affecting radiometric consistency between images. Atmospheric dust further reduced image clarity during certain periods, requiring careful selection of flight windows, typically during early morning hours to minimize interference.
Although ground visibility was generally good due to sparse vegetation, localized areas with dense tree cover created occlusions, particularly along natural drainage channels. These obstructions limited the effectiveness of aerial photogrammetry in capturing the true terrain surface in critical zones. Wind conditions also affected platform stability, especially during vertical takeoff and landing (VTOL) transitions. Maintaining consistent flight parameters was essential to ensure
uniform ground sampling distance (GSD) and sufficient image overlap.
Accurately identifying terrain variations
Data acquisition was performed using a VTOL uncrewed aerial vehicle (UAV) platform (WingtraOne), selected for its ability to efficiently cover large areas while maintaining high image quality. The survey was executed through a total of seven flights, covering the full extent of the project area. Flights were conducted at an average altitude of approximately 120m above ground level, resulting in a GSD of approximately 4cm per pixel. A total of approximately 4,700 images were acquired. Flight planning ensured adequate forward and side overlap to support robust photogrammetric reconstruction, particularly in areas with low surface texture. At this spatial resolution, small-scale terrain variations relevant for runoff modelling and drainage design could be consistently identified.
To address limitations in areas affected by vegetation cover, a hybrid survey approach was implemented. Ground-based data acquisition using GNSS and total station measurements was carried out in zones where aerial data could not accurately capture terrain features, particularly along drainage channels. This integration ensured a more complete and reliable representation of the terrain, which is critical for hydraulic analysis where small elevation differences can significantly influence design outcomes.
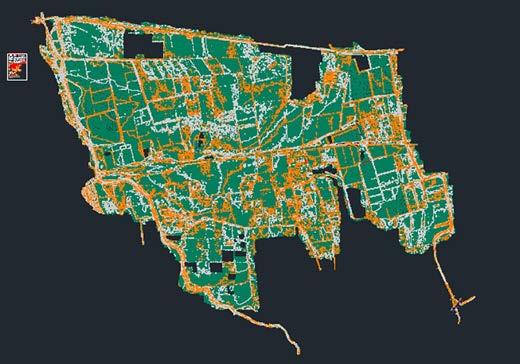
Integration of ground-based GNSS and total station data in areas affected by vegetation cover.
Photogrammetric processing was conducted using Pix4D, following a structured workflow including image alignment, tie point generation and dense point cloud creation. Special attention was given to low-texture areas, where parameter adjustments were required to improve matching performance. Ground control points (GCPs) were incorporated to refine georeferencing accuracy and ensure consistency across the dataset.
The integration of ground-based survey data required additional validation and alignment processes to maintain coherence between datasets. This hybrid approach improved terrain representation in critical areas, particularly for longitudinal profiles and crosssections used in hydraulic design. Orthomosaic generation included radiometric corrections to compensate for lighting inconsistencies, ensuring usability for engineering applications.
A key component of the project was the transformation of geospatial data into engineering-ready deliverables compatible with CAD-based workflows. The final outputs included digital terrain models, orthomosaics, drainage alignments, cross-sections and detailed hydraulic structures such as culverts. These elements were structured according to industry standards, including layer
About the author

Luis Felipe Medina Cabrera is a geomatics engineer specializing in UAV photogrammetry, geospatial data processing and hybrid survey methodologies. His work focuses on large-scale mapping projects and the generation of engineering-ready deliverables for infrastructure and land development applications in Mexico.
organization, coordinate systems and annotation conventions. The integration of photogrammetric and ground-based data enabled the generation of reliable inputs for hydrological modelling and infrastructure design, directly supporting decision-making processes in the planning of the residential development.
As photogrammetric technologies continue to evolve, their integration with traditional surveying methods will remain a key factor in addressing complex real-world projects. This project demonstrates that semi-arid environments present both advantages and limitations for photogrammetric surveys. Therefore, it is important to adapt photogrammetric workflows to the specific challenges of such conditions. While ground visibility is generally favourable, factors such as lighting conditions, atmospheric interference and vegetation occlusions must be carefully managed.
One of the most relevant findings is the importance of hybrid methodologies, because aerial photogrammetry alone may not be sufficient in all scenarios, particularly in areas where vegetation obstructs critical terrain features. The integration of GNSS and total station data provides a robust solution to overcome these limitations. VTOL UAV technology proved highly effective for large-area coverage, offering a balance between efficiency and data quality. The results demonstrate that hybrid approaches significantly improve terrain representation, generating high-quality geospatial data suitable for demanding engineering applications and enhancing the reliability of hydrological analysis and infrastructure design. However, careful planning and environmental assessment remain essential.
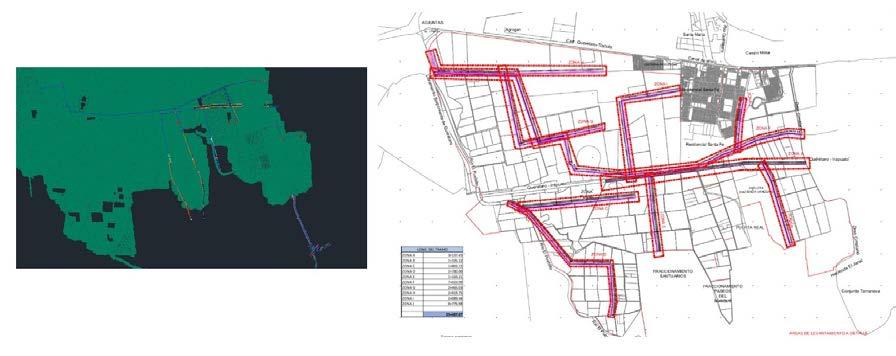
CAD-based deliverables showing drainage network layout and segmentation for hydraulic design.
By Ana Cristina García-Luna Romero and Carlos Bausá Martínez
Rapid urbanization has significantly altered the thermal balance of cities, giving rise to the urban heat island (UHI) phenomenon, in which metropolitan areas have higher temperatures compared to surrounding rural environments. A study in Mexico has explored the use of advanced remote sensing technologies to measure, evaluate and develop strategies to mitigate such adverse climatic conditions. Drones equipped with infrared thermal cameras gathered highresolution thermal images, with the data subsequently processed using digital photogrammetry and geospatial analysis methodologies.
One place where the UHI phenomenon has reached critical levels is Monterrey in the Mexican state of Nuevo León. The city records temperatures up to 5°C higher than its surrounding rural areas, with projections suggesting an increase of up to 10°C by 2050 if effective mitigation strategies are not implemented.
For this study, three representative areas reflecting Monterrey’s urban typological diversity were selected: 1) residential area with wide streets, 2) residential area with narrow streets, and 3) university campus with extensive green areas. The research was conducted around the University of Monterrey (UDEM) campus at two spatial resolution levels. Areas with high vegetation density (represented in darker tones) exhibited lower surface temperatures compared to built-up or paved surfaces (Figure 1).
Evaluating and classifying thermal maps
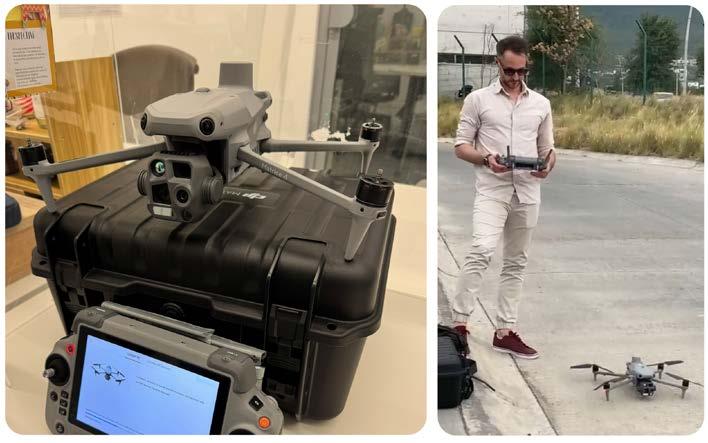
For the thermal analysis of the urban environment, orthophoto maps were generated using autonomous flights of uncrewed aerial vehicles (UAVs or ‘drones’) equipped with high-resolution thermal imaging cameras (Figure 2). The acquired images were processed using digital photogrammetry techniques to produce georeferenced thermal orthomosaics,
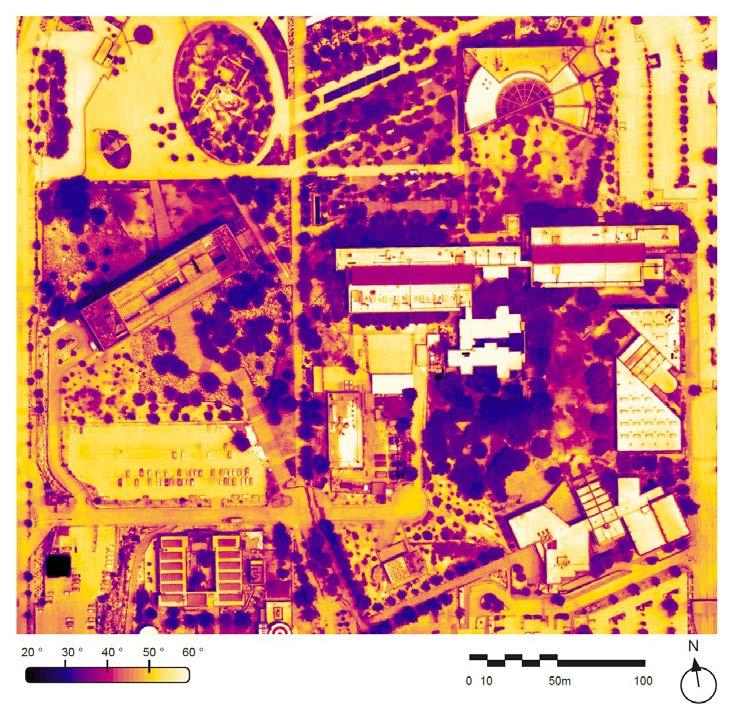
Figure 1: A drone-derived orthomosaic of the Universidad de Monterrey (UDEM) campus illustrates surface brightness temperatures ranging from 20°C to 60°C. Urban materials –specifically concrete, metal roofing and asphaltic surfaces – exhibit the highest thermal signatures. Conversely, vegetative cover – particularly arboreal density – serves to mitigate heat absorption and regulate the microclimate.
representing the spatial distribution of land surface temperature.
Spatial segmentation using an adaptive grid
To facilitate thermal analysis and enable controlled spatial downscaling, the orthomosaic was segmented into a regular grid of square cells. The grid resolution is defined by a parameter X, which represents the number of divisions along the axis corresponding to the shorter side of the image. The resulting grid consists of X² cells Ci,j, where i, j Є [1, X]. This segmentation approach allows the adjustment of cell size according to the required level of spatial detail, enabling both localized and generalized analysis of thermal surface behaviour.
A computational tool for urban thermal analysis was developed to support the classification of thermal orthophoto maps and to identify areas requiring targeted interventions for the mitigation of the UHI effect. The implementation was carried out using the visual programming environment Grasshopper for Rhinoceros 3D. This was selected for its capacity to handle spatial and three-dimensional data structures and to enable the systematic extraction and interpretation of pixel-level information from thermal imagery.
Data processing using digital photogrammetry and geospatial analysis methodologies enabled the generation
of georeferenced thermal orthomosaics, spatial segmentation through adaptive grids, conversion of digital values into physical temperature measurements, calculation of mean temperatures per cell, discrete thermal classification and frequency quantification.
Thermographic classification into three ranges
The thermographic conditions were classified into three temperature ranges: <23°C (good), 32°C-46°C (average) and >46°C (extreme). These ranges were guided by the Universal Thermal Climate Index (UTCI). The UTCI is not based solely on air temperature; rather, it integrates key meteorological variables, including air humidity, wind speed and radiant heat flux, enabling a comprehensive evaluation
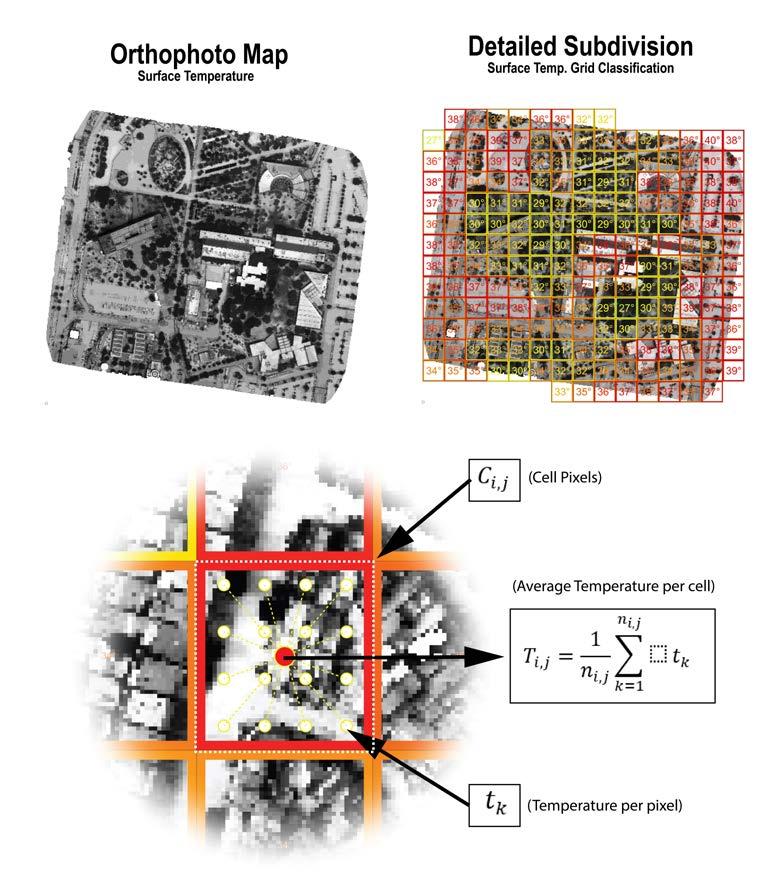
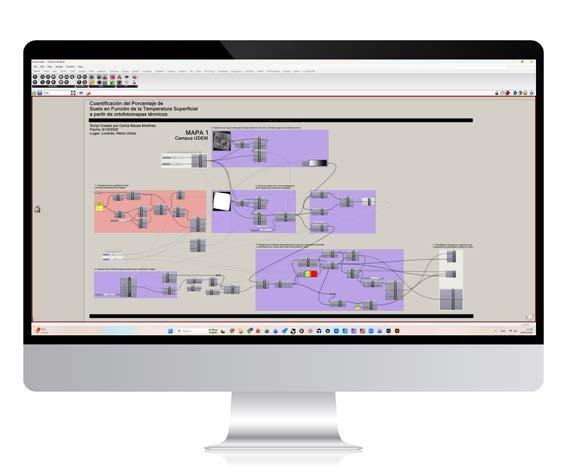
Figure 4: Algorithm developed in Grasshopper 3D for thermal-based land classification according to mean surface temperatures.
of thermal stress in outdoor settings. Therefore, it represents an equivalent temperature that provides a physiologically meaningful assessment of human thermal perception in outdoor environments (Bröde et al., 2012). It is derived from a complex thermo-physiological model, the Fiala model (Fiala et al., 2012), which simulates human heat balance responses under varying environmental conditions. According to the UTCI, the outdoor thermal comfort range – defined as conditions without thermal stress – is typically between 9°C and 26°C.
The UDEM campus serves as a reference model for climateresponsive urban design, demonstrating the effectiveness of urban heat mitigation strategies. Thermal observations indicate distinct microclimatic conditions associated with land cover and design features: mature tree canopy cover (40% of the area) reduces surface temperatures to 26-30°C, generating localized cooling effects with differences of up to 12°C relative to exposed surfaces; permeable and landscaped areas maintain intermediate temperatures of 28-34°C through vegetation and soil moisture
UHIs: the role of the Garden City Model
Urban heat islands result from surface energy balance alterations driven by increased impervious materials, reduced evapotranspiration and anthropogenic heat emissions, intensifying thermal stress through urban morphology, and cover and building configuration. UHIs are strongly associated with elevated mortality (1-6% per 1°C increase) and exacerbate socio-spatial inequalities, disproportionately affecting vulnerable populations and producing conditions of thermal injustice. Nature-based solutions, particularly strategically designed urban forests, can reduce urban temperatures by 2-8°C. The Garden City Model offers a relevant planning framework, integrating green infrastructure as a structural urban element to enhance thermal regulation and spatial equity.
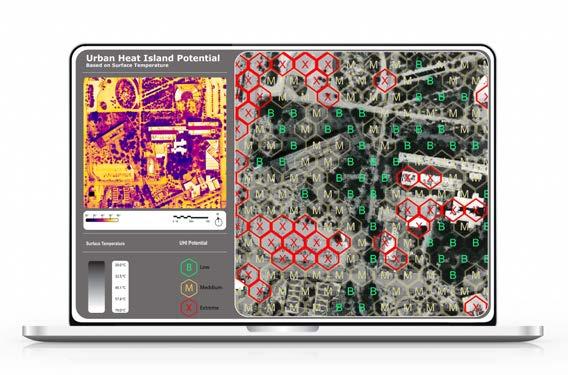
Figure 5: Example of the user interface (UI) showing a map of the UDEM campus with the classification of areas by UHI potential, including a higher-resolution grid for a more detailed spatial analysis. Map classification legend: (B) Good (T<23°C), (M) Average (32°C<T<46°C), (X) Extreme (T>46°C).

Dr Ana Cristina García-Luna Romero is Professor of Architecture and Urbanism in the School of Architecture, Art and Design (EAAD) at Tecnológico de Monterrey, advisor to the Citizen Observatory for Air Quality of the Monterrey Metropolitan Area (OCCAMM), and coordinator of the Urbanism Committee with a PhD in Philosophy (Architecture and Urban Affairs). She is a prominent professional in architecture, urbanism and sustainability, and a promoter of education as a driver of real change. Her work focuses on the intersection of data and well-being in urban environments.

Carlos Bausá Martínez is head of sustainability and a senior associate at Zaha Hadid Architects in London, United Kingdom, and a prominent figure in sustainable practice. He holds a Master of Architecture from the Institute for Advanced Architecture of Catalonia (IAAC) and is a LEED Accredited Professional, leading the in-house sustainability research at one of the world’s most famous architectural firms.
Further reading
Aké Turriza, K.A., & Rivera-Arriaga, E. (2025). Urban heat islands under climate change scenarios. JAINA Costas y Mares ante el Cambio Climático, 7(1), 67–94. https://doi. org/10.26359/52462.0705
Climate Resilience Center. (n.d.). Hot Cities, Chilled Economies: Monterrey, Mexico. https://onebillionresilient.org/hot-citieschilled-economies-monterrey/ Howard, E. (2007). Garden Cities of To-Morrow. Routledge. https://doi.org/10.4324/9780203716779
Irfeey, A.M.M., Chau, H.-W., Sumaiya, M.M.F., Wai, C.Y., Muttil, N., & Jamei, E. (2023). Sustainable mitigation strategies for urban heat island effects in urban areas. Sustainability, 15(14), 10767. https://doi.org/10.3390/su151410767
Lemoine-Rodríguez, R., Pérez Vega, A., & Mas, J.F. (Eds.). (2024). Advances in the study of urban heat islands in Latin America. University of Guanajuato. http://repositorio.ugto.mx/ handle/20.500.12059/12562
retention; bioclimatic buildings exhibit roof temperatures of 3540°C due to material and design optimization; and water bodies produce evaporative cooling, with surface temperatures of 24-28°C extending cooling effects up to 100m.
The value of aerial drone thermography
Overall, the study highlights the value of integrating aerial drone thermography with spatial analysis for microclimatic assessment to quantitatively confirm the effectiveness of diverse UHI mitigation
strategies. In Monterrey, for example, comparative analysis shows that wide-street residential areas exhibit the highest surface temperatures, while narrow-street configurations benefit from shading effects and localized cooling.
This study offers potential for replication in other Mexican cities through a national urban thermal resilience network. However, effective mitigation requires coordinated metropolitan governance and integrated planning frameworks. Currently, implementation remains constrained by institutional fragmentation, limited regulatory frameworks, insufficient economic incentives, inadequate availability of drought-adapted vegetation, and a lack of specialized technical capacity and long-term maintenance systems. These results underscore the need for national standards in Mexico that explicitly incorporate urban thermal mitigation criteria into sustainable construction and metropolitan planning.
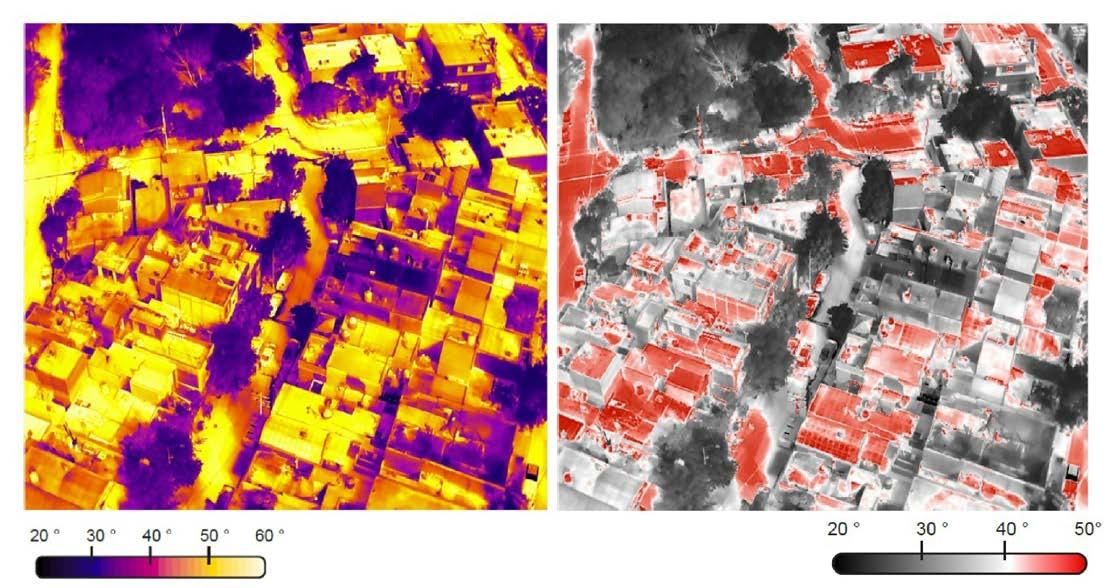
Figure 6: Thermal analysis of a marginalized planned residential zone illustrates disproportionate UHI contributions from non-regulated building materials. Areas highlighted in red indicate surface temperatures surpassing 50°C, reflecting a critical deficit in urban green infrastructure and thermal mitigation surfaces.
Digitally documenting Morocco’s Dar Si Saïd Museum
By Ibtissam Ouaissa, Meryem Mebrouk, Sara Ait-Lamallam, Nabil Ait Jaad and Mustapha Azmil
Facilitating both remote evaluation and collaborative heritage conservation, a proposed web-based platform for post-earthquake assessment and visualization of heritage buildings was applied to Dar Si Saïd Museum in Morocco after the Al Haouz earthquake in 2023. As an interactive 3D interface integrating heterogeneous spatial data, it enables users to explore and annotate structural damage. With features including point clouds, panoramic views, expert assessments and automatic report generation, it bridges the gap between spatial data acquisition, expert analysis and long-term preservation efforts.
Cultural and architectural heritage constitutes a vital legacy, reflecting the identity, history and craftsmanship of past civilizations. Preserving this heritage is
essential not only for historical memory but also for the continuity of collective knowledge and transmission to future generations. According to the International
Committee for Heritage Documentation (CIPA), a comprehensive understanding of heritage value requires an appropriate assessment of associated risks. Natural disasters – particularly earthquakes – are among the most significant risks in this context. Historical buildings, built before the development of seismic-resistant techniques, are particularly vulnerable and need to be preserved and documented as a matter of urgency. Additionally, post-disaster documentation is a critical step for guiding decisions on restoration, protection and reconstruction. A rapid and accurate assessment of damage enables stakeholders to prioritize interventions and plan restoration efforts more effectively.
Thanks to advances in 3D data acquisition techniques, such as laser scanning and photogrammetry, it is now possible to generate accurate and detailed records of architectural elements. However, these technologies produce massive and heterogeneous datasets that are often challenging to process and visualize in realtime. Traditional solutions typically require specific software and high computing power, which is not always available to end users or field professionals. In urgent contexts, such as post-earthquake site inspections, mobile devices used by field experts frequently cannot manage largescale 3D data, limiting real-time access to
vital spatial information extracted from point clouds or panoramic images produced by laser scanning technologies.
Web-based technologies offer an effective alternative by allowing interactive 3D visualization directly in standard browsers without the need for specialized software. However, there is a lack of integrated web-based solutions that combine 3D point clouds, panoramic imagery and expert annotations for rapid post-seismic damage assessment. Several existing platforms provide some tools for heritage documentation and 3D visualization. The French Open Heritage Platform (POP) centralizes multiple national databases, including architectural monuments, museum collections and archival imagery, with advanced search and geolocation features.
OpenHeritage3D offers high-resolution 3D reconstructions and metadata for heritage sites worldwide, enabling precise virtual analysis. However, these platforms mainly support data consultation and download; they do not allow users to contribute directly or perform real-time annotations.
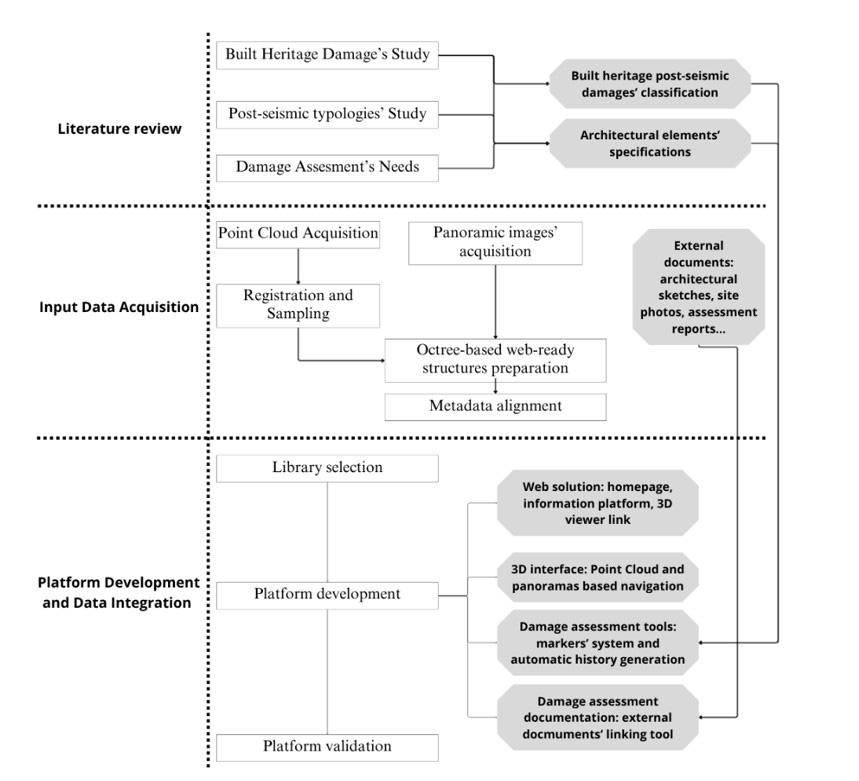
To address the limitations of existing solutions, a proposed web-based platform integrates point clouds, panoramic images, architectural sketches and structured metadata within a single interactive browser interface. This design enables collaborative exploration, annotation and report generation on-site, and lays the foundation for future AI-assisted damage detection and temporal monitoring. The 3D web platform enables the interactive visualization and annotation of heterogeneous spatial data for postseismic damage assessment. The system integrates laser scanning and panoramic image datasets through a three-phase workflow, as illustrated in Figure 1.
The input data consisted of 3D point clouds and panoramic images acquired using the Leica RTC360 terrestrial laser scanner, which simultaneously captures both geometric and visual information. Supplementary materials such as 2D architectural plans and field damage reports were also integrated to enhance the contextual understanding of the heritage site.
The raw point clouds were converted into .e57 format and subsequently processed to generate octree-based web-ready structures. Metadata files (e.g. metadata.json, octree.bin) were automatically generated to optimize rendering efficiency and data loading. Each 3D scene was then spatially aligned with its corresponding 360° panoramic image, captured at the same scanning station. Unique identifiers were assigned to ensure consistent pairing between geometric and visual datasets. The coordinates of the scanning stations were calculated as the geometric centre of the bounding box. Interactive spheres were placed at these positions in the 3D scene to provide direct access to the corresponding panoramic views.
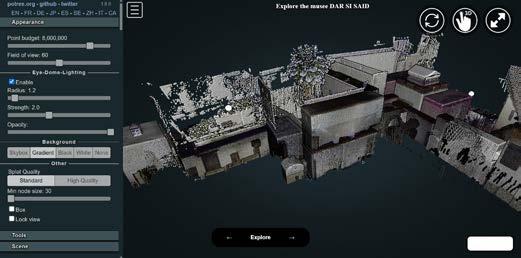
The platform allows users to visualize and interact with 3D point clouds using standard web browsers. It includes navigation, measurement and annotation tools to support detailed inspection of structural damage. Panoramic views are linked to the 3D environment through interactive spheres, enabling seamless switching between geometric and immersive image-based perspectives. Damage annotations are stored in structured JSON format to ensure data traceability, interoperability and report generation (including PDF export). A user authentication system ensures accountability of expert inputs, while validation tests were performed to evaluate the platform’s performance, compatibility and scalability across different devices and browsers. The platform was developed using a combination of open-source web technologies that support seamless visualization, interaction and documentation of large-scale spatial data directly within a web browser. Table 1 summarizes the platform’s main software tools and how they were employed in the real-world case study.
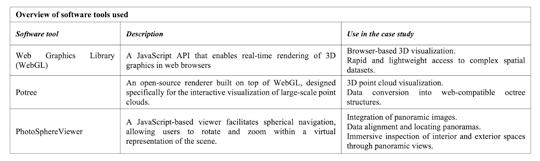
Table 1: The platform’s software tools and how they were employed in the case study.
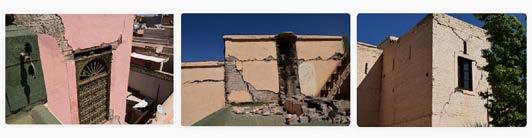
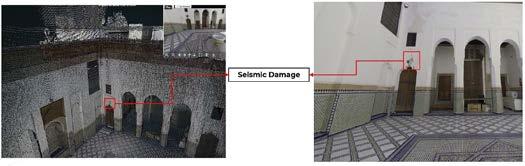
The proposed methodology was applied to a real-world case study involving the Dar Si Saïd Museum, located in the medina of Marrakech. Its distinctive architectural features make it an emblematic example of Moroccan architectural heritage. Unfortunately, the museum suffered considerable damage during
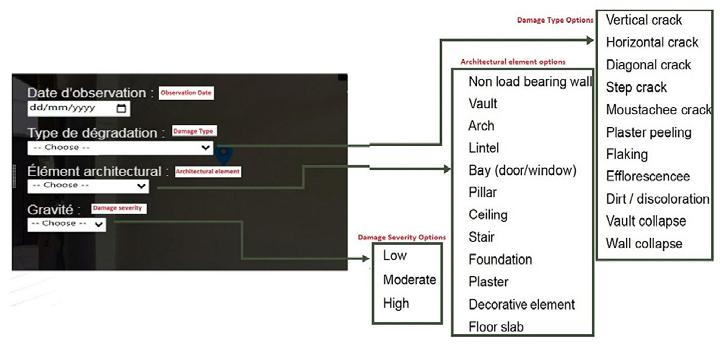
the 2023 Al Haouz earthquake in Morocco, particularly to its ornamental and structural elements (Figure 2).
The acquisition and processing phases generated a dense 3D point cloud along with more than 100 panoramic 360° images captured from various scanning stations inside the museum. The platform’s 3D environment includes interactive spheres that act as visual anchors, enabling users to open the corresponding panoramic views or consult contextual information (Figure 3).
Users can annotate observed damages directly on the 3D model or within panoramic images. Annotation markers are linked to interactive forms, where users select predefined damage types such as cracks, detachments or deformations. Each annotation can include metadata
describing severity, location and inspection date, and users can also upload supporting documents such as field photographs or expert analysis (Figures 4 and 5).
The platform’s responsiveness was evaluated through three key actions: initial web interface loading (~4s), 3D point cloud rendering (~8s for datasets of several hundred MB) and 360° panorama display (~0.7s). These results indicate that the platform performs efficiently with large datasets, enabling smooth interaction for field use and post-disaster assessments. All annotations are stored in a structured format, allowing the system to automatically generate inspection reports. These reports facilitate both quantitative and qualitative assessments of the museum’s condition, helping to prioritize urgent conservation
actions (Figure 6). Supporting materials such as sketches or photos can be attached to each damage record.
The platform was tested according to several validation criteria (summarized in Table 2). The results demonstrate good responsiveness, compatibility with multiple browsers, and adaptability to different screen resolutions. Moreover, the system efficiently handles large datasets and numerous annotations, confirming its scalability and usability for real post-disaster heritage assessment scenarios.
The developed web-based platform provides a centralized environment for the documentation and 3D visualization of built heritage after seismic events. By integrating heterogeneous datasets such as point clouds, panoramic images and architectural sketches, the system offers an intuitive and collaborative interface that enhances both accessibility and efficiency in post-earthquake assessment workflows. The application to the Dar Si Saïd Museum in Marrakech demonstrated the platform’s usability and scalability, enabling experts to visualize, annotate and analyse damage directly within a standard web browser without the need for specialized software. Performance tests on common devices confirmed smooth rendering, low latency and compatibility with large datasets, supporting its deployment for real-world heritage inspection scenarios.
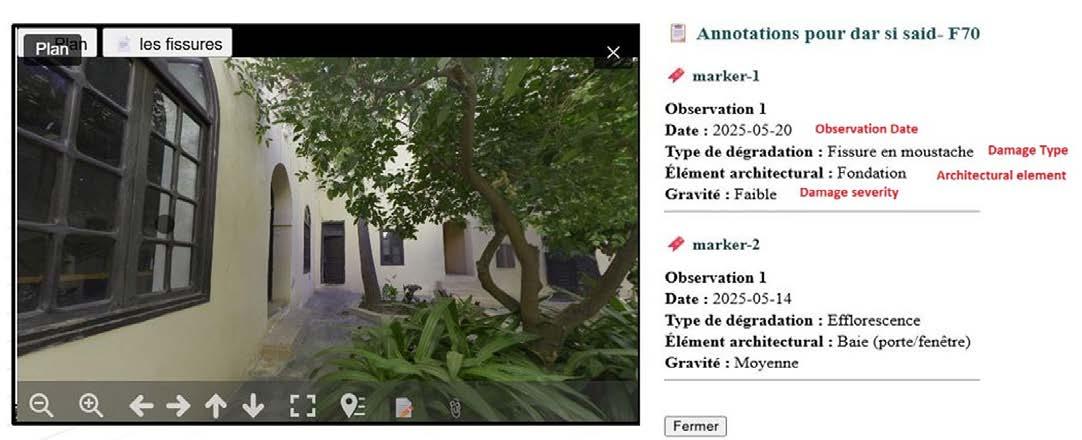
Further reading
[1] F. Sikander, T. A. Soomro, and S. Abro, ‘Architectural Documentation for Cultural Heritage: A Case Study of Haribhai Pragji Karia High School, Karachi’, J. Art Archit. Built Environ., Vol. 7, No. 2, pp. 63–87, Dec. 2024, doi: 10.32350/ jaabe.72.04. Available: https://journals.umt.edu.pk/index. php/JAABE/article/view/6242
[2] R. Jigyasu, S. Sen, B. M. Devilat Loustalot, and F. Lanuza, ‘3D Laser scanning documentation for informing the post-earthquake recovery of heritage settlements: a practical guide’, 2022, doi: 10.17631/RD-2022-0005-DPRAC. Available: https://irep.ntu.ac.uk/id/eprint/47306/
[3] M. Schuetz, ‘Rendering Large Point Clouds in Web Browsers’, Vienna University of Technology, 2016. Available: https://old.cescg.org/CESCG-2015/papers/SchutzRendering_Large_Point_Clouds_in_Web_Browsers.pdf
[4] Ministère Français de la Culture, ‘Plateforme Ouverte du Patrimoine (POP)’, Ministère de la Culture, France. Accessed: 2 June 2025. [Online]. Available: https://www.pop.culture. gouv.fr
[5] OpenHeritage3D, ‘Open access to cultural heritage 3D data’, OpenHeritage3D. Accessed: 2 June 2025. [Online]. Available: https://openheritage3d.org
[6] Fondation Nationale des Musées, Programme de la Consultation Architecturale Ouverte Internationale n° 002/ FNM/2024 : Réhabilitation et restauration du Musée National du Tissage et du Tapis Dar Si Said de Marrakech, Rabat, Morocco, March 2024. Available: https://fnm.ma/wpcontent/uploads/2024/02/Reglement-de-consultation-2.pdf
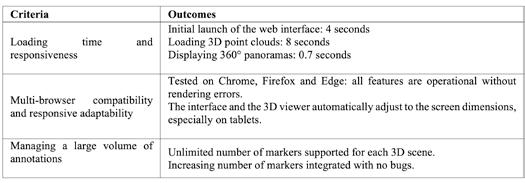
Table 2: Results of platform validation.
It is recommended for future work to focus on integrating AI-assisted damage detection and classification, as well as implementing temporal monitoring to enable multi-period comparisons and quantitative validation. Overall, this research highlights the potential of immersive web technologies to enhance post-seismic heritage documentation and conservation. The proposed platform represents a scalable and accessible solution that bridges the gap between spatial data acquisition, expert analysis and long-term preservation efforts.
The authors thank the Moroccan company 3DPS for their warm welcome, technical support and supervision. They also thank Leica Geosystems Morocco for their support.



Ibtissam Ouaissa (Eng) is a geomatics and topographic surveying engineer in the Department of Cartography and Photogrammetry, School of Geomatics and Surveying Engineering, Agriculture and Veterinary Medicine Institute Hassan II, Rabat (Morocco), specializing in photogrammetry, lasergrammetry and high-precision 3D reality capture for geospatial applications.
Meryem Mebrouk (Eng) is a geomatics and topographic surveying engineer in the Department of Cartography and Photogrammetry, School of Geomatics and Surveying Engineering, Agriculture and Veterinary Medicine Institute Hassan II, Rabat (Morocco), with experience in processing and visualizing multiformat 3D spatial data for web-based built heritage documentation.
Sara Ait-Lamallam (Pr, PhD, Eng) is an assistant professor and researcher in the Department of Cartography and Photogrammetry, School of Geomatics and Surveying Engineering, Agriculture and Veterinary Medicine Institute Hassan II, Rabat (Morocco), specializing in geomatics project management, building information management (BIM) and 3D reality capture technologies training.
Nabil Ait Jaad (Eng) is managing director of 3DPS Surveying Company in Rabat, Morocco. He is an expert on land surveying, airborne Lidar data processing and structural monitoring.
Mustapha Amzil (PhD in Geoinformatics, Geosciences and Geoheritage, Eng) is head of sales for Morocco and reality capture manager at Leica Geosystems in Casablanca, Morocco. He is an expert on digitalization and innovative geospatial solutions.
By Fabio Remondino, Italy, and Klaus Legat, Austria
While oblique airborne camera systems have been a staple in geospatial applications for over 15 years, the extraction of high-accuracy, 3D value-added products from oblique datasets is today expanding rapidly and becoming more requested. This article looks at the evolution of oblique image acquisition, and highlights how a jointly developed web-based platform bridges the operational gaps that previously limited the use of high-resolution oblique imagery for urban management purposes.
Initially utilized for urban 3D modelling, visualization of vertical structures, realistic texture mapping and monoplotting-based height estimations, oblique imagery has transitioned from a niche visualization aid into a core quantitative asset. This technological renaissance is driven by major advancements in hardware, such as larger sensor formats, superior radiometric performance and refined geometric calibration, coupled with revolutionary developments in photogrammetric computer vision and cloud-based image processing software.
The advantages of oblique image acquisition
The primary objective of acquiring oblique aerial imagery is to maximize 3D mapping capabilities, particularly in dense and
complex urban areas. Unlike traditional nadir photography, which struggles with vertical occlusion, multi-perspective oblique flights can improve cadastral updates, object localization and precise geometric restitution of vertical structures.
Just some of the benefits of aerial oblique photogrammetry include:
- Mitigation of blind spots: the visibility of features typically occluded in nadir views is significantly enhanced, having visibility of building footprints beneath overhanging roofs, complex architectural recesses and multi-level facades.
- Vertical accuracy: the intersection geometry of oblique rays provides a more rigid mathematical constraint, leading to more accurate determination of the vertical component in 3D coordinate estimation.
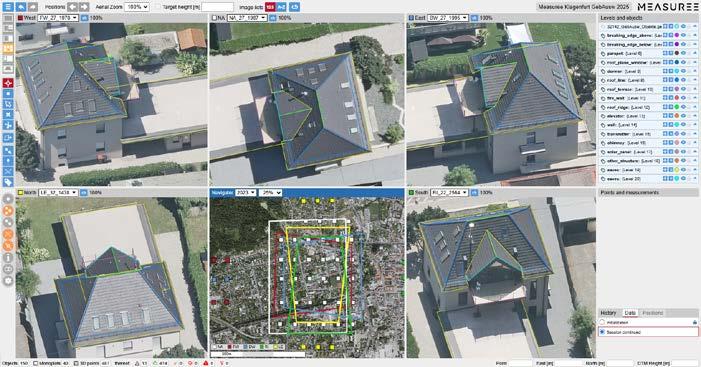
- High-density dense matching: the high degree of image overlap across multiple viewing angles fosters superior dense image matching (DIM), resulting in exceptionally dense, low-noise point clouds and highfidelity true-orthophotos. Comparative analysis demonstrates that point clouds derived from nadir imagery or airborne Lidar alone often lack completeness along vertical planes. In contrast, incorporating oblique imagery yields a comprehensive 3D model that faithfully replicates intricate roof details, structural facades and vertical urban infrastructure.
To exploit these benefits, flight missions are meticulously planned with high longitudinal and transverse overlaps, ensuring that any given ground object is captured in up to ten distinct images from every viewing direction. This dense redundancy guarantees nonoccluded lines of sight for nearly every urban feature, explaining the surging demand from municipalities worldwide for multiperspective oblique aerial surveys.
Despite these extensive geometric benefits, a persistent bottleneck has been the lack of streamlined, accessible inspection and measurement tools. Historically, extracting information required heavy, desktopbound photogrammetric workstations. To democratize this data for municipalities, cadastral agencies and urban planning offices, tools must operate natively within standard web browsers without sacrificing 3D quality. Furthermore, in smaller regional
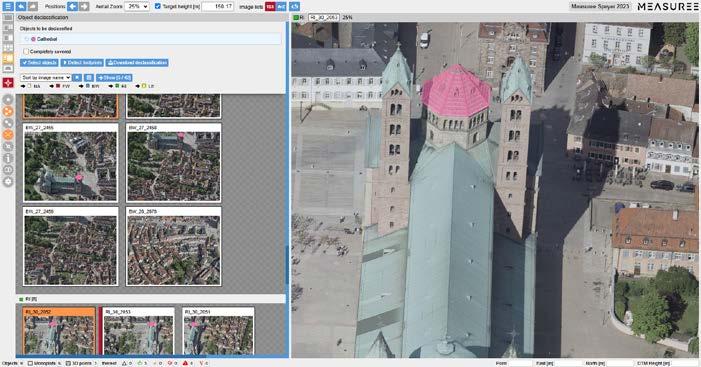
Tracking objects across multi-perspective imagery (e.g. for declassification). (Image courtesy: City of Speyer, 2023)
governments, geospatial data is frequently handled by administrative personnel who lack formal training in geoinformatics or land surveying. Consequently, modern web-based platforms must be inherently intuitive (‘easy to use’) while featuring robust backend constraints to prevent operational errors (‘hard to abuse’).
To bridge this operational gap, the Austrian aerial survey company AVT, in close collaboration with the Bruno Kessler Foundation (FBK) research institute in Trento, Italy, initiated the development of GEOBLy in 2017. Designed to simplify the exploitation of multiperspective datasets, the platform has recently undergone a major cloud architecture overhaul and been rebranded as Measuree. This tool operates entirely online via a standard browser interface.
By leveraging precisely oriented image blocks and advanced multi-view photogrammetric intersection techniques, Measuree enables users to perform 3D feature extraction and structural restitution directly on the imagery. Moving beyond traditional geometric measurements, the platform also integrates artificial intelligence (AI) solutions for automated object-instance counting (e.g. automatically detecting and counting windows or infrastructure components).
Crucially, the platform supports cross-modal semantic enrichment, allowing radiometric and class-based information extracted from the 2D images to be back-projected onto the 3D point cloud, creating semantically enriched 3D data. Measuree supports various types of imaging sensors (e.g. optical, thermal, Lidar) flown with crewed or uncrewed aircraft. Another key feature is the identification and declassification of sensitive content in images captured for online portals. While this task is straightforward for nadir images, the 3D characteristics of objects with greater variations in height (e.g. nuclear power stations) require more advanced approaches for object delineation oblique imagery.
The synergy between high-resolution oblique imagery and the Measuree web platform delivers substantial value for municipal and engineering workflows. In the case of zoning compliance and building code enforcement, for example, authorities can remotely document and audit structural alterations over time, such as verifying whether an authorized carport or patio has been converted into an enclosed room without proper permissions. This replaces costly, time-consuming on-site inspections with immediate desktop verification. Urban planners involved in micro-planning or architectural engineering can precisely determine the number of floors, storey heights and overall building volumes necessary for shadow analysis, solar potential mapping and microclimate modelling, for instance. When it comes to asset management and road infrastructure inventories, the tool enables the rapid identification, mapping and georeferencing of both horizontal pavement markings and vertical traffic signage, streamlining the creation of municipal asset registries.
The platform also supports validation of cadastral maps. By overlaying existing 2D cadastral vector datasets directly onto the oriented oblique images, operators can instantly detect geometric discrepancies, unauthorized boundary shifts or omissions in official maps. Fire protection engineers responsible for emergency
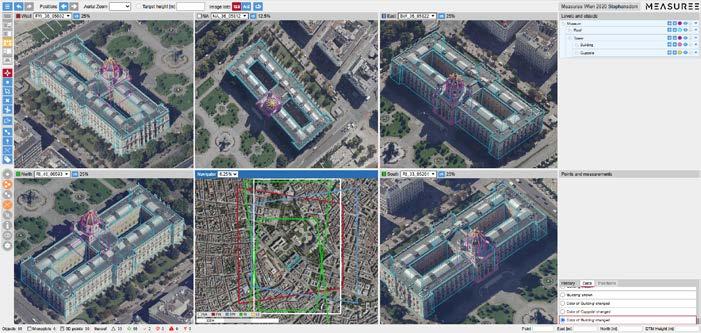
Further reading
Remondino, F., Muick, M., Cramer, M., Wenzel, K., Legat, K., 2025. A status quo in aerial photogrammetric mapping. ISPRS Int. Arch. Photogramm. Remote Sens. Spatial Inf. Sci., XLVIII-1/W42025, 115–122
Toschi, I., Ramos, M.M., Nocerino, E., Menna, F., Remondino, F., Moe, K., Poli, D., Legat, K., Fassi, F., 2017. Oblique photogrammetry supporting 3D urban reconstruction of complex scenarios. ISPRS Int. Arch. Photogramm. Remote Sens. Spatial Inf. Sci., Vol. XLII-1-W1, pp. 519-526
Remondino, F., Gerke, M., 2015. Oblique Aerial Imagery – A Review. Proc. Photogrammetric Week 2015, D. Fritsch (Ed.), pp. 75-83
Rupnik, E., Nex, F., Toschi, I., Remondino, F., 2015. Aerial multicamera systems: Accuracy and block triangulation issues. ISPRS Journal of Photogrammetry and Remote Sensing, Vol. 101, pp. 233–24

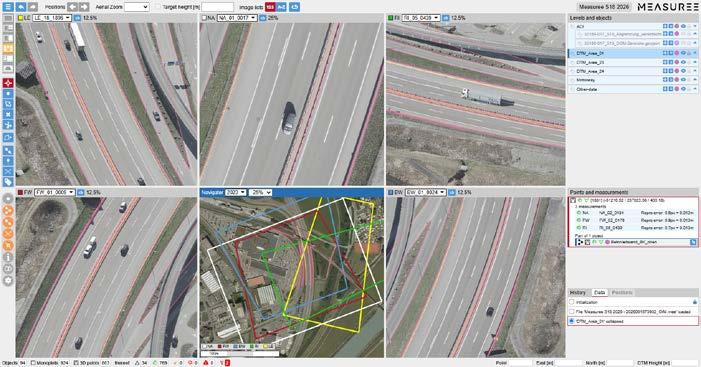
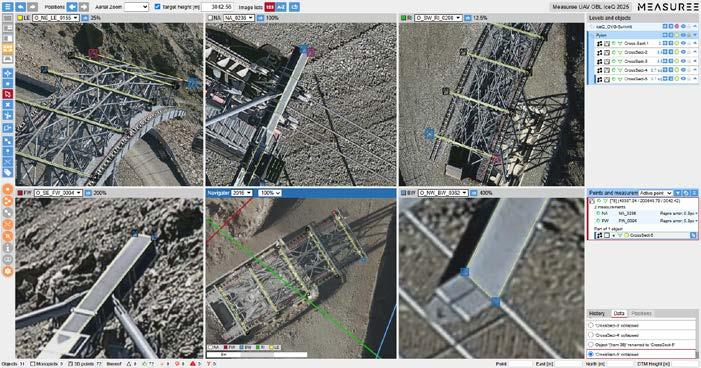
Fabio Remondino is senior scientist at the Bruno Kessler Foundation (FBK) in Trento, Italy, where he researches automated procedures in photogrammetry and 3D mapping, combining data, techniques and solutions.
remondino@fbk.eu
Klaus Legat holds a PhD from TU Graz and did a research fellowship at EPF Lausanne. In 2006, he joined AVT GROUP where he is CEO of AVT Airborne Sensing Austria. His responsibility is aerial surveying and photogrammetry.
k.legat@avt-as.eu
response and fire safety assessments can analyse structural layouts to evaluate emergency access routes, determine window evacuation heights and verify compliance with regional fire safety regulations. Last but not least, for property valuation and insurance underwriting purposes, underwriters and assessors can accurately calculate a building’s total glazing area (square metres of windows) or roof characteristics directly from their browsers, optimizing risk assessment and premium calculations.
Multi-perspective aerial images have become a standard asset for city administrations worldwide. As a fruitful collaboration between research and the private sector, the intuitive web-based tool named Measuree facilitates the extraction of simple measurements like distances as well as the AI-supported 3D mapping of complex scenes without costly visits to the area of interest. This allows municipalities of all sizes – including those that cannot afford a dedicated GIS department – to profit from the added value provided by oblique photogrammetric imagery thanks to a very attractive price-performance ratio.
Using a combination of three scanning systems to produce a single, continuous point cloud, a team of 3D scanning engineers has completed a comprehensive digital survey of Odawara Castle. This is one of Japan’s most storied feudal landmarks, with the perimeter stretching a total of nine kilometres.
The project, carried out by Artec 3D’s support team during a trade mission to Japan, was designed to create a lasting digital record of the castle for heritage preservation and future restoration work. Built more than 500 years ago during the Kamakura period, the era that gave rise to Japan’s first Shogun, the site has endured centuries of conflict, seismic damage and partial demolition. It was only formally protected as a heritage site in 1938.
Efficient approach
The central challenge was one of scale. Odawara Castle is both a national landmark and an active visitor attraction, meaning the team had to work quickly and unobtrusively. Rather than relying on tripod-mounted equipment, engineers mounted the primary scanner, Artec’s Jet system, to a backpack and walked the grounds much like any other visitor, capturing the full site from ground level at a range of up to 300 metres.
Keynan Tenenboim, a scanning expert at Artec 3D, described the efficiency of the approach: “Artec Jet scans in a linear fashion. If it takes you two minutes to walk, it’ll take two minutes to scan – the complexity of the scene has little bearing. In the same time it took for Leo to scan two to three walls, Ray II scanned a building, and Jet digitized an entire castle.”
For sections requiring greater precision, including the inner courtyard, entrance gate and a nearby mediaeval wall, the team supplemented Jet’s wide-area capture with Artec’s Ray II terrestrial scanner and Leo handheld unit. The combination allowed fine surface details such as tile patterns, ironwork rivets and carved lettering to be recorded in full.
Tenenboim noted that no single scanner would have been sufficient alone. The castle’s layout offered no clear vantage
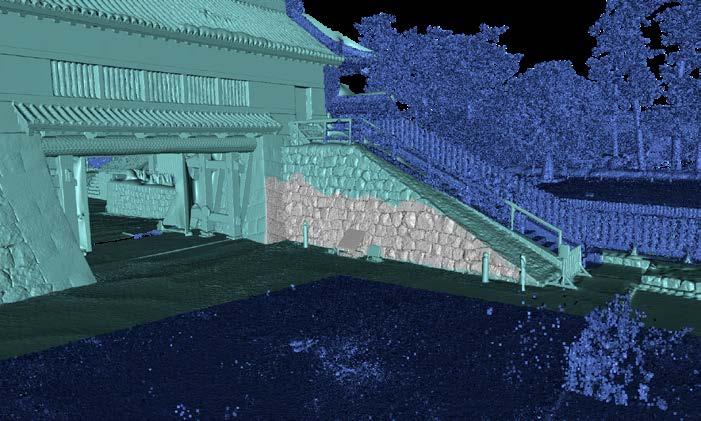
point from which its main facade could be captured at distance, ruling out a purely static approach. Jet’s range solved that problem by eliminating the need for scaffolding or elevated platforms, though he acknowledged that drone deployment could further improve roof coverage in future surveys.
From point cloud to preservation tool
Raw data was transferred to Artec’s Luxembourg headquarters via cloud sharing for processing in Artec Twins, the company’s software platform for handling large-scale scan datasets. The output is a high-density, navigable point cloud that can be merged into a full 3D mesh and exported to architectural platforms such as Autodesk Revit.
Possible applications include virtual museum experiences allowing remote visitors to explore the castle in three dimensions, and a baseline dataset against which future surveys can be compared to detect structural changes over time. Routine monitoring of this kind could support faster responses to deterioration, such as sagging in the castle’s traditional timber rooflines.
The Odawara project reflects a broader push by heritage authorities and cultural institutions to establish permanent digital records of at-risk sites before damage or decay occurs. It also illustrates how commercial scanning technology developed for industrial and construction use is increasingly finding application in cultural preservation.
By Caroline Beach
When the entire nation fits into just 26km2 of low-lying coral atolls threatened by climate change, mapping the country takes on a new meaning. For Tuvalu, which hit the headlines in 2021 when a video of the island nation sinking went viral, a georeferenced digital twin of the entire country will serve as evidence and a collective memory of land that may be underwater within decades
Tuvalu, a Pacific island nation of around 11,000 people, is already experiencing severe climate change impacts. Saltwater intrusion, chronic flooding and coastal erosion are reshaping the islands in real time. King tides force bulldozers onto the runway to push the tarmac back onto its coral foundation. In response, alongside constitutional reform and a landmark climate-refuge treaty with Australia, Tuvalu is doing something unprecedented: building a digital nation. Underpinned by full 3D Lidar scans and 360° street-level imagery, the government is creating a high-resolution digital twin of its territory and culture in the ‘Future Now’ Digital Nation initiative. This includes creating a digital twin of all its islands, paired
with digital governance tools such as online elections and digital passports. It has even amended its constitution to declare that its statehood and maritime zones remain permanent, even if parts of its land – or the entire physical country – should sink below the waves.
PLACE: a mapping data trust PLACE has been tasked with capturing the reality. Rather than being a traditional commercial mapping provider, PLACE is a global non-profit technology organization with a clear mission: to build a mapping data trust ‘for people and planet’. Its model contains several aspects that are particularly important for small island states like Tuvalu:
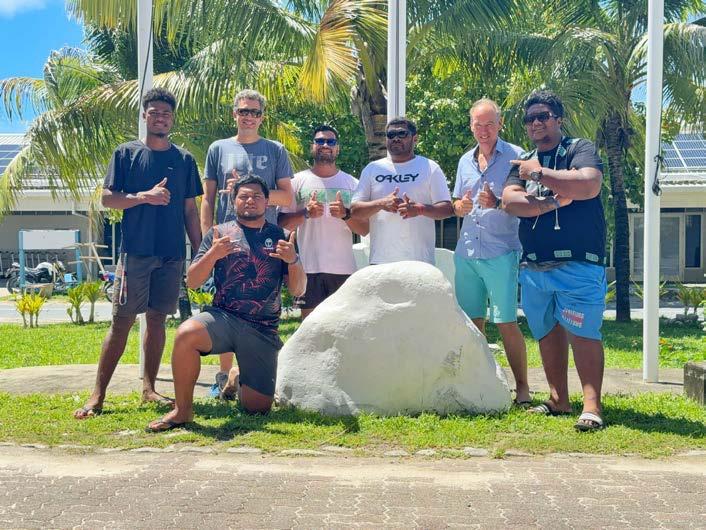
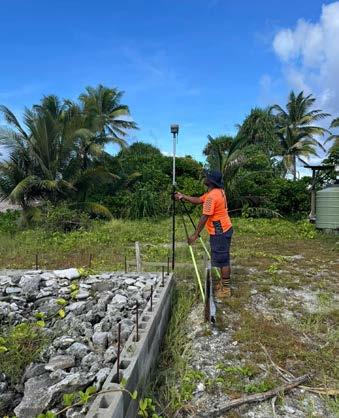
• Government ownership: PLACE collects high-resolution aerial and street imagery at no cost to governments, who retain ownership of the data. A copy is placed into a UK-based data trust that holds it in perpetuity for public-interest uses.
• Ethical sharing: The trust licenses data to a global community of users who work on climate resilience, urban development and other public-good projects, under conditions that respect privacy and national sovereignty.
• Capacity building: PLACE insists on working with local survey and land-office teams, turning each capture campaign into onthe-job training for national staff who will maintain and use the data long after the field team leaves.
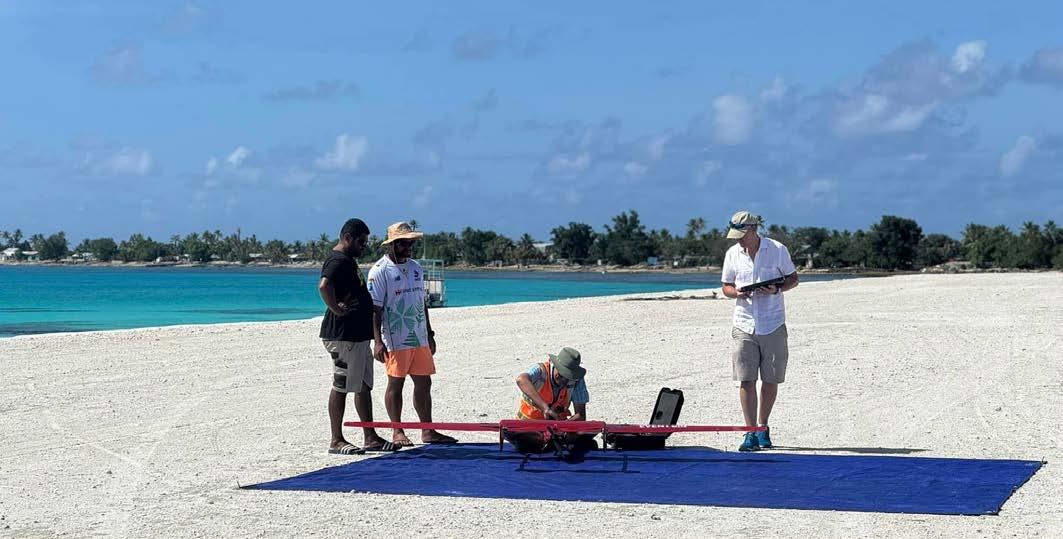
Mapping Tuvalu for cultural preservation
In 2019, the United Nations Development Programme implemented the Tuvalu Coastal Adaptation Project (TCAP). This was the first step towards mapping Tuvalu’s topography and surrounding seafloor using small aircraft with Lidar scanners. Combined with tide gauges and sea-level observations, this finally gave Tuvalu a complete picture of how water levels relate to ground height across all its islands.
To build on this foundation, in 2023 Tuvalu signed an agreement for the PLACE team, supported by the Pacific Community’s Digital Earth Pacific programme, to collect detailed mapping data for all 26km2 of land. In early 2024, PLACE flew an eVTOL uncrewed aerial vehicle (UAV) that captured more than 1,000 geotagged images of reef shapes, shorelines and built-up areas.
Next, a Mosaic 51 360° camera was mounted on a truck to capture panoramic imagery at survey-grade positional accuracy along every road in Funafuti. The same camera was mounted on a backpack for areas accessible only on foot, such as narrow paths or causeways with unstable ground.
Lastly, photogrammetry and ArcGIS Reality workflows then transformed these images into true orthophotos, 3D meshes, a detailed digital surface model (DSM) of the atoll and dense point clouds that form the backbone of a national digital twin. Existing Lidar data and tide information were integrated to model flooding and shoreline change.
Using mobile mapping for decision-making
Now the data capture is complete, ArcGIS Reality is being used to turn raw images into a multi-scale digital twin. It contains 2D products (true orthophotos and change detection outputs comparing 2019 and 2024 imagery), 3D products (detailed 3D meshes and point clouds with Lidar) and derived analytics (machine learning models for feature extraction, flood exposure maps and analysis of solar-panel potential).
The Tuvalu government is working towards digitizing the archives, preserving songs and language, conducting elections, and hosting
an immersive virtual version of Tuvalu – all on the backbone of 360° imagery, Lidar and point cloud technology. At the same time, treaties such as the Falepili Union with Australia are creating new forms of climate mobility. From a legal perspective, scholars have pointed out that there are no settled rules yet for ‘digital states’. Traditional international law assumes a permanent, physical territory, but Tuvalu and other Pacific states are pushing for recognition that maritime boundaries and statehood can remain fixed even as coastlines shift.
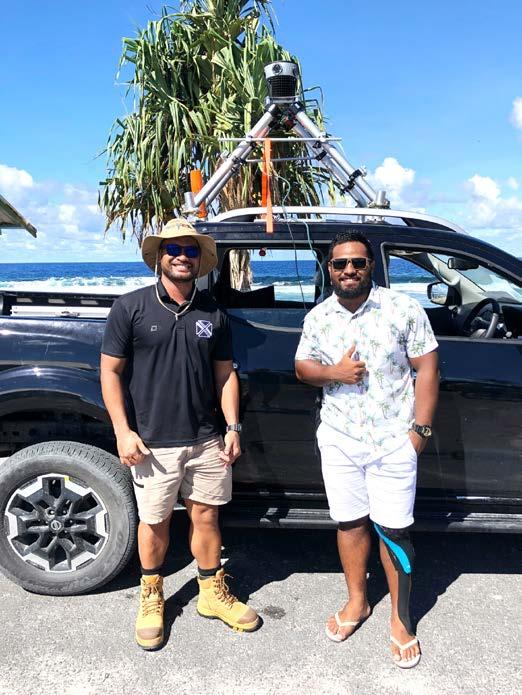

Caroline Beach is a marketing specialist at Mosaic, which specializes in mobile mapping camera systems.
The technical achievements for Tuvalu’s Digital Nation initiative are impressive. But there are also lessons to be learned about citizenship and sovereignty as landscapes shift under climate change:
1. High-quality data is a human rights issue, not just a technical one Tuvalu’s leaders have been very clear that their mobile mapping project is about preserving their culture and legal rights, not just high-tech 3D models. If the geospatial industry accepts that premise, then designing systems that make high-quality mapping affordable and sustainable for vulnerable nations becomes a moral obligation, not an optional corporate sustainable responsibility (CSR) project.
2. Durability and simplicity matter as much as specs
It is tempting to chase higher point densities and bigger sensors, but not when those increased specs come at the expense of the hardware’s ruggedness. When operating thousands of kilometres from a service centre, on roads that flood, and in intense humidity, ‘it works’ is a feature. This project is a reminder of the importance of reliability and repeatability.
3. Open ecosystems enable sovereign digital futures
PLACE’s business model, Esri’s ArcGIS Reality workflows and Mosaic’s open formats form an ecosystem that enables Tuvalu’s government to manage its data as needed. The possibilities include hosting data where it chooses, sharing carefully with international partners and researchers, and keeping post-processing options open as tools evolve or are phased out.
Conclusion
Tuvalu is the first of many countries that will have to grapple with these existential questions. Other small island countries, low-lying delta regions and even coastal megacities are already facing similar climate-related challenges. Reality capture and digital twin creation can help to manage risk and preserve heritage. The partnership between PLACE, ArcGIS, the Tuvalu government and Mosaic is one example of how the geospatial community can work together and respond to the demands of mobile mapping in the most vulnerable regions.
Scan the QR code to watch the video that brought Tuvalu’s existential crisis to the world’s attention:
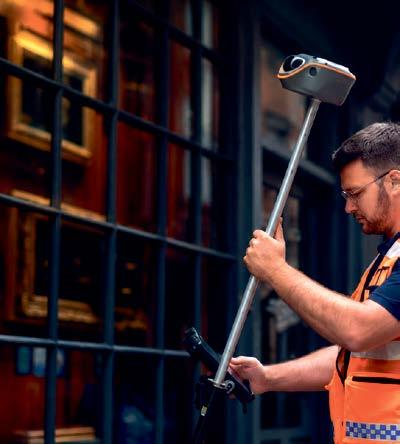


Keep surveying when GNSS signals fail with the CHCNAV ViLi i100
The CHCNAV ViLi i100 combines GNSS, a high-rate IMU, Lidar and vision sensors in one integrated surveying system. Built for demanding field conditions, it supports continuous positioning and spatial data capture across open, obstructed and GNSS-challenged environments. Surveyors can use one versatile device for positioning, mapping, contactless measurement and in-field volume calculation, reducing equipment changes and improving field productivity.


Explore the ViLi i100 capabilities and applications.

With 65 member associations represented across two General Assembly sessions on 24 and 29 May 2026, the FIG Congress in Cape Town marked both the conclusion of the current leadership term and the election of those who will steer FIG through the next four years.
For President Diane Dumashie and all ten Commission Chairs, it was a final opportunity to present the results of four years of committed work. For the federation as a whole, it was a moment of transition and forward momentum.
Elections
FIG member associations voted to elect Michalis Kalogiannakis of the Technical Chamber of Greece as president for 2027–2030. As a serving vice president, his election to the presidency created a vacancy in the vice-presidential team, which was filled by Peter Ache of DVW, the German Association for Geodesy, Geoinformation and Land Management, for a two-year term (2027–2028). Joining the team for the full 2027–2030 term are Winnie Shiu of the Alliance of Hong Kong Authorized Land Surveyors and Stephen Djaba of the Licensed Surveyors Association of Ghana. The fourth vice president, Yan Qin of the Chinese Society for Geodesy, Photogrammetry and Cartography,
continues in the role to which she was elected in 2024. The FIG Congress 2030 will be hosted in Qingdao, China, submitted by the same society.
The reports from Commissions, Networks and Permanent Institutions gave a clear picture of a highly active federation. Three Task Forces – on FIG and the SDGs, Climate Compass, and Diversity and Inclusion in the Surveying Profession – each presented substantial results from their four-year terms.
The SDGs Task Force has embedded sustainability goals across all commission and network activities, and at the Congress itself every session was marked with its relevant SDG goals. Participants were invited to identify their own role in relation to the goals, whether as someone who delivers, advocates, innovates or collaborates.
The Climate Compass Task Force published two FIG publications during its term, drawing on outcomes from the FIG Regional Conference in Nepal as well as four years of practical work addressing surveying’s role in climate resilience across land, water and marine environments. The Diversity and Inclusion Task Force ran annual legacy
projects from 2024 to 2026, engaging young people in Ghana, Brisbane and, most recently, at a primary school in Cape Town.
The FIG Foundation’s 25th anniversary was reflected in the numbers: 315 grants awarded, €503,000 distributed, and recipients supported across 86 countries on six continents. Bryn Fosburgh, president of the FIG Foundation and a long-standing supporter of FIG, was named an Honorary FIG Ambassador. The Foundation continues to welcome donations from members and individuals alike.
In her closing remarks, President Dumashie acknowledged the breadth of activity represented at the Congress and expressed her appreciation to the local organizers. The FIG flag was handed by Peter Newmarch, SAGI, to Norway’s Kari Strande, looking ahead to the FIG Working Week 2027 in Stavanger. That will be followed by Paris 2028, where FIG will mark its 150th anniversary in various ways and with the close inclusion of FIG members.

When people think about geospatial technologies, they often picture drones, digital twins, laser scanners or smart maps. Much less visible are the underlying geodetic and surveying foundations that make these technologies reliable and interoperable.
The Geodesy Cartoon initiative was created to help bridge this gap by communicating geodesy, surveying and geospatial infrastructure in a simple, engaging and visually accessible way.
Since its launch in 2024, the initiative has developed into an international outreach and science communication project featuring cartoons and illustrations on topics ranging from GNSS and satellite positioning to cadastral surveying, land administration, engineering surveying, gravity field determination, mapping and Earth observation. By translating complex concepts into visual storytelling, the cartoons help explain how geospatial technologies work and why accurate reference frames and measurements matter for society.
challenge of getting noticed
The initiative addresses a common challenge across the geomatics sector: many technologies are highly visible, while the underlying geodetic infrastructure often remains unnoticed. Yet precise positioning, digital twins, autonomous systems, smart cities, climate monitoring and resilient geospatial data infrastructures all fundamentally depend on accurate surveying and geodesy.
The cartoons are designed for broad use in education, outreach, presentations, social media communication and promotion of surveying and geospatial professions. They are particularly useful as introductory material for students and non-specialists, helping to make technical subjects easier to understand and communicate.
A major recent milestone was the international Geodesy Cartoon Competition, whose winners were announced during the EGU General Assembly 2026 in Vienna, Austria. The competition attracted 274 submissions from 119 cartoonists across
46 countries, demonstrating strong global interest in creative geospatial science communication. The exhibited cartoons covered a wide spectrum of topics relevant to the geomatics community and highlighted the potential of visual communication to connect science, professional practice and society.
All cartoons are openly available under a Creative Commons licence, encouraging reuse, translation, adaptation and dissemination worldwide. The initiative is coordinated through the Global Geodetic Observing System (GGOS) and the International Association of Geodesy (IAG), with support from the Federal Office of Metrology and Surveying (BEV) in Vienna, Austria.
By Martin Sehnal, director of IAG-GGOS Coordinating Office

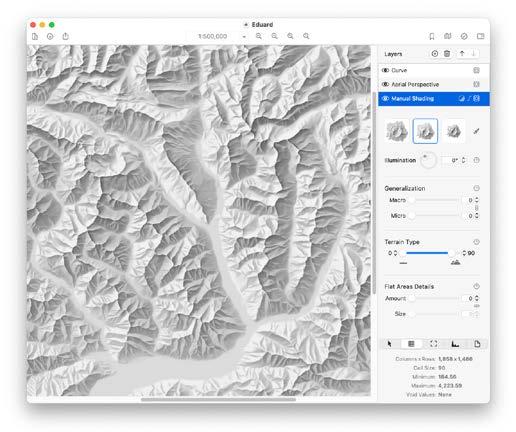
GeoAI has been integrated into relief shading applications such as Eduard, a tool designed for cartographers creating terrain maps.
Artificial Intelligence is rapidly transforming the geospatial domain. Today, GeoAI can extract information from satellite imagery, identify patterns in large spatial datasets, support environmental monitoring, and generate maps and visualizations at unprecedented speed. While creating new opportunities for science, government, industry and society, these developments also raise an important question: how can increasingly complex AI-generated results be translated into forms that people can understand, trust and use for decisionmaking? Cartography has long addressed precisely this challenge. As geospatial technologies evolve towards broader forms of spatial intelligence, its relevance may become more important than ever.
The role of cartography extends far beyond map production. At its core, cartography is concerned with transforming spatial data into meaningful information and communicable knowledge. Over decades, the discipline has developed principles for abstraction, generalization, visualization, uncertainty communication and user-centred design. These methods emerged because geographic reality is inherently complex and because access to data alone rarely leads to understanding.
Explainability, transparency and trust
In many respects, GeoAI now faces similar challenges. The increasing analytical power
of modern AI systems is often accompanied by decreasing transparency. Users may receive predictions, classifications or recommendations without fully understanding how these results were generated, which assumptions underpin them, or where their limitations lie. As GeoAI becomes increasingly integrated into urban planning, mobility, environmental management, disaster response and sustainable development, issues of explainability, transparency and trust become more important. The information must be understandable and interpretable within a broader spatial context. This is where cartographic thinking can make an important contribution.
Maps have always served as more than repositories of information. They provide context, reveal spatial relationships, support reasoning and facilitate communication. Through careful design, maps reduce complexity without losing essential meaning. They help users move from data towards understanding. Many challenges faced by contemporary AI systems resemble classical cartographic problems. A map cannot depict everything. It must decide what is relevant, what can be simplified, and how information should be organized to support human cognition. Similar questions arise when AI systems process vast amounts of spatial information and determine what
should be presented to users. In this sense, cartography offers not only methods for visualization but also conceptual approaches for managing complexity.
Looking ahead, maps may increasingly serve as interfaces between humans and intelligent spatial systems. Rather than receiving opaque outputs from algorithms, users should be able to explore, contextualize and critically assess AI-generated information through spatial representations that support understanding and decision-making.
The ICA actively supports this transition. Through its commissions, conferences, publications and international collaborations, the ICA advances research in geovisualization, spatial cognition, visual analytics, user-centred design and explainable GeoAI. Through its engagement with the United Nations, the International Science Council and partner organizations worldwide, the ICA helps ensure that technological innovation remains connected to societal needs.
By Georg Gartner, president, International Cartographic Association

An ISPRS STudent and Early Professionals Consortium (STEP, formerly known as Student Consortium [SC]) Student Chapter is a local group of registered consortium members established to advance the mission and vision of ISPRS STEP by promoting geospatial education, networking, leadership and professional development opportunities within their institution or region.
The Student Chapter network was created to strengthen the global footprint of ISPRS STEP by bringing together local university student groups and young professional communities in the field of photogrammetry, remote sensing and spatial information science. The chapters promote diversity and inclusion by engaging students from different regions, cultures and academic backgrounds while fostering equitable access to geospatial technologies and professional development opportunities. Through local activities and international collaboration, the programme aims to accelerate skill development in areas relevant to ISPRS and inspire emerging researchers through networking, knowledge exchange and leadership opportunities.
The inaugural cohort of four Student Chapters was officially launched by Lena Halounová on 7 November 2024 during the ISPRS SC Networking Event at the
ISPRS Technical Commission III Mid-Term Symposium in Belém, Brazil. The formal establishment of local ISPRS STEP affiliated student communities has been one of the most significant initiatives undertaken by the current STEP Board of Directors (BODs) (2022-2026), building on the concept originally developed by previous ISPRS SC BODs (2016-2022).
Since its launch, the programme has experienced steady growth, with 11 active Student Chapters worldwide and an additional four applications under review at the end of 2025. Prospective chapters are required to demonstrate a minimum of 12 founding members, together with an advisor, and should submit an activity plan covering the following one to two years.
To strengthen collaboration among chapters and maintain engagement across regions, the Consortium has organized seven virtual breakout sessions since the programme’s inception. These sessions are designed to foster one-to-one communication, networking and peer learning among chapter members.
In addition, guest speakers from the ISPRS community are regularly invited to share their expertise and experiences on topics
such as career development, research publication, publishing strategies and doctoral studies. Participants particularly value the opportunities for international networking, knowledge exchange and direct interaction with experienced researchers and professionals. The bi-monthly virtual breakout session format also plays a role in strengthening connections across the global ISPRS STEP community and provides a platform for sharing experiences, challenges and best practices.
For 2026, ISPRS is providing a mini-grant of US$300 per Student Chapter for a maximum of 15 SCs. This is intended to strengthen local engagement, support chapter-led initiatives and enhance capacity-building activities at the institutional and regional levels.
Through the continued expansion of the Student Chapter network and the delivery of regular engagement activities, this initiative has become a cornerstone of ISPRS STEP’s efforts to connect, support and empower students and young professionals worldwide.
What factors matter most when choosing a handheld 3D scanner ?
How do I set up an accurate survey in a GNSS-denied environment ?

Which sensor-drone combination is the best fit for coastal mapping ?
Available now on: