The new age of Earth observation A guide for land surveyors and GIS specialists
Geo3D: Estonia’s spatial data strategy
AI-powered Lidar point cloud classification
Surveying the HS2 tunnels in London

The new age of Earth observation A guide for land surveyors and GIS specialists
Geo3D: Estonia’s spatial data strategy
AI-powered Lidar point cloud classification
Surveying the HS2 tunnels in London
What factors matter most when choosing a handheld 3D scanner ?
How do I set up an accurate survey in a GNSS-denied environment ?

Which sensor-drone combination is the best fit for coastal mapping ?
Available now on:
Director Strategy & Business Development
Durk Haarsma
Financial Director Meine van der Bijl
Technical Editor Huibert-Jan Lekkerkerk
Contributing Editors Dr Rohan Bennett, Lars Langhorst
Head of Content Wim van Wegen
Copy Editor Lynn Radford, Englishproof.nl
Marketing Advisors Myrthe van der Schuit, Sandro Steunebrink
Circulation Manager Adrian Holland
Design Persmanager, The Hague
GIM International, one of the worldwide leading magazines in the geospatial industry, is published five times per year by Geomares. The magazine and related website and newsletter provide topical overviews and reports on the latest news, trends and developments in geomatics all around the world. GIM International is orientated towards a professional and managerial readership, those leading decision making, and has a worldwide circulation.
Subscriptions
GIM International is available five times per year on a subscription basis. Geospatial professionals can subscribe at any time via https://www.gim-international.com/subscribe/ print. Subscriptions will be automatically renewed upon expiry, unless Geomares receives written notification of cancellation at least 60 days before expiry date.
Advertisements
Information about advertising and deadlines are available in the media planner. For more information please contact our marketing advisor: myrthe.van.der.schuit@geomares.nl.
Editorial Contributions
All material submitted to Geomares and relating to GIM International will be treated as unconditionally assigned for publication under copyright subject to the editor’s unrestricted right to edit and offer editorial comment. Geomares assumes no responsibility for unsolicited material or for the accuracy of information thus received. Geomares assumes, in addition, no obligation to return material if not explicitly requested. Contributions must be sent for the attention of the head of content: wim.van.wegen@geomares.nl.
A drone-borne survey of 118 hectares of terrain under inspection for a wind farm in Ireland has demonstrated that airborne gamma-ray spectrometry is a useful and accurate method for mapping peat thickness in various terrains.
In this exclusive interview, Dr Lilian Pintea of the Jane Goodall Institute explains how geospatial technologies are reshaping long-term ecological research, restoration monitoring and human-centred conservation across Africa.
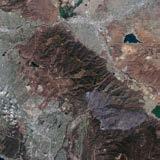
This article explores the most relevant recent innovations that are transforming raw satellite data into high-precision tools for mapping and monitoring. In particular, the focus is on their practical application in surveying and GIS workflows.
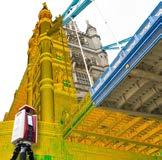
A kinematic scanning project carried out on the River Thames has demonstrated the advantages of mobile mapping under real-world conditions within a limited time frame. Operating from a launch vessel, the survey covered a 12km stretch between Tower Bridge and Lambeth Bridge.
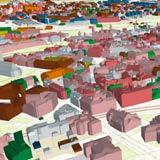
Digitally agile Estonia is well known for implementing many technological solutions that other countries are still struggling with, e.g. a secure and unified data exchange system in the public sector. This article focuses on Geo3D, the new masterplan for spatial data production and usage.
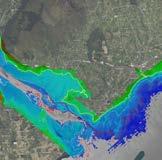
This article examines how airborne Lidar bathymetry has been successfully used to survey the full coastal zone of Northern Ireland, representing the first bathymetric Lidar project of this scale undertaken in the United Kingdom.
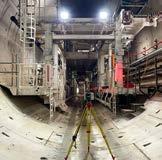
Six tunnel-boring machines are carving HS2 railway tunnels beneath London through challenging ground. Precision engineering guides them within millimetres using gyroscopic control over 8km, laser scanning for design decisions, and a 21km survey reconciling two underground control systems.
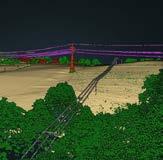
The Digital Twin Germany project faces a key challenge: efficiently processing vast spatial data without compromising quality. This article explores how AI-powered Lidar point cloud classification is rising to meet it.
Geomares
The Netherlands
T: +31 (0) 514-56 18 54
F: +31 (0) 514-56 38 98 gim-international@geomares.nl www.gim-international.com
No material may be reproduced in whole or in part without written permission of Geomares. Copyright © 2026, Geomares, The Netherlands All rights reserved. ISSN 1566-9076
Cover story
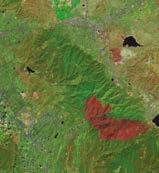
Sentinel-2C, launched in September 2024, delivers enhanced multispectral imaging for land and coastal monitoring at 10 to 60m resolution across 13 spectral bands. For surveyors, this unlocks more accurate vegetation indices like NDVI, strengthening applications in precision agriculture and forestry, as seen in this imagery of California’s fire-affected areas. (Image courtesy: ESA)



Exhibitor Highlight Package
Logo on dedicated event page on website of GIM International
Logo and booth number in two extra dedicated Intergeo newsletters
Logo and booth number in GIM International Trail
1/4-page ad in Intergeo issue of GIM International

Logo on dedicated event page on website of GIM International
Logo and booth number in two extra dedicated Intergeo newsletters
Product spotlight for 1 month on home page and dedicated event page
3 social posts before, during and after the event
Targeted remarketing campaign (>500 clicks)
EUR 2,950
1/4-page ad in GIM International Trail for Intergeo EUR 2,500
Logo and booth number in GIM International Trail
Logo and booth number in two extra dedicated Intergeo newsletters
1/2-page ad in GIM International Trail

There are some editions of our publication in which the articles we bring together seem to form a greater whole naturally. This is one of them. All the features, interviews and technical deep-dives in this issue illustrate a fundamental urge at the heart of the geospatial profession: no matter how challenging, remote or inhospitable a place may be, people will find a way to map it. In fact, tough conditions only strengthen their drive to measure, understand and document the terrain.
Let’s start in a complex, hidden world: deep beneath the streets of London, one of the world’s most densely populated cities. As part of Britain’s new high-speed railway network (HS2) project, six tunnel boring machines are driving through clay, sand and ever-shifting ground. The challenge not only is technical but also geometric; machines steered from multiple directions towards a single convergence point are required to meet with high precision within a pre-built steel reception structure with tight positional tolerances. The surveyors working here operate quite literally in the dark, and still deliver work of the highest standard.
Next, we head to the tropics, where we turn our attention to Gombe, Tanzania – the place where Jane Goodall began her pioneering chimpanzee research back in 1960. Today, six decades of continuous field research are intersecting with Lidar, UAVs, satellite constellations and generative artificial intelligence. In an exclusive interview with GIM International, Dr Lilian Pintea of the Jane Goodall Institute explains how geospatial technology is transforming long-term ecological research and how innovation can contribute to a human-centred, sustainable approach to conservation.
Returning to London, but this time on the water, we highlight a kinematic scanning project on the River Thames. Conducted from a launch vessel, the aim was to map a 12km-long section between Tower Bridge and Lambeth Bridge using Lidar and radar scanning. The project demonstrates how mobile mapping delivers reliable results even in complex real-world circumstances, such as in this dynamic river environment with continuous vessel movement and variable GNSS conditions.
From London, we head across to Ireland, where airborne gamma-ray spectrometry was used in a drone-borne survey to inspect 118 hectares of terrain for a wind farm, resulting in the creation of predictive maps. This project not only shows that spatial variations in peat thickness can be assessed reliably from airborne as well as groundbased surveys, but above all demonstrates the efficiency and reliability with which a drone-based setup can survey difficult terrain, making it a strong fit for a wide range of site investigations.
And last but not least, we bring you a fascinating article from – and about – Estonia. This country, which has long led the way in digital innovation, now presents Geo3D: a masterplan for 3D spatial data in the public sector. From lower data-production costs and better open data to digital twins and map-based AI systems, Estonia shows what becomes possible when government, technology and vision align.
What connects all these projects is more than just technology alone. It is the determination of people to map what others consider to be unmappable. This edition celebrates surveyors who descend, ascend, sail and innovate – because every place on Earth deserves to be known.
The launch of two new immersive websites that allow anyone to explore the Italian archaeological sites of Pompeii and Civita di Bagnoregio (‘The Dying City’) illustrates how quickly and easily Gaussian Splatting can transform imagery into vivid online experiences. They are both part of Project ETERNAL, a global initiative in which CyArk is partnering with 360° imaging innovator Antigravity. CyArk is a nonprofit organization dedicated to sharing and preserving the world’s culture. Project ETERNAL began with cultural heritage as a powerful test case for the emerging AI-driven process known as Gaussian Splatting. In combination with Antigravity’s 360° capture technology, this rapidly transforms imagery into highly realistic, explorable 3D environments. By streamlining the workflow from capture to immersive experience, this approach represents a significant shift in how quickly and easily spatial content can be created and shared. Both the fragile, eroding landscape of Civita di Bagnoregio and the remarkably preserved remains of Pompeii reflect the urgency of documenting places at risk. Working closely with local partners, including the Municipality of Pompeii and the city of Civita di Bagnoregio, CyArk and Antigravity captured and translated these sites into interactive, web-based experiences.
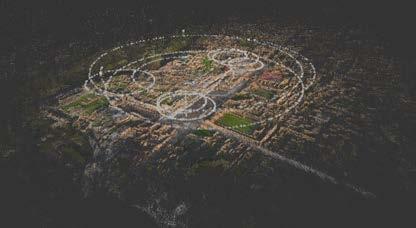
When combined with 360° capture technology, Gaussian Splatting rapidly transforms imagery into highly realistic, explorable 3D environments, as demonstrated here with Pompeii. (Image courtesy: CyArk)

The Sanborn Map Company has expanded the deployment of its advanced airborne Time Domain Electromagnetic (TDEM) survey systems through its Sanborn Geophysics Group. Increased investment in airborne geophysical surveys is being driven by the need to identify new mineral resources and ensure a stable supply of critical minerals for various industries. Airborne TDEM surveys enable rapid, highresolution mapping of subsurface electrical conductivity, allowing geoscientists to identify geological formations commonly associated with nickel, copper, cobalt, lithium and rare earth element deposits. The technology helps exploration teams evaluate large regions quickly and prioritize the most promising drilling targets. “Airborne electromagnetic surveys are one of the most effective tools for subsurface mapping and also identifying concealed mineral systems,” said Kevin Killin, P.Geo, chief geophysicist at Sanborn Geophysics ULC. “Our instruments allow exploration teams and government agencies to rapidly map prospective regions and focus investment where geological potential is highest.”
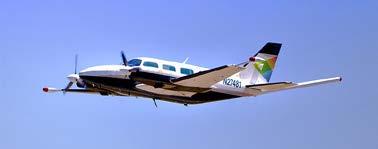
By integrating electromagnetic, magnetic, radiometric and Lidar data, Sanborn Geophysics ULC’s airborne surveys reveal how surface geology connects to the mineral systems below. (Image courtesy: Sanborn)

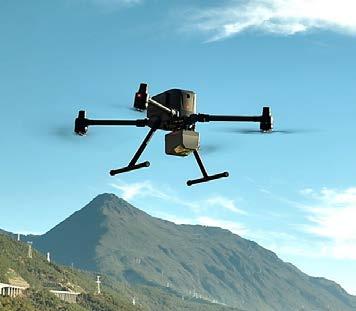

CHC Navigation (CHCNAV) has unveiled the AlphaAir 6 (AA6), its latest flagship airborne Lidar system aimed at professionals conducting aerial surveys in highrelief and complex terrain. The launch addresses growing demand for UAVbased mapping solutions capable of operating efficiently across challenging environments, from mountainous topography to dense vegetation and built-up areas, where conventional survey methods are slow or impractical. The AA6’s headline specification is a maximum ranging capability of 2,100m, with typical operational flight altitudes of 400-600m above ground level. At its core is a fifth-generation real-time waveform processing engine paired with advanced multi-period technology, enabling a pulse repetition rate of two million pulses per second while maintaining real-time point cloud output. This gives operators immediate in-flight visibility and a faster route to survey-grade 3D results according to CHCNAV, a positioning and geospatial technology company operating across more than 140 countries. The system incorporates a high-grade inertial measurement unit (IMU) with 0.3°/h bias stability. The company says this improves trajectory accuracy and eliminates the need for pre-mission IMU calibration, a step that has traditionally added time and complexity to aerial survey workflows.
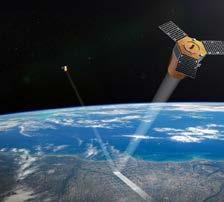
The Twinspector satellite constellation is set to advance Europe’s capability for infrastructure monitoring. (Image courtesy: LiveEO)
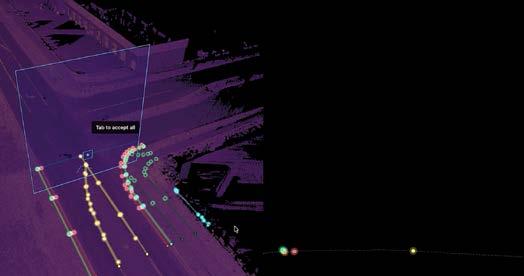
As infrastructure demands continue to outpace workforce growth, one San Francisco-based startup is betting that artificial intelligence can close the gap. Mach9 has unveiled Digital Surveyor 2, the latest version of its Lidar feature extraction platform. According to the company, this can result in project completion times up to 100 times faster, with no sacrifice in accuracy. The release targets a welldocumented pressure point in the surveying and civil engineering sector. Across telecom, transportation and utilities, the adoption of Lidar scanning technology has accelerated sharply, yet production teams have not grown at the same pace. Skilled technicians continue to spend significant portions of their time on repetitive digitization work, creating bottlenecks that limit how many projects firms can take on. Digital Surveyor 2 is designed to address that imbalance directly. At the core of the platform is an AI-powered extraction engine that suggests linear features – kerbs, pavement edges, guardrails and barriers – directly from Lidar point clouds, adapting in real time to each individual user’s drawing patterns. The suggestions remain fully editable, a design choice Mach9 says is central to maintaining the quality control that engineering-grade deliverables require. The platform also includes advanced draping capabilities, improved corner snapping and integrated quality assurance tools, allowing reviewers to verify extractions in 3D without switching between applications.

LiveEO’s dedicated satellite constellation for infrastructure monitoring, Twinspector, has been allocated a seven-digit figure in funding from the InCubed programme of the European Space Agency (ESA) just a few weeks after being announced. The funding supports the next phase of development of the Twinspector satellite system and advances a dedicated European capability for infrastructure monitoring and independent access to very-high-resolution Earth observation data. The ESA InCubed programme, an Earth observation programme managed by ESA Φ-lab, supports innovative commercial Earth observation initiatives across Europe. In Germany, participation in the programme is coordinated by the German Space Agency at the German Aerospace Center (DLR) on behalf of the Federal Ministry of Research, Technology and Space (BMFTR). Twinspector is a satellite constellation specifically designed around the operational needs of infrastructure operators. Unlike most optical Earth observation missions, which are typically optimized for general-purpose imaging, Twinspector is tailored to capture long, narrow corridors such as power lines, railways and pipelines. With a spatial resolution up to 35cm in 3D stereo and a wide swath optimized for corridor mapping, Twinspector will deliver very-high-resolution imagery for largescale infrastructure networks. By using a dedicated imaging approach with two satellites flying in formation, Twinspector will capture stereo data enabling three-dimensional analysis. LiveEO will use this data to measure vegetation height along infrastructure corridors such as power lines or railways and to identify risks like falling trees or excessive growth before they become critical.

Artec 3D has announced Artec Jet, a SLAM-based Lidar scanner designed for precision data capture across large and difficult-to-access environments. The device supports seven deployment configurations – handheld, backpack, drone, vehicle mount, protective cage, telescopic pole, and robotic integration – and is engineered to operate in GNSS-denied spaces, underground settings, hazardous sites and low- or zero-light conditions where conventional mapping equipment cannot function. The scanner achieves ±10mm indoor accuracy and detects changes as small as 5mm, within the range of survey-grade mobile mapping systems. RTK accessories support GNSS-assisted georeferencing for improved positional accuracy across large sites. A 360° x 290° field of view, optional colour cameras and a companion app for on-site data verification round out the core feature set. “With Artec Jet, we’re entering an exciting new chapter,” said Art Yukhin, president and CEO of Artec 3D. “Our mission has always been to make 3D scanning as fast, accurate and intuitive as possible. Artec Jet expands this approach into larger environments, empowering our customers to capture infrastructure with the same level of confidence and ease.”


Razor-sharp 3D aerial imagery of the Netherlands is now available in ArcGIS
Esri and Kavel 10, a provider of high-quality Lidar data and aerial imagery, have launched a new premium 3D data bundle offering highly detailed and realistic spatial coverage of the Netherlands. Updated annually, the dataset captures aerial imagery at a resolution fine enough to distinguish small objects such as manhole covers and traffic signs, giving organizations direct access to current, reliable spatial information within ArcGIS. By making high-quality 3D data more accessible, the two parties aim to lower the barrier to adoption for organizations working on challenges related to the energy transition, climate adaptation, and the design and redesign of public space. Demand for accurate, accessible and immediately actionable 3D spatial data is growing fast, particularly among organizations in construction, infrastructure, utilities and government. The ability to quickly understand existing conditions and build a clear, defensible rationale for key decisions is becoming a baseline requirement, not a differentiator. The new 3D data bundle from Esri and Kavel 10 combines two complementary strengths to address this directly. Kavel 10 – which flies its own aircraft across the entirety of the Netherlands every year, producing a complete, high-quality and uniformly consistent national 3D dataset – brings the raw material. Esri Nederland brings the platform: ArcGIS technology that turns that data into something organizations can act on. Together, they shorten the path from spatial data to informed decision-making, particularly in projects with significant spatial impact.
GEO Business 2026 opens registration with expanded programme
Registration is now open for GEO Business 2026, the UK’s leading geospatial conference and exhibition, which is returning to ExCeL London on 3 and 4 June. This year’s GEO Business promises its most comprehensive programme yet, with more than 150 CPD-accredited sessions spread across eight stages, featuring over 200 speakers drawn from some of the UK’s most prominent organizations. Confirmed speakers include representatives from BT, Esri UK, DEFRA, Mastercard, Mott MacDonald, the NHS, Ordnance Survey, TomTom, and the World Geospatial Industry Council, among others. The programme spans the full breadth of geospatial data and location intelligence, with themes including artificial intelligence, climate resilience, digital twins and emergency response. Sessions are designed to appeal to professionals at every level – from GIS analysts and surveyors to urban planners, spatial data scientists and senior technology decisionmakers. One of the sessions already generating interest is ‘AI Ate My GIS’, in which Sparkgeo’s CEO Will Cadell examines how AI is reshaping the mapping industry and what it means for geospatial professionals. Mastercard’s Director of Software Engineering Usama Shamma will explore how AI coding agents are transforming software engineering roles. Other highlights include a live mapathon with the Humanitarian OpenStreetMap team, a detailed survey of London’s brutalist Barbican complex, and a geospatial deep-dive into regional behavioural differences across the UK, led by BT’s lead geospatial data scientist. Alongside the seminar programme, the event will feature more than 100 exhibitors showcasing the latest in geospatial technology, offering attendees the opportunity to see cutting-edge solutions in action and gather practical insights for their own organizations.

GEO Business 2026 is free to attend. Further details and registration are available at the official event website: geobusinessshow.com.
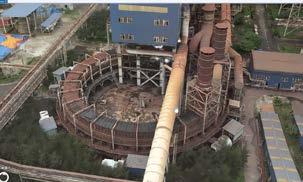
The new 3D data bundle solution is built around Gaussian Splatting, currently one of the most talked-about techniques in the geospatial sector. (Image courtesy: Kavel 10/Esri Nederland)


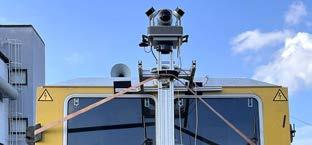
The high-performance JAWESO Panora Pro PL was deployed on a rail vehicle to create accurate, high-detail maps of rail infrastructure corridors. (Image courtesy: Deutsche InfraSoft / JAWESO)
Germany’s rail infrastructure has taken a significant step towards data-driven maintenance, with Deutsche InfraSoft completing a large-scale mobile mapping project covering 4,000km of track corridor across the country. The initiative, carried out using JAWESO’s Panora Pro PL and Planar mapping systems, establishes a comprehensive digital foundation for inspection, documentation and maintenance planning within the Deutsche Bahn environment. The scale and pace of the project were demanding. Operating daily in the field, recording teams captured 200-300km of track per day at speeds of up to 80km/h. The systems ran continuously through challenging conditions, including freezing temperatures, snow and heavy rain, without interruption. Consistent uptime was a prerequisite for keeping a project of this scope on schedule. At the heart of the data capture is image resolution. The JAWESO Panora Pro PL produces georeferenced 360° panoramas at 200MP, a specification that proves critical in a rail context. At this level of detail, smaller components and surface conditions that would be lost in standard imagery remain clearly visible and can be reviewed remotely, reducing costly return visits to site and making office-based analysis significantly more efficient. Alongside the panoramic imagery, trajectory and point cloud data was recorded simultaneously. Realtime sensor fusion combining GNSS/IMU correction data with Lidar delivered a high-quality positional baseline in the field. In postprocessing, JAWESO’s DoubleSLAM algorithm further refined the trajectory and point cloud, particularly in tunnels and areas with weak satellite coverage. These are precisely the sections that most often determine whether a rail dataset is fit for operational use.

By Ronald Koomans, Koos de Vries, Silke Ceulemans and John Whiteford
Information about peat thickness is not only relevant in the context of peatland conservation and climate adaptation, but also for engineering applications and infrastructure planning. A drone-borne survey of 118 hectares of terrain under inspection for a wind farm in Ireland has demonstrated that airborne gammaray spectrometry is a useful and accurate method for mapping peat in various terrains. The radiometric data revealed a clear relationship between gamma count rates and peat thickness, enabling the creation of predictive maps. This case study shows that spatial variations in peat thickness can be assessed reliably from airborne as well as ground-based surveys.
In line with national and EU climate targets, Ireland is committed to reducing greenhouse gas emissions and increasing its share of renewable energy, including by significantly increasing the nation’s onshore wind capacity. The Carrigeen Wind Farm is a land-based site that involves the potential development of about 11 wind turbines across two clusters. In the prospective phase of the project, information on the soil and underground is crucial – not only for the installation of the turbines, but also for planning roads and creating a power grid connection to a local substation.
The region around Carrigeen is underlain by Lower Carboniferous limestone covered with Quaternary glacial and post-glacial deposits.
These deposits are locally covered with peat accumulations. From a geotechnical perspective, information on the spatial distribution and thickness of these peat accumulations is crucial. However, mapping the spatial extent of peat is a challenge. Traditionally, peat thickness is measured with methods such as coring, which is slow and can be difficult when the terrain is difficult to access. A comparative test was therefore set up to investigate whether gamma-ray spectrometry can provide information on peat thickness at the accuracies needed for spatial planning.
For this case study, an MS-350 CsI gamma-ray spectrometer weighing 2.7kg was mounted
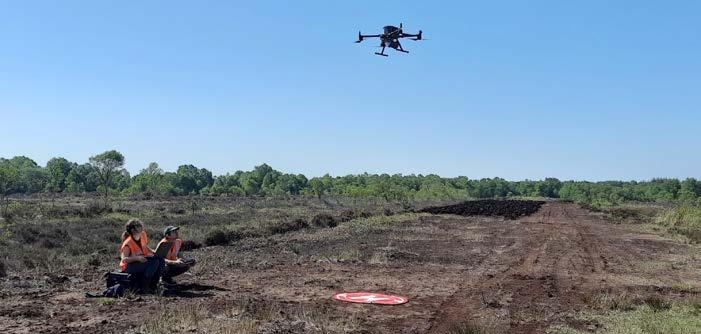
under a DJI Matrice 350 drone (see Figure 1). The detector was linked to the drone’s differential GNSS stream via the SPH Skyhub, which integrates sensor data, positioning and flight control within a single platform.
Flight lines covered a total length of approximately 40km, flown at altitudes of 20-30m above ground level. At these heights, the sensor footprint was sufficiently large to provide continuous coverage while maintaining the spatial resolution required for peat thickness mapping. In total, 25 individual flights were required to complete the 118-hectare survey, which was executed over a period of two days.
Reference observations from a total of 110 corings were available for calibration of the gamma-ray signal measurements. These corings had already been placed in an earlier phase of the project which required approximately three weeks to complete.
At each coring location, the gamma-ray signal was sampled from the total count grid produced after the survey. The data showed a clear relationship between gamma count rate and peat thickness. The attenuation of the gamma-ray signal by peat can be described by an exponential decay model. To estimate peat thickness using gammaray measurements collected by the drone,
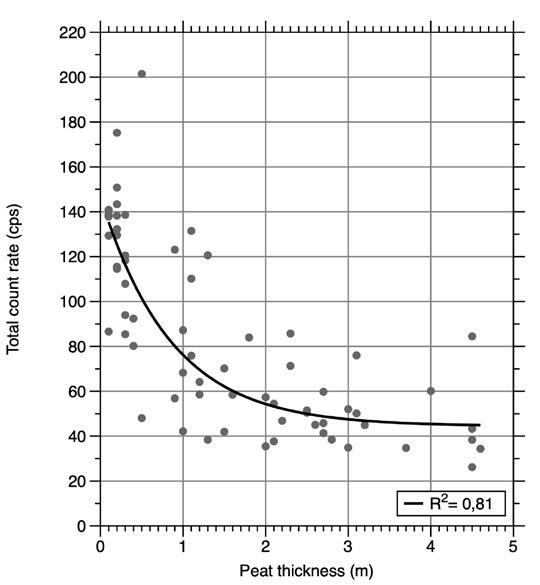
Figure 2: Correlation between total count rate measured with the MS-350 gamma-ray sensor and the peat thickness for the western area. The line represents the best fit of the exponential decay model, described in literature.
this model was fitted to the data for the western and eastern areas separately (see Figure 2).
The peat thickness map (see Figure 3) clearly demonstrates a strong spatial correspondence between the peat thickness derived from gamma-ray measurements and the thickness observed in coring data. Thicker peat deposits are mainly found in the low-lying, river-related
Various geophysical techniques for mapping the thickness and spatial extent of peat layers in an efficient and non-invasive manner have been studied with growing interest in recent years. One of these methods is gamma-ray spectrometry. A gamma-ray spectrometer measures the natural background radiation emitted by radionuclides (such as potassium, thorium and uranium) present in mineral soils and bedrock. When these materials are covered by peat, the emitted gamma radiation is partially absorbed before reaching the detector. A thicker layer of peat will reduce the measured gamma ray intensity accordingly.
geomorphological features, while shallower peat occurs towards the margins, reflecting the underlying landscape controls on peat accumulation.
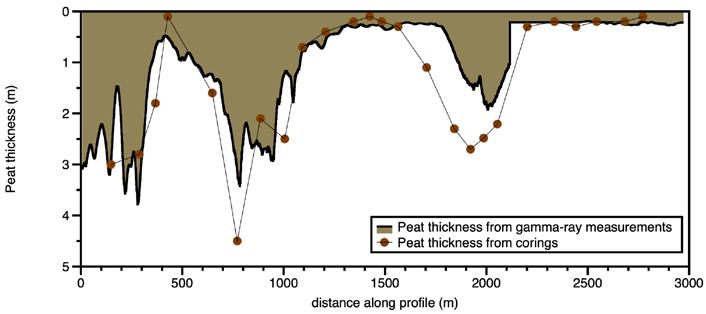
A cross-section along the black line in Figure 2 shows how the depth measurements with the gamma-ray sensor correspond with the corings that were placed within a region of 50m along that line. This data illustrates the agreement between both measurement approaches. Along this profile, peat thickness derived from gammaray measurements closely follows the depth trends observed in the corings. Both datasets identify the same major thickness maxima and minima, as well as rapid transitions over short distances, indicating that the gamma-ray sensor is sensitive to changes in peat thickness at the sub-field scale.
An underestimation of peat thickness by the gamma-ray measurements is observed at the third peak around 2,000m. This local underestimation is likely related to heterogeneity in peat moisture content, which can lead to an underprediction of thicker peat packages. Minor discrepancies between the two methods can further be attributed to the point-scale nature of corings versus the
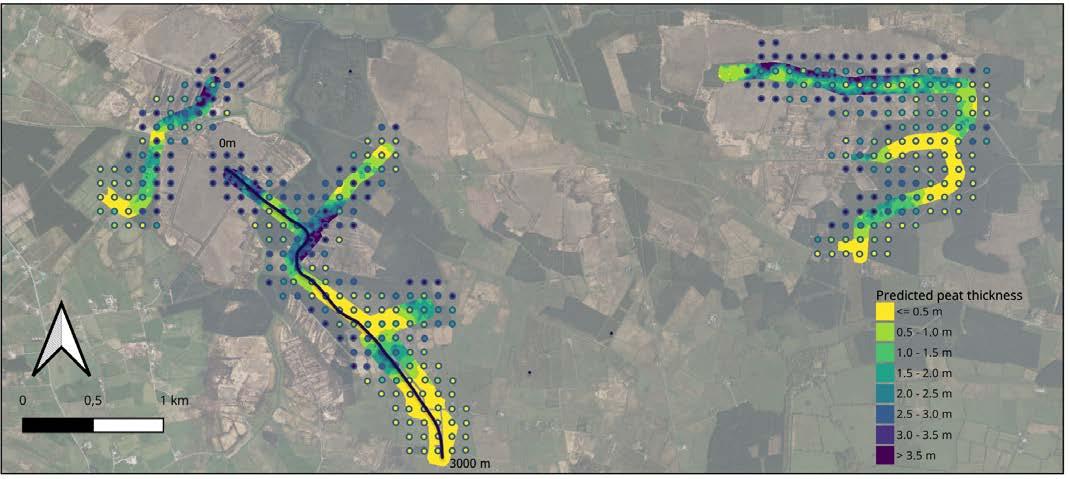
Figure 3: A map of the peat thickness measured with the gamma-ray sensor. The points refer to the calibration samples taken earlier. The black line is the location of the transect of Figure 4.
footprint-averaged response of the gammaray measurements, as well as small-scale variability in peat properties. Nevertheless, the results demonstrate that gamma-ray measurements provide a spatially detailed method for mapping peat thickness.
Thanks to a large number of corings already being available at the site, there was a strong basis for calibration and validation in this pilot study. The close agreement between peat thickness derived from gamma-ray measurements and the coring data confirms that radiometric attenuation can be used to reliably estimate peat thickness at site scale.
This project shows that the drone-based setup allows surveys to be carried out efficiently in terrain that is otherwise difficult to access, making it suitable for a wide range of site investigations. Knowledge of the thickness of peat in soil layers is not only important for peatland conservation and climate adaptation studies, but is also relevant when planning construction works. This study demonstrates the potential of drone-borne gamma-ray spectrometry as a practical method for mapping peat thickness for such applications.
When applied in the screening phase of a project, this method reduces the need for intensive coring campaigns while providing spatial information and supporting informed planning decisions. Moreover, the spatial variation in peat thickness identified with the gamma-ray spectrometer enables coring locations to be planned much more efficiently and targeted to key zones of interest.
Further reading
Koganti, T., Vigah Adetsu, D., Triantafilis, J., Greve, M.H., Beucher, A.M., 2023. Mapping peat depth using a portable gamma-ray sensor and terrain attributes. Geoderma 439, 116672. https://doi.org/https://doi. org/10.1016/j.geoderma.2023.116672 Beamish, D., 2013. Gamma ray attenuation in the soils of Northern Ireland, with special reference to peat. Journal of Environmental Radioactivity 115, 13-27. https://doi.org/10.1016/j. jenvrad.2012.05.031




Ronald Koomans studied geology at Utrecht University, the Netherlands, and completed his PhD at the nuclear physics laboratory of the University of Groningen, where he focused on the application of gamma-ray sensor technology in geoscience. Together with Han Limburg, Koomans founded Medusa Explorations BV in 2000. Koomans works at the interface of nuclear physics and geoscience, developing innovative methods that bridge scientific knowledge and practical field applications.
Koos de Vries is a geologist with a strong background in applied geophysics, specializing in the interpretation of subsurface structure and near-surface geological processes. He holds a degree in geology from Utrecht University, the Netherlands, and has more than 25 years of experience in geophysical surveys and geological interpretation. At Medusa Geoservices BV, he works as a project manager and consultant, applying geological models to translate complex geophysical datasets into practical geoinformation.
Silke Ceulemans has a background in environmental sciences and a strong interest in soil systems and processes, with a particular focus on peatlands and their role in climate adaptation. With more than 10 years of experience at Dutch firm Medusa Geoservices BV, she has developed a special interest in peat mapping, recognizing the potential of geophysical methods to provide detailed insight into peat structure and degradation processes.
John Whiteford is a geophysicist and the managing director of Whiteford Geoservices Ltd, where he has led multidisciplinary ground investigation and engineering geoscience operations across the UK and Ireland since 1996. He holds a BSc (Hons) in Geophysics and began his career with roles at the British Geological Survey and in consulting engineering before founding Whiteford Geoservices. Whiteford is committed to advancing geoscience practice by integrating technical expertise with dependable field methods.
By Lars Langhorst, GIM International
With Earth observation expected to contribute over US$700 billion to global GDP by 2030, its role in supporting informed, sustainable decision-making is becoming increasingly critical. This article explores the most relevant recent innovations that are transforming raw satellite data into high-precision tools for mapping and monitoring. In particular, the focus is on their practical application in surveying and GIS workflows, including integration into platforms such as ArcGIS and QGIS for near-real-time analysis.
The Earth’s surface is changing at an unprecedented pace, driven by climate dynamics, rapid urbanization and growing pressure on natural resources. To monitor these changes, Earth observation (EO) is conducted both in situ and from airborne and satellite platforms by surveyors and scientists alike. Earth observation has undergone a profound transformation in recent years, driven by rapid technological innovation that is directly reshaping land surveying and geographic information systems (GIS) workflows. For professionals in these domains, EO data has become an essential resource for high-precision mapping, land-use analysis, urban planning, environmental monitoring and disaster response.
Between 2023 and early 2026, advances in satellite constellations, sensor technologies and data processing have significantly improved spatial resolution, temporal frequency and analytical capabilities. These developments enable surveyors to monitor dynamic changes in terrain, vegetation and infrastructure with unrivalled accuracy. At the same time, they help address pressing challenges such as rapid urban expansion, climate-induced land deformation and resource management.
Satellite launches and expanding constellations
Satellite launches have accelerated significantly in recent years, leading to the rapid expansion of constellations that
deliver frequent, high-resolution data. This in part is essential for land surveying tasks such as boundary delineation, topographic modelling and change detection. This shift has broadened access to EO data, reducing costs while improving revisit times for GIS applications.
One key example of these expanding constellations is the Copernicus Sentinel programme of the European Space Agency (ESA). Sentinel-2C, launched in September 2024, has enhanced multispectral imaging for land and coastal monitoring, offering 10-60m resolution across 13 spectral bands. For surveyors, this enables more accurate vegetation indices, such as the Normalized Difference Vegetation Index
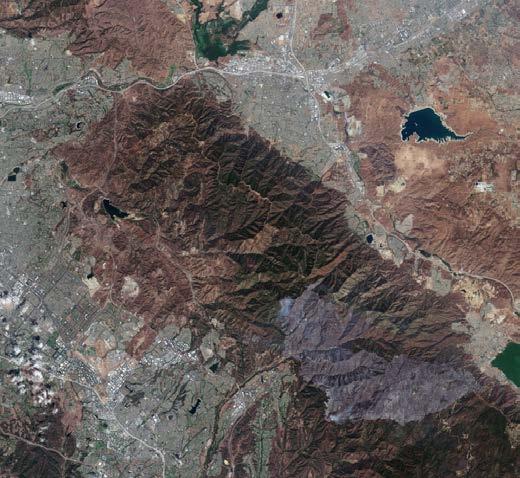
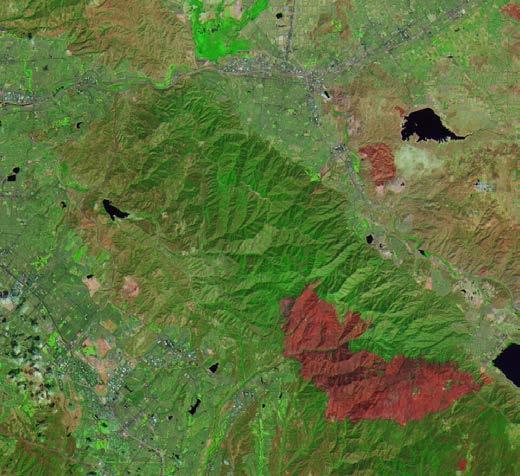
(NDVI), supporting applications in precision agriculture and forestry. In combination with Sentinel-1C (launched in December 2024), which provides all-weather synthetic aperture radar (SAR) imagery, the constellation supports reliable monitoring of land deformation, soil moisture and urban expansion. Sentinel-1D, which has been operational since early 2026 following its 2025 launch, further strengthens this capability by enabling sub-centimetre accuracy through interferometric synthetic aperture radar (InSAR). This is particularly valuable for subsidence monitoring in infrastructure projects, especially in vulnerable coastal regions.
NASA has also contributed significantly to recent EO advancements. The TROPICS constellation, fully operational since 2023, delivers rapid-refresh microwave data for storm tracking, indirectly supporting GIS-based post-disaster assessments. Meanwhile, the joint NASA-ISRO NISAR mission released its first operational radar imagery in late 2025, offering dual-band SAR (L- and S-band) for highly detailed analysis of land deformation phenomena such as earthquake fault movement and glacial retreat. With centimetre-level precision over large areas, NISAR represents a major step forward for surveyors integrating EO data into digital twin environments for urban planning.
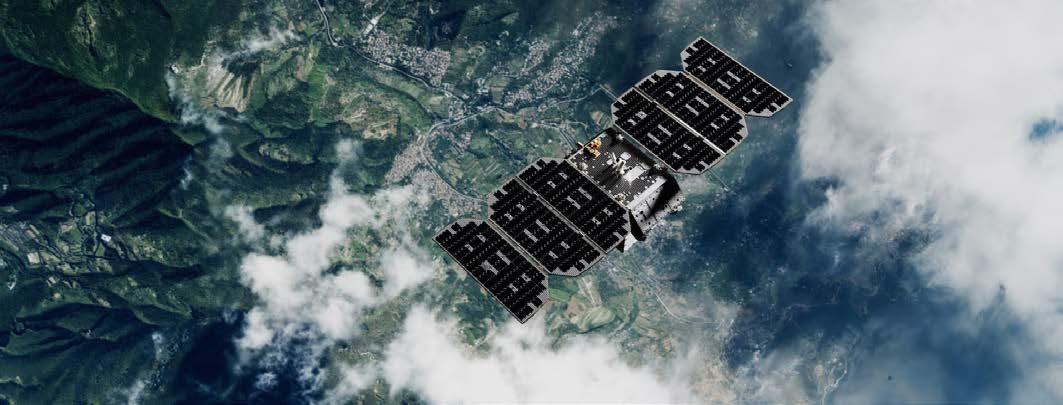
Despite these activities, commercial actors like SpaceX, Blue Origin and Planet Labs now dominate the sector, accounting for approximately 90% of launches in 2023 compared to just 15% in 2014. For instance, Planet Labs has expanded its fleet to more than 200 satellites as of 2026, including the OWL constellation introduced in 2025 for enhanced high-resolution imaging. With daily global coverage at approximately 3m resolution, Planet’s data is particularly suited to monitoring land-use change, including deforestation and urban expansion, and integrates efficiently into GIS platforms for timeseries analysis.
In February 2026, Vantor (formerly Maxar Intelligence) completed its WorldView Legion constellation, comprising six satellites capable
of delivering imagery at 30cm resolution. This level of detail allows surveyors to perform highly accurate orthorectified mapping with minimal reliance on ground control points, reducing fieldwork requirements by up to 50% in remote or inaccessible areas.
Capella Space has advanced SAR capabilities with its Acadia series, launched from 2023 onwards, providing all-weather, sub-metreresolution imagery with rapid tasking options. As of 2026, Capella’s constellation supports automated anomaly detection in infrastructure, such as pipeline leaks or illegal mining activities, with outputs that can be directly integrated into GIS layers for near-real-time monitoring.
Similarly, ICEYE’s Gen4 SAR satellites, introduced in 2025, offer expanded coverage and improved image clarity, supporting applications such as flood mapping and agricultural yield forecasting. These commercial constellations are expected to significantly increase the number of EO satellites in orbit by 2030, further enhancing multisensor data fusion within GIS environments.
China has also intensified its EO efforts, launching nine satellites since 2022 and outlining plans for approximately 40 additional missions by 2030. This expansion diversifies orbital coverage and sensor payloads, contributing to higher-resolution datasets and potentially greater data accessibility for global GIS users.
Overall, the rapid growth in satellite constellations has reduced revisit times from days to mere hours, fundamentally transforming the efficiency and responsiveness of modern surveying workflows.
Recent innovations in sensor technologies have significantly expanded the capabilities of EO for land surveyors, with particular progress in hyperspectral imaging, synthetic aperture radar (SAR) and Lidar systems. These advancements enable the capture of increasingly detailed and accurate information on land surface characteristics,
supporting more precise analysis and decision-making in surveying and GIS applications.
Hyperspectral imaging has emerged as a powerful tool for detailed material identification. Missions such as ESA’s CHIME, currently in preparation following developments between 2023 and 2025, provide access to hundreds of spectral bands, enabling precise analysis of soil composition, vegetation health and crop conditions. When integrated into GIS workflows, this data supports advanced classification algorithms, improving the accuracy of land parcel mapping and environmental impact assessments. In parallel, commercial providers such as Satellogic are expanding hyperspectral capabilities, particularly in applications such as mineral exploration and resource mapping.
SAR technology has seen major advancements, led by commercial providers such as Capella Space and ICEYE. High-resolution and polarimetric SAR modes now enable imaging through cloud cover and vegetation, facilitating the generation of reliable bare-earth models under conditions where optical sensors are limited. For GIS specialists, this translates into more consistent digital elevation models (DEMs), particularly in densely forested or persistently cloudy regions.
The dual-band SAR capabilities of the NISAR mission, operational since 2025, further enhance this potential by enabling highly accurate measurements of surface deformation and biomass, with precision approaching one centimetre. This supports applications such as landslide risk assessment and long-term environmental monitoring.
Spaceborne meets airborne
Spaceborne Lidar remains an emerging technology but is increasingly complementing airborne systems. NASA’s MAIA mission, launched in 2023, uses multi-angle imaging to map atmospheric aerosols, indirectly supporting urban land surveys by improving atmospheric correction in EO datasets. At the same time, advances in nanosatellite technology, such as ESA’s Φsat-2 mission launched in 2024, demonstrate the growing role of onboard artificial intelligence in processing EO data directly in orbit. These systems offer more cost-effective solutions for localized surveying, with improved orbital control enhancing spatial coverage.
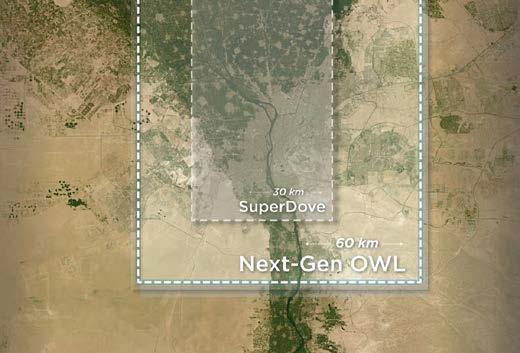
The next-generation OWL constellation is designed to deliver near-daily 1m-class imagery of the Earth’s entire landmass to support critical global security and environmental sustainability. (Image courtesy: Planet)
About the author

Lars Langhorst (MSc) is a pioneer at the frontier where AI meets surveying and asset management. With a background in geomatics and AI, Langhorst believes the next big innovations are just around the corner. He aims to bring these innovations to organizations, bridging the gap between today’s and tomorrow’s technology.
The integration of EO data with uncrewed aerial vehicles (UAVs or ‘drones’) and mobile mapping systems has become a defining trend today. By combining satellite observations with high-resolution ground-based measurements, surveyors can develop hybrid GIS models that offer both broad coverage and fine detail. For example, Lidar-equipped drones can now achieve accuracies of up to five centimetres. These can be fused with Sentinel data to produce comprehensive 3D terrain models for infrastructure planning and monitoring.
Collectively, these sensor advancements are significantly reducing uncertainties in land surveying. Whereas traditional methods could involve errors of 10-20%, modern EO-integrated approaches are bringing this down to below 5%. As a result, workflows are becoming more efficient and reliable, particularly when implemented within advanced GIS environments such as ArcGIS Pro.
Artificial intelligence (AI) has become an integral component of EO workflows, transforming vast volumes of raw data into actionable insights for GIS applications. Since 2023, platforms such as Esri’s ArcGIS have incorporated AI-driven tools and assistants for advanced imagery analysis, enabling direct access to datasets from sources including Google Earth Engine and other commercial providers. This has significantly streamlined processes such as feature extraction, allowing automated identification of elements like building footprints, road networks and land-use patterns, thereby reducing the need for manual digitization.
The emergence of foundation models (FMs) in EO marks a further step towards scalable and generalizable geospatial analysis. Research developments in 2025 highlight how such models can generate consistent, scale-invariant representations of the Earth’s surface. Tools such as SkySense, which embed geolocation directly into model architectures, improve classification accuracy across diverse environments. For land surveyors, this enables more efficient AIdriven change detection using time-series data from missions such as Sentinel-2, facilitating the identification of unauthorized developments or gradual land-use changes.
Commercial initiatives are also accelerating the adoption of AI in EO. Programmes such as Capella Space’s Analytics Partner Program, launched in 2023, support the development of AI-based solutions for SAR data, including automated anomaly detection in infrastructure
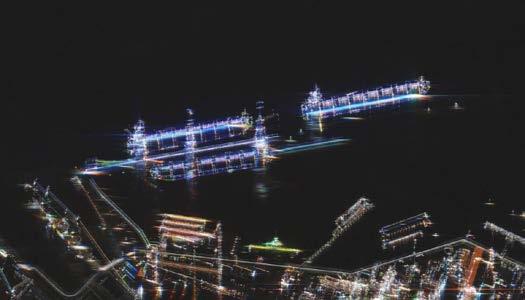
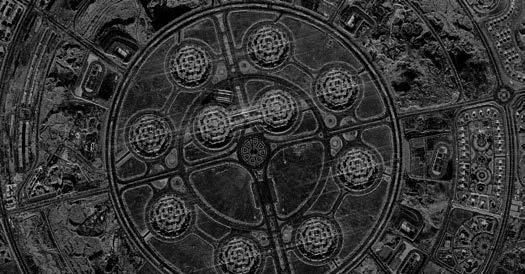
and land-use patterns. Similarly, Planet has integrated AI-driven analytics into its platform, providing near-daily change detection alerts as of 2026. These capabilities can be directly incorporated into GIS environments, supporting applications such as agricultural monitoring, urban development tracking and resource management.
Advances in big-data processing have further enabled the integration of EO and AI through cloud-native GIS platforms capable of handling petabyte-scale datasets generated by large satellite constellations. Initiatives such as NASA’s Acres programme, introduced in 2023, demonstrate the application of EO and AI in agriculture, delivering insights into crop health and productivity that are directly relevant to land surveying and land management practices.
Overall, the integration of AI into EO workflows is generating substantial efficiency gains. In complex surveying projects, automated analysis can reduce processing times by up to 70%, allowing professionals to focus more on interpretation and decision-making and less on data preparation.
Further reading www.esa.int/Applications/Observing_the_Earth/Copernicus/ Sentinel-2/Sentinel-2C_delivers_stunning_first_images www.planet.com/constellations/owl www.iceye.com/sar-data/imaging-modes/dwell www.capellaspace.com
A new generation of EO missions is set to further enhance the capabilities available to land surveyors and GIS specialists. ESA’s BIOMASS mission, launched in 2025, is designed to provide detailed global measurements of forest biomass using P-band radar, supporting applications such as carbon stock assessment and climate modelling. Similarly, the FLEX mission, expected in 2026, will measure vegetation fluorescence, offering new insights into plant health and ecosystem dynamics, thereby strengthening land management and environmental monitoring practices.
NASA’s upcoming Landsat Next mission, planned for the 20262030 period, will significantly expand the Landsat programme’s capabilities through higher spatial resolution and an increased number of spectral bands. This will enable more detailed and frequent monitoring of land surface changes. In addition, missions such as STRIVE, selected under the agency’s Earth System Explorers programme in 2024, aim to improve understanding of stratospheric composition after 2026. This will contribute to more accurate climate models that indirectly inform land-use planning and surveying. Meanwhile, ongoing missions like SAGE III continue to provide valuable atmospheric data, supporting improved correction of EO imagery within GIS workflows.
Several key trends are shaping the future of EO. The growing recognition of EO as a strategic geopolitical asset is driving increased investment and international competition, alongside greater openness in data sharing, particularly from emerging space programmes. At the same time, consolidation within the commercial sector is reshaping the competitive landscape.
Technologically, the continued rise of small satellites, combined with advances in AI and multi-sensor integration, is expected to drive significant market growth, with the EO sector projected to reach approximately US$9 billion by 2030. Hybrid approaches that combine optical and SAR data are becoming increasingly important, enabling more resilient and reliable surveying capabilities under a wide range of environmental conditions.
Taken together, these developments firmly establish Earth observation as an indispensable tool for land surveyors and GIS specialists. Advances in satellite constellations, sensor technologies and AI-driven analytics are delivering unprecedented levels of accuracy, efficiency and insight.
For professionals in the geospatial domain, embracing these innovations will be essential to remain competitive and effective in an increasingly data-driven environment. As the pace of environmental and societal change accelerates, EO will play a central role in enabling more informed, sustainable and resilient land management worldwide.
The new masterplan for spatial data production and usage in the public and private sectors
By Hanno Kuus and Sulev Õitspuu, Estonia
Digitally agile Estonia is well known for implementing many technological solutions that other countries are still struggling with, e.g. a secure and unified data exchange system in the public sector. This article focuses on Geo3D, the new masterplan for spatial data production and usage for the Estonian public sector, led by the Estonian Land and Spatial Development Board. After implementing the action points, it will result not only in more cost-effective data production for the mapping agency but also better open data, tools and services for innovative products – such as digital twins and map-based AI systems – in the public and private sectors.
In the early 2020s, several technological advancements (e.g. the rise of GeoAI, and better photogrammetry and Lidar sensors) and ever-decreasing funding from public budgets made it necessary for national mapping agencies in many countries to develop new, futureproof products and ways to continue the production of existing maps and geospatial data. In those pivotal years, the Estonian Land Board (the predecessor of the Estonian Land and Spatial Development Board, ELSDB) spent a considerable share of its internal resources on brainstorming the key areas for its future strategy. The strategy was eventually launched, named Geo3D to underline the importance of 3D data for data-driven decisions in the future.
When creating the Geo3D strategy, the following focus areas were identified:
• Modernization of the existing data acquisition platform
• Creating a 3D competence centre that would coordinate the production of 3D data and digital twins in Estonia
• Research and development of GeoAI in various contexts, especially for semiautomated mapping
• Developing a new generation map portal for a unified presentation and integration of 2D and 3D data
Based on these starting points, a comprehensive analysis was carried out in 2023 with the help of Ernst & Young Baltic and Alphagis. More than 20 existing and prospective users were interviewed, their needs analysed, and strategic goals formulated and validated with Estonian and international experts.
New devices for better data
Activities for moving on with implementation of Geo3D started right after finishing the
analysis. Getting the strategy formulated on paper was a necessary first step, but not necessarily the biggest hurdle. Problems with acquiring the required financing and reorganization of the agency caused slight delays in the intended schedule. However, the strategy is now being implemented step by step and is inching towards the desired results.
One of the biggest gaps that the strategy document outlined was the need for better
data. As the agency responsible for mapping the whole (albeit small) country, the ELSDB had a long history of using airborne sensors to acquire geospatial data. In 2024, new sensors were installed for the aircraft. According to the principles laid out in the Geo3D strategy, a new IGI UrbanMapper 2 EVO aerial camera now provides both nadir and oblique images, and a new RIEGL VQ-1460 Lidar scanner accompanies the images with a dense point cloud. The aircraft used by the ELSDB has two apertures, so the camera and Lidar collect data at the same time, making it easy to use both datasets for training AI models.
The first flights with the new devices were completed in spring 2025, when the short window after the snow had melted and before the first leaves appeared on deciduous trees offered the best conditions for aerial mapping flights. The data is still being processed, but the initial datasets look very promising.
GeoAI: the colleague of tomorrow
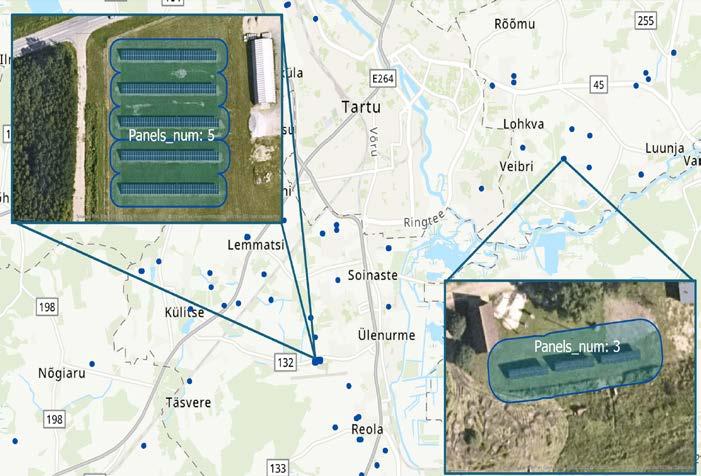
Automated mapping and feature extraction from aerial imagery has been (and still is) the goal for many mapping companies and agencies around the world. Geo3D formulated it as one of the action points of the strategy that would help the ELSDB to produce maps and geodata more efficiently, especially ensuring shorter renewal cycles for clients. A model for detecting new solar farms was successfully built in-house, but wider scale implementation (e.g. detecting changes in buildings) have not yet been successful.
Ironically, the main obstacle is the effectiveness of human detection, especially for features such as buildings and roads that
are abundant in densely populated areas. In areas like Estonia with up-to-date existing map data, the output of the AI algorithm must be of exceptional quality (F-score of at least 0.97-0.98) to be more effective than a human. A lower-grade output just means that the combined approach (machine with human inspection and correction) would result in slower production cycle than using human resources only.
Nevertheless, the ELSDB is continuing research in the field and feels hopeful that the technological advances mean that AI-powered solutions will soon be able to perform the most tedious change detection and digitizing tasks. It is likely that the main responsibilities of cartographers will shift from manual digitization to creating better training data for machine learning algorithms.
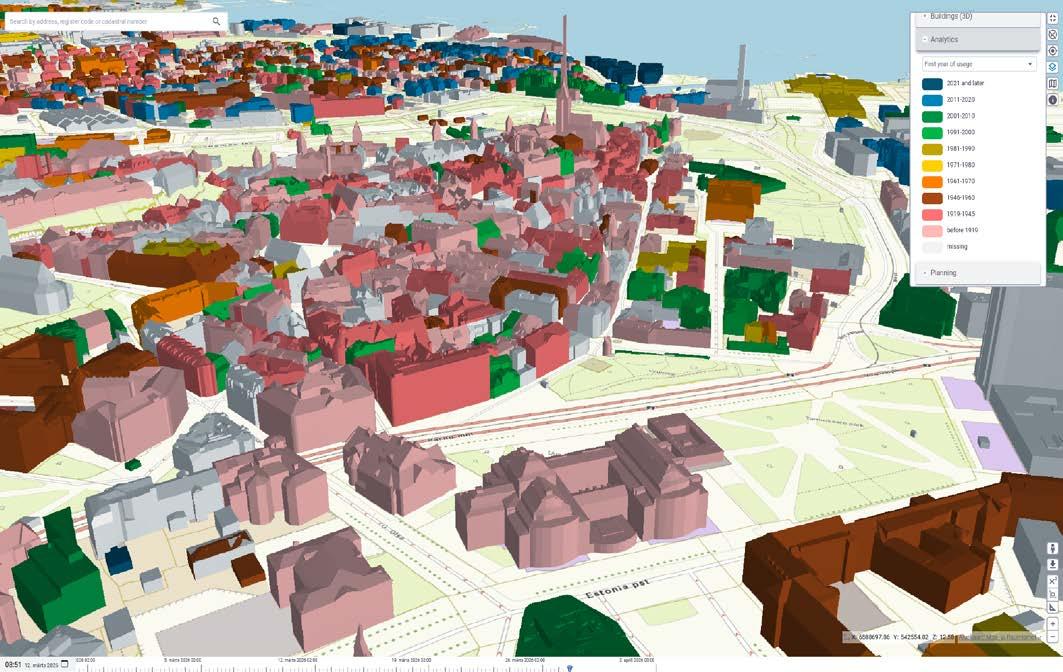
In 2021, the agency tested and successfully completed the automatic 3D modelling of every building in Estonia using Lidar point clouds and topographical data. In addition to accurate geometry, each model also included attributes and links to national registries. The enthusiasm for and competence with 3D geodata at the ELSDB kept growing, leading in the Geo3D analysis to the strategic goal of becoming the national 3D competence centre. Fast-forward to 2026 and the progress is clearly visible. The ELSDB offers 3D models for several man-made features, including bridges, tunnels, greenhouses and various other constructions, like galleries and wind turbines.
In addition, the agency has taken its first experimental steps to model natural phenomena. Locations and basic parameters – like
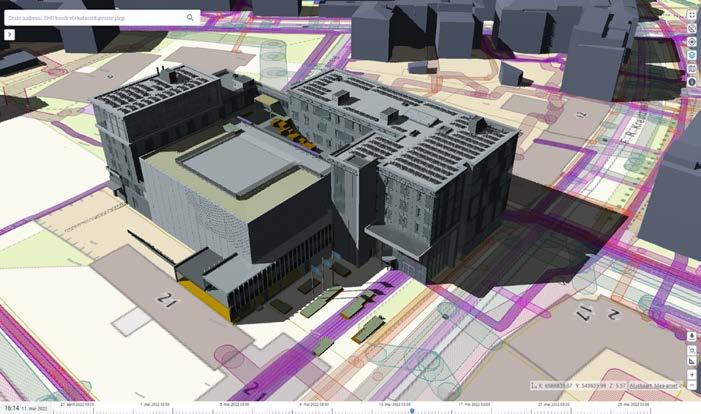
height, diameter of canopy, deciduous or coniferous tree type – are detected from airborne Lidar point clouds and imagery. Generic 3D models are then used to visualize the result.
All the 3D datasets are published as open data. They have proven interesting and useful for both Estonian and international users, which range from researchers to companies to hobbyists. The new Lidar sensor will undoubtedly boost the geometric accuracy of generated models, and the higher-density point clouds will hopefully help in modelling additional features of the 3D reality, such as for more realistic noise propagation analysis.
When the ELSDB was created in 2025, the 3D content creators from ELB and one of the biggest users of the 3D data – the e-construction digital twin – were merged into one team. Their increased collaboration could be felt in the development of the X-GIS 3D platform.
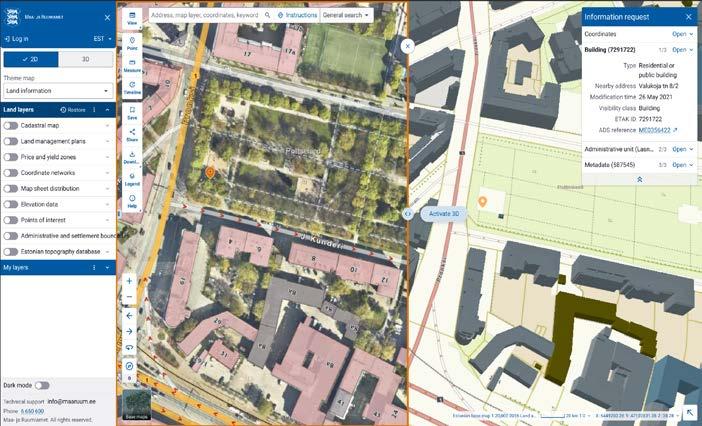
X-GIS 3D is the code name for a new universal map platform with 2D/3D capabilities, which is being built on decades of experience in creating web map systems with open source components at the ELSDB. The user interface will be based on the national design framework called TEDI, to which a map design module is now being added. This module will define the visual appearance and user experience of the
map window (e.g. location of address search bar or icons and the behaviour of action buttons).
The web map design that X-GIS 3D implements will let users display either 2D or 3D data, or optionally enjoy both views in parallel. Basic data editing and filtering will be included as well, with the possibility of adding more complex behaviour later. Besides the smart user interface, X-GIS 3D will also include a modern cloud-based backstage, serving geospatial data to frontend web users and also to other systems needing map data.
The launch of X-GIS 3D and its first use cases at the ELSDB is planned for 2027.
The Estonian Land and Spatial Development Board (ELSDB), the country’s national mapping and cadastral agency, was founded on 1 January 2025 by merging the former Estonian Land Board with several other governmental organizations and adding new responsibilities. Today, the ELSDB is the competence centre for all land-related activities in Estonia: strategic spatial planning (development of uniform policy and information systems for planning), spatial data (from geodetical networks to national registries), land use and management (including land cadastre) and land improvement (coordinating and ensuring the functioning of land improvement systems). It is a government agency which is funded from state budget, providing data and services to other publicsector organizations as well as to businesses and citizens. The ELSDB’s responsibilities span the administrative sector of four ministries: Economic Affairs and Communications, Climate, Regional Affairs and Agriculture, and Culture.
The source code will be released under a permissive licence afterwards. The longerterm goal is to apply the TEDI design for all public-sector information systems that need a map window. This will create an opportunity to reduce development and
Further reading
Estonian Land and Spatial Development Board: https://maaruum.ee/en
Geo3D business analysis: https://geoportaal.maaruum.ee/eng/ spatial-data/geo3d/geo3d-business-analysis-p928.html
3D digital twin of the e-construction platform: https://livekluster. ehr.ee/ui/ehr/v1/3d
TEDI design framework (in Estonian): https://tedi.ee/
licensing costs and also provide a unified user experience across numerous systems.
Recognizing the need to stay up to date with the changing technological and organizational demands, in 2026 the ELSDB will create a new institutional strategy document that will include and amend other strategies, like Geo3D. The new strategy will define a single computing platform that brings all of the ELSDB’s currently separate solutions (land cadastre and other registries) together into one coherent and cloud-based system, orchestrating numerous services with the help of X-GIS 3D. As for data production, even more focus will be put on (semi)automatic mapping to provide up-to-date maps. These major steps, along with many more minor ones, will improve public services within and outside of the ELSDB.


Hanno Kuus is a systems engineer working with GIS. Since 2003, he has been with the Estonian Land Board (now Land and Spatial Development Board) where he is involved in the development of the Estonian topographic database and other key components of the national spatial data infrastructure.
Sulev Õitspuu is X-GIS 3D product owner and head of the Geoinformatics Department at the Estonian Land and Spatial Development Board. He has over 25 years of experience leading the development of web-based map applications.
By Wim van Wegen, GIM International
As part of Britain’s new high-speed railway project (HS2), six tunnel-boring machines have been driving through clay, sand and ever-shifting ground beneath the streets of London. They are carving out the tunnels that will one day enable trains to reach the heart of the British capital faster. GIM International spoke to Matthew Baddeley, survey manager for the Skanska Costain STRABAG Joint Venture (SCS JV), about the challenges of guiding them there: in both line and level, and within millimetres of their intended breakthrough points. The precision engineering involved in this intriguing project includes gyroscopic control over distances of up to 8km without intermediate checks, laser scanning workflows feeding directly into design decisions, and a 21km surface traverse that reconciled two independent underground control systems: Northolt Tunnel and Euston Tunnel.
The geometry of the ‘London Tunnels’ section of the HS2 project dictates every surveying challenge. In early 2026, two tunnel-boring machines (TBMs) were launched from Old Oak Common, mining towards Euston Station for a 7.5km drive. Prior to that, in January 2024, two other TBMs had been launched from the Victoria Road Crossover Box, for a 5.5km drive to Greenpark Way Vent Shaft. This drive, called Northolt Tunnel East, was successfully completed in summer 2025. Another pair of TBMs had set out on a demanding 8km drive in October 2022 from West Ruislip back to Greenpark Way. These were for the Northolt Tunnel West drives that were completed in April 2025. At the Greenpark Way Vent Shaft, all four machines converged into two large vent shafts and had to break through into what Baddeley describes as a “steel can”: a prebuilt reception structure with tight positional tolerances. “From a tolerance perspective, it was challenging for all the TBMs to meet into the shafts because of the steel can scenario and the high accuracy requirements,” he says.
Beyond the main TBM drives, the project has also encompassed extensive sprayed concrete lining (SCL) works for cross-
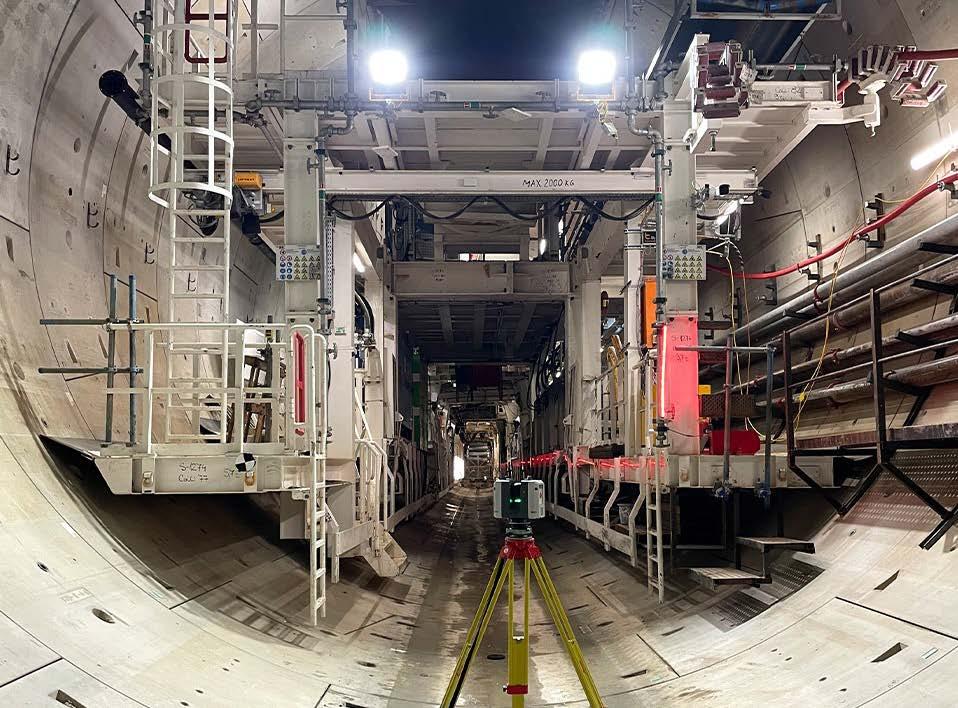
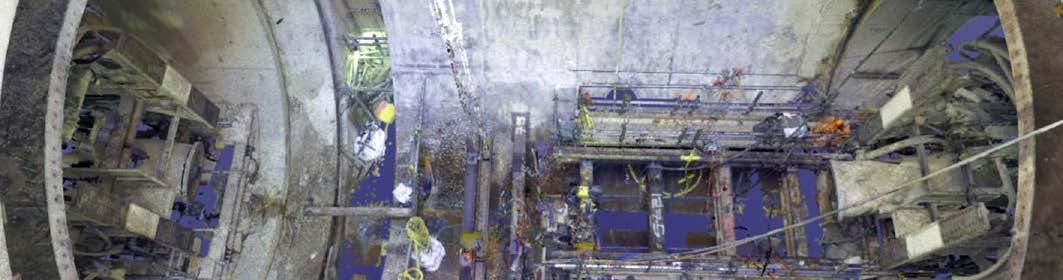
Inside an HS2 tunnel, surveyed using the Leica RTC360 3D scanner – capable of recording two million points per second and High Dynamic Range (HDR) photography.
passages and ventilation shafts, as well as two SCL tunnels connecting into Old Oak Common station from the Victoria Road Crossover Box, over a total of 350400m. These all added their own surveying demands.
Due to London’s non-uniform subsurface, the ground conditions shape the survey efforts in ways that were difficult to predict at the outset. On the Northolt Tunnel East drives, conditions were relatively
favourable, according to Baddeley; London Clay geology allowed the cross-passages to be excavated without ground treatment, keeping the survey workload manageable. However, for Northolt Tunnel West, the sandy soil required the ground around each cross-passage to be frozen before excavation could begin.
Cross-passage works, invert concrete pours and ground-freezing operations all compete for access and generated disturbance, making it extra difficult to maintain the control network while production activity continues behind the TBMs.
Shaft behaviour adds a further layer of complexity. Dewatering operations at Greenpark Way Vent Shaft caused the structure to sink and heave with the seasons, obliging the team to continually recalibrate the reference points at the shaft head. At the Westgate Vent Shaft, the passage of the TBMs caused approximately 30-35mm of settlement in a structure that had been largely built out, with steelwork and primary structural elements already in place. This created additional challenges for both the survey and design teams in terms of decisions on fitting the cladding and all the mechanical and electrical (M&E) works “in a shaft that has effectively just moved”, as Baddeley describes it.
The Northolt Tunnel West drive, running 8km from West Ruislip to the Greenpark Way Vent Shaft without an intermediate shaft to perform a check, presented the project’s biggest survey challenge. The survey team had to maintain confidence in their control network – and in their accumulated chainage and horizontal swing – through the full length of the drive. “We didn’t know for sure whether we were in the correct position or level until we broke through into that Greenpark Way shaft,” recalls Baddeley candidly.
In order to validate the control network across the longest distances, and to verify the positional relationship between Old Oak Common and Euston, the team carried out a rooftop traverse ahead of the recently launched Euston TBM drives. It is standard practice in major tunnel projects to prove the relativity on the surface before the underground connection is established. This confirmed that the Euston Tunnel

independently controlled underground environment will meet within tolerance when the drive finishes its excavation works in summer 2027.
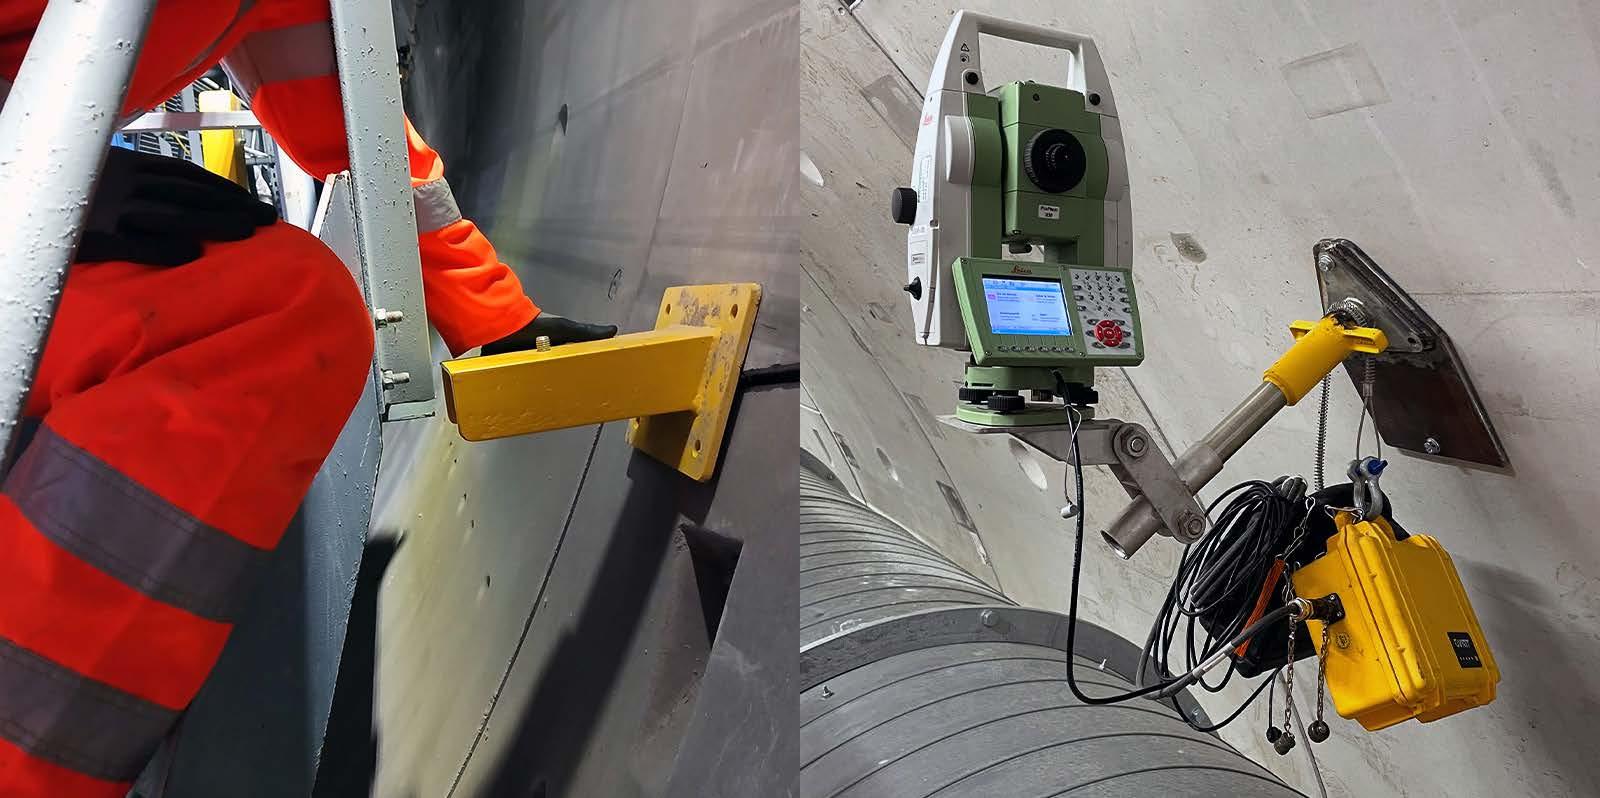
The traverse was performed using Leica TS60 half-second total stations with Leica GPH3 triple-array prism holders used in conjunction with GPR1 prisms. Leica GPH1P single prisms were also used as these are precisely machined for high-accuracy activities such as a rooftop traverse. Automatic target recognition (ATR) was possible to approximately 1.5km, after which the team switched to manual sighting. The combination proved workable and delivered favourable results, but lessons were also learned from the campaign. “The ATR on the Leicas is so much superior to manual sighting. It could be better to shorten the ranges to maintain the use of the ATR, because when you’re manually sighting over those distances, you’ve got problems with shimmer and low-level light due to observing in the autumn,” states Baddeley in hindsight. For any future tunnelling works where surface
Matthew Baddeley is a chartered civil engineering surveyor who has worked in industry for 20 years, 13 of which have been at Skanska. He joined the HS2 Main Works Civil Engineering Contract in 2020. Operating as a survey manager for SCS JV, he leads the route-wide survey control and as-built delivery.
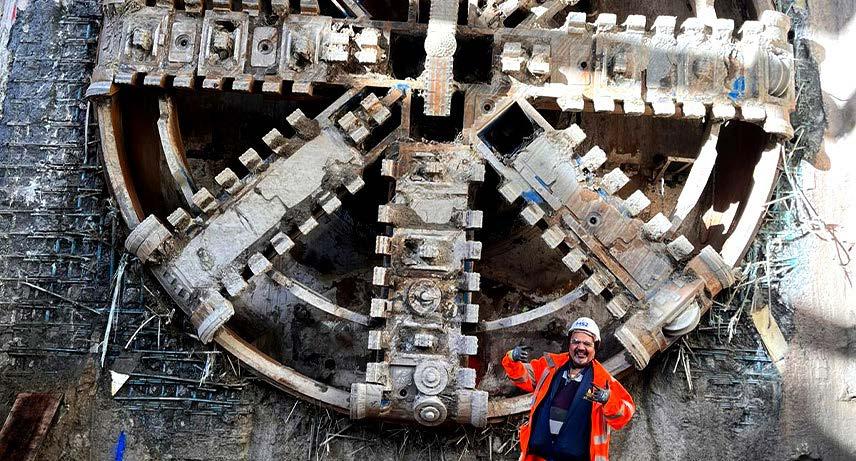
Breakthrough at the Atlas Road site: the HS2 tunnel boring machine emerges, its vast cutting head bearing the marks of thousands of metres of hard-won progress.
connection checks are required prior to launch, he intends to refine this approach.
control and keeping the TBMs on course
Underpinning the alignment control for the Northolt drives, and allocated for the Euston tunnels, is a Gyromat 5000 gyroscope paired with a Leica TS60. Gyroscopic orientation provides an independent bearing reference that does not depend on surface observations or the continuity of the underground traverse, making it a critical safeguard when drives are long and connection opportunities are limited.
The guidance of each TBM depends on a chain of precision that runs from the surface control network through the underground traverse to the machine itself, and every link in that chain requires active management. Tunnel brackets – the mounting points for total stations working behind the TBM – are subject to movement due to settlement of the tunnel lining, temperature changes and vibrations caused by production activity. Refraction of the line of sight is a persistent concern at depth, particularly where temperature gradients exist between the ventilated tunnel air and the surrounding ground. Both these effects can introduce systematic errors that accumulate over the course of a drive. Therefore, both require regular monitoring and correction cycles to keep the guidance system within its required tolerances.
The Leica TS60 has been the instrument of choice throughout all TBM guidance and underground control work. Its halfsecond angular accuracy and robust ATR
performance in tunnel conditions give the team confidence that the instrumentation is not the limiting factor. “The TS60 is rock solid and our surveyors all trust this instrument to deliver repeatable results,” Baddeley says. “We’ve been using it for all control work throughout this project.”
Traverse adjustment
The same discipline extends to the GNSS control network that was processed for Euston tunnels: six Leica GS18 receivers operating simultaneously across the Old Oak to Euston corridor, with the adjustment handled in Leica Infinity. Star*Net, the traverse adjustment package now within the Hexagon group, has been used throughout the project. It was pushed towards its limits on the 8km Northolt Tunnel West twin bore – a configuration that might have required the network to be split on some comparable projects, according to the survey manager.
The convergence monitoring and SCL monitoring programme is handled through Amberg, and the Amberg tunnel scan module is increasingly used to ingest laser scanning data and to generate cross-sectional profiles efficiently. Because this particular project exceeds the practical limits of such off-theshelf software due to its scale and precision demands, SCS JV Tunnel Survey Manager Thomas King also developed an in-house coded tool specifically to analyse traverse data and control network results.
If the control network keeps the TBMs on course, laser scanning keeps the rest of the project ‘honest’. Baddeley recalls early
scepticism from project stakeholders. “People were asking, ‘Are you laser scanning too much? Why do we have to laser scan?’. I just had to push back and say: we are laser scanning all permanent works.” That stance has since been repeatedly vindicated, he says.
A well-established workflow was soon in place for SCL structures: scan after primary lining, scan again after secondary lining, compare against the design model with Cyclone 3DR to generate deviation heat maps, mill back anything out of tolerance, and rescan to confirm. For cross-passage underground freezing treatment on Northolt Tunnel West, the survey team conducted scanning to extract as-built information about the ring joint positions to feed them back to the design team for the inclined drilling layout. As a result of the freezing programme, the Northolt Tunnel West operation was significantly more resource-intensive than Northolt Tunnel East and generated an entirely separate data flow for the survey team. “We pulled in Cyclone 3DR for that,” says Baddeley.
For the team following the TBMs through the bored tunnels, the Leica MS60 multi-station was actually the only practical tool for capturing profiles: “That’s the only window we can laser-scan the tunnels to produce our ‘wriggles’ – effectively cross-sectional profiles – and that can be taken onto other projects,” he adds.
Beyond deviation analysis, Cyclone 3DR has been used extensively for mesh generation, area calculations and volume assessments –tasks that extend the value of each scanning session well beyond a simple compliance check. “It’s like the Swiss army knife of point cloud processing; it’s revolutionary,” Baddeley says of Cyclone 3DR. Alongside 3DR, Cyclone REGISTER 360 PLUS has served as a robust platform to accurately merge the laser scans together and georeference onto the HS2 Survey Grid coordinate system.
The data has already proved its worth as a long-term archive. In one instance, drainage elements were scanned before being buried under a poured slab. When the engineering team later needed to connect new drainage into the bored tunnel, the point cloud provided the only available as-built geometry. “It happens almost weekly,” Baddeley says. “Engineers can understand the heat maps;
the BIM team can adjust the design model if it’s out of tolerance, and that then becomes the as-built model.”
At the project data-management level, Hexagon GeoCloud provides the ability to stream point cloud and panoramic imagery to any authorized user across the full site, without the system degrading as data volume grows. This is a valuable new capability, according to the survey manager: “We’ve got thousands of projects in there now, and it’s still a smooth system to operate.” This is not the case, he emphasizes, with some competing platforms that slow significantly as data accumulates.
This has led to a measurable shift in how non-survey disciplines engage with spatial data. Engineers from the design house used the solution to carry out ground-movement assessments on all the bridges along the alignment from Euston to West Ruislip, a task that previously would have required site attendance. It has served as a data review and collaboration platform, giving engineers and project managers access to scanning data without requiring specialist processing skills. Rather than having to go underground, site engineers can extract coordinates without leaving their office. “There’s a health and safety gain as well. It reduces the footfall on the site,” he continues. The combination of Hexagon GeoCloud for streaming and Cyclone 3DR for processing has, in his view, been the most transformative pairing on the project.
The project has required a total of 56 surveyors, ranging from apprentices to chartered professionals, to operate as a coherent team across numerous active fronts simultaneously. The user-friendliness of the tools have certainly contributed to their success. Cyclone 3DR’s intuitive interface and Leica Infinity’s clear learning resources are proving genuinely useful, lowering the barrier for junior staff to engage with data processing tasks that once required dedicated specialists. Baddeley contrasts this with earlier generations of software. “Back in 2007, I went on a five-day training course for Cyclone CORE, which I would say was also necessary. Today, you probably don’t need a fiveday training course for Cyclone 3DR or Cyclone REGISTER 360 PLUS, because the software is so intuitive.”
For the most complex tasks, senior staff are drawing on their broad base of project experience. SCS JV’s Head of Survey William Archibald has previously worked on both Crossrail and the Channel Tunnel. Baddeley and Tunnel Survey Manager Thomas King benchmarked against published accounts of the Gotthard Base Tunnel and conducted
a site visit to the Align JV’s 16km project to directly observe control network configuration and bracket systems.
But he emphasizes that the team structure matters just as much as the tools. “We’re not just trying to have one dedicated person sitting there doing the Star*Net processing. On Northolt Tunnel East, we let the surveyors embrace the tunnel adjustments themselves. They’ve all been having a go at the data processing and developing as tunnel surveyors, not just gathering data on site.” The goal here has been a team where basically every surveyor can complete a full data cycle: gather, process, adjust, report. “I think that level of knowledge sharing has been a big positive in this project,” he states.
The recently launched Euston tunnel drives will benefit directly from lessons accumulated across Northolt tunnels. The GNSS network has been re-observed with Leica GS18 receivers. The Gyromat is ready. The team is revisiting tunnel bracket configurations and gyro observation protocols, drawing on Gotthard documentation alongside the Northolt Tunnel experience. New instrumentation is also on the horizon –technology that arrived after the Northolt Tunnel drives commenced and which Baddeley is keen to evaluate for future applications.
When asked which skills the next generation of tunnel surveyors will need, his answer spans traditional and contemporary expertise. “They still need the grounding at university to learn the bread-and-butter survey elements like geodesy. If you really want to drive TBMs over many kilometres, you’ve got to understand about scale and geodesy if you want your tunnel to close correctly at the other end.” But alongside that foundation, coding is now essential, he says, as illustrated by the SCS JV team’s experience developing in-house traverse analysis tools. Skanska is actively putting staff through programming courses in recognition of this. BIM literacy, GIS integration and awareness of AI tools complete his list of skills needed by a future senior tunnel surveyor.
Baddeley is proudest of the team’s achievements at the Greenpark Way Vent Shaft, where four TBMs arrived from different directions and proved that 8km of surveying, through unpredictable ground and without intermediate position checks, had worked. The breakthrough itself was, he admits, less cinematic than in the movies; the machines came into the enclosed steel reception structure, and the moment of revelation came when the lid was lifted. But the engineering behind it was anything but understated.
By Zuzana Hajkova, EUSI
When the EU’s Nature Restoration Regulation entered into force in 2024, it set legally binding targets to restore degraded ecosystems across Europe. With National Restoration Plans due in September 2026, Member States face an urgent question: how can restoration be mapped, planned and monitored across millions of hectares in a consistent, verifiable way? Earth observation (EO) data provides the answer.
With 80% of European habitats in poor condition, the European Union’s Nature Restoration Regulation (NRR) is aimed at increasing biodiversity, limiting climate change and reducing the impact of natural disasters. It not only introduces clear restoration targets, but also demands verifiable proof of progress. Each EU Member State must prepare a National Restoration Plan, describing where restoration will take place, how much area is involved, and how results will be measured. These plans are expected to include maps, indicators and timelines. The September 2026 deadline is approaching rapidly, and yet many ecosystems remain incompletely mapped and their ecological condition is poorly understood.
The value of EO data from baseline to reporting
The NRR follows a logical four-step process: understand the current situation, plan interventions, implement on the ground, and monitor results. At each stage, consistent and comparable data is essential. For many applications, medium-resolution satellite data from programmes such as Copernicus Sentinel-2 (10-60m resolution) provides a valuable baseline. However, the NRR sometimes requires finer spatial and spectral precision, in which case very-high-resolution (VHR) multispectral imagery can provide the answer.
1. Building the knowledge base
Before restoration can begin, Member States must identify their ecosystems –
how many, where, and in what condition they are. A lot of the data can be gained from satellite imagery. For example, 30cm images with eight spectral bands can reveal vegetation health, soil moisture, water quality or carbon leaks. Archive imagery adds a further dimension. For example, it allows authorities to see how ecosystems have changed over time, which is essential when restoration requires re-establishing habitats that have been lost rather than simply improving those that remain.
2. Designing National Restoration Plans
Once a baseline is established, countries
must decide where to act. National Restoration Plans must identify priority areas, describe measures and set timelines, all while balancing ecological, economic and social considerations. At this stage, spatial information becomes a decision-support tool. EO data allows authorities to compare candidate sites, identify constraints – such as land use conflicts or infrastructure proximity – and plan across regional boundaries.
3. Implementation on the ground Restoration can take many forms, such as reconnecting rivers, restoring wetlands or introducing green infrastructure into
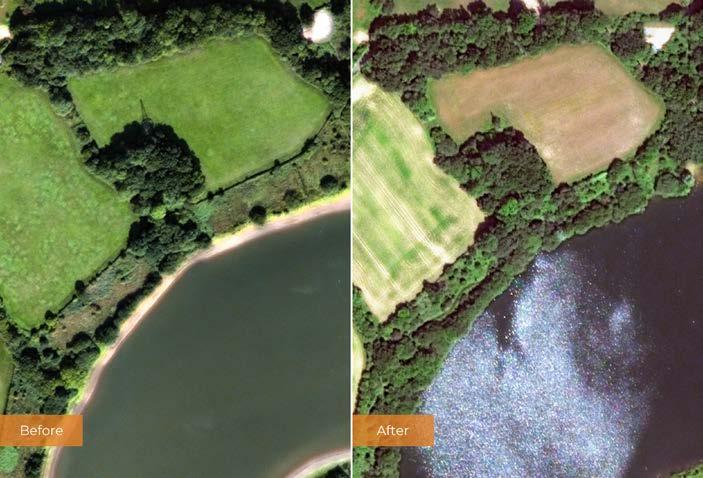
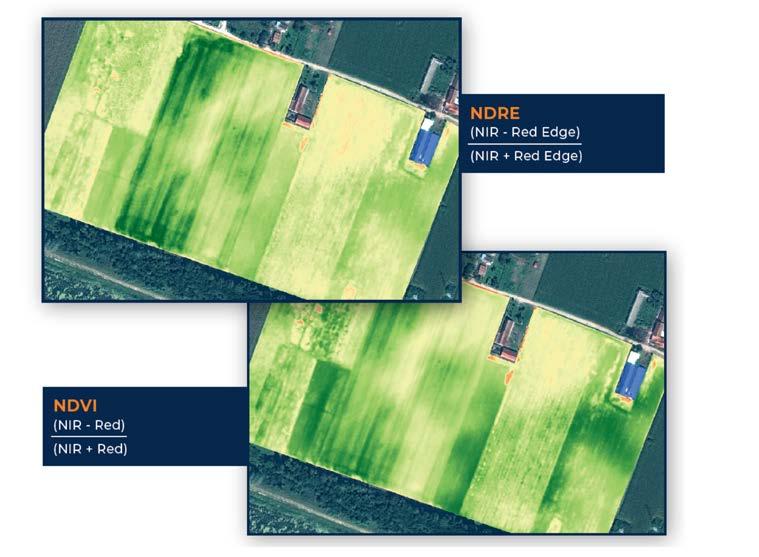
urban areas. These site-specific actions often require detailed information that broad-scale mapping cannot provide. VHR satellite images reveal field-level features that matter, e.g. the precise location of river barriers, the extent of invasive species encroachment, or the condition of individual trees. Thanks to frequent revisits by satellites, rapidly shifting situations – such as wildfires – can be monitored closely as they evolve.
The NRR places strong emphasis on long-term monitoring. From 2028 onwards, Member States must report regularly. This creates a need for data that is not only accurate but also consistent over time.
The actual role of EO in helping national governments to comply with the NRR varies depending on the type of ecosystem in question, since each one presents distinct monitoring challenges. In the case of terrestrial, coastal and freshwater ecosystems, for example, EU Member States must ensure that at least 30% of degraded areas are under effective restoration by 2030 (rising to 90% by 2050). Despite these being vast, diverse and often fragmented landscapes, satellite data makes it possible to monitor vegetation dynamics, water regimes and ecosystem conditions at national scale. However, many habitats covered by the regulation are small and heterogenous. Wetlands, riparian corridors, coastal margins and fragmented grasslands may be too fine-scale to map accurately with 10-30m sensors. VHR imagery at 30-50cm captures such features with sufficient precision for both initial mapping and repeatable change detection, in line with the NRR’s requirements to identify degraded areas, prioritize restoration sites and document re-establishment.
When it comes to forest ecosystems, the NRR’s focus is not only on simply restoring areas, but also improving ecological quality and resilience. Member States are required to demonstrate that forests are becoming more structurally diverse, better connected and storing more organic carbon, with measurable increases in deadwood. Authorities need to analyse not only where forests are, but also how they function and evolve over time. EO provides a scalable way forward. In Bulgaria, for example, remote sensing has been used to monitor bark beetle outbreaks in spruce forests, combining multispectral satellite imagery with indices such as the Normalized Difference Vegetation Index (NDVI) to assess tree vitality and detect infestation patterns across large, mountainous areas. This approach made it possible to identify stressed and damaged forest stands, track the spread of infestations over time, and quantify changes in affected areas. It revealed a significant increase in bark beetle damage within the study site. Across the EU, similar approaches are expected to underpin national reporting on forest ecosystem condition under the NRR.
In agricultural areas, the NRR focuses on soil quality and landscape diversity. Member States must demonstrate improvement in at least two out of three indicators: grassland butterfly index, organic carbon in cropland mineral soils, and the share of agricultural land with high-diversity landscape features. Targets for farmland birds and drained peatlands add further complexity. Satellite data supports multiple aspects of this monitoring challenge, from mapping field boundaries and landscape features, to tracking seasonal vegetation patterns relevant to farmland biodiversity. Red, red-edge and infrared bands of the spectrum can be used for crop species differentiation and plant health analysis, for example.
In terms of urban ecosystems, the NRR stipulates that Member States must stop the net loss of urban green space and tree canopy cover by 2030, and reverse the loss thereafter. For context, a study of 862 European cities found that fewer than 15% of urban residents live in accordance with the 3-30-300 rule – a principle that recommends that three trees are visible from every home, every neighbourhood has 30% canopy cover, and people live within 300m of a high-quality green space. The advantage of EO in this scenario is that, unlike uncrewed aerial vehicle (UAV) sensors or aerial collections, satellite imagery strips are kilometres wide and can cover an entire city within a few passes. Various solutions are available to help authorities extract a detailed analysis of individual trees including information about tree species, health or size. Case studies have shown that satellite-based analysis of urban trees can considerably reduce the cost and time involved in building a tree inventory compared to traditional field surveys.
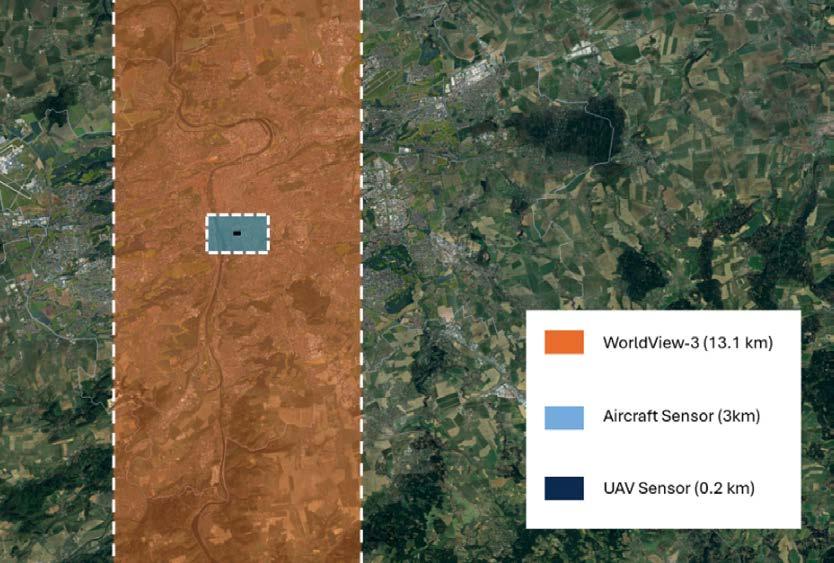
In the context of waterways, the NRR sets the goal of restoring 25,000km of freeflowing rivers throughout the EU by 2030. To achieve this, Member States are required to create a complete inventory of artificial barriers to river connectivity and identify which should be removed. To make this decision, authorities need to know which ones are needed for flood protection and which have other uses. EO can partly provide the answer, since satellite data supports detection and mapping of barriers such as weirs and dams, terrain analysis for flood modelling, and pre- and postintervention monitoring of river morphology and floodplain vegetation. These insights help determine where interventions will have the greatest effect, and time-series analysis documents how river systems respond after the barrier removal.
Last but not least, the NRR targets specific marine habitats such as seagrass meadows, macroalgal forests and sedimentary beds. The effectiveness of satellite imagery for monitoring such ecosystems depends strongly on water depth, clarity and habitat type. In coastal and shallow marine environments, multispectral data is highly valuable. It can map and monitor seagrass extent, macroalgae, sediment plumes and coastal water quality, all of which are directly linked to ecosystem condition
and restoration success. Additionally, yellow bands in the spectrum – such as Yellow/NIR2 – show strong correlation with measured water depths, supporting effective bathymetric modelling and monitoring of shallow water bodies.
Turning observations into information
The value of satellite data lies in how it is processed, interpreted and integrated with
other data sources. The NRR requires indicators that are comparable across Member States and consistent across reporting periods. These requirements place significant demands on the analytical frameworks built around EO data.
In most applications, satellite imagery needs to be combined with field observations, habitat classifications and ancillary spatial data to produce the necessary indicators. The quality and resolution of the underlying imagery determine what is detectable and what is not: whether a small wetland is mappable, whether a hedgerow can be distinguished from a field boundary, or whether a gradual shift in vegetation condition constitutes a measurable change. The precision of these outputs increases significantly when VHR eight-band data is available. Classification accuracy improves, smaller features become mappable and the uncertainty decreases. This increase in data quality translates directly into more defensible reporting against the NRR’s legally binding targets.
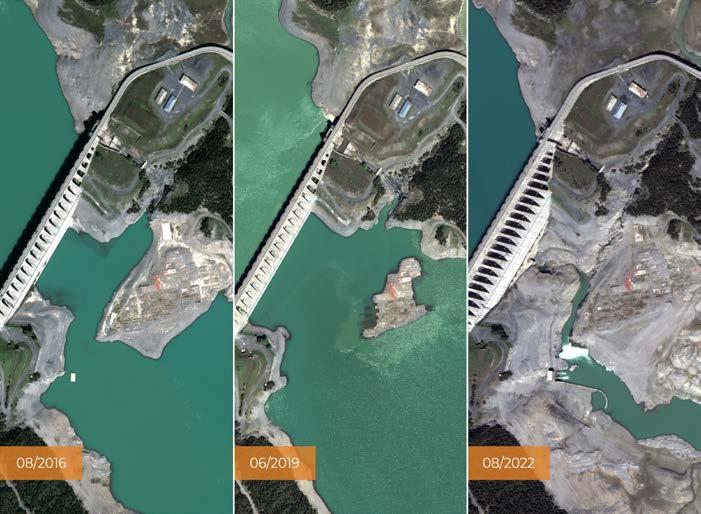

Zuzana Hajkova is a geospatial writer and content creator at European Space Imaging (EUSI) based in Munich, Germany. Her focus lies in the application of very-high-resolution (VHR) satellite data for a wide range of objectives.


The EU’s Nature Restoration Regulation sets clear ecosystem recovery targets that require Member States to know where to restore, how to prioritize investment, and how to demonstrate results over time. The success of meeting these targets depends on access to accurate, consistent and spatially detailed information. Earth observation provides a highly efficient way to monitor change at scale – especially when using very high resolution satellite imagery to provide the fine level of detail about specific restorationrelated features.
Moreover, the NRR introduces a long-term monitoring obligation that is different from the occasional mapping projects which have characterized much environmental assessment to date. This shift is likely to reshape how EO services are used. Rather than one-off mapping campaigns, public authorities will need long-term access to regularly updated imagery and derived products such as consistent time series and national-scale datasets. The integration of different data sources – VHR commercial imagery, medium-resolution public data from Copernicus, field survey results and in-situ sensors – will become routine, and the geospatial sector is well placed to support this transition.
Further reading
European Commission, Nature Restoration Regulation, https:// environment.ec.europa.eu/topics/nature-and-biodiversity/ nature-restoration-regulation_en
European Space Imaging, Enhancing land cover mapping with 8-band satellite imagery, https://www.euspaceimaging.com/wpcontent/uploads/Enhancing-Land-Cover-Mapping-with-8-BandSatellite-Imagery-Nov-2025-Digital-compressed.pdf
European Parliament and Council of the European Union, Regulation (EU) 2024/1991 of 24 June 2024 on nature restoration and amending Regulation (EU) 2022/869, https://eur-lex.europa.eu/legal-content/EN/TXT/ HTML/?uri=CELEX%3A32024R1991
European Space Imaging, Detecting bark beetle damage in Bulgaria, https://www.euspaceimaging.com/blog/2022/03/31/ detecting-bark-beetle-damage-in-bulgaria/ Joint Research Centre, Urban green spaces are scarce, while climate and wealth impact access, https://joint-research-centre. ec.europa.eu/jrc-news-and-updates/urban-green-spaces-arescarce-while-climate-and-wealth-impact-access-2026-04-13_en
From precision agriculture to environmental monitoring, actionable geospatial intelligence starts with highquality imagery. Simera Sense cameras and image processing solutions enable satellite missions to capture rich multispectral and hyperspectral data, transforming raw imagery into valuable Earth observation insights. Designed for performance, reliability and efficiency, Simera Sense helps unlock a deeper understanding of our planet from orbit.

Actionable Earth observation insight with Simera Sense cameras
GIM International interviews Lilian Pintea
By Durk Haarsma, GIM International
Gombe, Tanzania, is one of the few conservation landscapes in the world where more than six decades of continuous field research are combined with cutting-edge geospatial innovation. In the place where Jane Goodall began her pioneering chimpanzee research in 1960, analogue behavioural protocols are now intersecting with Lidar, uncrewed aerial vehicles (UAVs), satellite constellations and generative artificial intelligence (GenAI). Dr Lilian Pintea, vice president of conservation science at the Jane Goodall Institute (JGI), is leading that transformation. In this exclusive interview with GIM International, he explains how geospatial technologies are reshaping long-term ecological research, restoration monitoring and human-centred conservation across Africa.
Gombe is one of the world’s longestrunning wildlife research sites. How do you balance that legacy with rapid technological change?
Gombe is unique. It is the only place on Earth where we have five generations of chimpanzees documented continuously. That legacy is invaluable, but it also creates responsibility. We are custodians of more than 60 years of behavioural, ecological and environmental data. My role as one of the Gombe principal investigators is to bridge that analogue heritage with modern geospatial science. We are integrating UAV mapping, high-resolution multispectral imagery, Lidar-derived forest structure, satellitebased vegetation indices and AI-assisted transcription into one evolving knowledge system: the Gombe Research Platform.
You have been advocating the deployment of Lidar in East Africa for many years. What progress has been made?
We have conducted Lidar flights in Uganda in partnership with restoration initiatives and
research institutions. Licensing took much longer than anticipated due to regulatory and infrastructural realities. But once deployed, the data was extraordinary. We could differentiate restored corridors from old-growth forest, measure canopy heights, detect detailed settlement structures and assess agricultural crops. For conservation planning, that level of structural precision changes everything. Restoration stops being anecdotal and becomes quantifiable.
Digitizing handwritten chimpanzee behavioural protocols sounds less glamorous. But why is that equally important?
Jane’s original chimpanzee behavioural protocols are still paper-based. The focal individual’s location, group size, feeding and other behaviours are logged every 15 minutes. Special events are written down continuously. Mother-infant interactions are recorded every one to two minutes. These notebooks contain a mix of Swahili and Kiha languages and locally developed shorthand. For decades, translation has depended on Dr Lilian Pintea.

a handful of highly experienced staff. That creates vulnerability, plus the process is slow. For example, it would take 13 years to digitize and translate the remaining one third of paper protocols using the usual methods. Generative AI now offers an opportunity to accelerate transcription. Initial trials showed encouraging results from digitally scanned pages. With contextual prompt refinement, accuracy improved significantly. The goal is not automation for its own sake, but safeguarding and scaling access to one of the richest behavioural datasets in the world.
You describe your long-term ambition as building an ecological digital twin. What does that entail?
In ecological terms, a digital twin means creating a dynamic, realtime virtual replica of an ecosystem by integrating multiple data streams: 3D vegetation models from Lidar, daily NDVI ( Normalized Difference Vegetation Index, Ed. ) and environmental layers from satellite constellations, real-time acoustic monitoring, soil moisture sensors, and hydrological and other data. During a recent wildfi re in Gombe, satellite imagery from Planet allowed us to track the fire’s progression in near real time and inform response teams. Synthetic aperture radar (SAR) data from ICEYE also helped us generate high-resolution 3D videos and map human structures under the tree canopies and through the clouds and darkness. The next step is embedding continuous sensor networks. The technological components exist. The bottleneck is in the lastmile challenges of applying conservation technologies – such as limited resources and local capacity for deploying and maintaining resilient, low-power IoT infrastructure in remote tropical environments.
About Jane Goodall and the JGI
Dr Jane Goodall was a British ethologist who rose to global prominence through her groundbreaking study of wild chimpanzees in Gombe, Tanzania, which began in 1960. She died peacefully in her sleep aged 91 on 1 October 2025 while in the USA for her speaking tour. Today, the Jane Goodall Institute (JGI) operates across more than 30 countries, advancing her vision through wildlife research and rehabilitation, community-led conservation and youth engagement.
The JGI is increasingly relevant to the geoinformation community because of its systematic embrace of geospatial technology. Through its signature community-led conservation approach called Tacare, the institute deploys satellite imagery, drone surveys and GIS-based land-use mapping to monitor forest cover, track habitat loss and support local communities in sustainable land management.
The institute is committed to Dr Goodall’s broader vision: that conservation only succeeds when local people are stewards of their own landscapes. Under the leadership of Dr Lilian Pintea, the institute is working with local communities and governments towards more accurate and accessible spatial data as a strong and helpful tool for conservation and land-use initiatives that benefit people, other animals and our shared environment.
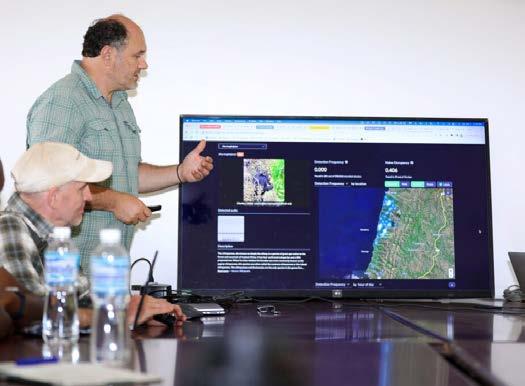
How does this technological expansion fit within your philosophy of human-centred conservation?
Technology must serve people. Farmers in western Tanzania are facing increasingly unpredictable rainfall patterns. Traditional ecological cues for planting are less reliable due to climate change. If geospatial analytics can help anticipate rainfall variability or guide land-use planning that reduces vulnerability to flash floods by restoring and protecting local forests, that directly strengthens livelihoods. Stronger livelihoods combined with spatially explicit and locally led, smart land-use planning efforts reduce pressure on forests. AI and geospatial tools are powerful, but they must enhance community resilience rather than replace local knowledge.
Climate change appears increasingly central to your work. How has the landscape altered over the past decade?
Local communities do not debate climate change; they experience it. Lake Tanganyika (which borders Gombe, Ed.) has reached record levels. Flooding events are more frequent. Dry and wet seasons no longer follow historical patterns. For subsistence farmers, a failed harvest means immediate food insecurity. This shifts conservation from being solely biodiversity-focused to being deeply intertwined with climate adaptation and land-use planning.
Uganda offers a complex example of chimpanzee-human coexistence. What lessons emerge from there?
Uganda demonstrates what future conservation landscapes may resemble: high human population density, habitat loss driven by expansion of agriculture, settlements, mining and logging, fragmented forests, and wildlife adapting behaviourally to survive. Chimpanzees have adjusted their feeding patterns and in some cases altered their activity timing. People-wildlife conflicts occur frequently, which makes community engagement essential. The JGI works with thousands of private forest owners, local communities and government organizations to restore corridors and implement detailed land-use planning. High-resolution satellite imagery from Vantor and Planet provides local decision-makers with an objective and transparent view of illegal human activities, and Lidar and spatial analysis quantify restoration success. Meanwhile, education supports coexistence.
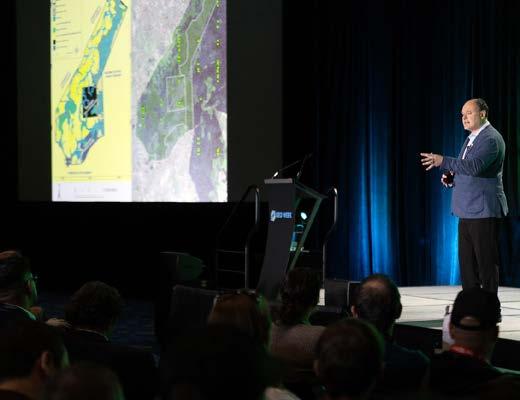
Beyond Lidar and AI transcription, which other emerging geospatial technologies do you see as transformative?
High-resolution satellite constellations delivering daily imagery, UAV-based multispectral mapping, acoustic biodiversity sensors and advanced analytics are all already reshaping field science and conservation practice. But generative AI applied to decades of unstructured ecological observations may prove equally
About Lilian Pintea
Lilian Pintea is vice president of conservation science at the Jane Goodall Institute. He specializes in integrating geographic information systems (GIS), remote sensing, UAVs and AI into habitat protection and community-led conservation across Africa.
transformative. The key is interoperability. We are building science and knowledge platforms that remove the silos between the data and allow it to serve multiple applications, from conservation planning to education and policy reporting.
Jane Goodall famously asked why the most intelligent species is destroying its own home. How do you reflect on that today? Chimpanzees exhibit ‘war-like’ behaviour and sometimes eliminate individuals from neighbouring communities without awareness of long-term consequences, such as reducing their own community’s genetic diversity and viability. From above, that seems self-defeating. Humans, however, possess planetary awareness. We can see landuse transformation and understand the impact of biodiversity loss and climate trajectories. The difficulty lies not in awareness, but in converting that knowledge into action with compassion and aligning governance, economics and collective behaviour with long-term planetary stewardship. Despite the challenges, restoration successes and properly used technological advances give hope.
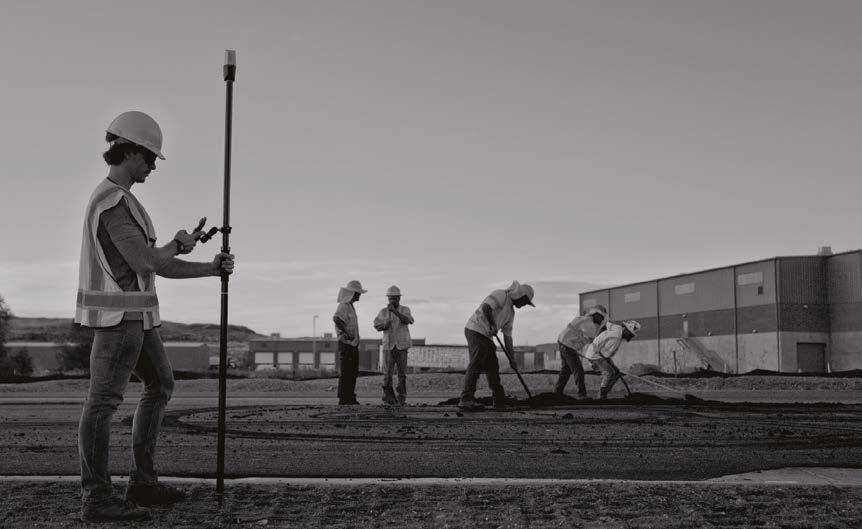

• Introducing Juniper RTK Correction Service

• Compatible with Uinta Mapping and Data Collection Software
• Mapping Solutions designed and assembled in the USA
Scan code to find your geospatial solution at junipersys.com
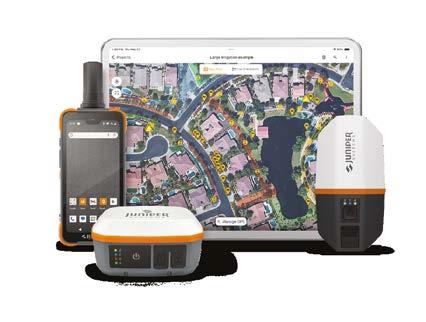
In a major step toward climate resilience and evidence-based national planning, the Kingdom of Tonga is set to become one of the very few Pacific Island Countries with comprehensive national Lidar coverage in 2026. This milestone will be delivered through the Tonga Coastal Resilience Project (TCRP), funded by the Green Climate Fund (GCF) and implemented by the United Nations Development Programme (UNDP) in partnership with the Government of Tonga.
UNDP is working in partnership with the Pacific Community (SPC) to strengthen Tonga’s capacity to collect, manage, analyse, interpret and apply coastal and climate risk data. In this context, Tonga is establishing its first complete national Lidar baseline to support coastal risk modelling, sea-level rise projections, disaster preparedness, infrastructure planning and long-term climate adaptation. As part of this effort, a Lidar coastal mapping survey was conducted over Tongatapu and Ha’apai island group from 21 March to 18 April 2026.
Knowledge transfer and technical collaboration
The Lidar survey was conducted by Fugro, an international geodata specialist agency with extensive expertise in aerial and maritime mapping. During implementation, SPC and Fugro technical teams worked closely alongside the Mapping and
Surveying Division within the Ministry of Lands, Survey, Planning and Natural Resources (MLSNPR) to ensure knowledge transfer and technical collaboration. Other key implementing ministries participating in the coordination included the Ministry of Meteorology, Energy, Information, Disaster Management, Environment, Climate Change and Communications (MEIDECC) and the Ministry of Infrastructure (MOI).
The data collected in the Lidar survey will support the development of scenario-based coastal risk maps and knowledge products that enable evidence-based adaptation planning. Beyond data acquisition, the initiative reinforces national ownership of climate information systems and builds long-term technical capacity within government institutions.
Building on Tonga’s Lidar legacy Tonga has previously undertaken Lidar surveys through various development initiatives:
• 2012 survey: Funded by the Australian Government Department of Foreign Affairs and Trade (DFAT) under the PacificAustralia Climate Change Science and Adaptation Program (PACCSAP), covering Tongatapu, Lifuka and Foa.
• 2021 survey: Funded by the World Bank under the Pacific Resilience Program (PREP), covering ‘Eua, Vava’u, Tafahi and Niuatoputapu.
• 2026 survey: Funded by the Green Climate Fund through the Tonga Coastal Resilience Project, covering Tongatapu and the Ha’apai Islands to complete national coverage.
The island of Tongatapu and the nearby smaller islands – all part of the Kingdom of Tonga archipelago in the southern Pacific Ocean – pictured in this Sentinel-2A image. (Image courtesy: ESA)
The 2026 survey will integrate existing datasets to establish Tonga’s first complete unified national Lidar coverage. This represents a significant advancement in strengthening Tonga’s climate resilience. High-resolution evaluation data will enable more precise flood and coastal inundation modelling, safer infrastructure design, strengthened coastal zone management, and informed long-term adaptation to sealevel rise and extreme weather events. By investing in robust geospatial data systems and national technical capacity, Tonga is strengthening the foundations for climate-informed decision-making that will protect communities, infrastructure and ecosystems for generations to come.
By Wim van Wegen, GIM International
A kinematic scanning project carried out on the River Thames in London, UK, has demonstrated the advantages of mobile mapping under real-world conditions within a limited time frame. Operating from a launch vessel, the survey – using a RIEGL VZ-600i – covered a 12km stretch between Tower Bridge and Lambeth Bridge, capturing high-density laser data in radar mode. The project provided valuable insight into trajectory calculation, data quality and overall system performance in a dynamic river environment with constant vessel movement and variable GNSS conditions.
Upon its launch in 2022, the RIEGL VZ-600i 3D terrestrial laser scanner brought a new form factor with hugely upgraded technology. This resulted in a smaller, lighter, but still faster laser scanner that from the outset had versatility and productivity at its core. Delivering a highest laser pulse speed of 2.2MHz and unique polygon mirror, this allows for extremely high-speed laser scanning simultaneously delivering the additional attributes RIEGL is well known for.
In terms of versatility, the VZ-600i offers four laser pulse speeds (measurement modes) which cover up to 1,000m of ranging capabilities. “This unique combination delivers a 6mm-resolutionat-10m scan – or, in long-range scanning, 600mm at 1,000m – in 25 seconds of scan time. With time for initialization and pose calculations in real-world applications, this translates into the potential for a scan position per minute, or better,” explains Dave Foster, managing director of RIEGL UK.
Robust, near real-time onboard registration (not course alignment) supports field operations. Progress of registration can be viewed via the large touch screen, to monitor what has been captured. This can be set to slice at user-defined intervals in order to show only the relevant dataon screen, or the whole registration file –
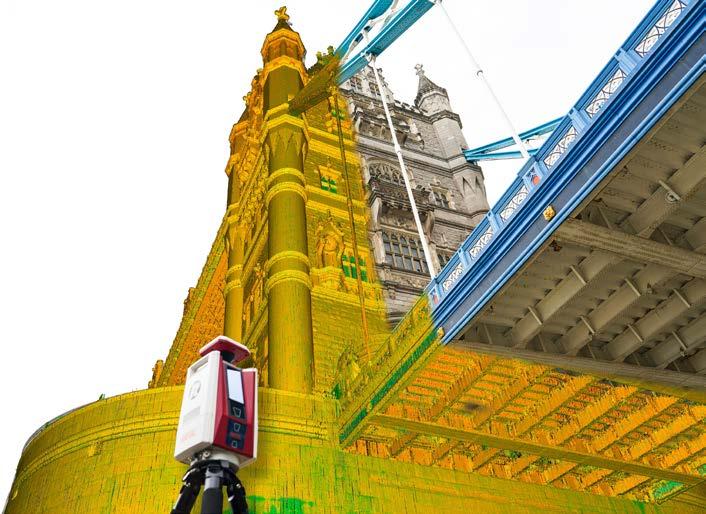
data.
displaying all scan positions registered –canbe viewed if desired.
Because users can select from a number of point resolutions to suit the scan in question, and can also set user-defined options, they no longer have to scan all positions at maximum range and higher resolution to account for the range selection. Therefore, the scanner offers significant time savings.
“Even whilst in static or ‘traditional’ mode, the VZ-600i delivers huge productivity gains and therefore key return on investment,” adds Foster.
RIEGL was invited to demonstrate the kinematic capabilities of the VZ-600i in a real-world project close to GeoBusiness 2025. The RIEGL team was able to source a launch vessel and operate on the River
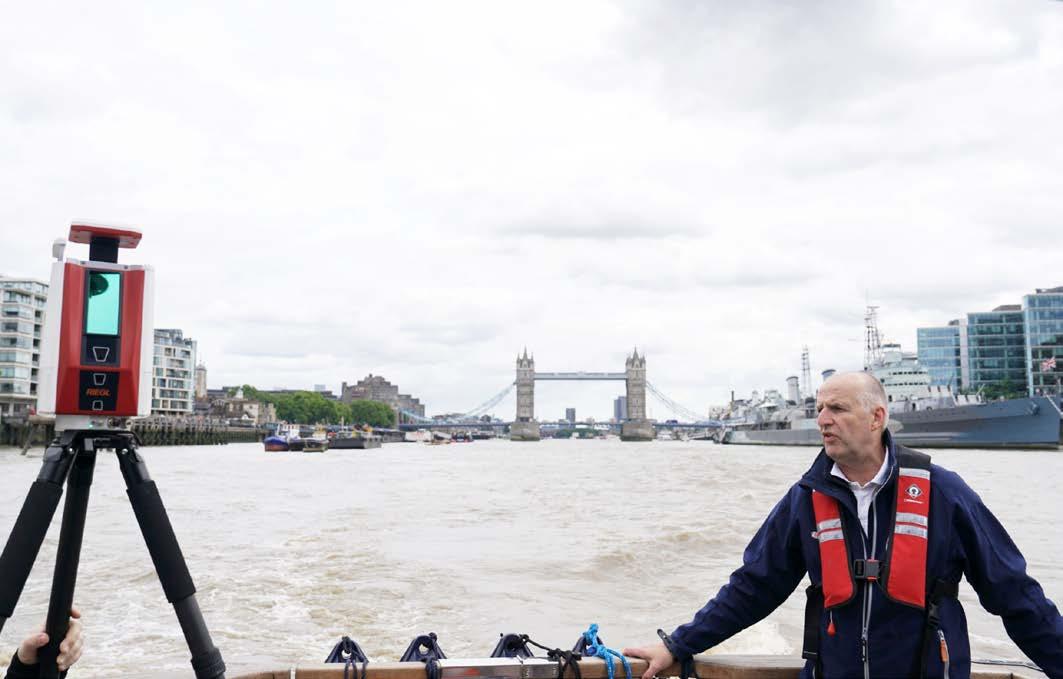
Thames, London, both for a demo and to extract data for analysis and testing.
Due to the relatively short notice, the setup of the project was really challenging, according to Foster. “The scanner was mounted simply on a tripod and held secure on the rear deck area of the launch. This proved stable for this particular one-off project, but would not be advised for regular survey operations,” he says.
The team was limited to one hour on the river. After careful calculation, the survey was commenced from near Tower Bridge and completed an out-and-back route to Lambeth Bridge, just upstream of the Palace of Westminster. This was a total of distance of 7.5 miles (12km).
The kinematic mode of the VZ-600i is enabled by the enhanced sensors: inertial measurement unit (IMU) and RTK GNSS. Higher laser pulse speeds allow the rotation of the scanner in radar mode to obtain a substantial amount of data. There are two key modes to operate from a moving platform: radar mode (continuous turning of the scanner) and line mode (scanner fixed to provide essential a profile scanning option as the platform moves).
“Preferably, two scanning operations should be completed – one in radar mode, then further in line mode. The data captured in radar mode forms a robust trajectory calculation from which data obtained in line mode can be processed. The data captured in line mode is by default a much richer dataset but is only applied in one direction,” states Foster. “The River Thames project was set up to be completed only in radar mode, but any future opportunity would allow for linescan mode to enable a richer dataset.”
Unique to the VZ-i series scanners range is the ability to acquire RGB
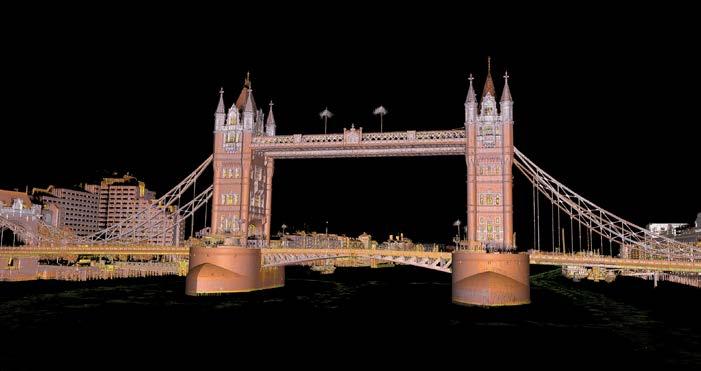
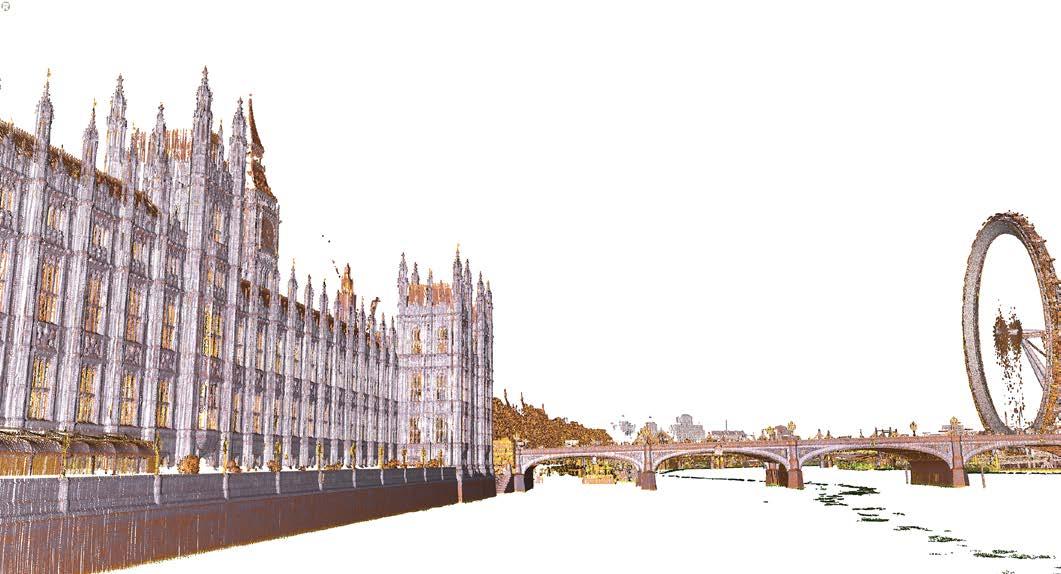
imagery at the same time as scanning. Where images are only required for point-cloud colourization, this is a positive impact, and does not slow the scanning operation.
The RIEGL RTK GNSS is the sole additional hardware requirement. This enables consistency of time stamps and related information to ensure the trajectory path recorded by the scanner is accurately calculated in the software. This can now be paired with the Sony ILX-1LR to provide imagery to colour the resultant point cloud. The use of the Sony offers a higher dynamic range and image resolution together with option to record RAW, jpg images and HDR image creation.
“In total, the survey was completed in 57 minutes, including obtaining a figure-of-eight path around Tower Bridge, where we were fortunate to have a brief quiet spell of river traffic,” adds Bernhard Groiss, application engineer at RIEGL Laser Measurement Systems GmbH, who was also on board for this project. “The weather at the time was dry with patchy cloud and breezy. Given the near-constant river traffic, there was significant wake from a number of vessels of varying sizes. This meant the onboard IMU had roll, pitch, yaw and some heave to contend with.”
The software processing for the VZ-600i is built upon a number of RIEGL principles, but tuned for the kinematic functionality. Overall processing was completed in around three hours. Processing required both initial and refined calculations of the trajectory path before the processing of the laser scan data. RTK GNSS solutions varied from fix through float to single. As a result, this required further processing with the laser scan data in order to refine the trajectory path, before a final refinement was applied to produce the registered point clouds.
The kinematic survey resulted in a complete
point cloud of approximately 380 million measurement points, which corresponds to a storage requirement of about 18GB. Depending on vessel speed and distance of the measured objects from the scanner, this resulted in an average point density on the bridges of approximately 500 to 10,000 points per square metre. The standard deviation of the distance, calculated relative to a fitted plane, was approximately 4-10mm.
“These facts demonstrate how flexibly, fast and precisely such a scenario can be captured with the RIEGL VZ-600i in kinematic operation by surveying bridge structures even in areas that would otherwise be inaccessible from any vantage point,” comments Groiss. “Combined with individually high-precision
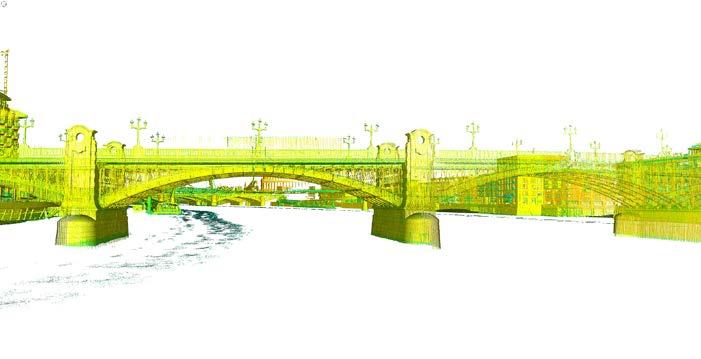
surveyed control points, external verification can also be carried out and thus, overall accuracy further improved.”
The rich dataset obtained, even within just radar mode, offers opportunities for structural monitoring, design, planning, construction as well as heritage documentation, suggests Foster. “The combination of scanner and useability would be attractive to Port and River Authorities who are required to both monitor and document waterside structures, especially where access is limited to a waterborne vessel,” he adds. “From the land, the VZ-600i can of course be used as a traditional laser scanner, but also be mounted to a vehicle or even backpack for a truly versatile static-to-mobile mapping system.”
Lessons learned
Foster looks back on the demo with satisfaction. “Data quality, despite only being captured in radar mode, was high. We can only surmise what it would have been had we been able to complete

Wim van Wegen is head of content at GIM International and Hydro International. In his role, he is responsible for the print and online publications of two of the world’s leading geomatics and hydrography brands. He is also a contributor of columns and feature articles, and regularly interviews renowned experts in the geospatial and hydrographic industries.
For similar applications, RIEGL refers to the option to record raw
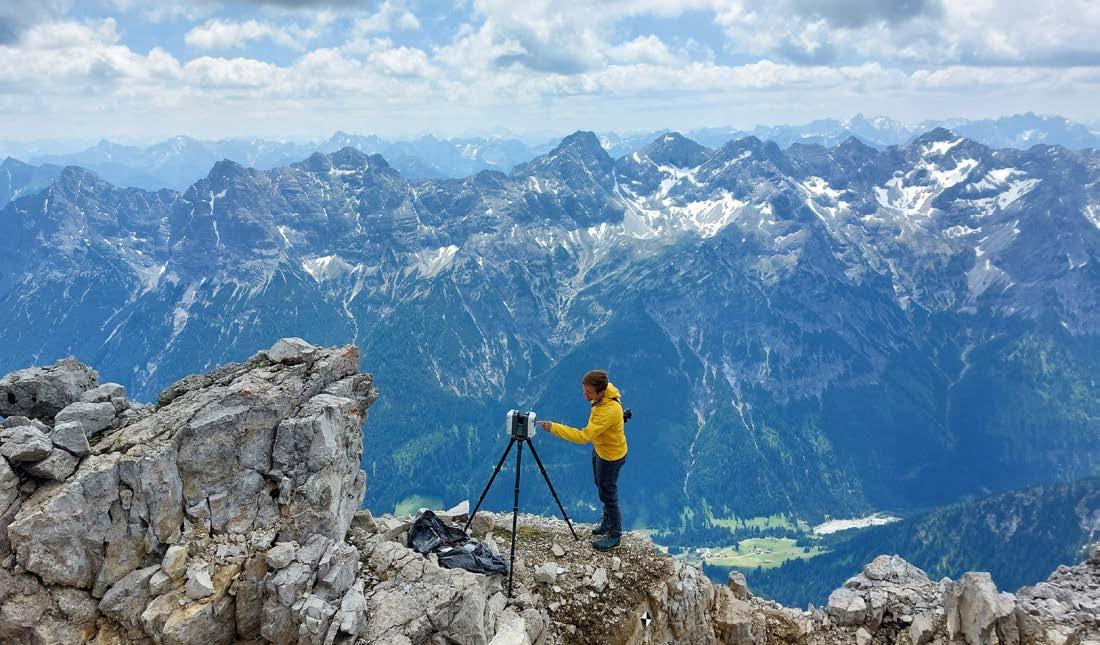

Your gateway to the latest geomatics trends, expert opinions, cutting-edge
Your gateway to the latest geomatics trends, expert opinions, cutting-edge technologies and global project updates technologies and global project updates
In-depth articles from industry leaders
In-depth articles from industry leaders
Updates from international trade shows and conferences
Updates from international trade shows and conferences
Industry news, case studies and tech insights
Industry news, case studies and tech insights Empowering the geospatial community

By Charles de Jongh and Bernt Larsen, Norway
The shallow nearshore coastal zone plays a critical role in coastal erosion processes, flood risk and ecosystem dynamics, yet it is one of the most difficult environments to survey. This article examines how airborne Lidar bathymetry has been successfully used to survey the full coastal zone of Northern Ireland, representing the first bathymetric Lidar project of this scale undertaken in the United Kingdom.
A Northern Ireland coastal erosion risk management study concluded that there was a lack of consistent nearshore data, required to reliably identify and map areas vulnerable to erosion and flooding. This lack of data was most pronounced in highly dynamic shallow coastal waters, which play a key role in erosion processes but remain difficult to survey.
In these shallow areas, vessel-based multibeam sonar surveys are often constrained by water depth, navigational safety and operational efficiency. As a result, coverage of the land-sea interface is frequently incomplete, leaving an unmapped transition zone between land and water, commonly referred to as the ‘white ribbon’ in coastal surveying. Airborne Lidar bathymetry (ALB) is a proven and efficient technology to address this challenge and close the gap. Using laser pulses, it allows terrain elevations both above and below the water surface to be measured in a single survey operation.
Against this background, the Northern Ireland Department of Agriculture, Environment and Rural Affairs (DAERA) commissioned a project using ALB to map the full coastal zone of Northern Ireland to a target water depth of 10m, covering approximately 700km² of coastal waters. This survey project represents the first ALB mapping project of this scale undertaken in the United Kingdom (UK). Following a tender procedure, the Norwegian company Field was selected to execute the survey.
Survey setup and planning
Field executed the survey by using a fixed-wing aircraft equipped with a CZMIL SuperNova bathymetric Lidar system developed by Teledyne Optech. This sensor was selected for its high laser power, supporting significant depth penetration, combined with advanced waveform processing that helps maintain reliable bottom detection in turbid and optically complex waters. In the context of Northern
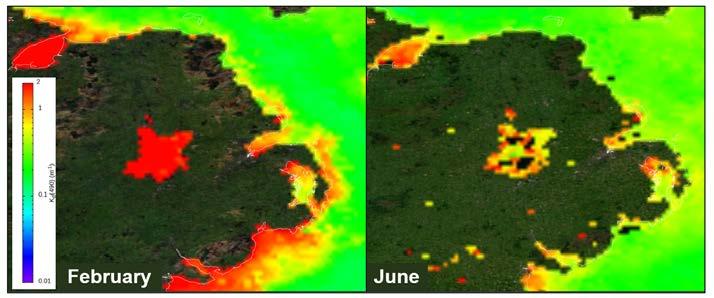
Ireland’s environmental conditions, this configuration offered the greatest likelihood of achieving useful bathymetric coverage across a substantial proportion of the 0-10m depth range. In addition, a Phase One iXM-RS150F aerial camera was used to acquire 3cm-resolution RGB imagery simultaneously with the Lidar data. The imagery provides valuable contextual information on water clarity, seabed features and coastal morphology, and supports quality control, interpretation and integration of the bathymetric results.
In general, ALB surveys can be executed most efficiently in environments with clear waters and relatively calm wind and wave conditions. In contrast, the coastal waters of Northern Ireland are characterized by quite variable weather conditions, including frequent rainfall and periods of stronger winds, which limit the number of suitable ALB survey windows. Particularly turbidity, commonly expressed as water clarity, is a critical factor for ALB surveys, as suspended sediments in the water column directly reduce laser penetration and achievable depth.
Many nearshore areas in Northern Ireland, specifically the river deltas, have persistently high concentrations of suspended sediments, so it was clear from the outset that reaching the target 10m water depth everywhere along the coastline would be challenging. To address these environmental constraints and maximize the potential survey results, careful
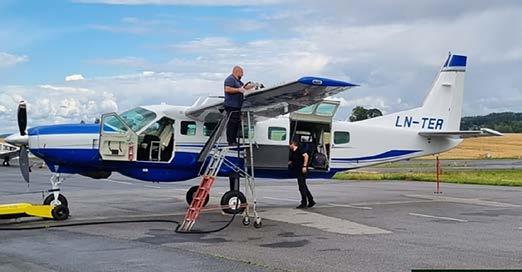
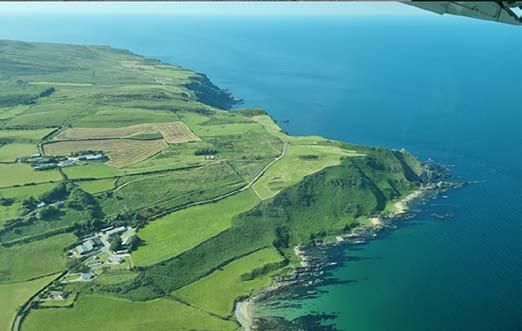
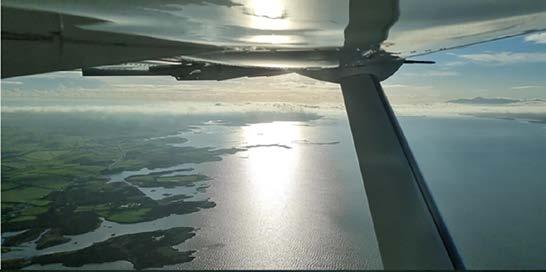
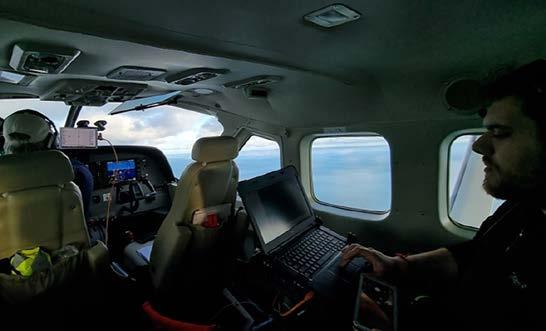
attention was given to an advance assessment of local turbidity conditions. Satellite-based turbidity maps were used to assess spatial and seasonal variability in water clarity around Northern Ireland.
Turbidity conditions
Figure 1 shows average turbidity conditions for February and June, derived from satellite observations of the diffuse attenuation coefficient at 490nm (Kd490), based on the NOAA Star Ocean Color website. The colour scale ranges from blue (indicating very clear waters with low turbidity) to red (indicating highly turbid conditions with strong light attenuation). Based on both the theoretical depth penetration capability of the CZMIL SuperNova and Field’s practical ALB survey experience, only limited bathymetric penetration of a few metres can typically be expected in red areas, while green areas generally allow depths of around ten metres to be reached. Blue conditions, which are more typical of very clear waters such as those found in parts of the Mediterranean, can enable depth penetration of several tens of metres, but are not observed around the Northern Ireland coast.
Two conclusions can be drawn based on the patterns visible in the maps in Figure 1. First, water clarity along the coast is generally significantly better in June than in February, reflecting typical seasonal differences between winter and summer conditions. In winter, frequent storms generate higher wave energy, stirring up bottom sediments, while increased rainfall and river discharge further elevate nearshore turbidity. Second, the maps reveal a clear geographical variability. The northern coastline generally exhibits clearer conditions, while river estuaries such as Lough Foyle, Belfast Lough and Carlingford Lough remain more turbid throughout the
year due to continuous sediment input. These turbidity patterns provided a useful indication of where the target depth of ten metres was likely to be achievable and where coverage would be more limited. On this basis, the main acquisition campaigns were scheduled as far as possible during the summer period, when improved water clarity typically offers the best survey conditions in Northern Ireland.
In addition to sediment-driven turbidity, biological factors such as algal blooms were also considered. Algal concentrations can significantly reduce water transparency, and vary rapidly in both space and time. While difficult to predict in advance, bloom events were monitored during survey execution using near-real-time satellite imagery, including Copernicus ocean colour products. This allowed survey priorities to be adjusted where reduced optical water quality was observed. Tidal conditions were also considered during the survey. Although the tidal range in Northern Ireland is relatively modest, tidal currents can resuspend sediments and cause rapid changes in water clarity, particularly in shallow and confined areas. Periods with reduced tidal currents, such as neap tides, were therefore generally preferred. However, optimal conditions varied locally depending on bathymetry, sediment characteristics and vegetation, requiring flexibility during survey execution.
The airborne survey over Northern Ireland was executed through a series of separate acquisition campaigns (see Figure 2). The full coastal zone was initially surveyed during the summer of 2023, when conditions were most favourable for large-scale data acquisition. As anticipated during survey planning, the bathymetry
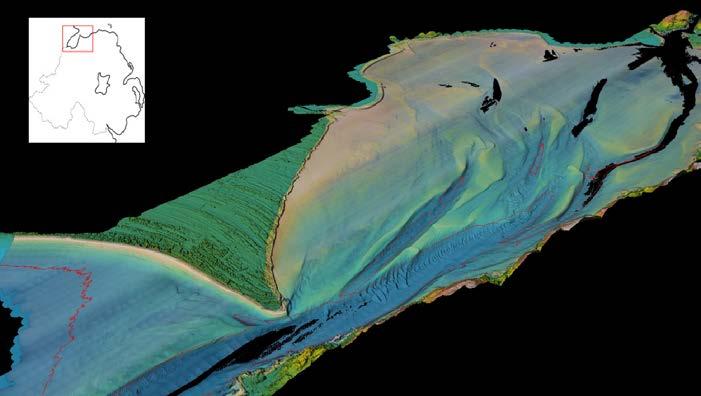
of several areas, particularly shallow estuaries and persistently turbid nearshore zones, could not be fully covered in a single pass. These areas were therefore addressed through targeted gap-filling campaigns in 2024, in some cases requiring multiple reflights to improve bathymetric coverage and point density. The final reflights were completed during a mobilization in May 2025.
The acquired Lidar and imagery data was processed to generate cleaned and classified topo-bathymetric point clouds, digital elevation models and depth contours, as well as high-resolution orthophotos. Together, these products form a comprehensive and highly detailed dataset of the coastal zone of Northern Ireland.
In addition to bathymetry, the delivered products include gridded Lidar return intensity and a separate classification of marine vegetation, both of which add significant value to the dataset. Lidar intensity supports the interpretation of seabed characteristics and spatial variability, while vegetation mapping provides insight into the distribution of submerged habitats such as kelp and seagrass.
The dataset forms a continuous topobathymetric elevation model, capturing elevations above the water surface and bathymetric depths extending beyond ten metres in many areas.
In some cases, local environmental conditions imposed limitations. For example, in parts of Lough Foyle (see Figure 3), particularly near the mouth of the River Foyle and around Londonderry, bathymetric coverage remains incomplete due to persistently high turbidity, which limited bottom detection despite multiple acquisition attempts. Even so, the resulting digital elevation models clearly depict the transition from dry land through the intertidal zone into subtidal channels, including sandbanks and channel features.
Under more favourable conditions, the combined Lidar and imagery data revealed
detailed underwater topography, with bathymetric penetration extending well beyond the 10m depth contour across much of the area (see Figure 4). The zone between the coastline and the sonar limit, the so-called ‘white ribbon’ area, is largely inaccessible to multibeam surveys due to shallow water depths and navigational constraints. Figure 5 clearly illustrates how airborne Lidar bathymetry fills this gap, providing continuous coverage across the land-sea interface and demonstrating the strong complementarity between multibeam sonar and airborne bathymetric Lidar for comprehensive coastal mapping.
Following processing and quality control, approximately 85% of the Northern Ireland coastal zone was successfully mapped to depths of 10m or greater using airborne Lidar bathymetry. In clearer water areas, bottom detection frequently exceeded 25m, while in more turbid environments, such as Strangford Lough, achievable depths were typically limited to around 8m. A small number of localized data gaps remain, primarily within major estuaries and sea loughs, as well as in isolated rocky or kelp-dominated nearshore sections. In these areas, persistently elevated turbidity, strong tidal sediment transport, dense marine vegetation and/or dark, low-reflectance seabed materials limit laser penetration and reflection, even after repeated acquisition attempts under different environmental conditions.
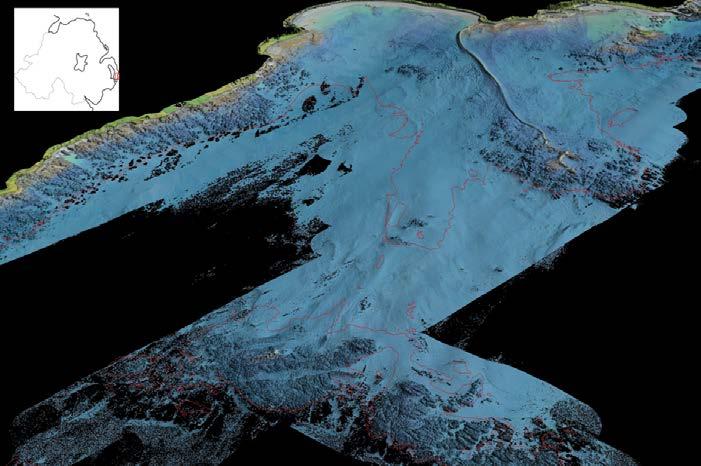
Independent validation was carried out by the UK Hydrographic Office prior to final acceptance. Across all surveyed regions, the bathymetric data met the requirements of IHO S-44 Order 1b. The UKHO assessment confirmed good internal consistency and seamless integration across the land-sea interface and with adjacent multibeam sonar datasets.
Taken together, the results represent the most complete and consistent topo-bathymetric dataset acquired for the Northern Ireland coast to date. By effectively bridging the gap between terrestrial Lidar coverage and deeper-water multibeam surveys, the ALB dataset provides a robust foundation for coastal management, charting, engineering and environmental applications.
This successful project further demonstrates that airborne bathymetric Lidar surveys can consistently deliver reliable, highquality data across extensive coastal zones, even under challenging environmental conditions. Based on that, this project is likely to lower the barrier for future coastal Lidar bathymetry initiatives in the UK and in other regions with similarly variable weather and water clarity.


Charles de Jongh is business development manager – airborne mapping at Field, where he focuses on the delivery of airborne bathymetric Lidar solutions. He holds an MSc in Cartography and Geographic Information Science and has more than two decades of experience in the marine geospatial sector.
Bernt Larsen is project manager at Field with an MSc in Geosciences. He previously served as technical manager for airborne sensor systems and, since 2017, he has managed numerous Lidar and imagery projects. He is Field’s subject matter expert in airborne Lidar bathymetry and has been project manager for most of Field’s airborne bathymetric Lidar projects.
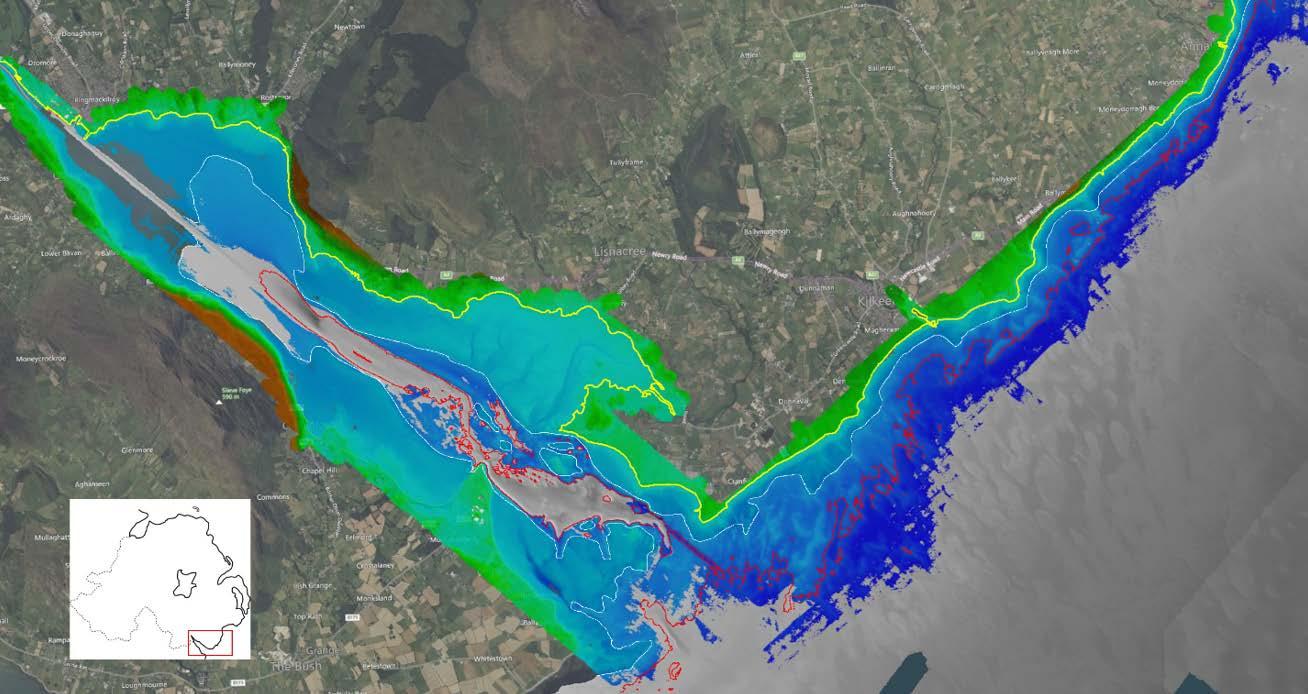
Figure 5: The challenges in Carlingford Lough are similar to those observed in Lough Foyle, including persistently high turbidity near the mouth of the River Newry. This image shows how bathymetric Lidar data fills the gap. The yellow line denotes the coastline, the red contour marks the 10m target depth, and the white line indicates the landward limit of existing multibeam sonar coverage. Sonar data is shown in grey, with bathymetric Lidar data overlaid in colour.
Further reading
Baseline Study and Gap Analysis of Coastal Erosion in Northern Ireland, by the Department for Infrastructure (DfI) and the Department of Agriculture, Environment and Rural Affairs (DAERA), https://www.infrastructure-ni.gov.uk/publications/ baseline-study-and-gap-analysis-coastal-erosion-riskmanagement-ni
By Blaž Vidmar, Nejc Dougan and Barbara Žabota
The scale of the Digital Twin Germany project raises a critical operational question: how can the vast volumes of spatial data be processed efficiently, without compromising quality? This article examines how AI-powered Lidar point cloud classification is answering that challenge. The use of AI models that are extended with project-specific object classes has significantly reduced manual processing time while maintaining high classification accuracy. The case offers a compelling look at how intelligent automation is enabling faster and more consistent results, and what that could mean for the future of large-scale geospatial infrastructure programmes.
The Digital Twin Germany (DigiZ-DE) initiative, led by the Federal Agency for Cartography and Geodesy (BKG), integrates geospatial, environmental and infrastructure data into a unified 3D model of the entire country. This strategic platform is designed to support urban planning, crisis management and longterm sustainability objectives. It began as a pilot project focused on an aerial survey of the Hamburg metropolitan region. Following its success, a full national aerial survey was initiated, running from 2024 to 2026.
Within the Digital Twin Germany programme, which is covering a total survey area of 356,794km², Flycom Technologies – a European provider of remote sensing and geospatial solutions – has responsibility for approximately 100,000km². This positions Flycom as one of the most significant contributors to this ambitious national geospatial mapping programme.
Central to this effort is classified Lidar data, which delivers the precise elevation and surface measurements needed to accurately represent buildings, terrain, vegetation and infrastructure at national scale. In a deliberate departure from the ‘leaf-off’ season typically favoured in national surveys, data acquisition takes place between March and November. This ‘leaf-on’ period was selected to better support analysis of vegetation and tree structure. With a
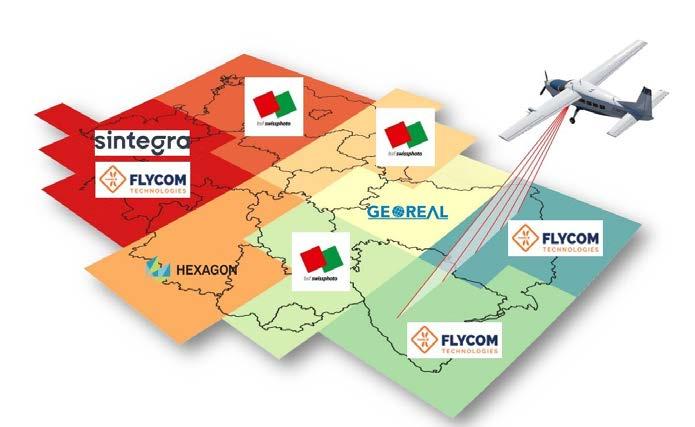
minimum point density of 40pts/m2, the Lidar point density can be categorized as exceptionally high for a project of such scale. For context, typical national Lidar surveys deliver around 5pts/m² in countries such as Spain and Slovakia, and 10pts/m² in France, Portugal and Slovenia.
The Lidar classification process Classification followed a 12-class scheme modelled on the ASPRS standard, covering categories such as ground, low, medium and high vegetation, buildings, water, bridges, low and high noise points, high-voltage
power lines, and a broader category for other objects including wind turbines, solar panels, towers and pipelines. For a project of national scale, automation was not a convenience but a necessity. With its team of experienced Lidar production managers and data scientists, Flycom Technologies combined established methodologies with innovative approaches to keep the complex, multi-stage workflow running efficiently as well as accurately.
AI tools such as those provided by the company Flai prove particularly valuable
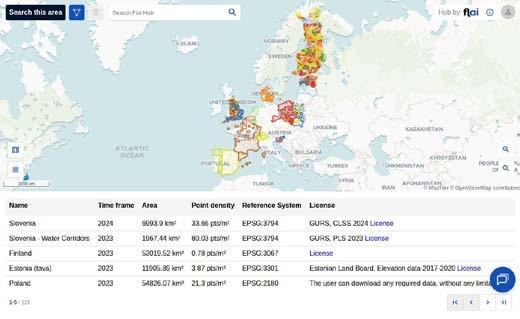
where the data gets complicated. When working with new or projectspecific object types such as wind turbines, the ability to generate more than 20 classification classes in a single processing run makes a tangible difference. It removes the need to cycle through the workflow repeatedly and frees up expert time for decisions that genuinely require human judgment. Therefore, the Flai AI model was applied broadly across the dataset, covering vegetation, buildings, power lines, vehicles, and a range of other object types.
AI classification had a particularly clear impact on the production process in the following four areas: noise classification, power line classification, wind turbine detection and bridge boundary optimization.
1.Noise classification at strip level
Aerial survey data is collected in strips, and each strip can display slightly different noise patterns. Excessive noise can interfere with data matching and georeferencing. AI models are generally well suited to classifying noise in point clouds. Flai’s training dataset includes examples from RIEGL, Teledyne, Hexagon and other sensor manufacturers, which helps the model recognize a wide range of
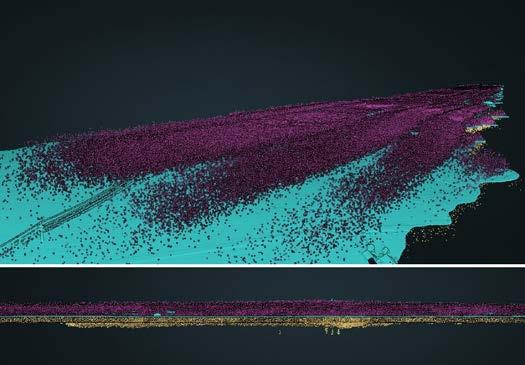
by blue. (Data courtesy: Federal Agency for Cartography and Geodesy, BKG)
sensor-specific and environment-specific noise types. Beyond the noise classification available in the pretrained FlaiNET models, Flai developed an AI-based noise classification process operating directly at strip level, before tiling. The model identifies low and high noise points across the entire strip and separates them from valid data, improving both matching accuracy and overall data quality. Once the data is aligned and georeferenced, it continues into the standard tiling phase.
Power lines represented one of the main above-ground categories where AI provided clear benefits in the DigiZ-DE project. FlaiNET classifies power line infrastructure into four distinct categories: highvoltage conductors, low-voltage conductors, high-voltage towers and low-voltage towers. This level of granularity has practical value, as it allows each infrastructure type to be processed independently in subsequent workflow stages. The classification runs directly on the point cloud, requiring no vector inputs or auxiliary layers as a starting point. Vector data can still be incorporated during post-processing,



Blaž Vidmar is head of business development at Flai. With an MSc in Geodesy and Geoinformatics and decades of point cloud expertise, he has researched photogrammetry for cultural heritage applications and built deep commercial knowledge at Pix4D. At Flai, he bridges Lidar technology with market strategy to drive customer acquisition.
Nejc Dougan is CTO at Flai and also serves as vice-president of Open-Source Geospatial Slovenia. He holds an MSc in Geodesy and Geoinformatics, and has expertise in geoinformatics, remote sensing, computer vision, AI and computer science. Before founding Flai, he was head of AI at FCT and a researcher focusing on 3D point cloud semantic segmentation.
Barbara Žabota, PhD, is COO & project manager for remote sensing at Flycom Technologies, specializing in aerial data capture, photogrammetry, Lidar and GIS analytics. Operating a fleet of Pilatus and Diamond aircraft, helicopters and RIEGL Lidar sensors, Flycom has delivered nationwide Lidar and digital twin projects across Slovenia, Croatia, Slovakia, and is actively involved in the Digital Twin Germany initiative.
but the AI output alone is sufficient for moving the work forward. This approach is particularly effective when project specifications treat high and low-voltage features differently. Because the model separates these classes from the outset, remapping steps are quick and consistent across large areas. The model also handles dense Lidar data reliably, captures thin conductor segments, and maintains clear separation between wires and towers even in complex environments such as line crossings or areas of dense vegetation.
Wind turbines form a prime example of how the digital twin supports cross-domain applications, from aviation safety to spatial planning. Detecting turbines and defining their geometry is a challenging task for conventional processing methods, but AI models handle it effectively. The introduction of a dedicated AI classification category for wind turbines has proven both efficient and accurate, supporting further automation of the broader classification workflow.
4. Bridge classification and boundary refinement
Bridges are reliably detected by the pretrained FlaiNET model, and overall classification performance is strong. However, AI models can struggle to produce sharp boundaries between classes in flat areas, meaning the transition between a bridge and the surrounding ground can appear soft or uneven. For applications requiring clean, well-defined edges, this boundary must be refined. In order to address this, Flai developed a dedicated post-processing tool that automatically sharpens the interface between bridge and ground categories, delivering the clearly defined boundaries that downstream workflows require.
The question of whether to process Lidar data in the cloud or locally is one that arises on most large-scale projects. Cloud processing offers scalability, but it also introduces overheads in the form of large data transfers, increased costs and potential data protection constraints. Flai supports both approaches. The online interface is primarily used for testing, reviewing sample tiles and configuring workflows. For production runs, the Flai command-line
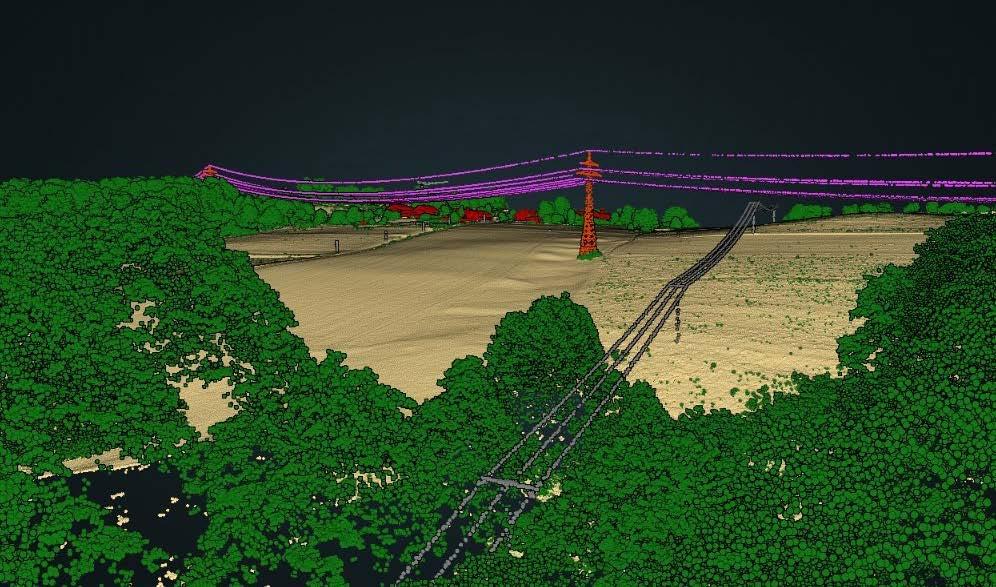
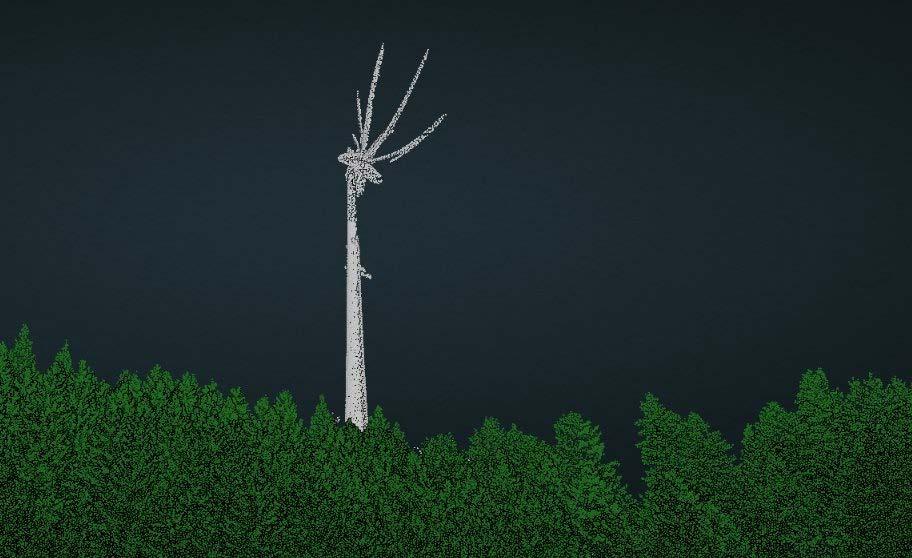
interface integrates cleanly into existing infrastructure.
In this project, Flycom Technologies had the full dataset stored on its own systems, and the CLI tool was able to read and write directly to that storage without requiring additional data movement. When data is stored in the cloud, the same CLI tool can be deployed on providers such as AWS and
run on their systems. The key advantage is flexibility: the ability to run multiple processes in parallel, whether locally or in the cloud.
The case for AI in national mapping programmes
The DigiZ-DE project offers a practical demonstration of how AI-supported Lidar processing can be scaled across large
Video of the presentation by Paul Becker, president, Federal Agency for Cartograhpy and Geodesy (BKG) at GWF: https://youtu.be/aKmMx-71pgM
national programmes. As the examples in this article illustrate, AI-based classification is capable of handling both the volume and the technical complexity demanded by initiatives such as the Digital Twin Germany.
Flai’s library of pretrained models covers a wide range of point cloud categories, allowing workflows to be adapted to the varying technical specifications of different national mapping agencies. It is also possible to create project-specific classes such as wind turbines, which are difficult to extract through traditional methods without extensive manual intervention.
All classes are produced within a single automated process, eliminating repeated runs and significantly reducing processing time. The AI models also demonstrate strong performance in noise classification, whether applied to individual tiles or entire strips, helping to maintain consistent data quality across the full survey area.


Online company profile
Home page highlight Member highlight 2x Company highlight 4x Social post
1/1-page ad in Business Guide
Company profile in Business Guide
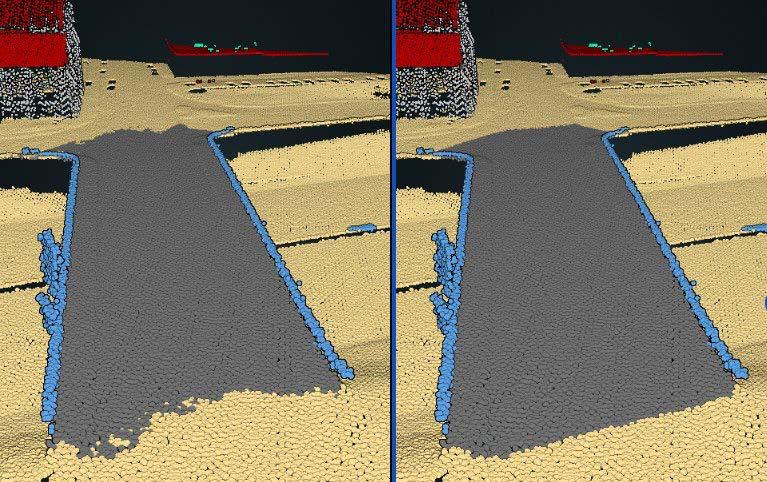
Because the project runs over an extended period and under varying conditions, the ability to retrain and fine-tune specific categories adds further value. This
adaptability ensures that results remain accurate over time and that workflows can be efficiently reused in future national-scale mapping programmes.

Online company profile
Home page highlight Member highlight 2x Company highlight 2x Social post
1/2-page ad in Business Guide
Company profile in Business Guide

Online company profile Home page highlight Member highlight 2x Company highlight 1x Social post
Company profile in Business Guide



The world is changing fast and the profession of surveying is changing with it. Two new publications from FIG make the case that the people who measure and document our land, water and communities are not just witnesses to global crises. They are essential actors in solving them.
FIG Publication No. 85, Surveying for Climate Resilience: Practical Climate Actions
FIG Publication No. 85, Surveying for Climate Resilience: Practical Climate Actions is the culmination of three years of work by FIG’s Climate Compass Task Force. It is a bold, practical answer to the climate emergency. The publication identifies 16 concrete actions that surveying professionals can take across land, water and marine environments – from supporting climate policy with long-term geospatial data, to using AI and Earth observation tools for disaster risk management. The message is clear: surveyors are not bystanders. They are the professionals who collect the data that underpins every serious climate decision.
The climate crisis is not only a threat, but also an invitation to reimagine the profession. A US$287 trillion global real-estate market is already being reshaped by climate risk, and new business models are emerging that
demand exactly the skills surveyors have. This publication shows the way forward, bridging the digital divide between the global north and global south to ensure no community is left behind.
FIG Publication No. 86, STDM Conceptual Model in Action
Co-published with UN-Habitat’s Global Land Tool Network, FIG Publication No. 86, STDM Conceptual Model in Action is focused on a different but equally vital topic: the fight for land rights. The Social Tenure Domain Model (STDM) is an innovative concept, model and information tool designed to address gaps in conventional land administration systems by recognizing and documenting all peopleto-land relationships, including non-formal and customary rights along the continuum of land rights. After 15 years of field-tested evolution, STDM has proven transformative for some of the world’s most marginalized people: slum dwellers, smallholder farmers, women, displaced communities and those rebuilding lives after conflict or disaster. Secure tenure, the publication demonstrates, is not a bureaucratic nicety. It is the foundation for housing, food security and a dignified life. Furthermore, STDM has proven to be a valuable tool in post-conflict and post-disaster contexts, helping to document and restore land rights so that communities can rebuild their livelihoods.
Surveyors have a major role to play in supporting the adaptation and mitigation of climate impacts at global, national and local level.
This publication provides an insight into the further evolution and use of STDM including its integration with the Land Administration Domain Model (LADM), which is recognized as a normative annex in the ISO standard – a significant milestone.
Inclusive, people-centred surveying Together, these two publications form a compelling vision on how to measure and protect the planet and how to ensure that every person’s claim to it is recognized. Both arrive at the same answer: through rigorous, inclusive, people-centred surveying practice.
For a profession sometimes seen as technical and behind the scenes, these publications are a confident statement of purpose. Surveyors hold the keys to some of the most urgent questions of our time, and these publications address and show how to use them.
More information
fig.net/resources/publications/ figpub/

In today’s data-saturated world, the central challenge is no longer gaining access to information, but having the ability to interpret it. Cartography and maps can play a guiding role by connecting detail with meaning.
With satellites, sensors and massive databases continuously generating detailed insights, people are surrounded by more data than ever before. Yet this abundance often obscures understanding rather than enhancing it. The difficulty lies in connecting scattered facts into a coherent whole.
This is where cartography – broadly understood as the practice of organizing and visualizing complexity – becomes essential. A map’s value is not in showing everything, but in selecting and emphasizing what truly matters. By filtering, structuring and arranging information, maps transform raw data into meaningful knowledge. Without this process of simplification and hierarchy, information risks becoming overwhelming noise.
Modern digital tools have expanded cartography far beyond traditional geography. Interactive maps, real-time dashboards and layered visualizations allow users to explore complex systems such as migration, climate or global supply chains. However, this increased capability introduces new risks. When too many variables are displayed simultaneously, users may become lost in details, mistaking precision for clarity. Effective cartography must therefore guide interpretation, not just present information.
This guiding role is especially critical during crises. In events like natural disasters, decision-makers depend on clear and focused maps to understand risks and act quickly. A well-designed map highlights essential patterns – where danger is concentrated, who is affected, and what responses are needed. In contrast, poorly constructed maps can confuse, mislead or
Georg Gartner.
even endanger lives by presenting excessive or unclear information.
Beyond emergencies, cartographic thinking is vital for addressing long-term global issues. Consider climate change: individual data points such as temperature or emissions are only meaningful when viewed in relation to each other. Maps help reveal patterns, trends and connections across time and space, turning isolated measurements into a narrative that can inform decisions and policy.
Importantly, the concept of mapping extends beyond physical space. In digital and conceptual contexts, maps serve as frameworks for understanding complex systems – whether social, technological or economic. By establishing relationships and hierarchies, they help people orient themselves within intricate networks of information.
However, mapping is never neutral. Every map reflects choices about what to include,
exclude and emphasize. These decisions can shape perception, reinforce biases or promote particular viewpoints. In the age of big data, this ethical dimension becomes even more significant, as automated systems may appear objective while embedding hidden assumptions. Responsible cartography requires transparency and critical awareness.
As digital tools make mapping more accessible, more people can create and share their own representations of reality. This democratization allows communities to highlight overlooked issues and challenge dominant narratives. Still, wider participation does not reduce the need for expertise. On the contrary, it increases the importance of thoughtful design and critical interpretation.
Ultimately, the enduring value of cartography lies in its ability to connect detail with meaning. In a world overflowing with data, understanding depends on perspective, structure and synthesis. Maps enable people to step back, recognize patterns and grasp relationships, helping them make sense of complexity rather than becoming overwhelmed by it.
Georg Gartner, president International Cartographic Association

The XXV ISPRS Congress and 47th Canadian Symposium on Remote Sensing (CSRS) are being held in July 2026. The team is fully immersed in the preparations and looking forward to welcoming you to the world’s most multicultural city: Toronto.
We are very pleased with the large number of high-quality contributions received from the world’s photogrammetry, remote sensing and spatial information sciences community. Among the nearly 1,800 submissions are full-length papers and extended abstracts for both the scientific sessions and the practically focused applied sessions.
The daily programme will feature blocks of parallel oral sessions and a poster session in the afternoon. These sessions will feature contributions from the more than 50 ISPRS scientific working groups (WGs) as well as 28 ISPRS Thematic Sessions (covering emerging topics outside WG scope). There will be four ISPRS Special Sessions (emphasizing connections with other fields) and 11 CRSS Invited Sessions. Daily plenary sessions after the morning coffee break will feature two keynote speakers and presentation of ISPRS awards.
Industry tech sessions and lightning talks will complement the commercial exhibition and allow attendees to see the latest innovations from our industry partners. The 12 forum sessions featuring speakers and panellists from academia, industry and government will encourage broad audience participation. Eleven full-day tutorials and seven half-day tutorials led by international experts will give participants hands-on learning experiences in emerging and foundational areas.
We encourage you to enjoy the vibrant pulse of Toronto, a dynamic metropolis renowned for its cultural richness, iconic landmarks and thriving innovation hubs. It is also one of the host cities for the 2026 FIFA World Cup, taking place around the same time as

ISPRS 2026. Attendees can enjoy the bustling streets of downtown and the tranquil shores of Lake Ontario, creating an unforgettable setting that perfectly complements the excitement of the congress and the World Cup festivities.
Detailed instructions are available on the ISPRS website to help you navigate the visa application process smoothly. Please read
the information carefully and follow all steps. The web page includes direct links to the latest updates from relevant Government of Canada websites, including the IRCC portal.
To avoid delays:
• Carefully follow the instructions
• Provide all required information
• Apply for your visa as early as possible
Derek Lichti ISPRS
congress director
We proudly present our premium members, the ambassadors of tomorrow's geomatics!
Will you be next?