
32 minute read
Incidence of Food Insecurity in Rural and Urban Counties in Pennsylvania


Nala J. Mckie1*, Sarah A. Omoyugbo1*, Ahquasia N. Ramsay1*, Toyo A. Adebayo1*, and Andrew Chew2
1Geisinger Commonwealth School of Medicine, Scranton, PA 18509 2The Institute for Public Policy and Economic Development in PA, Scranton, PA 18503 Correspondence: nmckie@som.geisinger.edu
Abstract
Food insecurity is influenced by multiple determinants including socioeconomic status, and the Supplemental Nutrition Assistance Program (SNAP) was established to bridge the nutritional gap between low- and high-income households. Food insecurity continues to be a growing disparity among rural and urban communities in the country. Few studies analyze both rural and urban food insecurity, and none do so at the state or county levels. Therefore, we sought to understand the impact of socioeconomic factors on food insecurity in urban and rural households at the state and county levels. We examined urban and rural counties in Pennsylvania (PA), a state with moderate food insecurity rates that are consistently below the national average. We expected that the rate of food insecurity in rural counties would be higher than in urban counties. We measured the incidence of food insecurity among rural and urban households in PA. We used the predicted trends produced by the United States Department of Agriculture Economic Research Service (USDA ERS), based on surveys given to individuals living in rural areas. We analyzed the USDA ERS data to compare the levels of food insecurity, considering the data for low and very low food security in rural counties in PA. To measure food insecurity in the urban counties, we used data provided by the hunger-relief organization Feeding America. To assess the relationship between food insecurity between rural and urban counties, we examined the data provided by census.gov in the following categories: income, household size, family determinants (head-of-household), and government assistance. These determinants were analyzed in comparison to food insecurity from the years 2015 to 2019 in both rural and urban households. Based on our data analysis between rural and urban areas, SNAP alone is not sufficient to address levels of food insecurity in rural areas. We found that about 1 in 7 rural households receive SNAP benefits compared to about 1 in 11 urban households. Yet the food insecurity rates were still higher in rural counties than in urban counties, at 11.82% and 10.76%, respectively. Overall, more households with women heads of household receive SNAP than households with men heads of households at the county, state, and national levels. Lastly, the average income in rural counties is over $10,000 less than the average in urban counties, and almost $10,000 less than the state average. Hopefully, these results will instill a sense of urgency that will influence new policies to support both rural and urban households in different capacities to decrease the food security gap among American households. Since PA tends to be below the national average for food insecurity, we hope that this will prompt action in above-average states as well.
Introduction
Food insecurity is measured as a lack of access to nutritious food, eating food past the expiration date, and purchasing inexpensive and unhealthy foods (1). Food insecurity tends to impact households that have one of the following characteristics the most: children under the age of 6, women as head-ofhousehold, adults living alone or with disabilities, Black and Hispanic households, and low-income households (2). Healthy eating options are expensive when compared to fast food. People who struggle financially are inclined to consume more fast food than normal. This diet regularly can have an increased risk of chronic diseases such as obesity, high blood pressure, heart disease, and diabetes. Some studies have shown that food insecurity is associated with decreased nutrient intake, leading to increased rates of mental health problems and depression, diabetes, hypertension, and hyperlipidemia (3–4). Racial and ethnic minorities are 1.5 to 2.0 times more likely than whites to have most of the major chronic diseases (5). This, when paired with a low-nutrient diet, can exacerbate chronic diseases. Processed foods such as ramen, which are high in calories and nutrient-deficient, are cheaper and more abundant compared to nutrient-rich foods like vegetables, fruits, and lean meats. This disproportion of high-quality and nutrient-rich foods can lead to Supplemental Nutrition Assistance Program (SNAP) participants with higher health risks (6). As mentioned above, food insecurity can also affect the psychological well-being of a person. Depression and irritability exacerbated the emotional strain parents already faced, ultimately creating an emotional disconnect with their children (7). The United States (U.S.) began SNAP to help the nutrition disparity in low-income families. Interventions, such as SNAP and various government assistance programs, have been used to reduce food insecurity. While these programs are helpful to some, not everyone who needs them is qualified to receive the benefits because they do not meet certain thresholds. Rural and urban areas present specific and unique problems to those that reside in these communities, ranging from healthcare to socioeconomic factors. Understanding and recognizing the existence of these rural and urban disparities and where they intersect with one another is the first step toward creating proactive solutions to remedy the problem. We sought to understand the impact of socioeconomic factors on food insecurity in urban and rural households in Pennsylvania (PA) from 2015 to 2019. Many households in rural and urban populations experience food insecurity, but this can be attributed to myriad reasons, such as socioeconomic status, household characteristics, and
government assistance, among others (8). PA ranks highly concerning food security rates when compared to other states, and it is consistently below the national food insecurity rate (9). Yet in 2019, the state of PA reported a food insecurity rate of 10.6% with an average meal cost of $3.17 and an annual food budget shortfall of $733,806,000 (9). The margins previously mentioned are astounding, and underlying factors like county size, population density, and income status should be considered. For example, food insecurity rates are more prevalent in rural areas. Food insecurity affects about 52% of people living in rural areas in comparison to 24% of people in urban counties (10). Rural communities also face the challenges of low-wage employment opportunities and higher rates of unemployment and underemployment (11). Government food assistance programs including SNAP, the Special Supplemental Nutrition Program for Women, Infants, and Children (WIC), and the National School Lunch Program (NSLP) are more likely to be used by households facing food insecurity (12). Approximately 59% of households experiencing food insecurity reported having participated in one or more of these programs (13). Though the U.S. government has social programs in place for food-insecure households, research indicates that these programs are unable to meet the needs of the population (6). A study from Cambridge University found that if maximum SNAP benefit levels increased to the average cost of a meal for low-income food-secure households, then food insecurity among households receiving SNAP benefits would decrease by 50.9% (18). Previous research suggests that increasing awareness of food insecurity has led to policy changes that improved overall health outcomes (4). We hope that these outcomes will prompt policy changes that would allocate government benefits more efficiently and reduce the levels of food insecurity in PA counties.
Methods
Participants
Our research population was rural households and urban households. All individuals who were residents of PA as reported by the Census Bureau’s American Community Survey from 2015 to 2019 (19–23) were eligible for inclusion (Table 1). Rural and urban county designations were established using the criteria of population density provided by the Center for rural PA (Table 2) (24).
Procedures
Studies focus on rural or urban food insecurity, but few evaluate both. Interactive maps and databases indicate differences in the number of individuals that experience food insecurity in rural and urban counties (14–15). However, no recent studies have examined these differences at the state and local levels. The Household Food Security annual report from the USDA ERS reports the percentage of food-insecure households within metropolitan areas as 10.4% and in nonmetropolitan areas as 11.6%, nationally (16). We desired to utilize the most recent data available to determine how food insecurity may currently affect PA counties. Once we analyzed the differences in food insecurity for urban and rural areas at the county level, we examined factors that might influence food insecurity: household size, head of household, income, and government assistance. We found that there were several disparities that significantly impacted rural counties and may be contributing factors to the disparities in food insecurity between the two county types. A study done on urban and rural counties examined how rural and urban designation affected the distribution of government benefits (17). SNAP distribution was higher in rural areas than urban areas considering data from 2001 to 2014. Also, there was twice as much food coverage from food providers and food banks in nonmetropolitan areas when compared to metropolitan areas (17). The objective of this study was to determine the results of SNAP distribution and other benefits for PA counties using recent data.
We performed a secondary data analysis using U.S. Census Bureau and USDA ERS data to understand how household food insecurity differed between urban and rural counties in PA. In the data from the census website, we calculated the total Table 1: Rural and Urban County designation as determined by the Center for Rural PA (24). Table 2: Total population and households from the years 2015–2019 for both urban and rural counties (19-23).
Rural Urban
Adams
Armstrong
Bedford
Blair
Bradford
Butler
Cambria
Cameron
Carbon
Centre
Clarion Clearfield
Clinton
Columbia
Crawford
Elk
Fayette
Forest
Franklin
Fulton
Greene
Huntingdon
Indiana
Jefferson Juniata Lawrence Lycoming McKean Mercer Mifflin Monroe Montour Northumberland Perry Pike Potter Schuylkill Snyder Somerset Sullivan Susquehanna Tioga Union Venango Warren Washington Wayne Wyoming Allegheny Beaver Berks Bucks Chester Cumberland Dauphin Delaware Erie Lackawanna Lancaster Lebanon Lehigh Luzerne Montgomery Northampton Philadelphia Westmoreland York
Years Total population Total households
Rural 2015-2019 3,398,256 1,360,119
Urban 2015-2019 9,393,274 3,649,956
amount of recipients of government assistance over averaged over 5 years (2015–2019) for each county designation, resulting in a percentage value. We created a bar graph to depict our findings for all factors. We requested data by county from Feeding America on food insecurity and costs.
Data analysis
Our goal was to measure the relationship between the incidence of food insecurity in rural counties of PA versus urban counties of PA along with factors that might influence food insecurity, such as income (poverty data), receiving government assistance, household size and head of household (male or female). Our statistical analysis included unpaired t-tests to determine a significant difference between our two factors, food insecurity in the urban counties versus rural counties. We used central tendency as our descriptive analysis to measure the mean of food insecurity in selected urban vs. rural counties between the years 2015–2019. The central tendency analysis summarizes and accurately provides a description of the data with only one value (25). The confidence interval was used to make inferences about the underlying population using different estimations and sample statistics (26). The dependent variable we are testing for is food insecurity among the counties; and the independent variables include various socioeconomic factors such as income, enrollment in government assistance programs, household size, and head of household. We used Prism to calculate the unpaired t-test from the data collected from the American Community Survey on the Census Bureau.
Results
Figure 1 shows the average population of the rural and urban counties in PA from the years 2015–2019 and a chart of an unpaired t-test analysis of rural versus urban counties. The standard deviation in urban counties is significantly higher than in rural counties and the reason for this is because urban counties have a much larger population size.
Figure 2 above depicts the average number of households in both rural and urban counties in PA from 2015 to 2019. We calculated the average of the two and found that the average number of households in rural counties was about 28,335 and the number of urban counties was 194,368 over 5 years. The second part of Figure 2 depicts the unpaired t-test analysis of the number of households in urban counties of PA versus rural counties of PA. From the t-test, we found that the difference between the two is statistically significant, confirming that rural counties have a lower average number of households than urban counties. Figure 3 represents the average number of individuals that are considered food insecure by the data obtained from Feeding America for the years 2015–2019 (27–31) after taking a 5-year average for each county. We then calculated the average of these values for both rural and urban counties. We found that rural counties had an average of 8,314 individuals experiencing food insecurity over those 5 years. We also found that urban counties had an average of 57,150 individuals experiencing food insecurity over the same 5-year span. The second part of the figure depicts the t-test we conducted for the values we calculated. From the t-test, we determined that the difference between the average of the two county types was extremely statistically significant. This suggests that there is a significantly larger amount, on average, of individuals who are food insecure in urban counties when compared to rural counties. However, we expected this result due to the large difference in the population of rural and urban counties in PA. Figure 4 depicts the average percentage of individuals in PA that are considered food insecure by the data obtained from Feeding America for the years 2015–2019 (27–31) after taking a 5-year average for each county. We then calculated the average of the values found for both rural and urban counties. We found that an average of 11.82% of rural PA experienced food insecurity from 2015 to 2019. We also found that an average of 10.76% of individuals in urban counties experienced food insecurity over the same 5-year period. Though it was only a little over a 1% difference, we found that this difference was statistically significant from the t-test that we conducted.
Figure 5 depicts the average median income for rural and urban counties and the overall average median income for the state of PA. It was calculated from the data provided that the average median income for rural, urban, and the state of PA was $53,363, $66,385, and $61,744, respectively. A t-test was performed for rural versus urban counties to determine the difference between the median household income. It was concluded that there was significance between the counties.
Figure 6 displays the gender of the head of households in both rural and urban PA from the years 2015–2019. In rural counties, 6,962 households were led by women, while 5,041 households were led by men. For the urban counties, 56,906 households were led by women, while 34,679 households had a man as the head of household. The data was determined by adding the total households that were led by men, and households led by women from both rural and urban counties and dividing by the number of counties to give us an average. From the years 2015–2019, most households were led by women in PA. Figure 7 displays the households by gender surveyed for SNAP in rural and urban PA from the years 2015–2019. In rural counties, 2,747 households led by women were surveyed for SNAP, while 1,360 households were surveyed for SNAP that had a male head of the house. For the urban counties, 24,334 households were surveyed that were led by women, while 8,829 households were surveyed that had a man as the head of household. The data was determined by adding the total surveyed households that were led by men, and surveyed households led by women from both rural and urban counties and dividing by the number of counties to give us an average. From the years 2015–2019, most households surveyed for SNAP were led by women in PA.
Figure 8 displays the households by gender receiving SNAP in rural and urban PA from the years 2015–2019. In rural counties, 1,057 households were run by women that received SNAP, while 309 households received SNAP that had a male head of the house. For the urban counties, 9,187 households were recipients of SNAP which were led by women, while 1,988 households received SNAP that had a man as the head of household. The data was determined by adding the total recipients of SNAP households that were led by men, and recipients of SNAP households run by women from both rural and urban counties and dividing by the number of counties to give us an average. From the years 2015–2019, most households that received SNAP were led by women in PA.
Urban and rural counties in Pennsylvania

Urban and rural counties in Pennsylvania
Figure 1. A) The average number of individuals in rural and urban PA. B) Unpaired t-test Analysis of Population in Urban vs. Rural Counties. Figure 2. A) The average number of households in rural and urban counties. B) Unpaired t-test Analysis of the Number of Households in Urban vs. Rural Counties.

Urban and rural counties in Pennsylvania Urban and rural counties in Pennsylvania

Figure 3. A) The average number of food insecure individuals in urban and rural PA. B) Unpaired t-test Analysis of Food Insecure Individuals in Urban vs. Rural Counties. Figure 4. A) The average percentage of food insecure individuals in urban and rural PA. B) Unpaired t-test Analysis of the Percentage of Food Insecure Individuals in Urban vs. Rural Counties.

Rural and urban PA and US

Figure 5. A) The average median household income for the state of PA, urban PA, and rural PA. B) Unpaired t-test Analysis of Median Household Income in Urban vs. Rural Counties.
Gender of head of household
Figure 6. The average number of heads of household by gender in rural and urban PA.

Gender of households surveyed

Figure 7. The average number of households surveyed for SNAP by gender of the head of household in rural and urban PA.
Gender of households receiving SNAP
Figure 8. The average number of households receiving SNAP by gender of the head of household in rural and urban PA.
Gender of households receiving SNAP
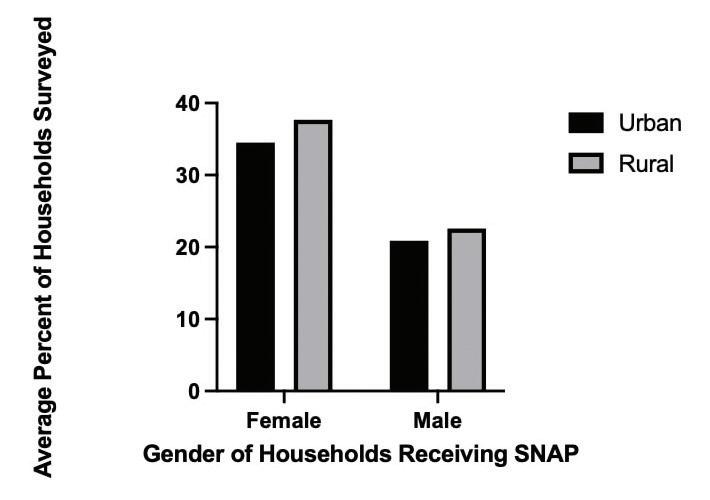
Figure 9. The average percent of male versus female heads of households receiving SNAP benefits.
Figure 9 depicts the average percentage of households receiving SNAP benefits. It was calculated utilizing the 5-year averages available from the USDA ERS from 2015–2019. We calculated the quotient of the data for households receiving SNAP benefits by the total number of households surveyed for this socioeconomic factor. We then took the average of both rural and urban counties to compare male heads of households and female heads of households. The percentages provide a comparison for male and female heads of households, as well as urban versus rural heads of households, as opposed to the average number of household recipients (Figure 8). From this data, we found that in rural counties, on average, over 15% more households with SNAP recipients have female heads of household. In urban counties, on average, 13.62% more households with SNAP recipients have a female head of household. We also found that rural counties had a larger percentage of SNAP recipients than urban counties, and a larger percentage of households with female heads of households received SNAP than households with male heads of households.
Rural and urban PA and the US
Figure 10. A) The average number of households receiving SNAP in rural and urban counties in PA. B) Unpaired t-test Analysis of the Number of Households Receiving SNAP in Urban vs. Rural Counties.
Figure 10 depicts the average number of households receiving SNAP benefits in urban counties and rural counties for the years 2015–2019. The total average of households in rural counties receiving SNAP benefits was 3,919. The average was determined by taking the sum of households receiving SNAP in the rural counties and dividing the number of counties. The total number of households in urban counties receiving SNAP benefits was 17,856. The average was determined by the number of households that received SNAP divided by the total number of urban counties. Utilizing the data from Figure 2, we have found that, on average, about 1 in 7 households in rural counties receive SNAP while about 1 in 11 urban households receive SNAP. Figure 11 depicts the number of individuals over the age of 60 years of age and under 60 years of age in urban and rural PA during the years 2015–2019. In rural counties, 1,422 households over 60 years of age received SNAP benefits and 9,305 households received SNAP benefits in urban counties. Two thousand seven hundred twenty-four households under 60
Age of households receiving SNAP
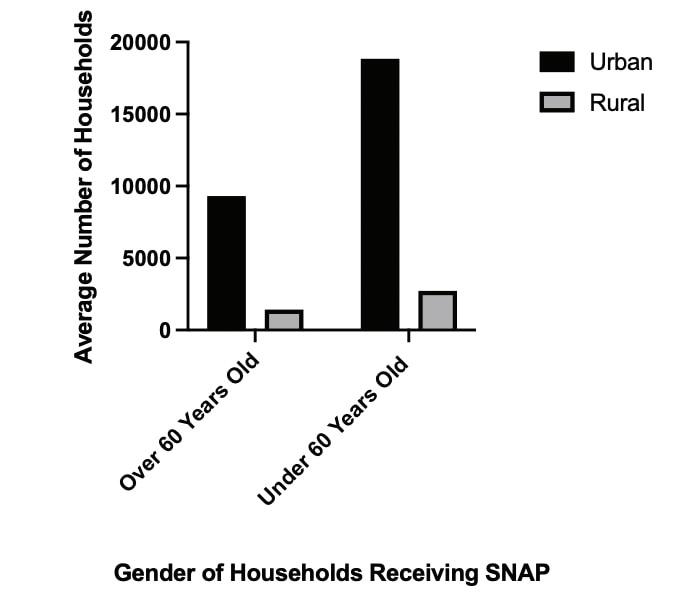
Figure 11. The average number of household recipients of SNAP over and under 60 years of age in rural and urban PA
years of age in rural and 18,841 households in urban counties received SNAP benefits. The data was established by adding the total amounts of households receiving SNAP benefits from 60 years and over and 60 years and under from each both rural and urban counties and dividing the number of counties to get the average. Utilizing the data from Figure 2, we found that, on average, about 1 in 20 rural households and about 1 in 21 urban households have recipients of SNAP over 60 years old. Also, on average, about 1 in 10 households in both rural and urban counties have recipients of SNAP under 60 years old.
Discussion
We expected that, on average, the rate of food insecurity would be greater in rural counties when compared to urban counties. We found that, on average, the rate of food insecurity in rural and urban PA was 11.82% and 10.76%, respectively. This is a significant finding that shows the stark contrast in the initial interpretation of the number versus the percentage of individuals who are food insecure in rural and urban counties and the interpretation once the influence of population size was removed. Figures 3 and 4 highlight the importance of making the data equivalent to interpret the true outcomes within these two different categories. The t-test results in Figures 1–5 and 10 indicate that there was a significant difference overall when comparing the socioeconomic factors and food insecurity between rural and urban counties such as the average numbers for households receiving SNAP, food-insecure individuals, and households in rural and urban PA. This is because rural counties have a much lower population than urban, with a population difference of 423,586 from the years 2015–2019. The results also revealed that female heads of households received more SNAP benefits in both urban and rural counties as compared to male heads of households. However, there are more female-led households than male-led households in both rural and urban PA. Thus, more female-led households would be food insecure which leads to more female-led households receiving SNAP benefits. Female households overall in the United States received more SNAP than male households, which implies women are more dependent on food stamps than men. Women are also able to get into the WIC program, which provides women that are either pregnant, breastfeeding, or up to 6 months postpartum and children up to the age of 5 that are deemed a nutrition risk resources to obtain nutritious foods (37). Women can access this program concurrently with SNAP, but men are not given access to this program for themselves, so even more women may be dependent on these resources than we examined (37–38). So perhaps having the disruption of pay due to pregnancy and care after birth may make women more likely to seek out these resources. Another thing to take into account is that, on average, females make less than males, which may make female-led households have to stretch their resources that much more, leading them to seek out financial aid for food (39). Therefore, male-led households may be less in need of these resources from the beginning. We found that the average per person household size for female heads of household in urban areas taken from a five-year estimate from 2015–2019 was 3.18 versus 3.15 for males (40). In rural counties, it was 3.08 for the females and 3.11 for the males (40). Though this figure is lower in rural counties for female heads of household, it is important to note again that most households, as well as female lead households, in PA are in urban counties. This may mean that having that extra person every few households takes a toll on a woman’s income if she is the sole provider. Addressing the potential differences in pay between these two types of leaders in the household, and the way that pay is granted during maternity leave, may be the first step in changing the demographics of who needs these governmental resources. Income has also been a major determinant of food insecurity. We found that the average income in rural counties is over $10,000 less than the average in urban counties, and almost $10,000 less than the state average. After analyzing the data in this project between rural and urban areas, it is important to recognize that SNAP alone is not sufficient to address levels of food insecurity in rural areas. SNAP restrictions on income and savings can lead to people who could really benefit from the utilization of these resources on the outside, looking in (41).
For example, a requirement from SNAP is that a household cannot have more than $2,500 in cash or a bank account (41). However, the requirements do not specify that there are different cash allowances for different household sizes (41). So, it is easy to see how a little over $2,500 for groceries can go a lot further for a single person than for a family of four. Also, if either household size had to rely solely on this amount of money, or a little bit more, for their groceries, they would be out of savings for any other possible expenses that may arise. Also, in PA, SNAP is usually only certified for 12 months and requires a 6-month report for any changes in income (42). This means that any fluctuations in pay may make someone who is not on a salary, does odd jobs, or is picking up extra shifts for a few months’ ineligible, putting them just over the threshold. SNAP does allow for some helpful deductions, like a 20% deduction from earned income, a standard deduction, deductions if there are elderly members of the household,
and a deduction if shelter costs are more than half of the household’s income after all deductions (41). Given that we found that the average median gross income for rural and urban counties was $53,363 and $66,385, respectively, the average per person household size was 2.37 and 2.47 respectively, and the standard housing expense for a family of three in 2022 was found to be $1,703 and $2,115, respectively, most of the households in both rural and urban PA, even under the median household income, would not qualify for SNAP even after the deductions (40–41, 43–44). Addressing these disparities and shortcomings will likely aid in addressing the gap in food security. Access and distance continue to be a large barrier in foodinsecure households. When analyzing the Food Access Research Atlas provided by the USDA, we see that, in 2019, tracts where a significant number or share of residents is more than 1 mile (urban) or 10 miles (rural) from the nearest supermarket and tracts in which more than 100 households have no access to a vehicle and are more than 1/2 mile from the nearest supermarket, or a significant number or share of residents are more than 20 miles from the nearest supermarket are concentrated in urban counties (45). However, when paired with low-income status, tracts with low access at 1 and 10 miles and low vehicle access are concentrated primarily in rural counties (45). This data suggests that it will likely be beneficial to implement new strategies to address food insecurity in rural and urban areas. This can potentially appear as government initiatives to increase food access and healthy food awareness in rural areas so that SNAP benefits can be used on fresher foods, or an increase in SNAP benefits or an income supplement to encourage the purchase of healthier foods in rural areas, which are notoriously more expensive than processed and nutritionally poor foods. Yet we recognize that there are different challenges for each setting that may require different methods of implementation; urban areas may require solutions such as more stores with nutrient-dense food, while rural communities may require solutions such as food pantries and food banks in closer proximity, since these are potentially hours away and may require automobiles. We aim to bring awareness to the issue of food insecurity at the state and county levels. We hope that these outcomes will prompt policy changes that would allocate government benefits more efficiently and reduce the levels of food insecurity in PA counties. Lastly, we hope this will help to find alternative ways to address food insecurity considering individual and household characteristics. Our goal is that these results will instill a sense of urgency that will influence new policies to support both rural and urban households in different capacities to decrease the food security gap among American households. We believe that this in-depth examination of food insecurity at the state level has revealed the urgency for more studies of this kind. According to Feeding America, PA is consistently among the lowest 25 states regarding food insecurity rates (27–31). The food insecurity rate in PA is also consistently below the national food insecurity rate (9). The food insecurity rates from 2015–2019 in PA were 13.1%, 12.5%, 12.0%, 10.9%, and 10.6% respectively (27–31). The food insecurity rates in the United States from 2015–2019, taken from an average of state insecurity rates (including the District of Columbia), were 13.7%, 13.0%, 12.6%, 12.2%, and 11.7% respectively (27–31). The findings from this study highlight significant disparities in PA, a state below the median. Thus, we propose that there likely will be similar findings in states consistently above the median. If we can analyze the disparities at the state level, as we have done for PA, and suggest methods for states to successfully address the findings by implementing new policies, this can be a guide for other governments to act in their own states. One way that this study can be improved is by using primary sources for the data instead of secondary data analysis. A limitation of this study is that, based on the data we analyzed, further studies would need to be completed to determine the best way to tackle food insecurity between urban and rural counties. Another limitation would be that we were not able to access the data relating to the COVID-19 pandemic given the timing of updates for the databases that we used. Comparing our data from the years 2015–2019 to the years 2020–2021 could give us insight into the impact of the COVID-19 pandemic. These would be areas to further explore in future studies.
References
1. Kimani ME, Sarr M, Cuffee Y, Liu C, Webster NS.
Associations of race/ethnicity and food insecurity with covid-19 infection rates across US counties. JAMA network open. American Medical Association; 2021. Available from: https://www.ncbi.nlm.nih.gov/pmc/articles/PMC8188266/
2. Leddy AM, Weiser SD, Palar K, Seligman H. A conceptual model for understanding the rapid covid-19-related increase in food insecurity and its impact on health and
Healthcare. The American Journal of Clinical Nutrition. Oxford University Press; 2020. Available from: https:// www.ncbi.nlm.nih.gov/pmc/articles/PMC7454255/ 3. Christine M. Olson Ph.D., RD, Kendra Anderson BS, RD,
Elizabeth Kiss, Ph.D., Frances C. Lawrence, Ph.D. Sharon
B. Seiling. Factors protecting against and contributing to food insecurity among Rural families. Family Economics and Nutrition Review. 2004 Winter. Available from: Gale Academic OneFile, link.gale.com/apps/doc/A122458829/ AONE?u=nysl_oweb&sid=googleScholar&xid=c8889daa
4. Gundersen C, A C-J, Ziliak JP, C G, SL C, HA E-M, et al.
Food insecurity and Health Outcomes: Health Affairs
Journal. Health Affairs. 2015. Available from: https://www. healthaffairs.org/doi/10.1377/hlthaff.2015.0645 5. Price JH, Khubchandani J, McKinney M, Braun R. Racial/ ethnic disparities in chronic diseases of youths and access to healthcare in the United States. BioMed research international. Hindawi Publishing Corporation; 2013.
Available from: https://www.ncbi.nlm.nih.gov/pmc/articles/
PMC3794652/ 6. DeWitt E, Gillespie R, Norman-Burgdolf H, Cardarelli KM,
Slone S, Gustafson A. Rural SNAP participants and food insecurity: How can communities leverage resources to meet the growing food insecurity status of Rural and lowincome residents?. Int J Environ Res Public Health. MDPI; 2020. Available from: https://www.ncbi.nlm.nih.gov/pmc/ articles/PMC7504289/
7. Steimle S, Gassman-Pines A, Johnson AD, Hines CT,
Ryan RM. Understanding patterns of food insecurity and family well-being amid the Covid-19 pandemic using Daily
Surveys. Society for Research in Child Development. John Wiley & Sons, Ltd; 2021. Available from: https://srcd. onlinelibrary.wiley.com/doi/10.1111/cdev.13659 8. Jung NM, Bairros FSde, Pattussi MP, Pauli S, Neutzling MB.
Gender differences in the prevalence of household food insecurity: A systematic review and meta-analysis: Public health nutrition. Cambridge Core. Cambridge University Press; 2016. Available from: https://www.cambridge.org/co re/journals/public-health-nutrition/article/gender-differen ces-in-the-prevalence-of-household-food-insecurity-a-sys tematic-review-and-metaanalysis/B3B0DE2E04C0413E4 8267E63B400EC36
9. Map the meal gap data: Food Insecurity in PA. Feeding
America. Available from: https://www.feedingamerica.org/ research/map-the-meal-gap/by-county 10. Milano M. Urban, subUrban and Rural areas-which area suffers the most?. Food Insecurity Solutions for
America. Serving Food Solutions. Available from: http:// servingfoodsolutions.com/the-problem/location/UrbansubUrban-and-Rural/ 11. Hunger in Rural communities. Feeding America. Available from: https://www.feedingamerica.org/hunger-in-america/
Rural-hunger-facts 12. Pazzaglia G, Christaldi J. An exploration of the influences contributing to food insecurity in Chester County, PA -
Joanne Christaldi, Gina Pazzaglia, 2020. SAGE Journals. 2018. Available from: https://journals.sagepub.com/doi/full /10.1177/1524839918801588?casa _ token= _ 3xcQPjKXb kAAAAA%3A8OI4yauAZNTmUSBbP2YPoh996GK0Br3C m _ nYQr7L638yjc0VfmOb _ rnWpsZIFTAPXKzrD9W0fj-6
13. Coleman-Jensen A, Singh A, Gregory CA, Rabbitt MP.
Household food security in the United States in 2015.
USDA ERS. 2016. Available from: https://www.ers.usda.gov /publications/pub-details/?pubid=79760
14. Food Insecurity in PA. County Health Rankings &
Roadmaps. Available from: https://www.countyhealthrank ings.org/app/PA/2021/measure/factors/139/data?sort=s c-0 15. Piontak JR, Schulman MD. Food Insecurity in Rural
America. SAGE Journals. 2014. Available from: https://journ als.sagepub.com/doi/full/10.1177/1536504214545766 16. Alisha C-J, Rabbitt MP, Gregory CA, Singh A. Household
Food Security in the United States in 2020. U.S.
Department of Agriculture Economic Research Service. 2021. Available from: https://www.ers.usda.gov/webdocs/p ublications/102076/err-298.pdf
17. Gundersen C, Dewey A, Hake M, Engelhard E, Crumbaugh
AS. Food insecurity across the Rural-Urban divide:
Are counties in need being reached by charitable food assistance?. SAGE Journals. 2017. Available from: https://journals.sagepub.com/doi/full/10.1177/00027162 17710172?casa _ token=GSyJYgctUQIAAAAA%3AHHspKt 5rNp6AXumlUByiNuqzUkFiaSZBH7AsQVSf7qORoFBUq TXmy_ HbcjjR3iLnXYIUI-mXJqn06Q 18. Gundersen C, Waxman E, Crumbaugh AS. An examination of the adequacy of Supplemental Nutrition Assistance Program (SNAP) benefit levels: Impacts on food insecurity:
Agricultural and Resource Economics Review. Cambridge Core. Cambridge University Press; 2019. Available from: h ttps://www.cambridge.org/core/journals/agricultural-and-r esource-economics-review/article/an-examination-of-the-a dequacy-of-supplemental-nutrition-assistance-program-sn ap-bene fi t-levels-impacts-on-food-insecurity/59160A1F2 A28CFA2DB686516C144B388
19. Public Assistance Income Or Food Stamps/Snap In The
Past 12 Months For Households. Explore census data. American Community Survey; 2015. Available from: https://data.census.gov/cedsci/table?q=food+insecurity+in +Philadelphia+city%2C+PA&g=0400000US42%2C42%2 40500000 _ 0500000US42027&y=2015&d=ACS+1-Year+ Estimates+Detailed+Tables&tid=ACSDT1Y2015.B19058
20. Public Assistance Income Or Food Stamps/Snap In The
Past 12 Months For Households. Explore census data. American Community Survey; 2016. Available from: https://data.census.gov/cedsci/table?q=food+insecurity+in +Philadelphia+city%2C+PA&g=0400000US42%2C4 2%240500000 _ 0500000US42027&y=2016&d =ACS+1-Year+Estimates+Detailed+Tables&tid=ACS DT1Y2016.B19058
21. Public Assistance Income Or Food Stamps/Snap In The
Past 12 Months For Households. Explore census data. American Community Survey; 2017. Available from: https://data.census.gov/cedsci/table?q=food+insecurity+in +Philadelphia+city%2C+PA&g=0400000US42%2C42%2 40500000 _ 0500000US42027&y=2017&d=ACS+1-Year+ Estimates+Detailed+Tables&tid=ACSDT1Y2017.B09010
22. Public Assistance Income Or Food Stamps/Snap In The
Past 12 Months For Households. Explore census data. American Community Survey; 2018. Available from: https://data.census.gov/cedsci/table?q=food%20insecurity %20in%20Philadelphia%20city,%20PA&g=0400000US42, 42%240500000 _ 0500000US42027&y=2018&d=ACS%2 01-Year%20Estimates%20Detailed%20Tables&tid=ACSD T1Y2018.B19058
23. Public Assistance Income Or Food Stamps/Snap In The
Past 12 Months For Households. Explore census data. American Community Survey; 2019. Available from: https://data.census.gov/cedsci/table?q=food+insecurity+in +Philadelphia+city%2C+PA&g=0400000US42%2C4 2%240500000 _ 0500000US42027&y=2019&d =ACS+1-Year+Estimates+Detailed+Tables&tid=ACS DT1Y2019.B19058
24. Rural Urban definitions. Rural Urban Definitions - Center for Rural PA. Available from: https://www.Rural.pa.gov/data /Rural-Urban-de fi nitions
25. Manikandan S. Measures of central tendency: The mean. Journal of Pharmacology & pharmacotherapeutics. Medknow Publications Pvt Ltd; 2011. Available from: https://www.ncbi.nlm.nih.gov/pmc/articles/PMC3127352/ 26. Hazra A. Using the confidence interval confidently. Journal of Thoracic Disease. AME Publishing Company; 2017.
Available from: https://www.ncbi.nlm.nih.gov/pmc/articles/ PMC5723800/
27. Gundersen, C., A. Dewey, A. Crumbaugh, M. Kato & E.
Engelhard. Map the Meal Gap 2017: A Report on County and Congressional District Food Insecurity and County
Food Cost in the United States in 2015. Feeding America, 2017. 28. Gundersen, C., A. Dewey, A. Crumbaugh, M. Kato & E.
Engelhard. Map the Meal Gap 2017: A Report on County and Congressional District Food Insecurity and County Food Cost in the United States in 2016. Feeding America, 2018.
29. Gundersen, C., A. Dewey, E. Engelhard, M. Strayer & L.
Lapinski. Map the Meal Gap 2020: A Report on County and
Congressional District Food Insecurity and County Food Cost in the United States in 2018. Feeding America, 2020.
30. Gundersen, C., A. Dewey, M. Kato, A. Crumbaugh & M.
Strayer. Map the Meal Gap 2019: A Report on County and
Congressional District Food Insecurity and County Food
Cost in the United States in 2017. Feeding America, 2019. 31. Gundersen, C., Strayer, M., Dewey, A., Hake, M., & Engelhard, E. (2021). Map the Meal Gap 2021: An Analysis of County and Congressional District Food Insecurity and
County Food Cost in the United States in 2019. Feeding
America. 32. Bureau USC. American Community survey 5-year data (2009-2019). Census.gov. 2021. Available from: https://ww w.census.gov/data/developers/data-sets/acs-5year.html 33. Coleman-Jensen A, Rabbitt MP, Gregory CA, Singh A.
Household food security in the United States in 2020.
USDA. Available from: https://www.ers.usda.gov/webdocs/ publications/102076/err-298 _ summary.pdf?v=8456.8
34. Go to the atlas. USDA ERS - Go to the Atlas. Available from: https://www.ers.usda.gov/data-products/foodenvironment-atlas/go-to-the-atlas/ 35. Key Statistics & Graphics. USDA ERS - Key Statistics &
Graphics. 2021. Available from: https://www.ers.usda.gov/t opics/food-nutrition-assistance/food-security-in-the-us/ke y-statistics-graphics/ 36. T test calculator. GraphPad. GraphPad Software. Available from: https://www.graphpad.com/quickcalcs/ttest1/ 37. WIC eligibility requirements. Food and Nutrition Service
U.S. Department of Agriculture. 2022. Available from: https://www.fns.usda.gov/wic/wic-eligibility-requirements 38. Learn the Difference Between SNAP and WIC Programs. 2021. Available from: https://www.benefits.gov/news/ article/439 39. Bureau USC. Women consistently earn less than men.
Census.gov. 2022. Available from: https://www.census.gov/ library/stories/2022/01/gender-pay-gap-widens-as-wome n-age.html#:~:text=According%20to%20the%20QWI%20 data%20based%20on%20unemployment,men%20and%2 0that%20pay%20gap%20increased%20with%20age. 40. Bureau USC. United States Census Bureau - American
Community Survey. S1101: HOUSEHOLDS AND
FAMILIES - 2019: ACS 5-Year Estimates Subject Tables. Available from: https://data.census.gov/cedsci/table?q=hou sehold+size&g=0100000US _ 0400000US42%2C42%240 500000&tid=ACSST5Y2019.S1101&moe=false 41. Snap eligibility. Food and Nutrition Service U.S.
Department of Agriculture. 2021. Available from: https:// www.fns.usda.gov/snap/recipient/eligibility 42. Wolf T. 2020.6.23 TWW USDA SNAP Notice. Department of Human Services. 2020. Available from: https://www.dhs .pa.gov/about/Documents/DHS%20Executive%20Comm unications/2020.6.23%20TWW%20USDA%20SNAP%20 Notice.pdf#:~:text=SNAP%20households%20are%20cer ti fi ed%20for%20a%20set%20period,impacts%20eligibilit y%2C%20the%20SNAP%20bene fi ts%20are%20still%20 adjusted. 43. PA - Local Standards: Housing and Utilities. Internal
Revenue Service. 2022. Available from: https://www.irs. gov/businesses/small-businesses-self-employed/PA-localstandards-housing-and-utilities 44. Cost of living adjustment (cola) information. Food and
Nutrition Service U.S. Department of Agriculture. 2022.
Available from: https://www.fns.usda.gov/snap/allotment/
COLA 45. Food Access Research Atlas. USDA ERS - Food Access
Research Atlas. Available from: https://www.ers.usda.gov/ data-products/food-access-research-atlas


