How public spaces make the affordable, joyful city possible
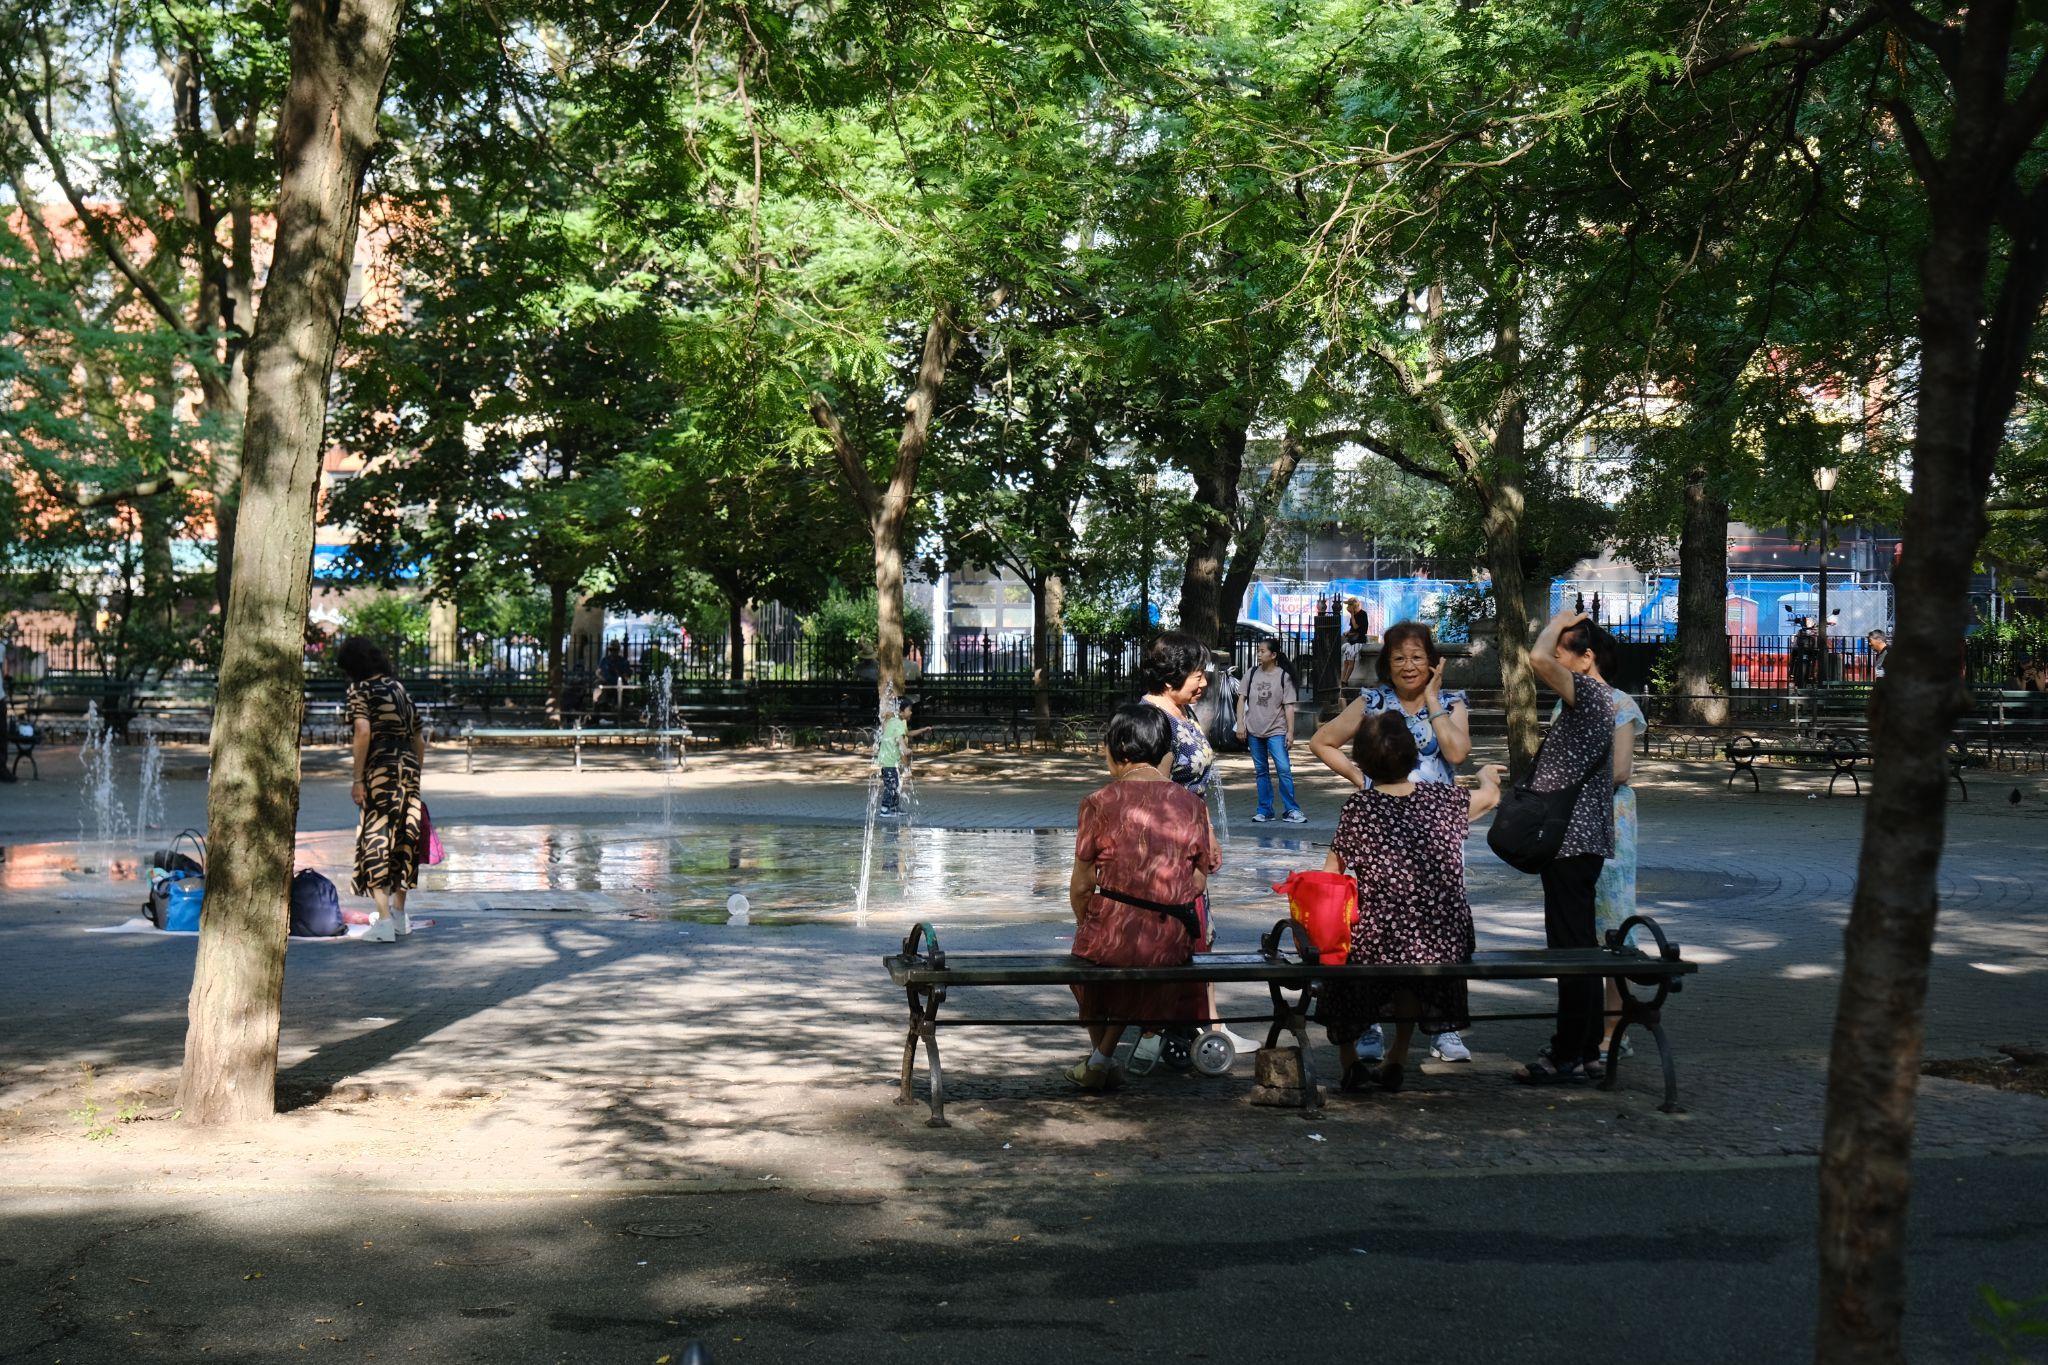
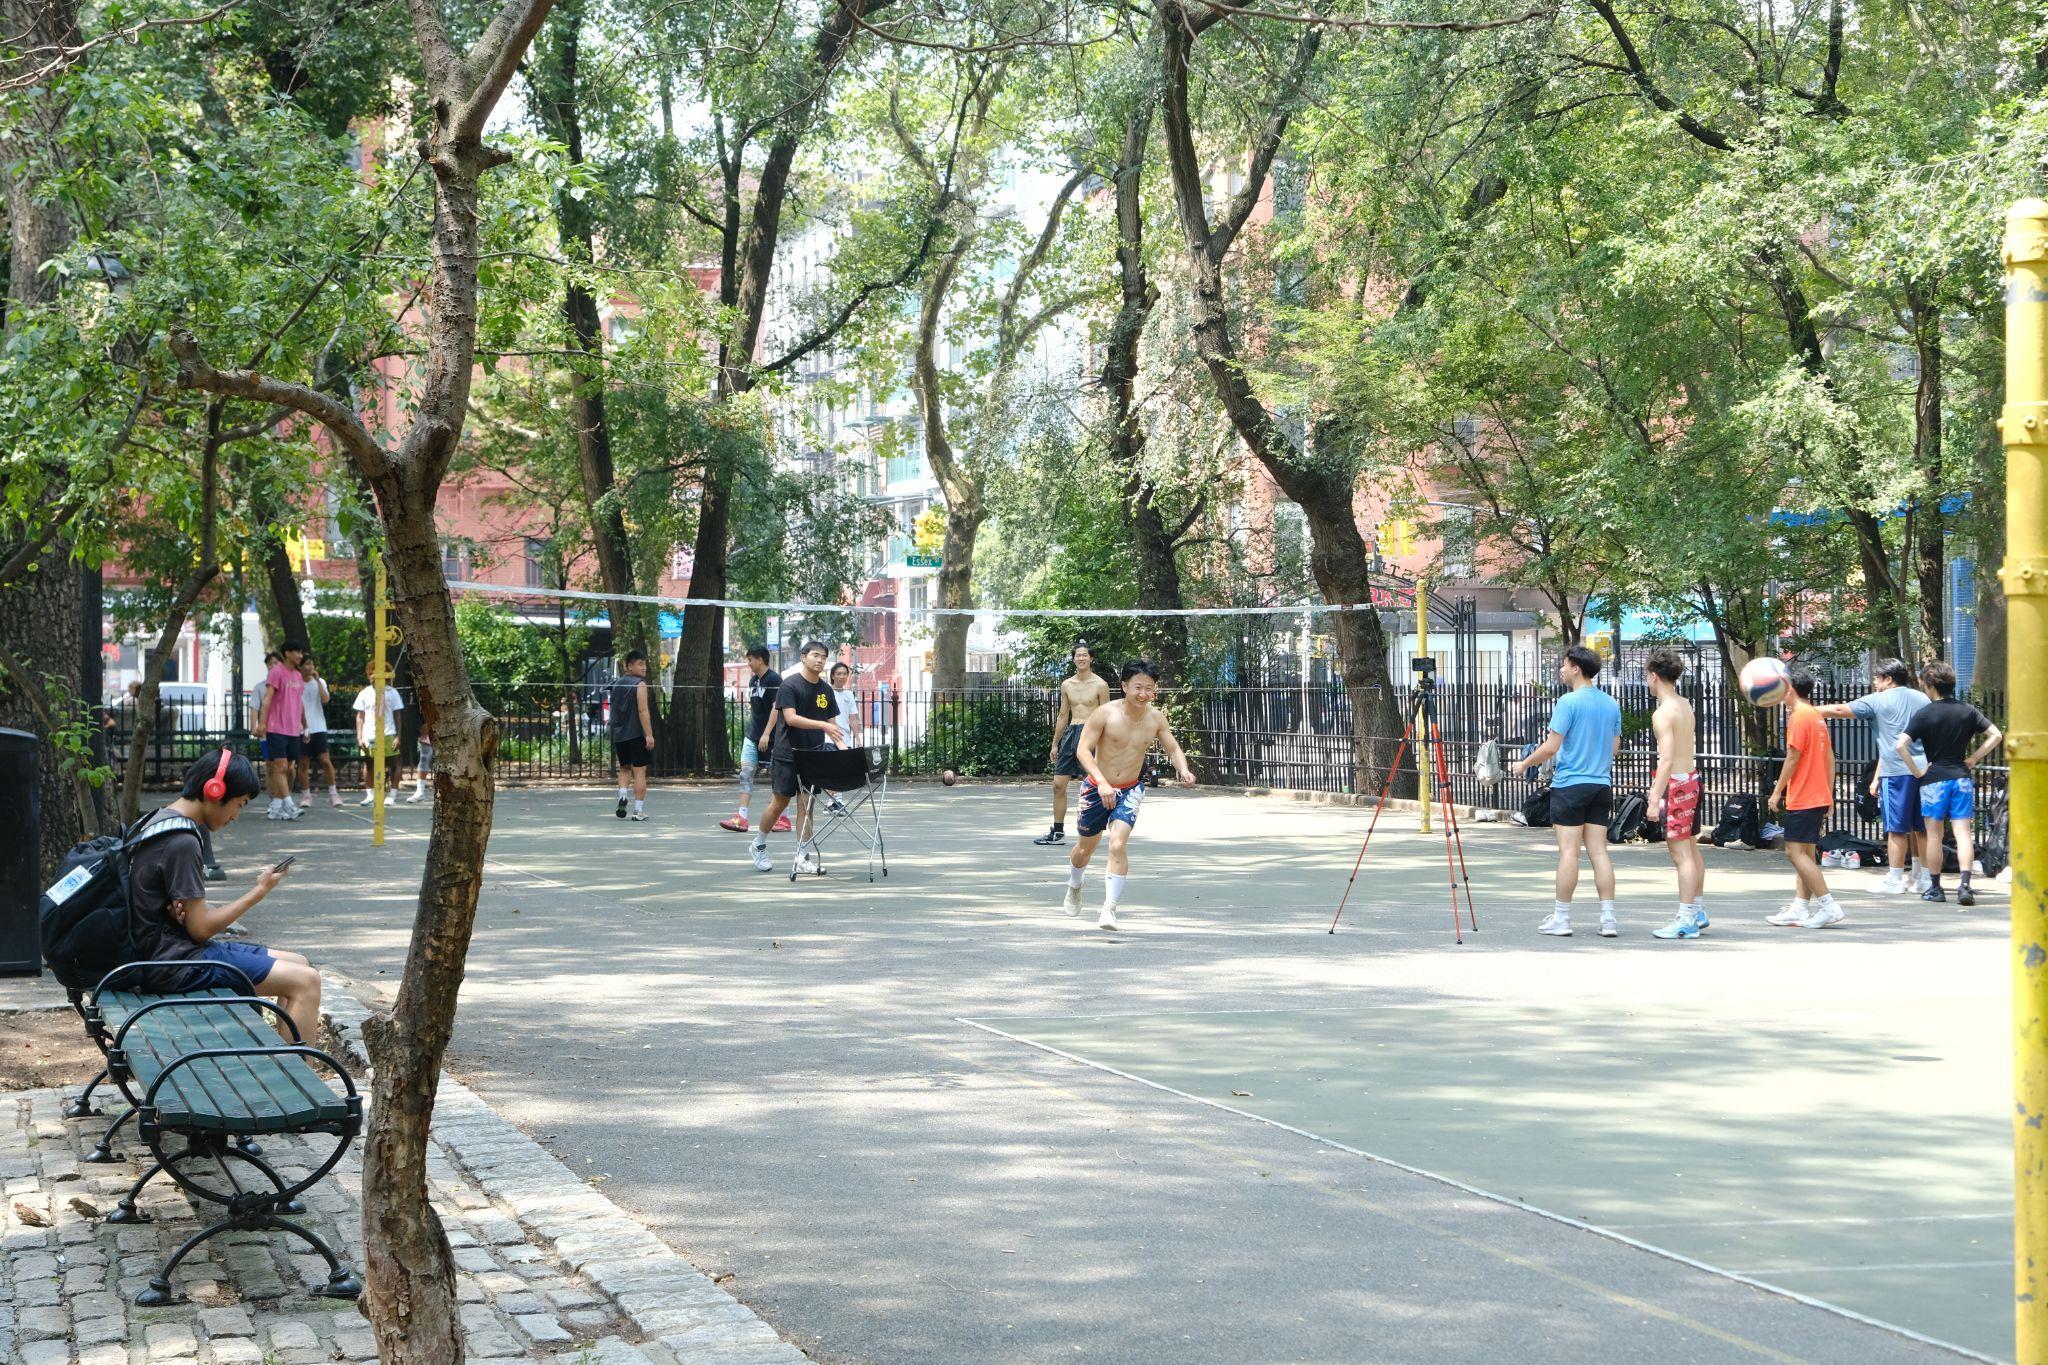
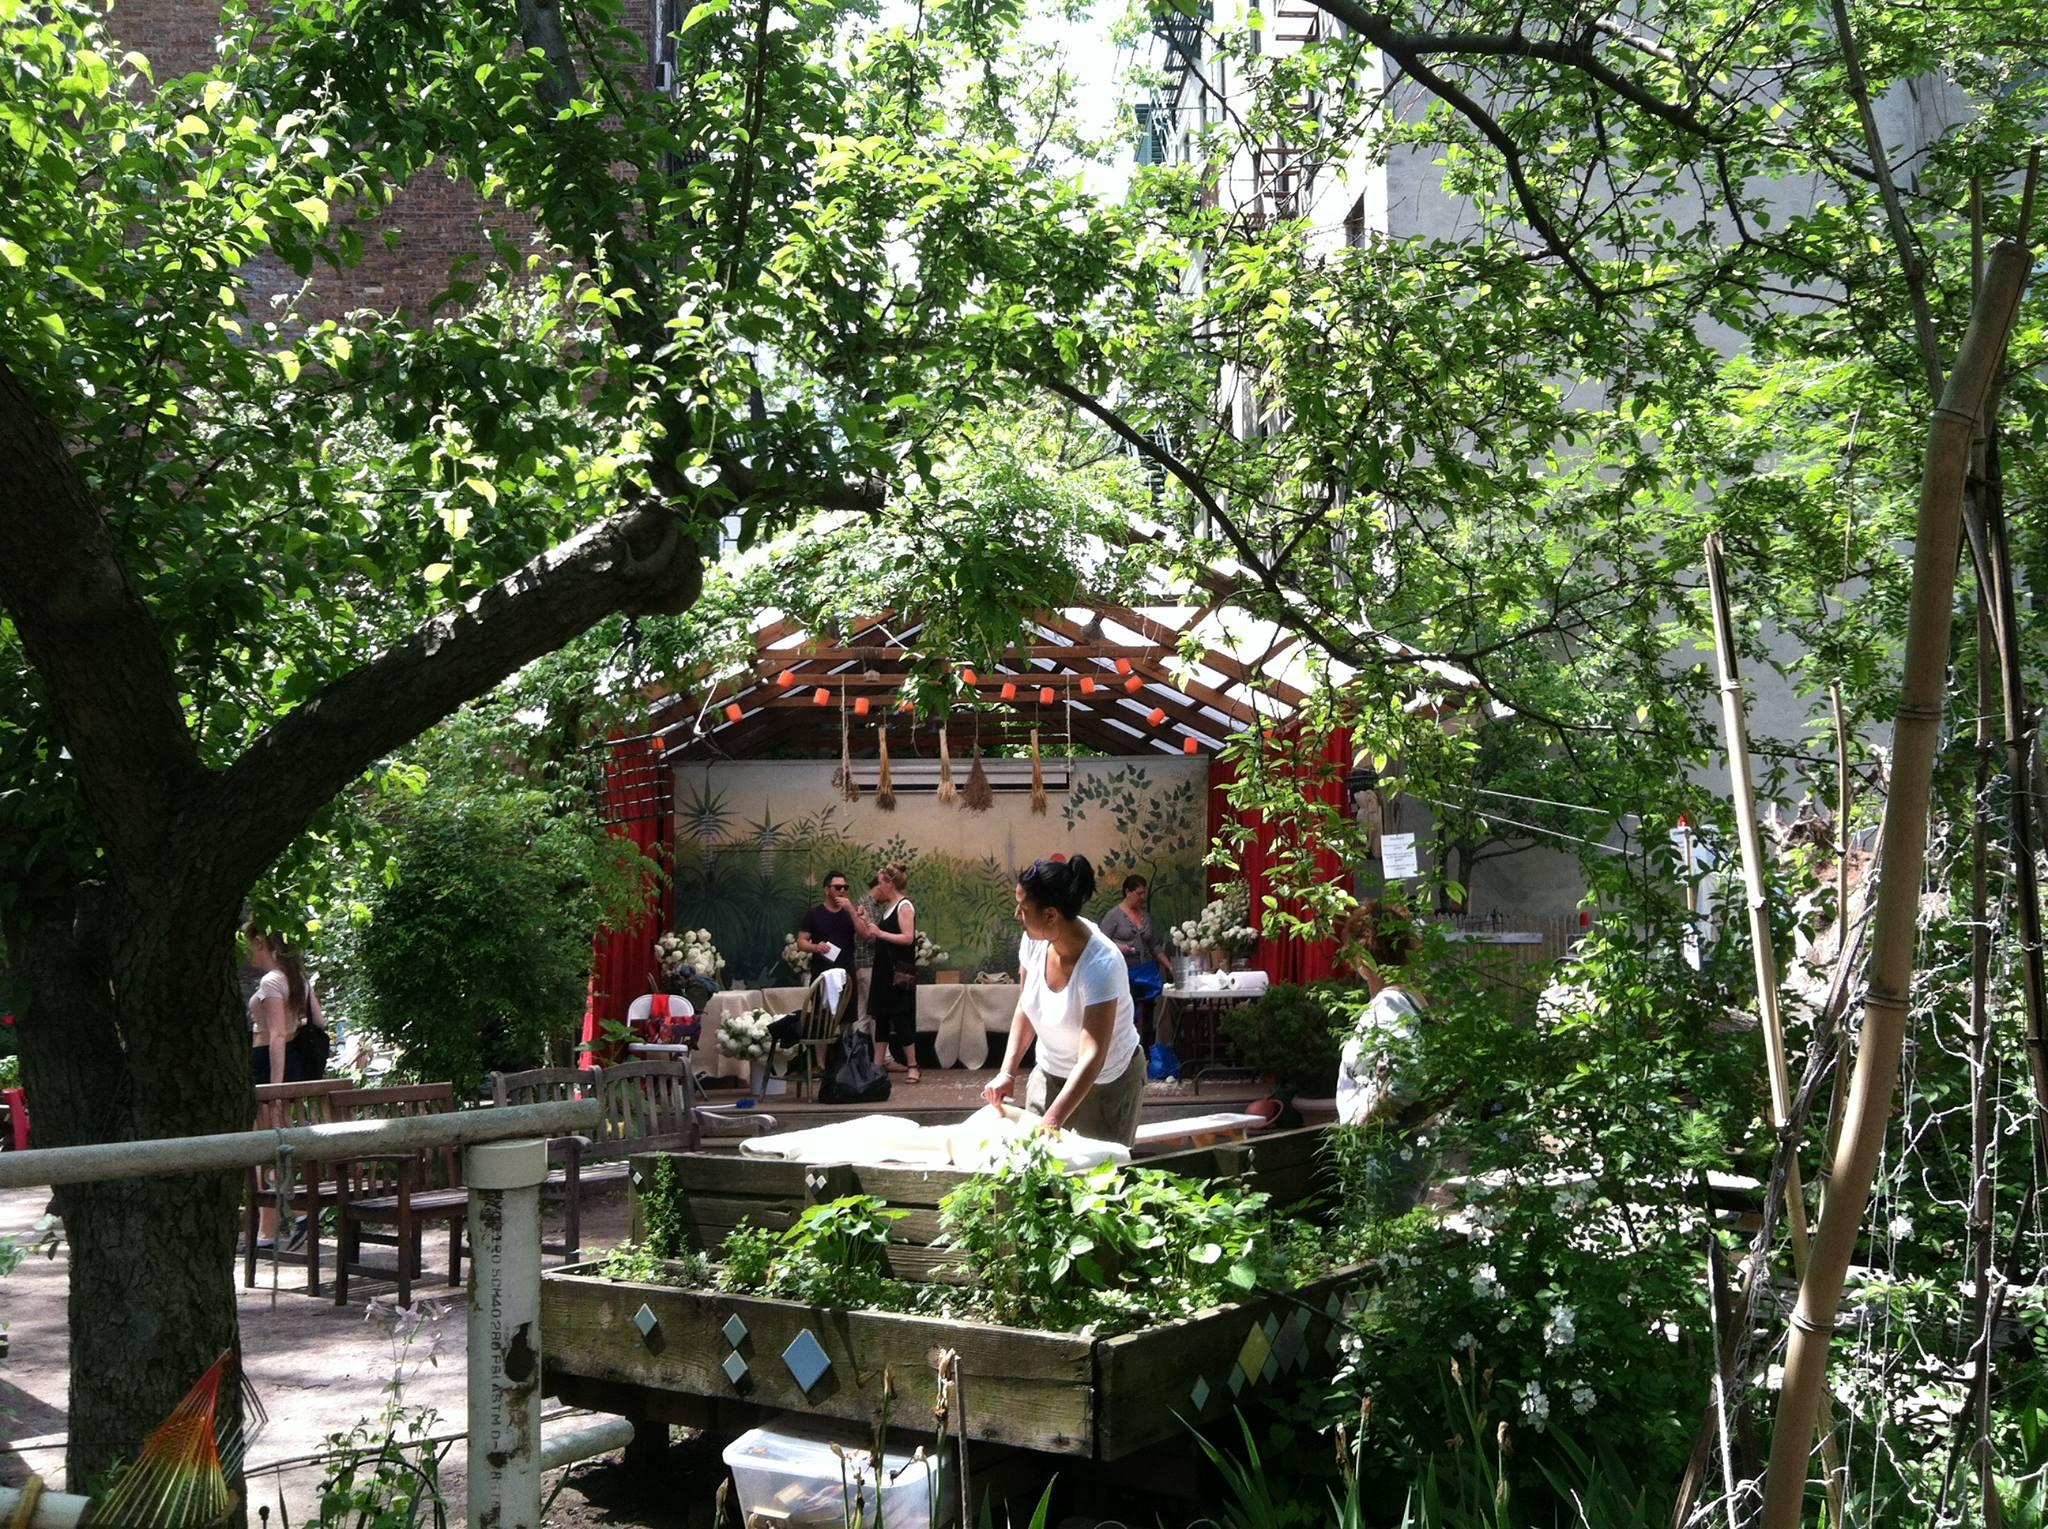
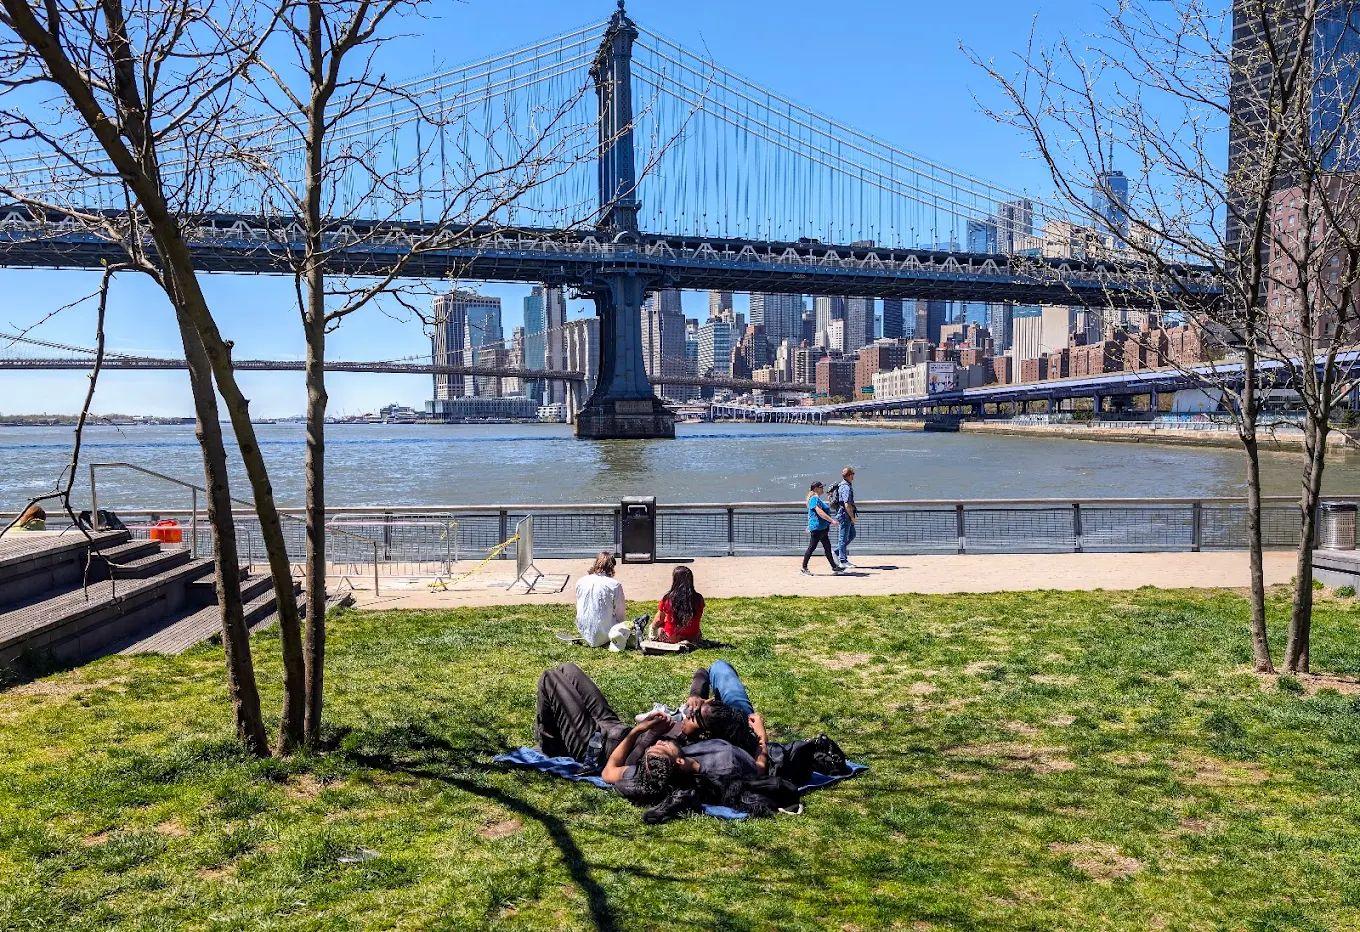
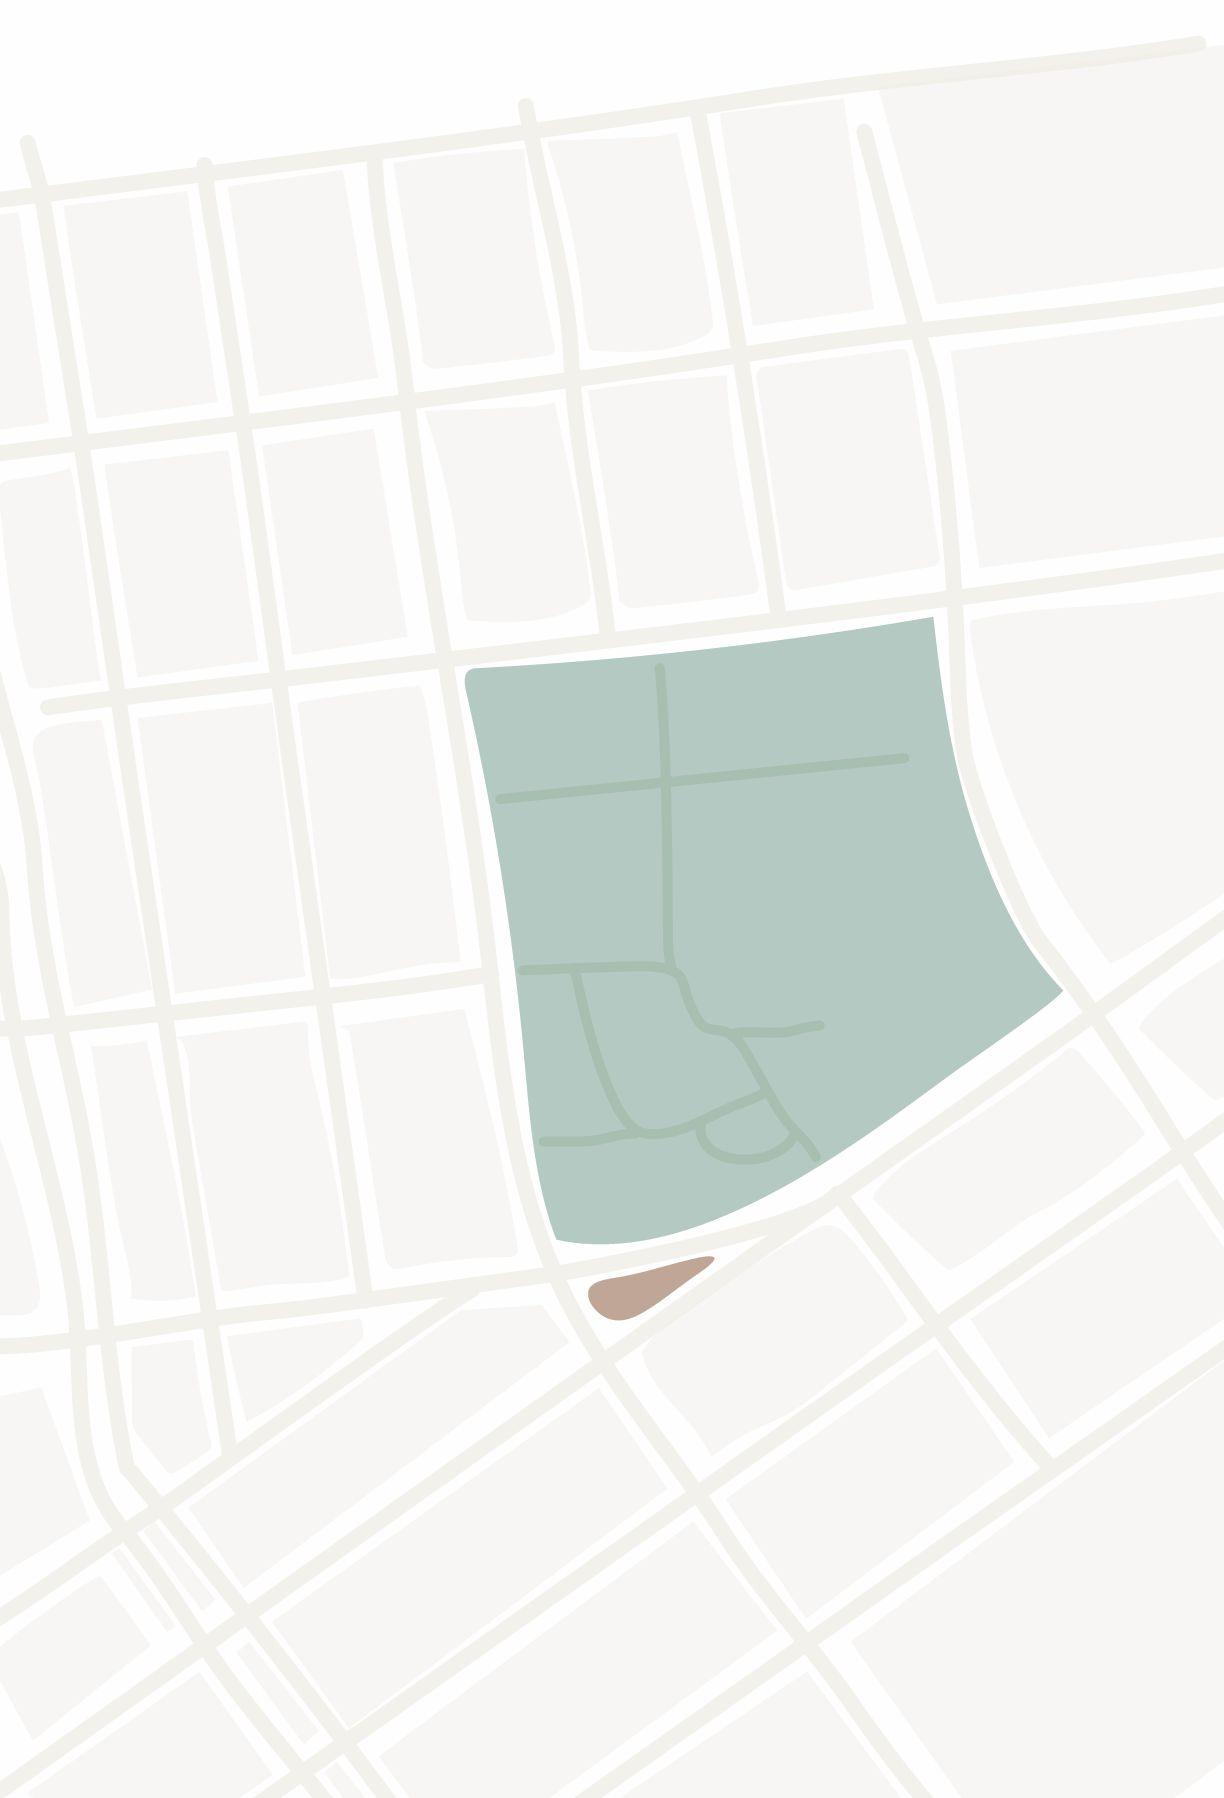
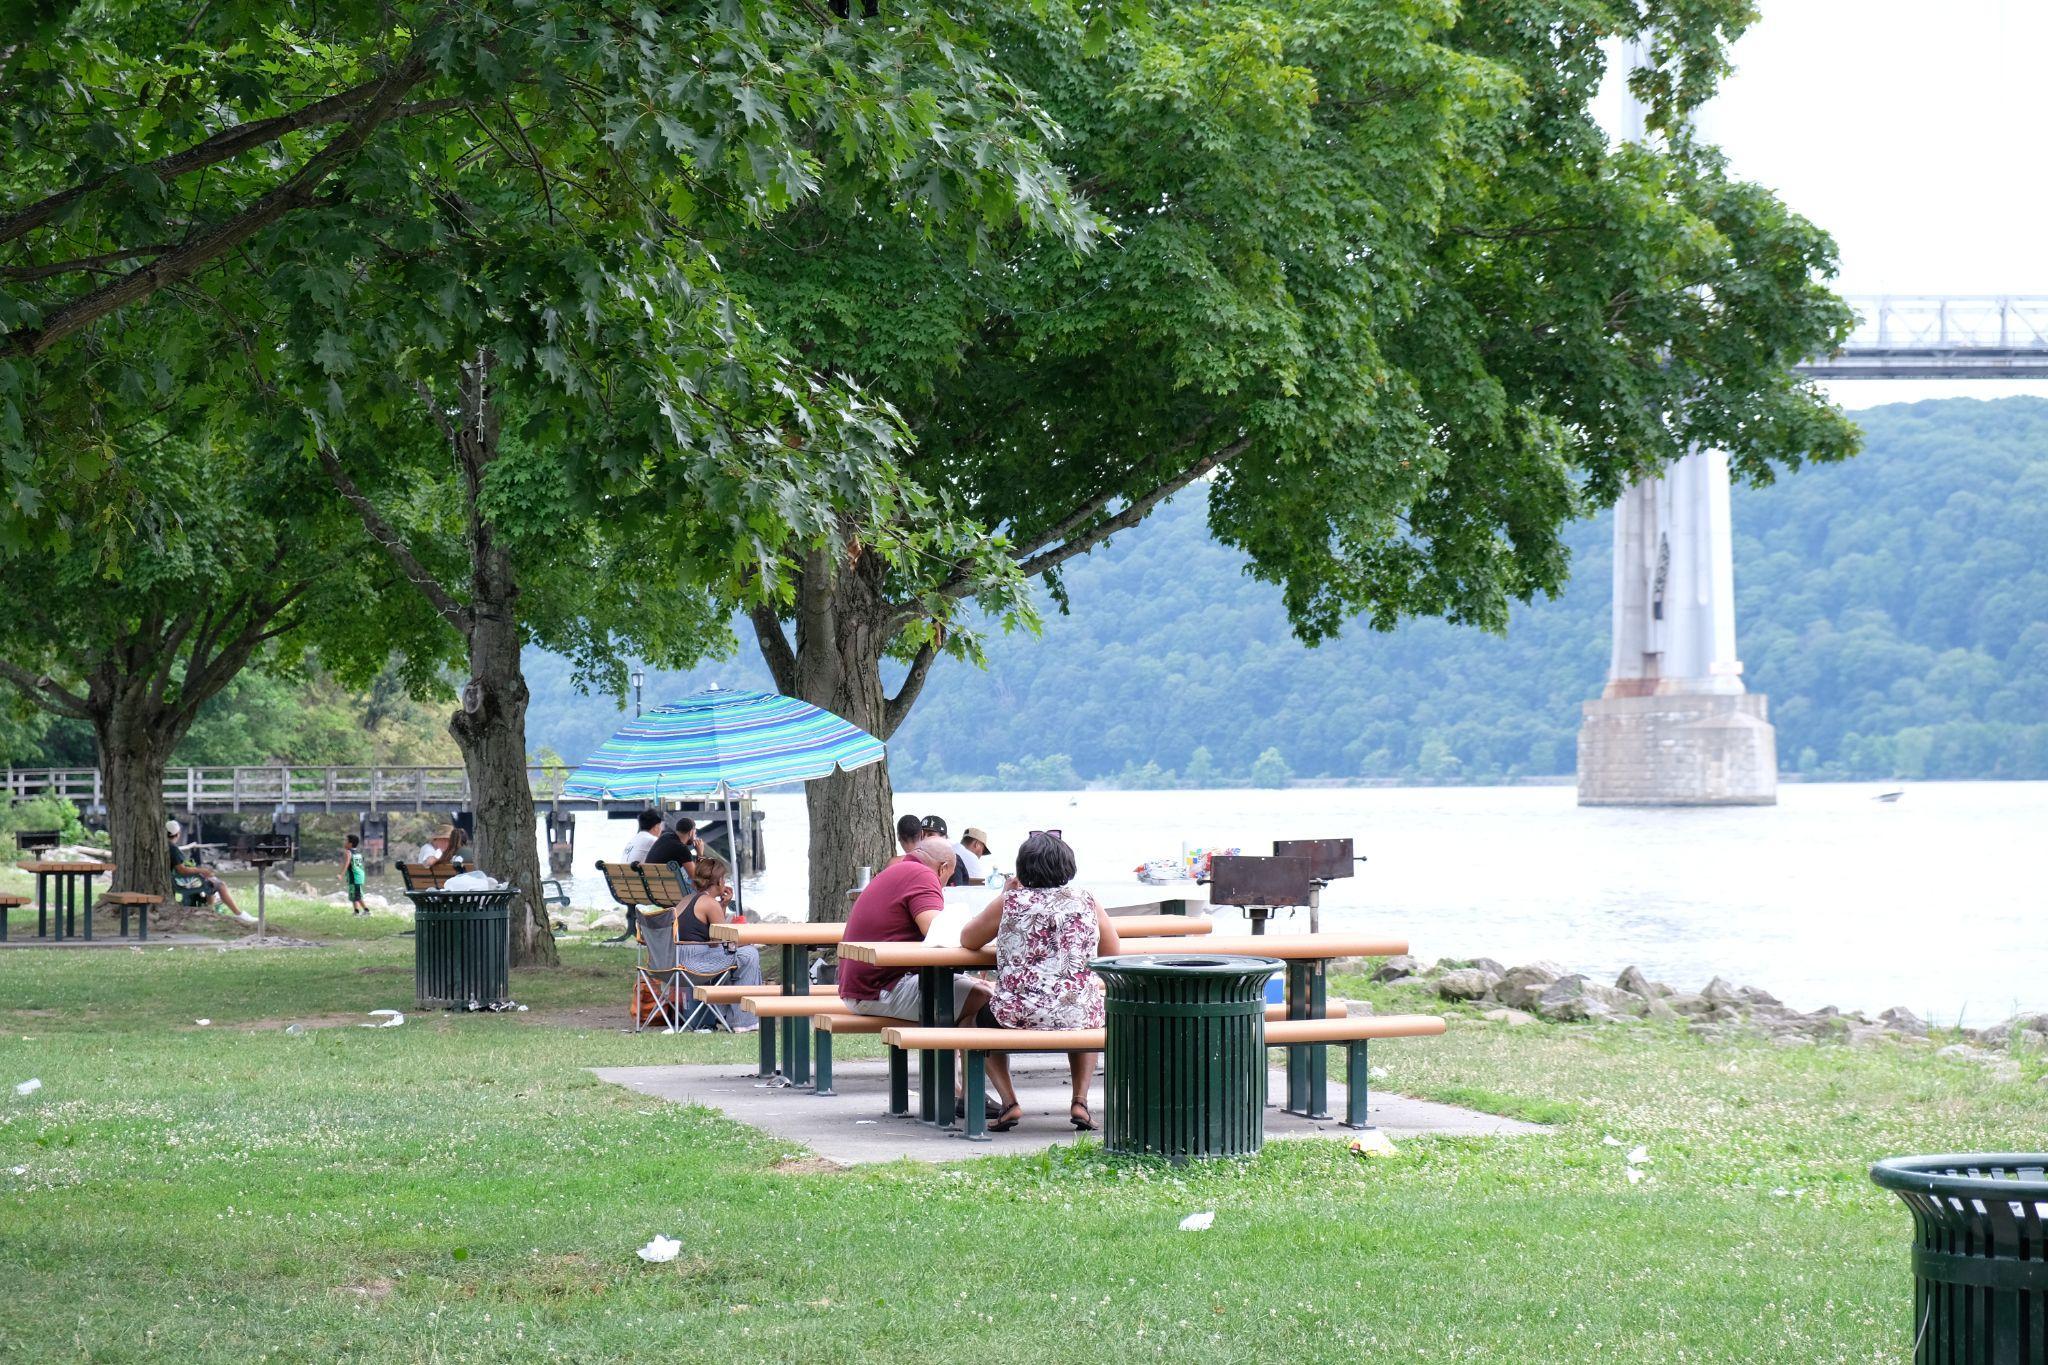
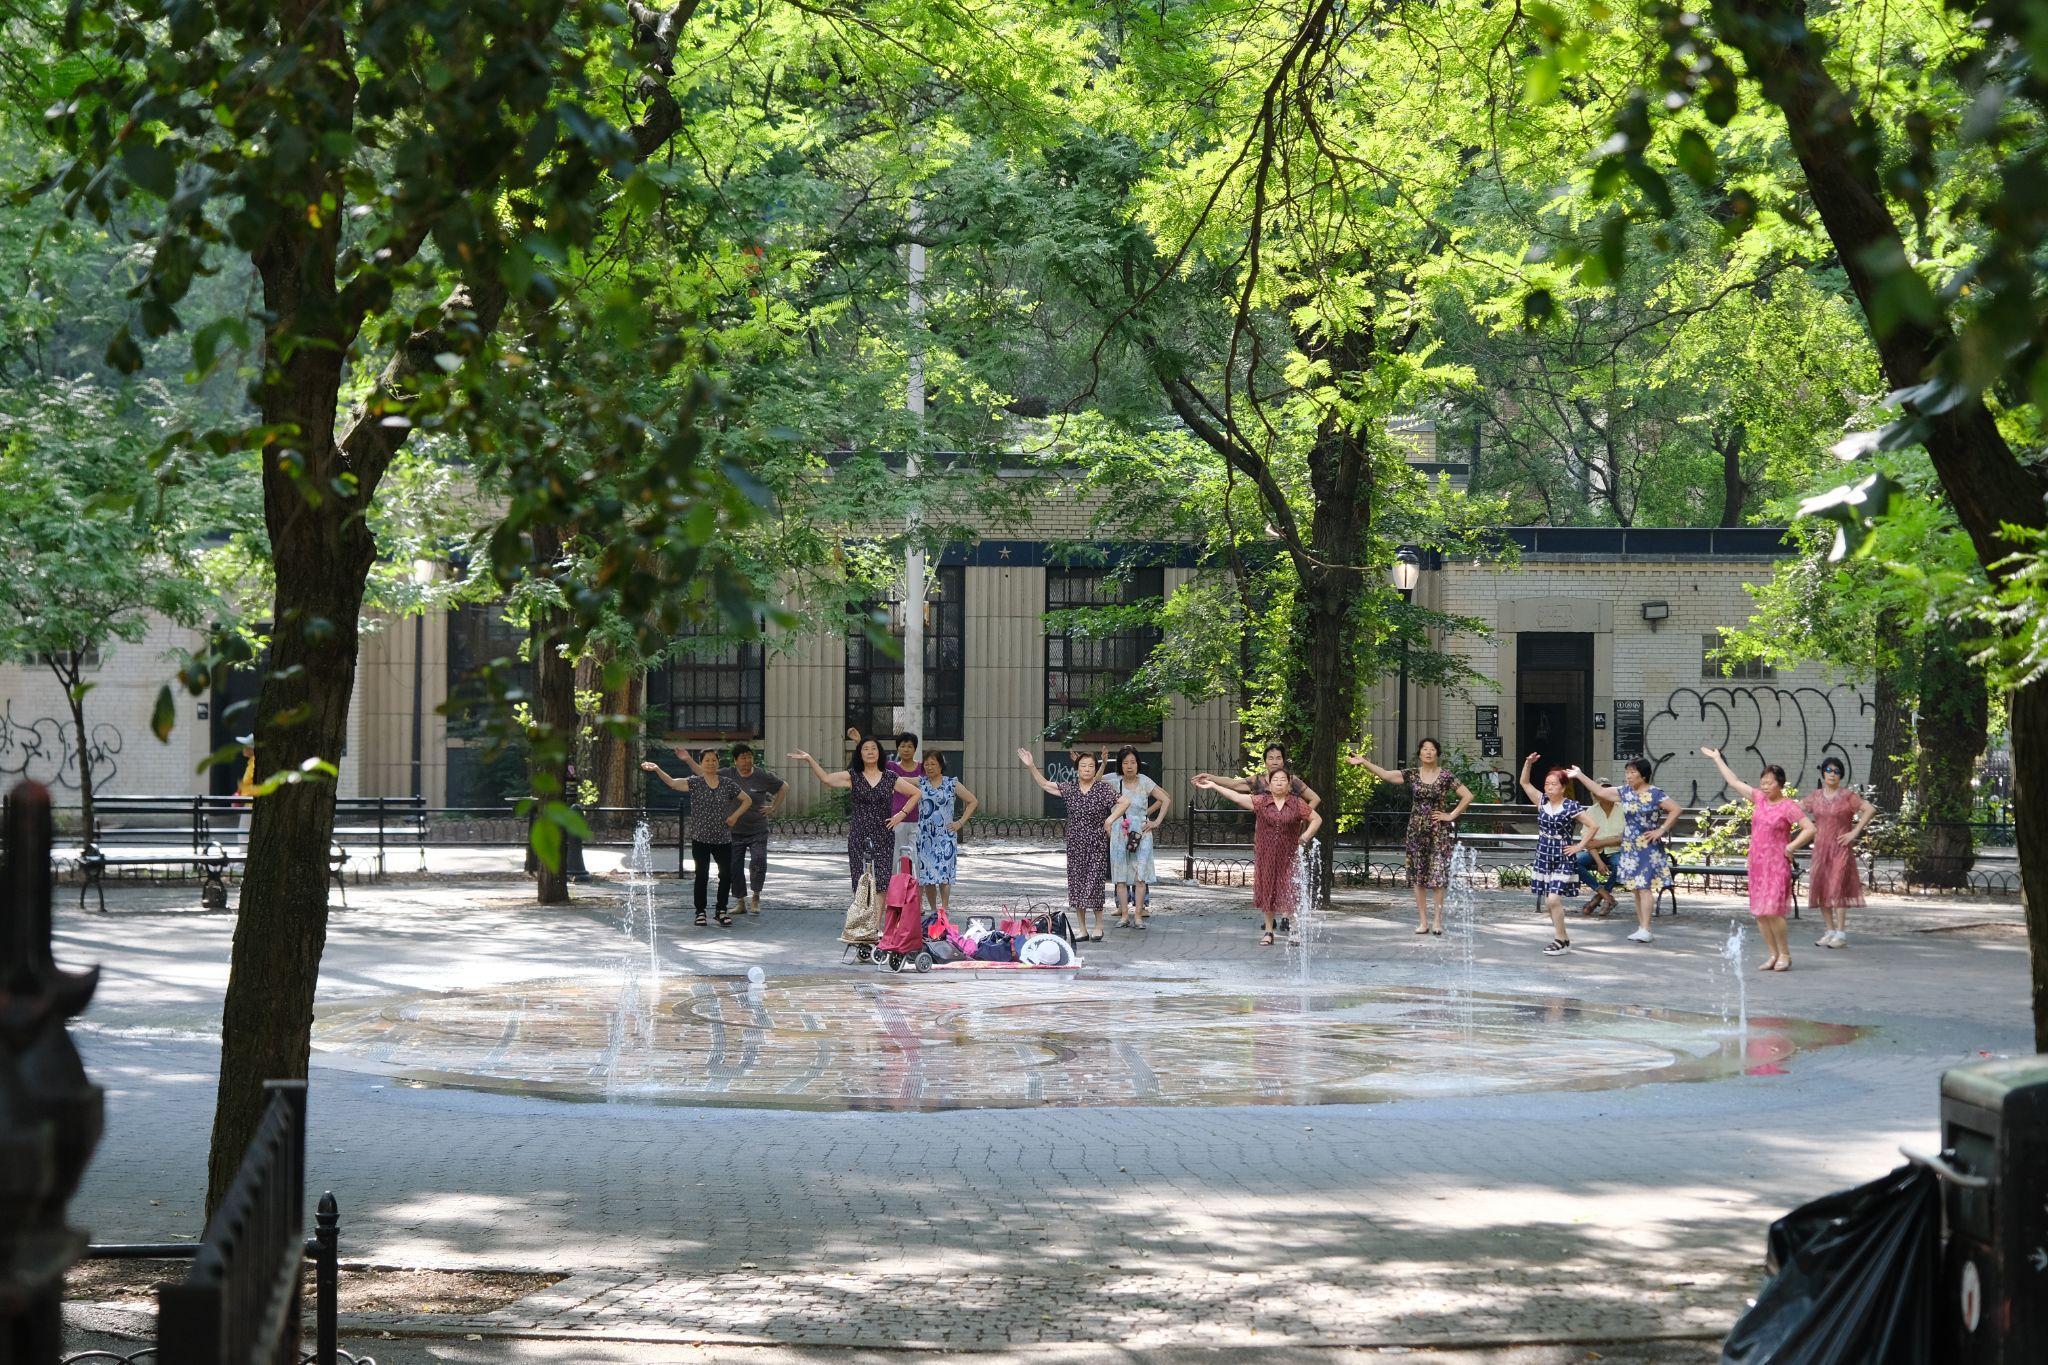
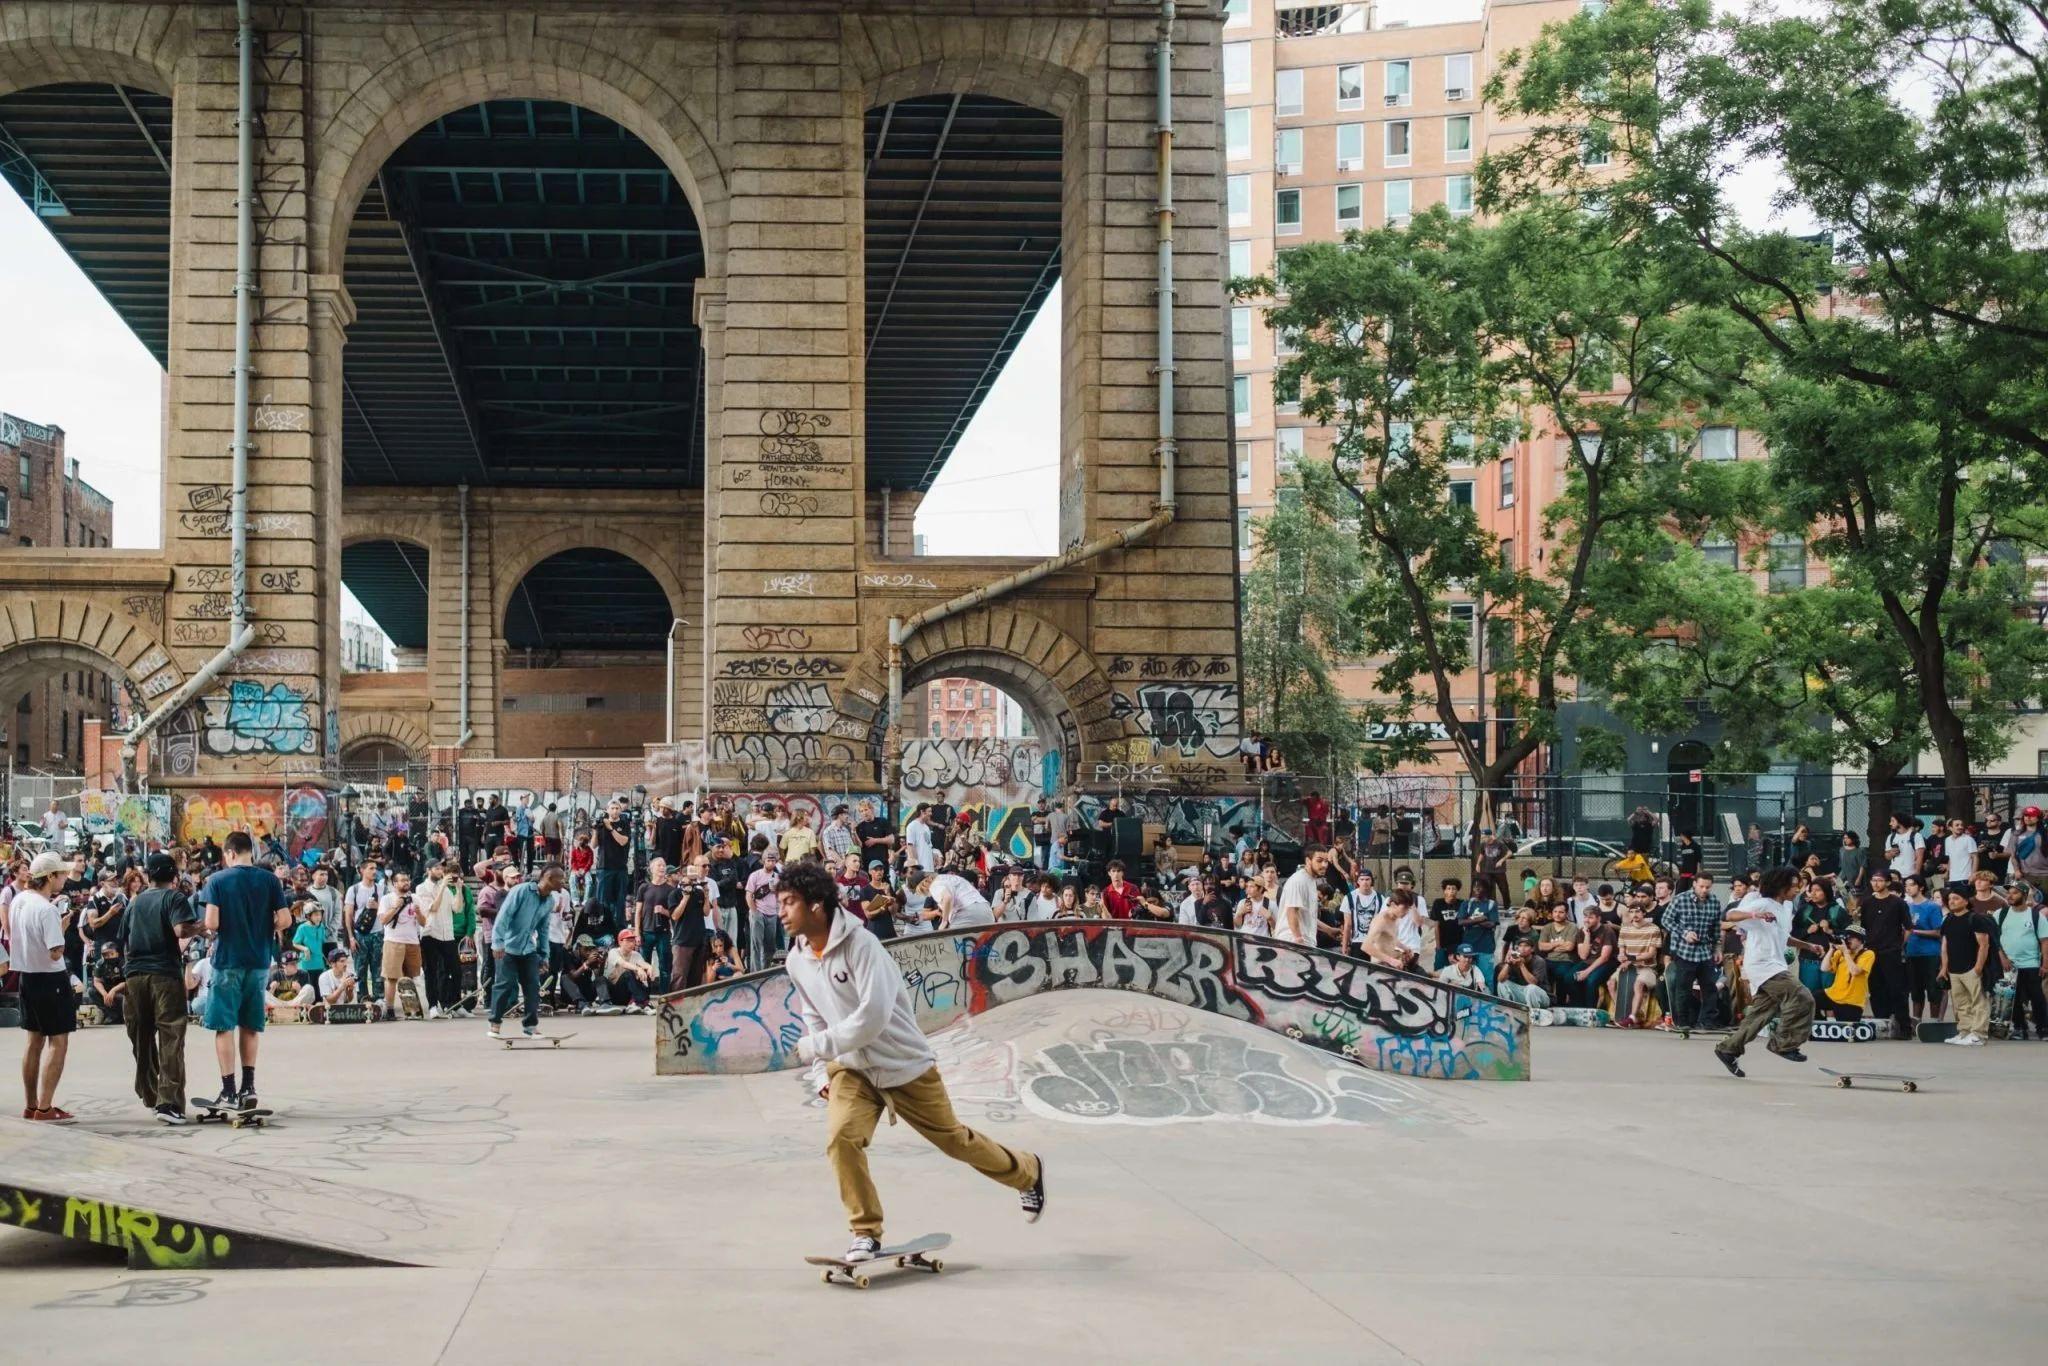
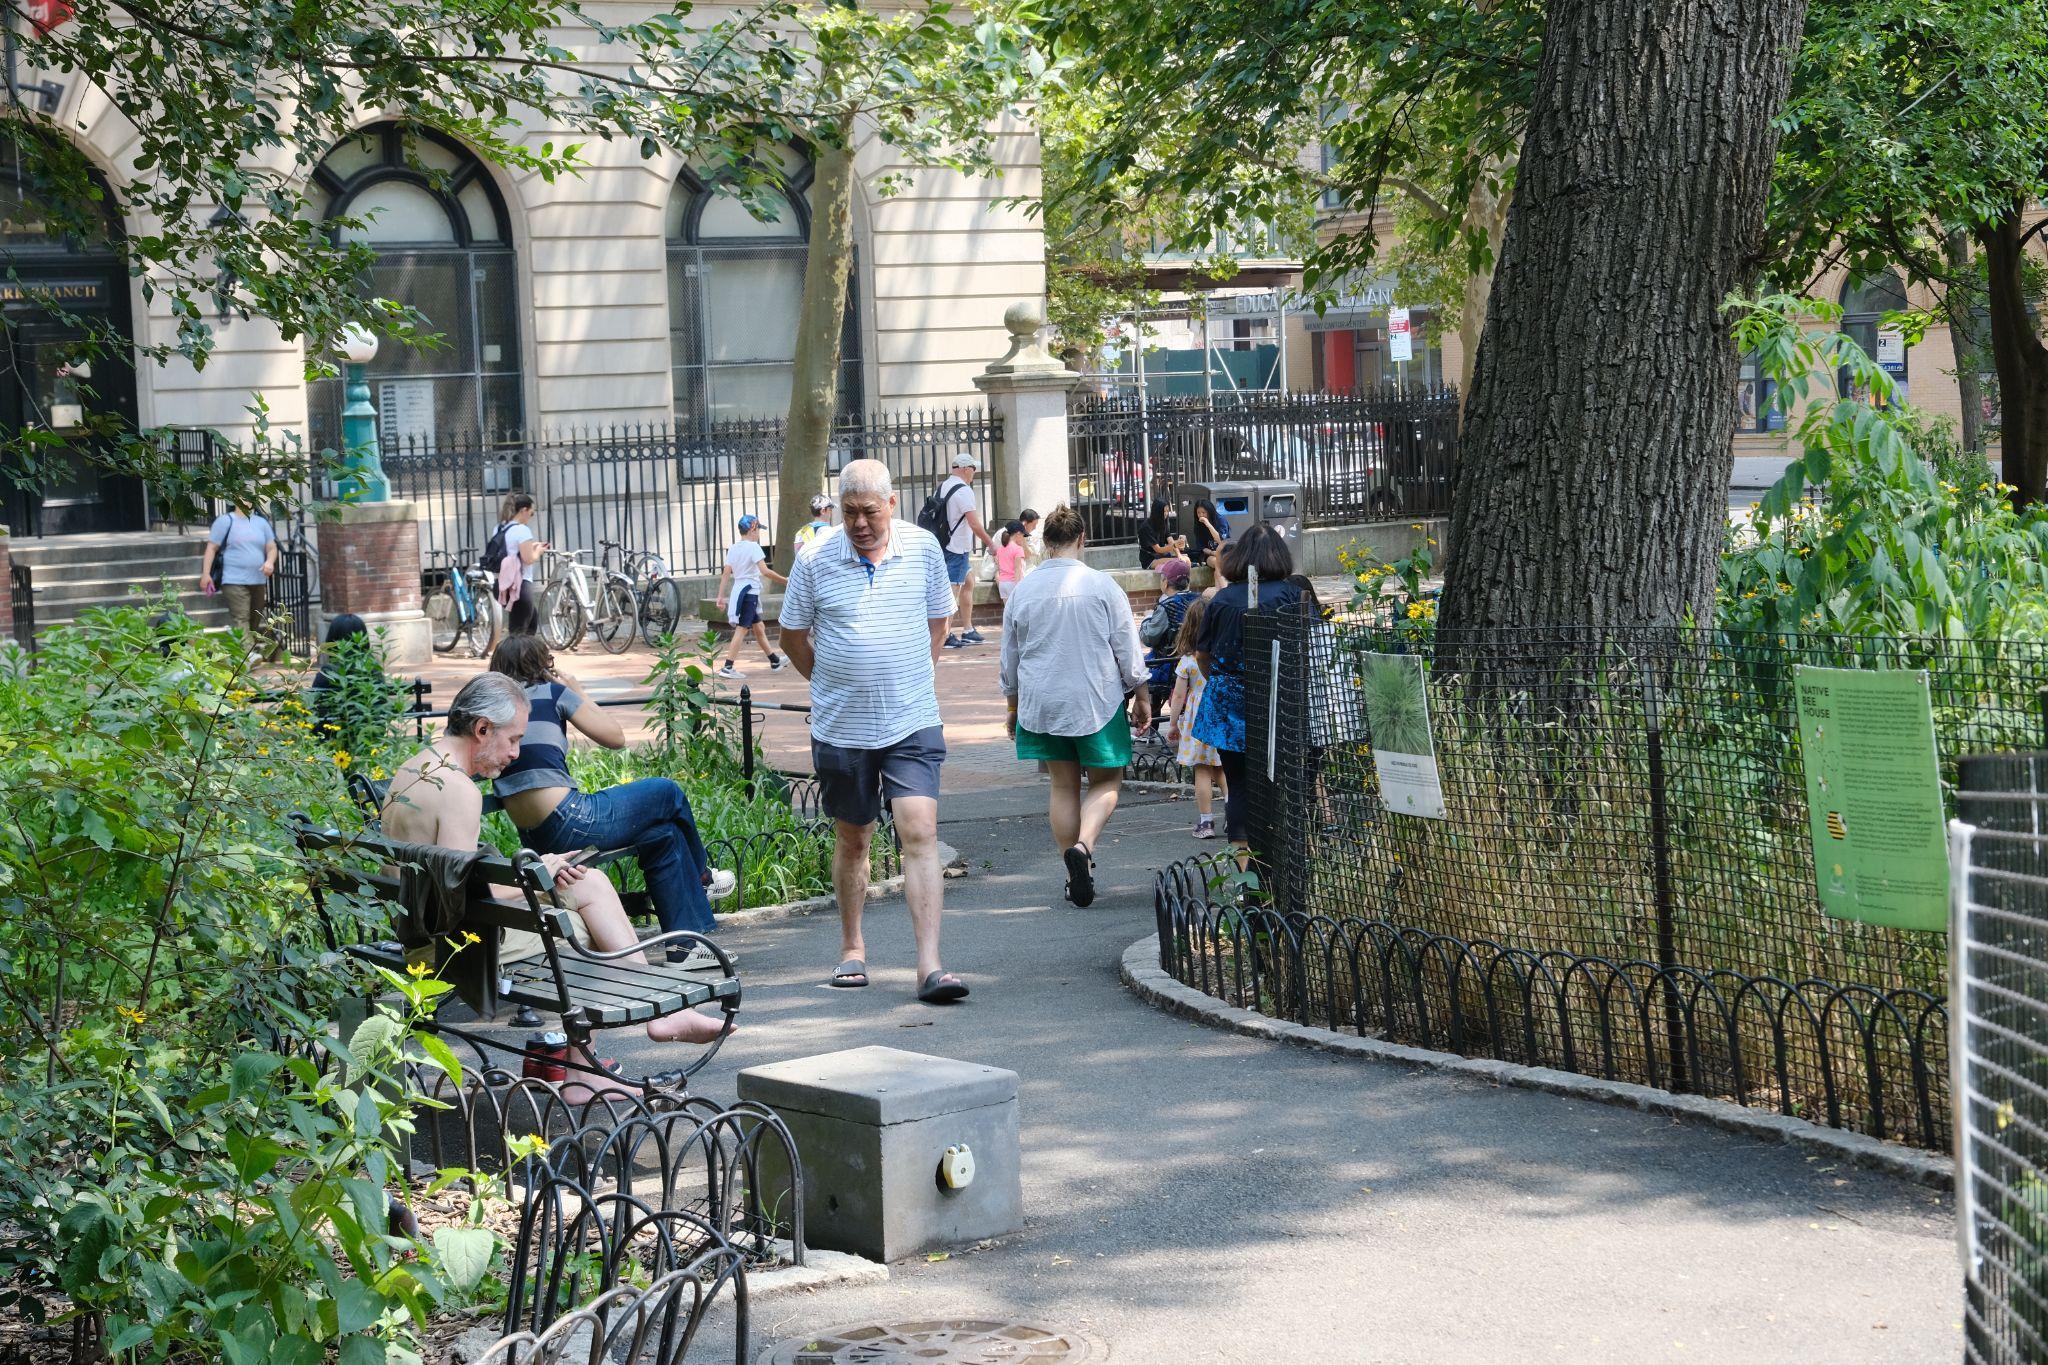
Seward Park, Lower East Side
A team of social scientists engaged, observed, and surveyed NewYorkers to understand how they used public gathering spaces. We refer to these places as social infrastructure — the physical places that shape our capacity to interact.
The Institute for Public Knowledge (IPK) at NewYork University
Led by Eric Klinenberg, sociologist and author of Palaces forthe People: How Social Infrastructure Can Help Fight Inequality, Polarization, and the Decline of Civic Life 1
Gehl Studio
An urban design, strategy, and research studio that has authored Social Infrastructure: Connecting People and Places for Healthy Communities and Rx for Social Connection, and advises on urban projects in 250+ cities worldwide 2,3,4
The
research focuses on understanding:
What shapes social connection in these spaces?
The IPK + Gehl team conducted over a yearof in-depth, mixed-methods research across three NewYork communities.
1,100+ individuals surveyed
127 community stakeholders engaged
313community photosco-analyzed
76sites visited
98 community leaders interviewed
3,080peopleobserved at 11 sites
Interviews and Focus Groups
Life Observation
18indicatorsevaluated at28sites
Space Assessment
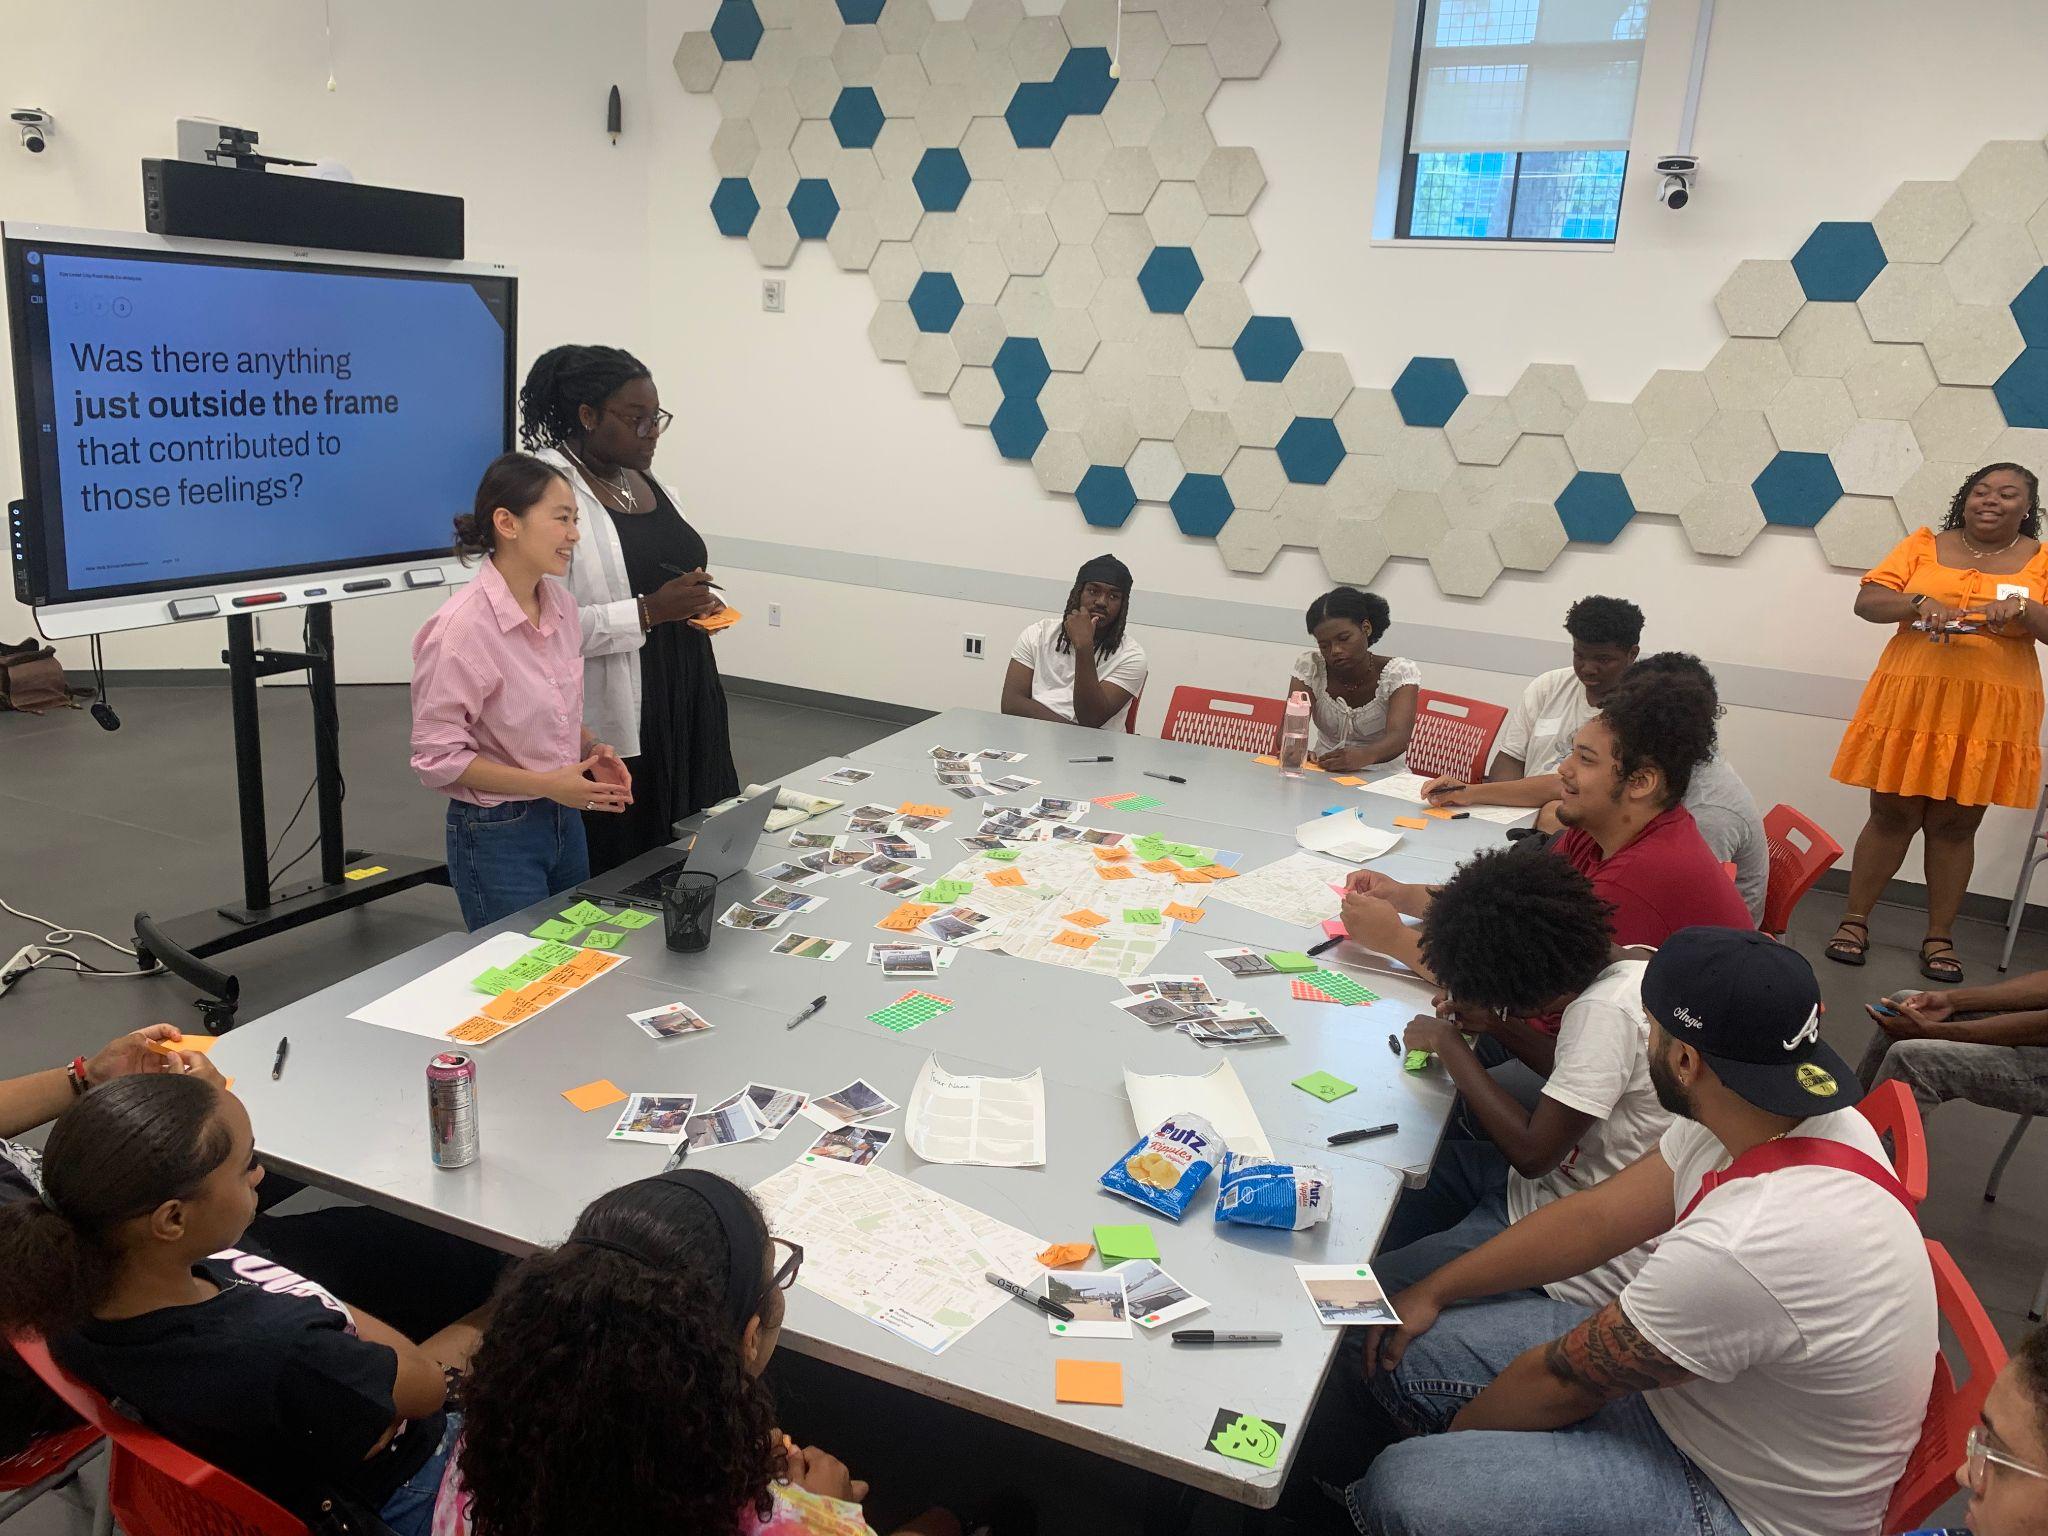
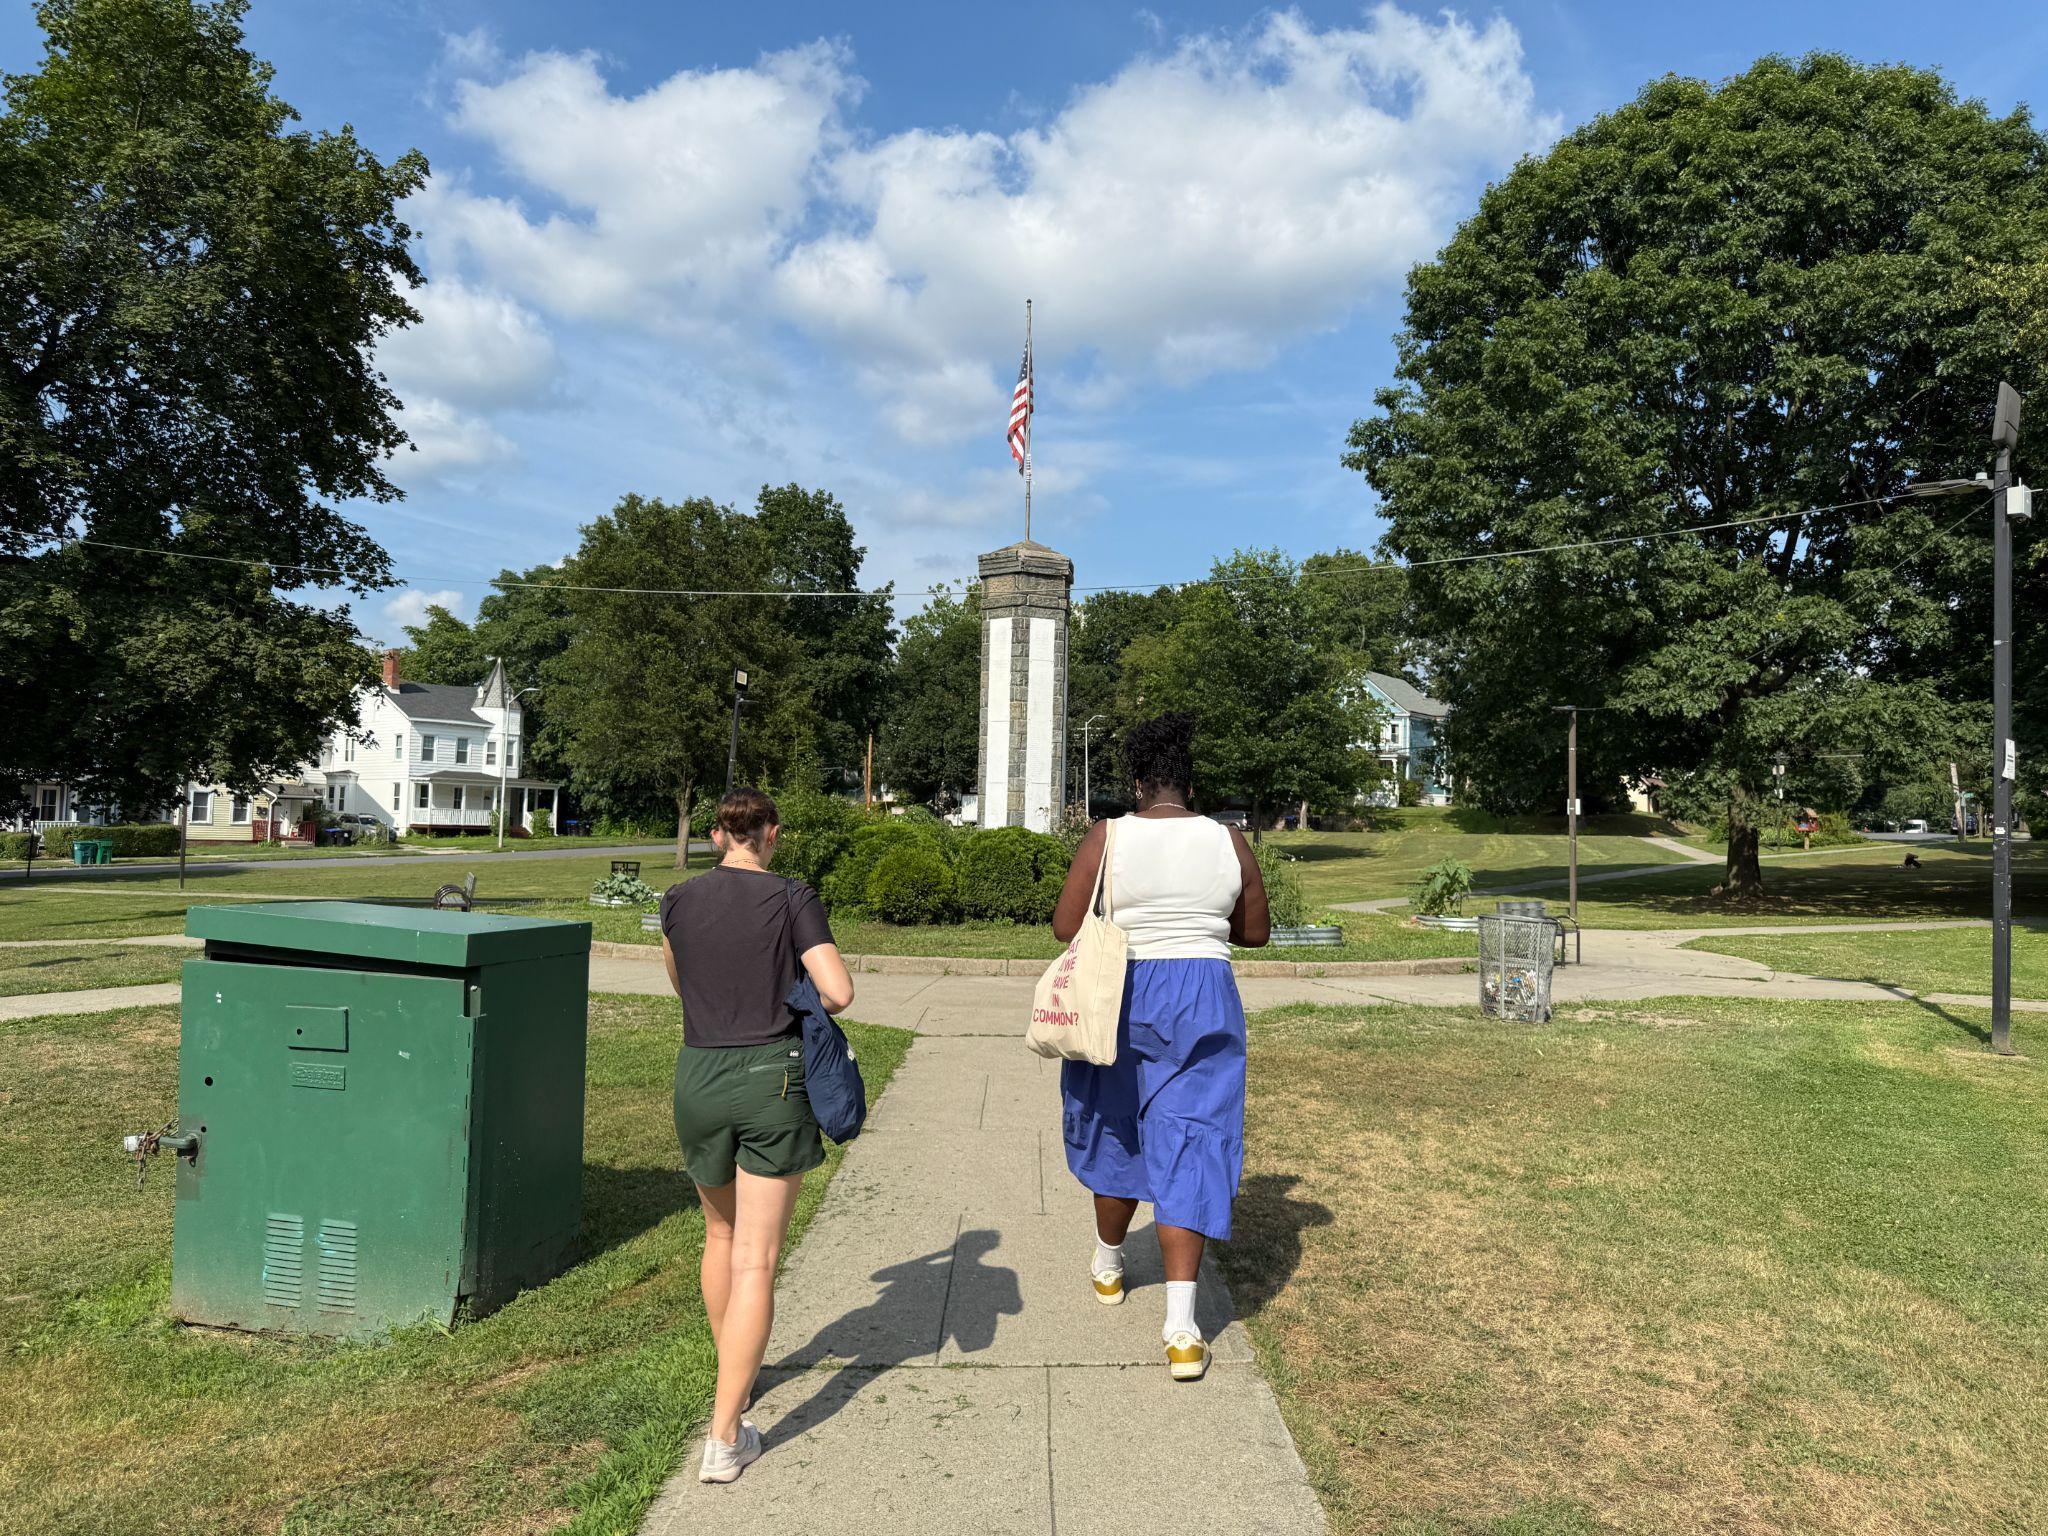
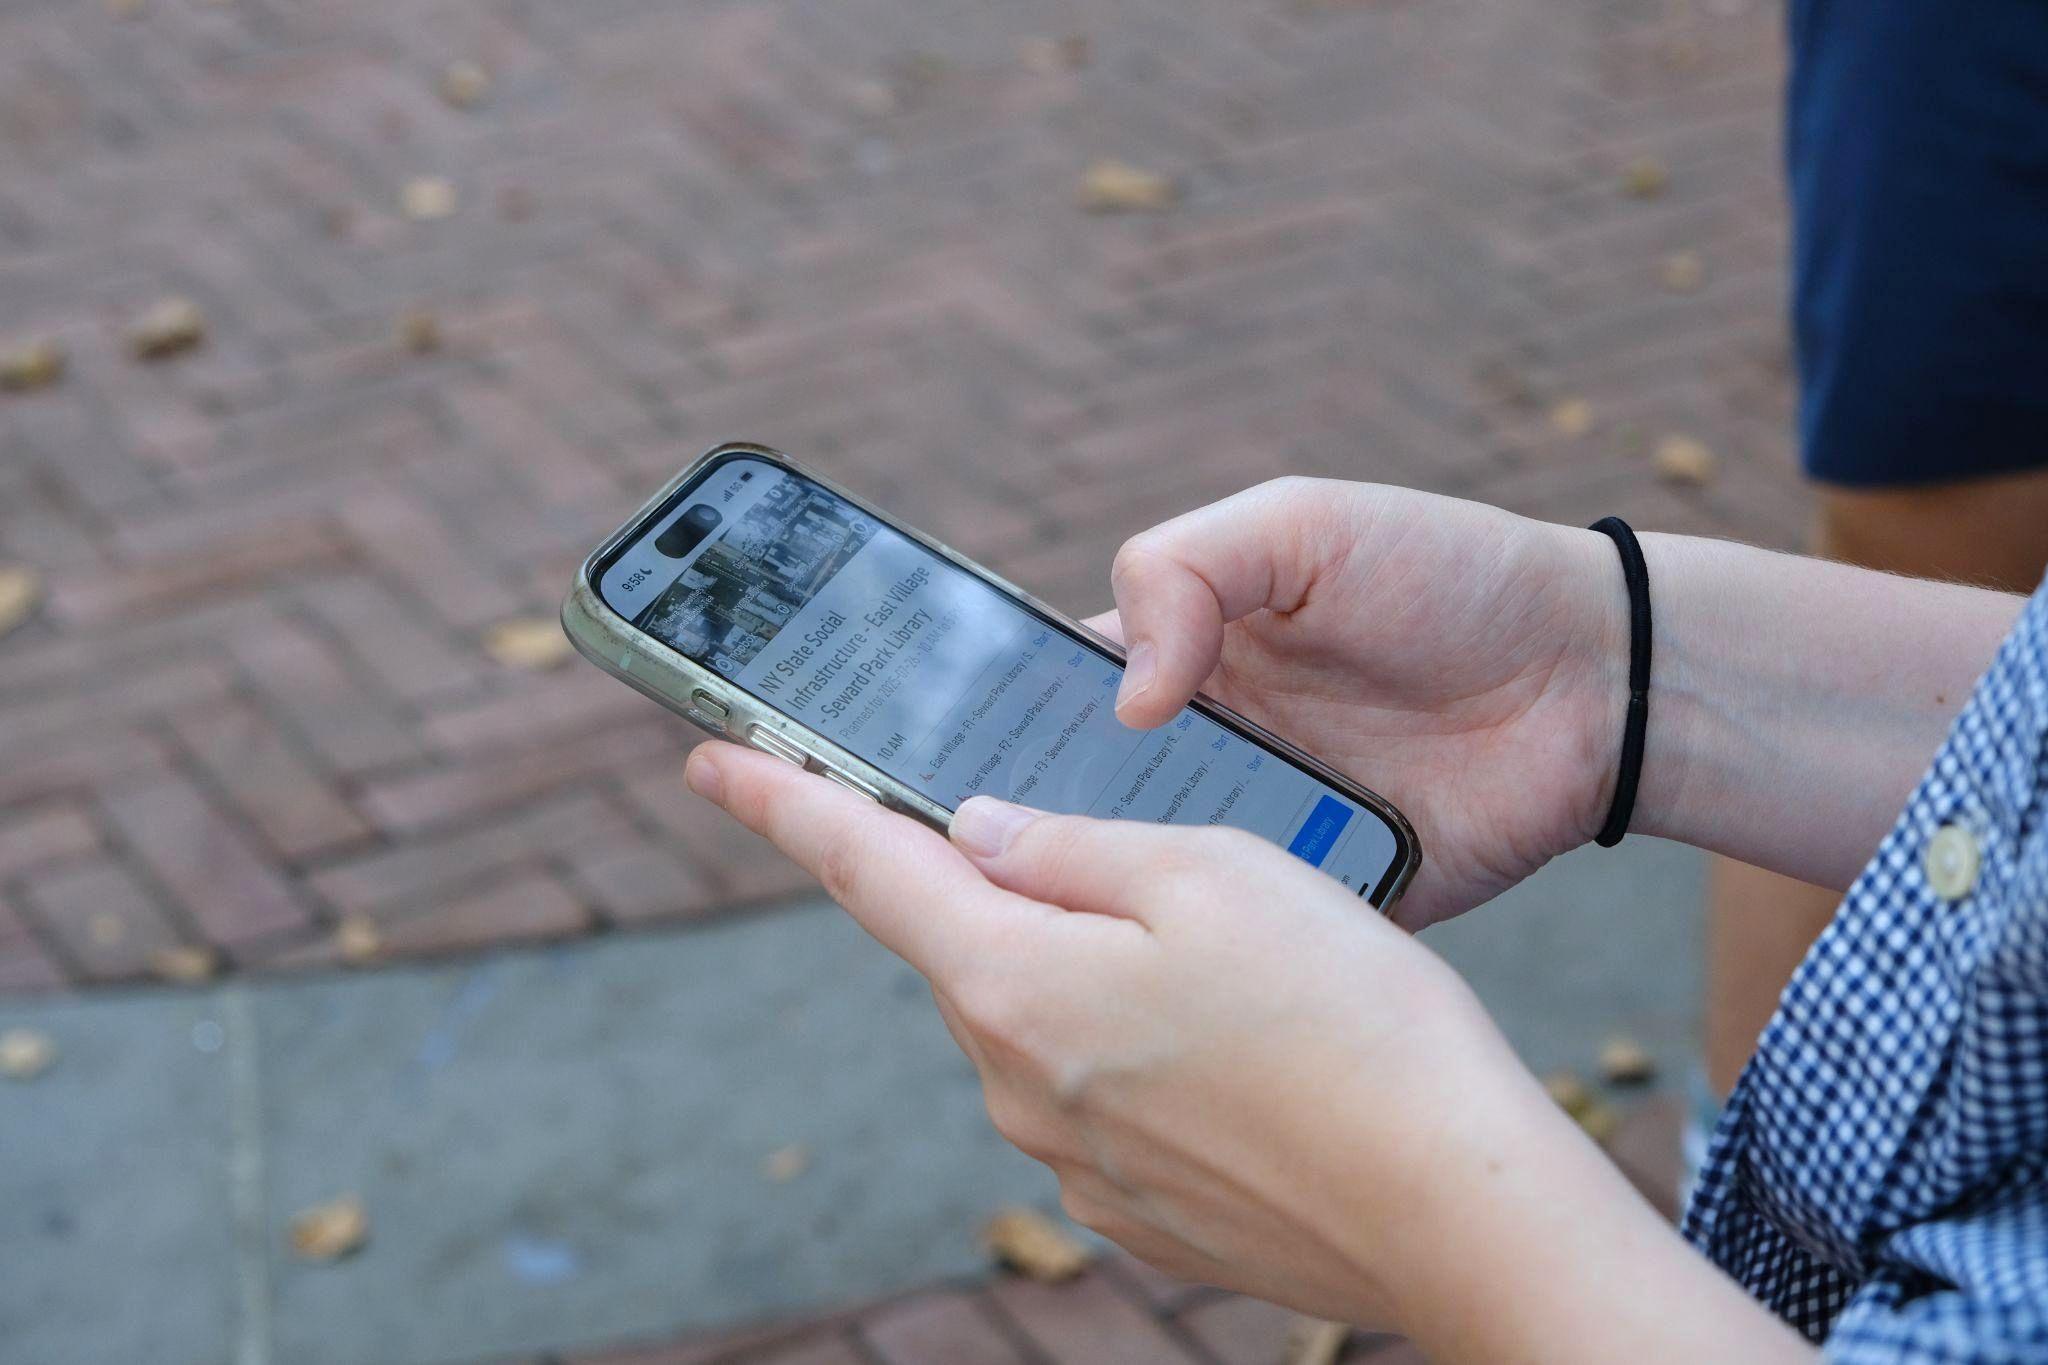
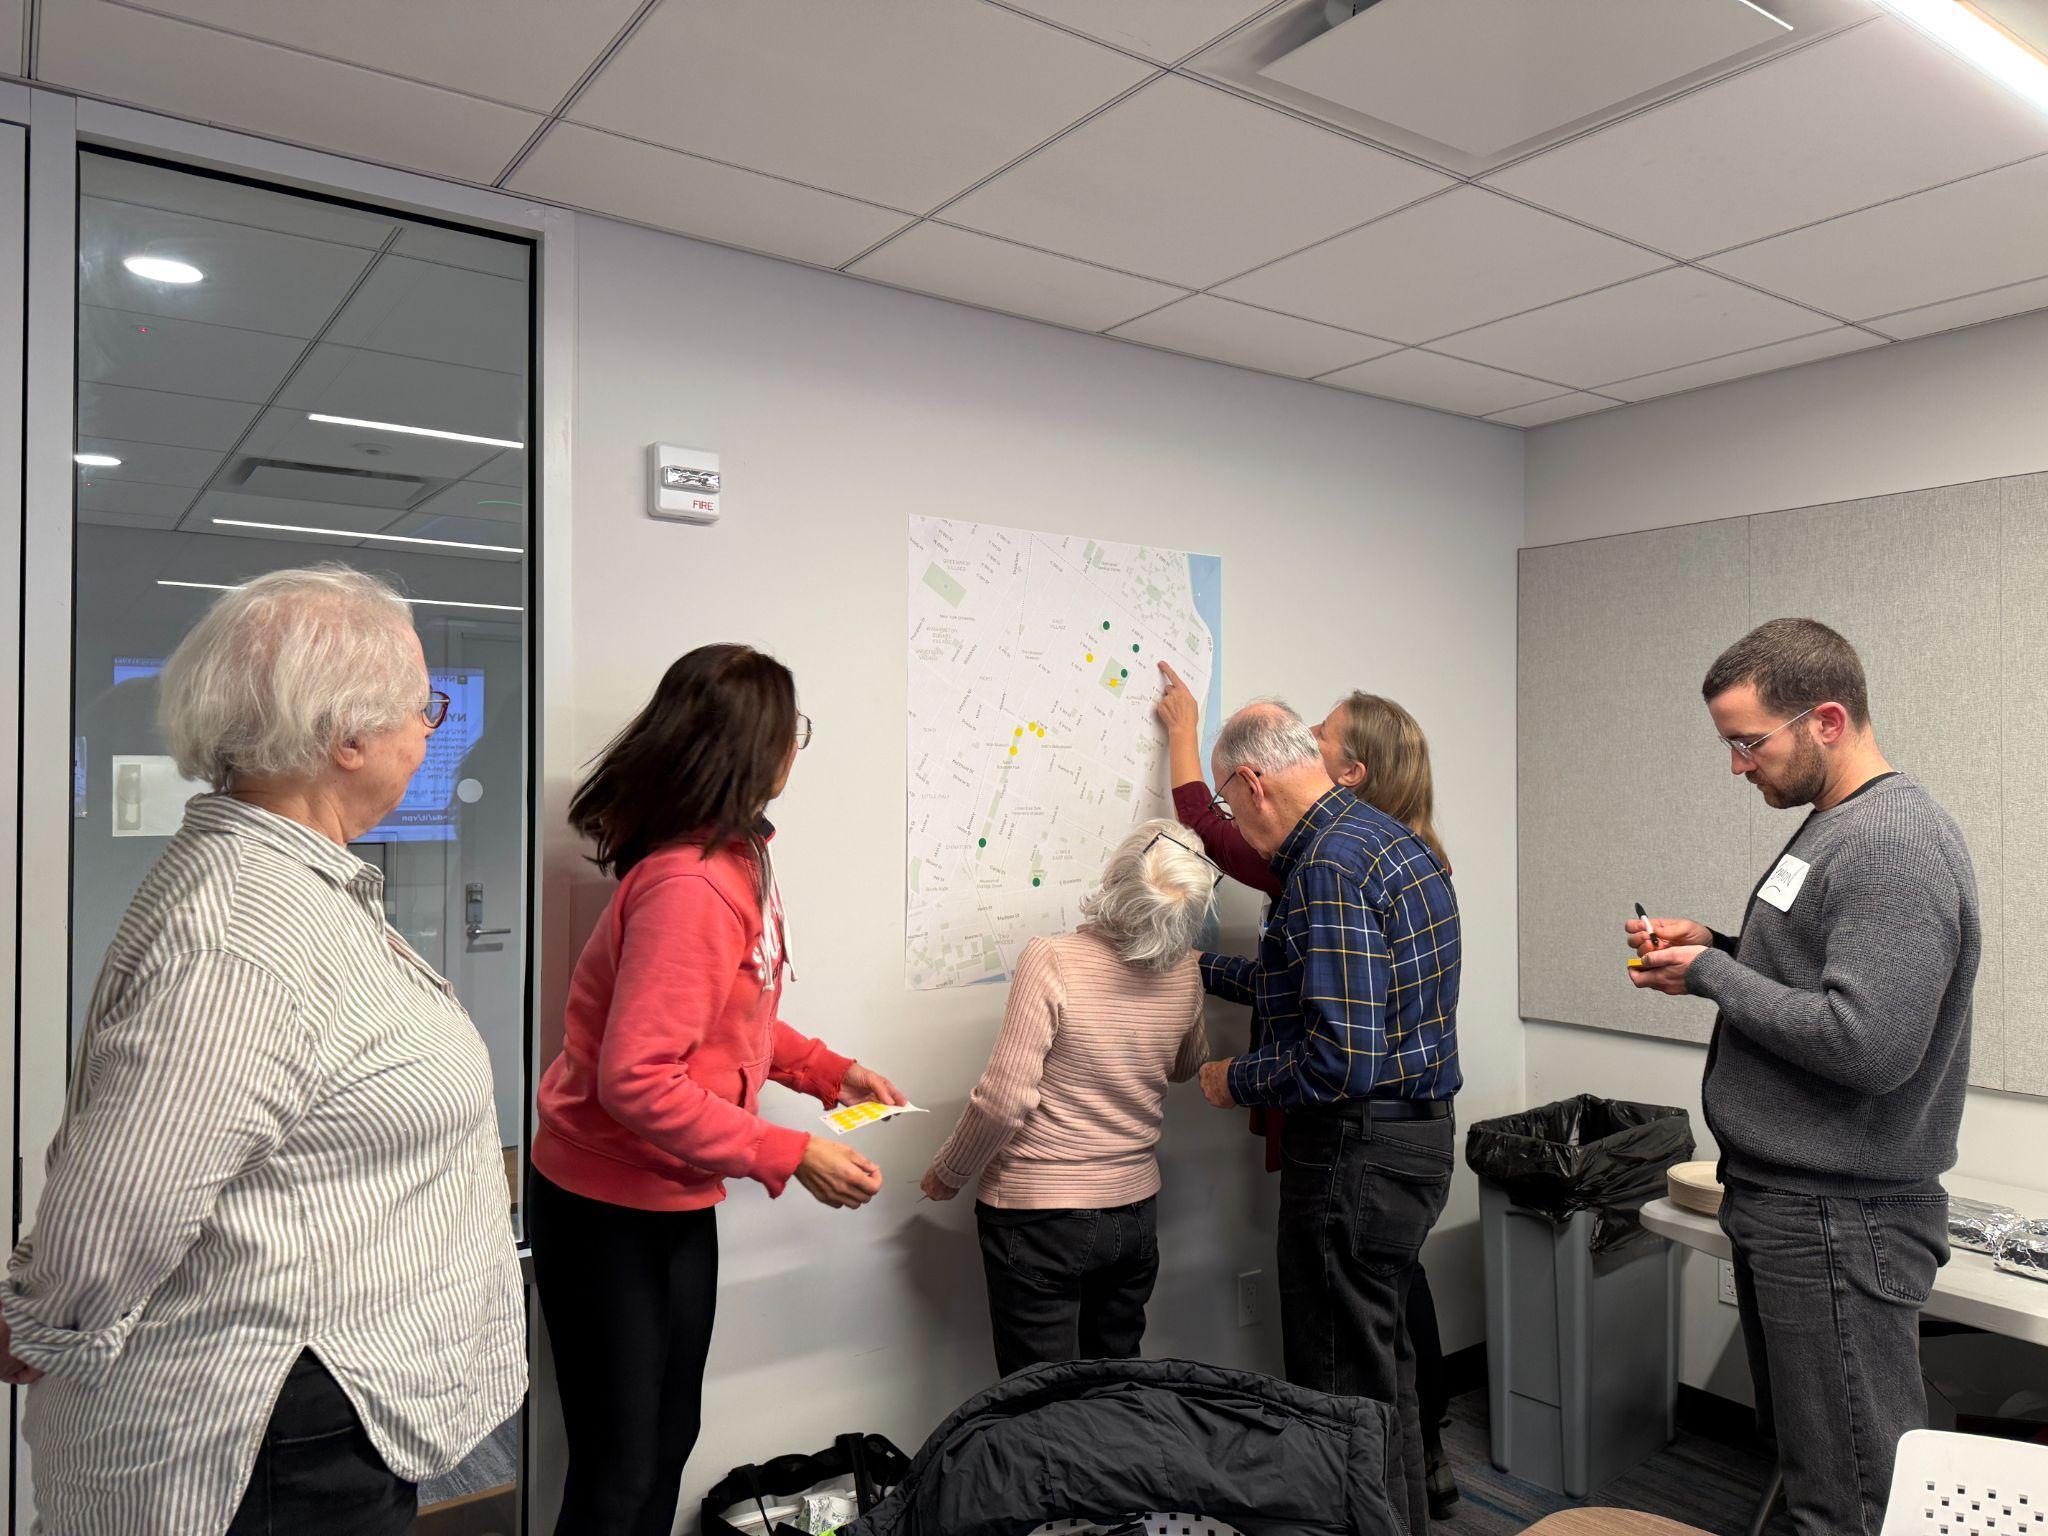
Eye Level City Photo Walks
Field Visits
These spaces make people feel more connected to theircommunities in many different ways. These are not just nice-to-have amenities; they are essential infrastructure for individual and collective health.
Trust
More than 70% feel that others are willing to help one another
Key Survey Findings on the Social Connection Outcomes of Social Infrastructure Sites
Recognition
More than 70% recognize at least a few individuals
Familiarity
Befriending
More than 35% of people made new friends
Bridging
More than 50% report cross-racial or cross-ethnic interactions
More than 35% report cross-class interactions
Community
Belonging
More than 80% feel a sense of belonging
Relationships
Sense of Connection
More than 60% feel less alone or isolated
Engagement
More than 40% of respondents engage in joint activities
The study revealed what it takes for social infrastructure to have an impact at different scales.
1
Human Needs
People seekout social infrastructure spaces to meet everyday needs — to rest, create, learn, play — in a social environment.
More starting on page 14
2
Site Needs
These spaces need meaningful resources for features like design, programming, and operations in order to remain effective.
More starting on page 27
3
Neighborhood Needs
A diverse mix of high-quality, accessible spaces expands opportunities for the social connections that form healthy, resilient societies.
More starting on page 36
Social Infrastructure
People need a mix of high-quality, accessible indoor and outdoor spaces that support their needs to rest, play, create, and learn.
Social Connection
These spaces facilitate different types of social connection — all of which are essential to our well-being.
Civic Outcomes
These spaces and the social connections they foster contribute to a more equal society.
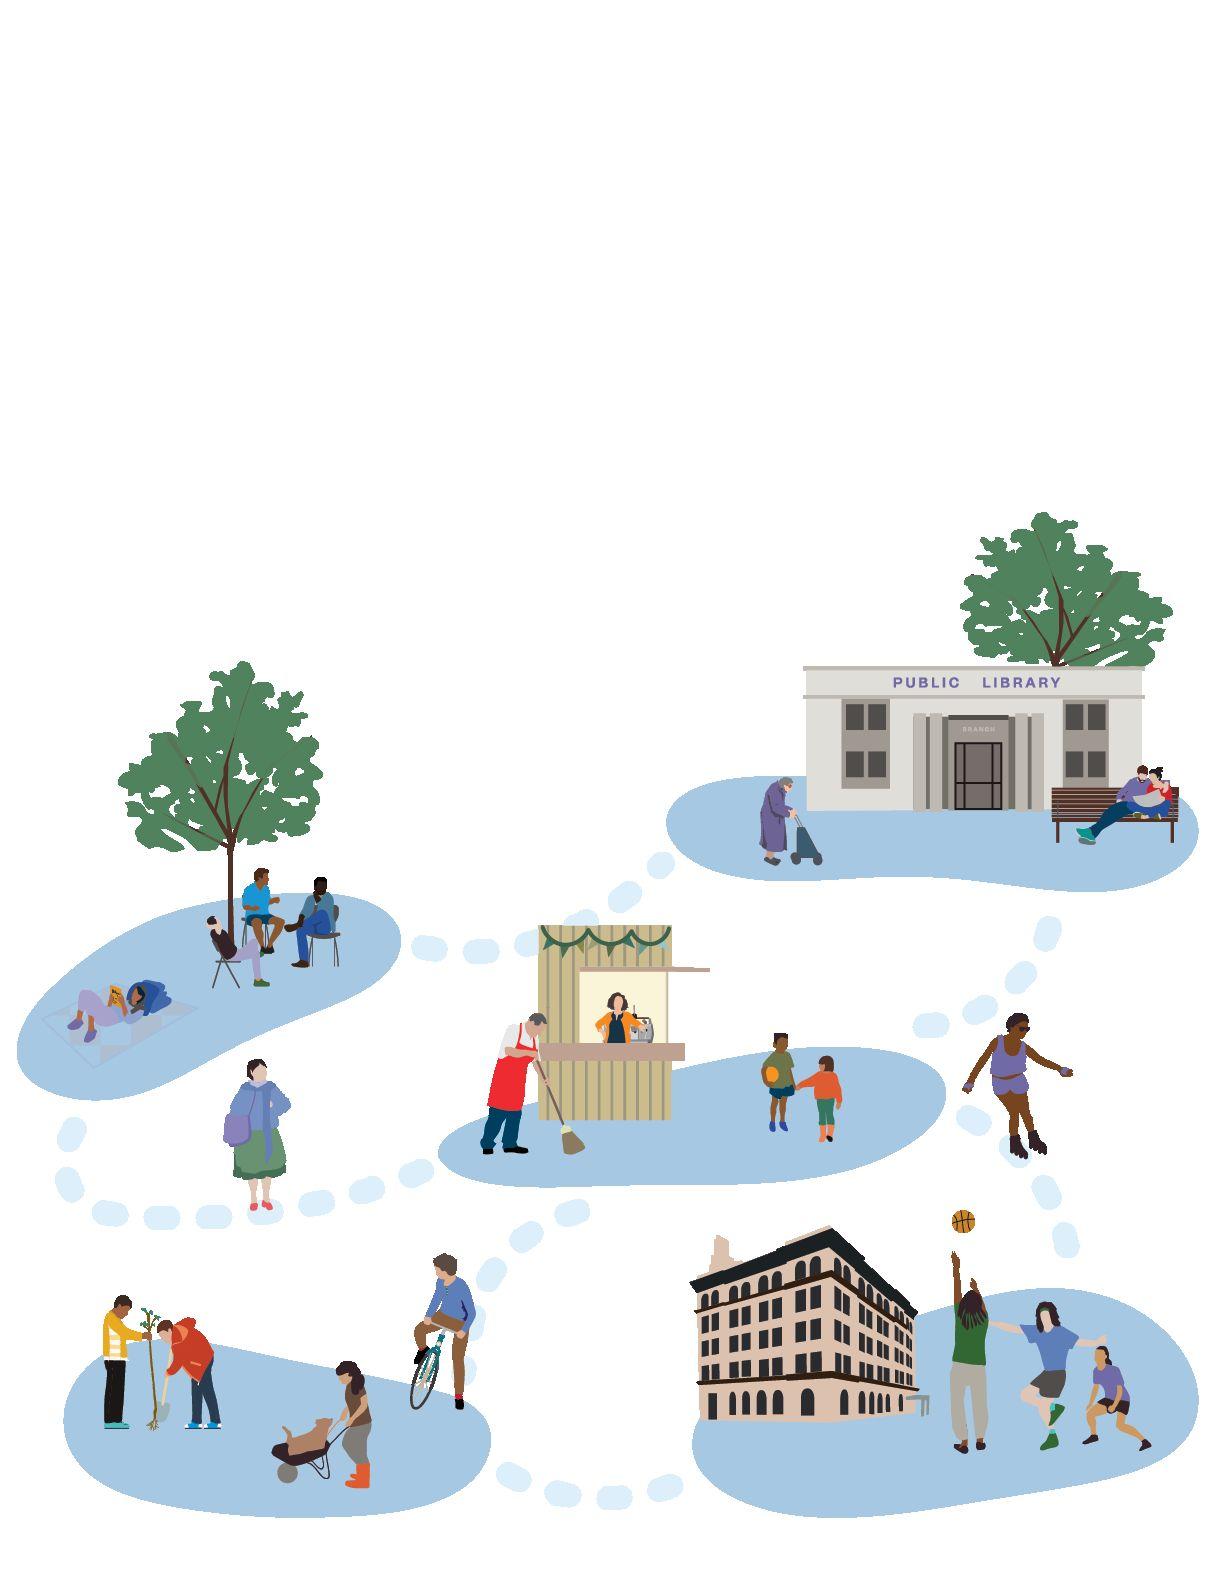
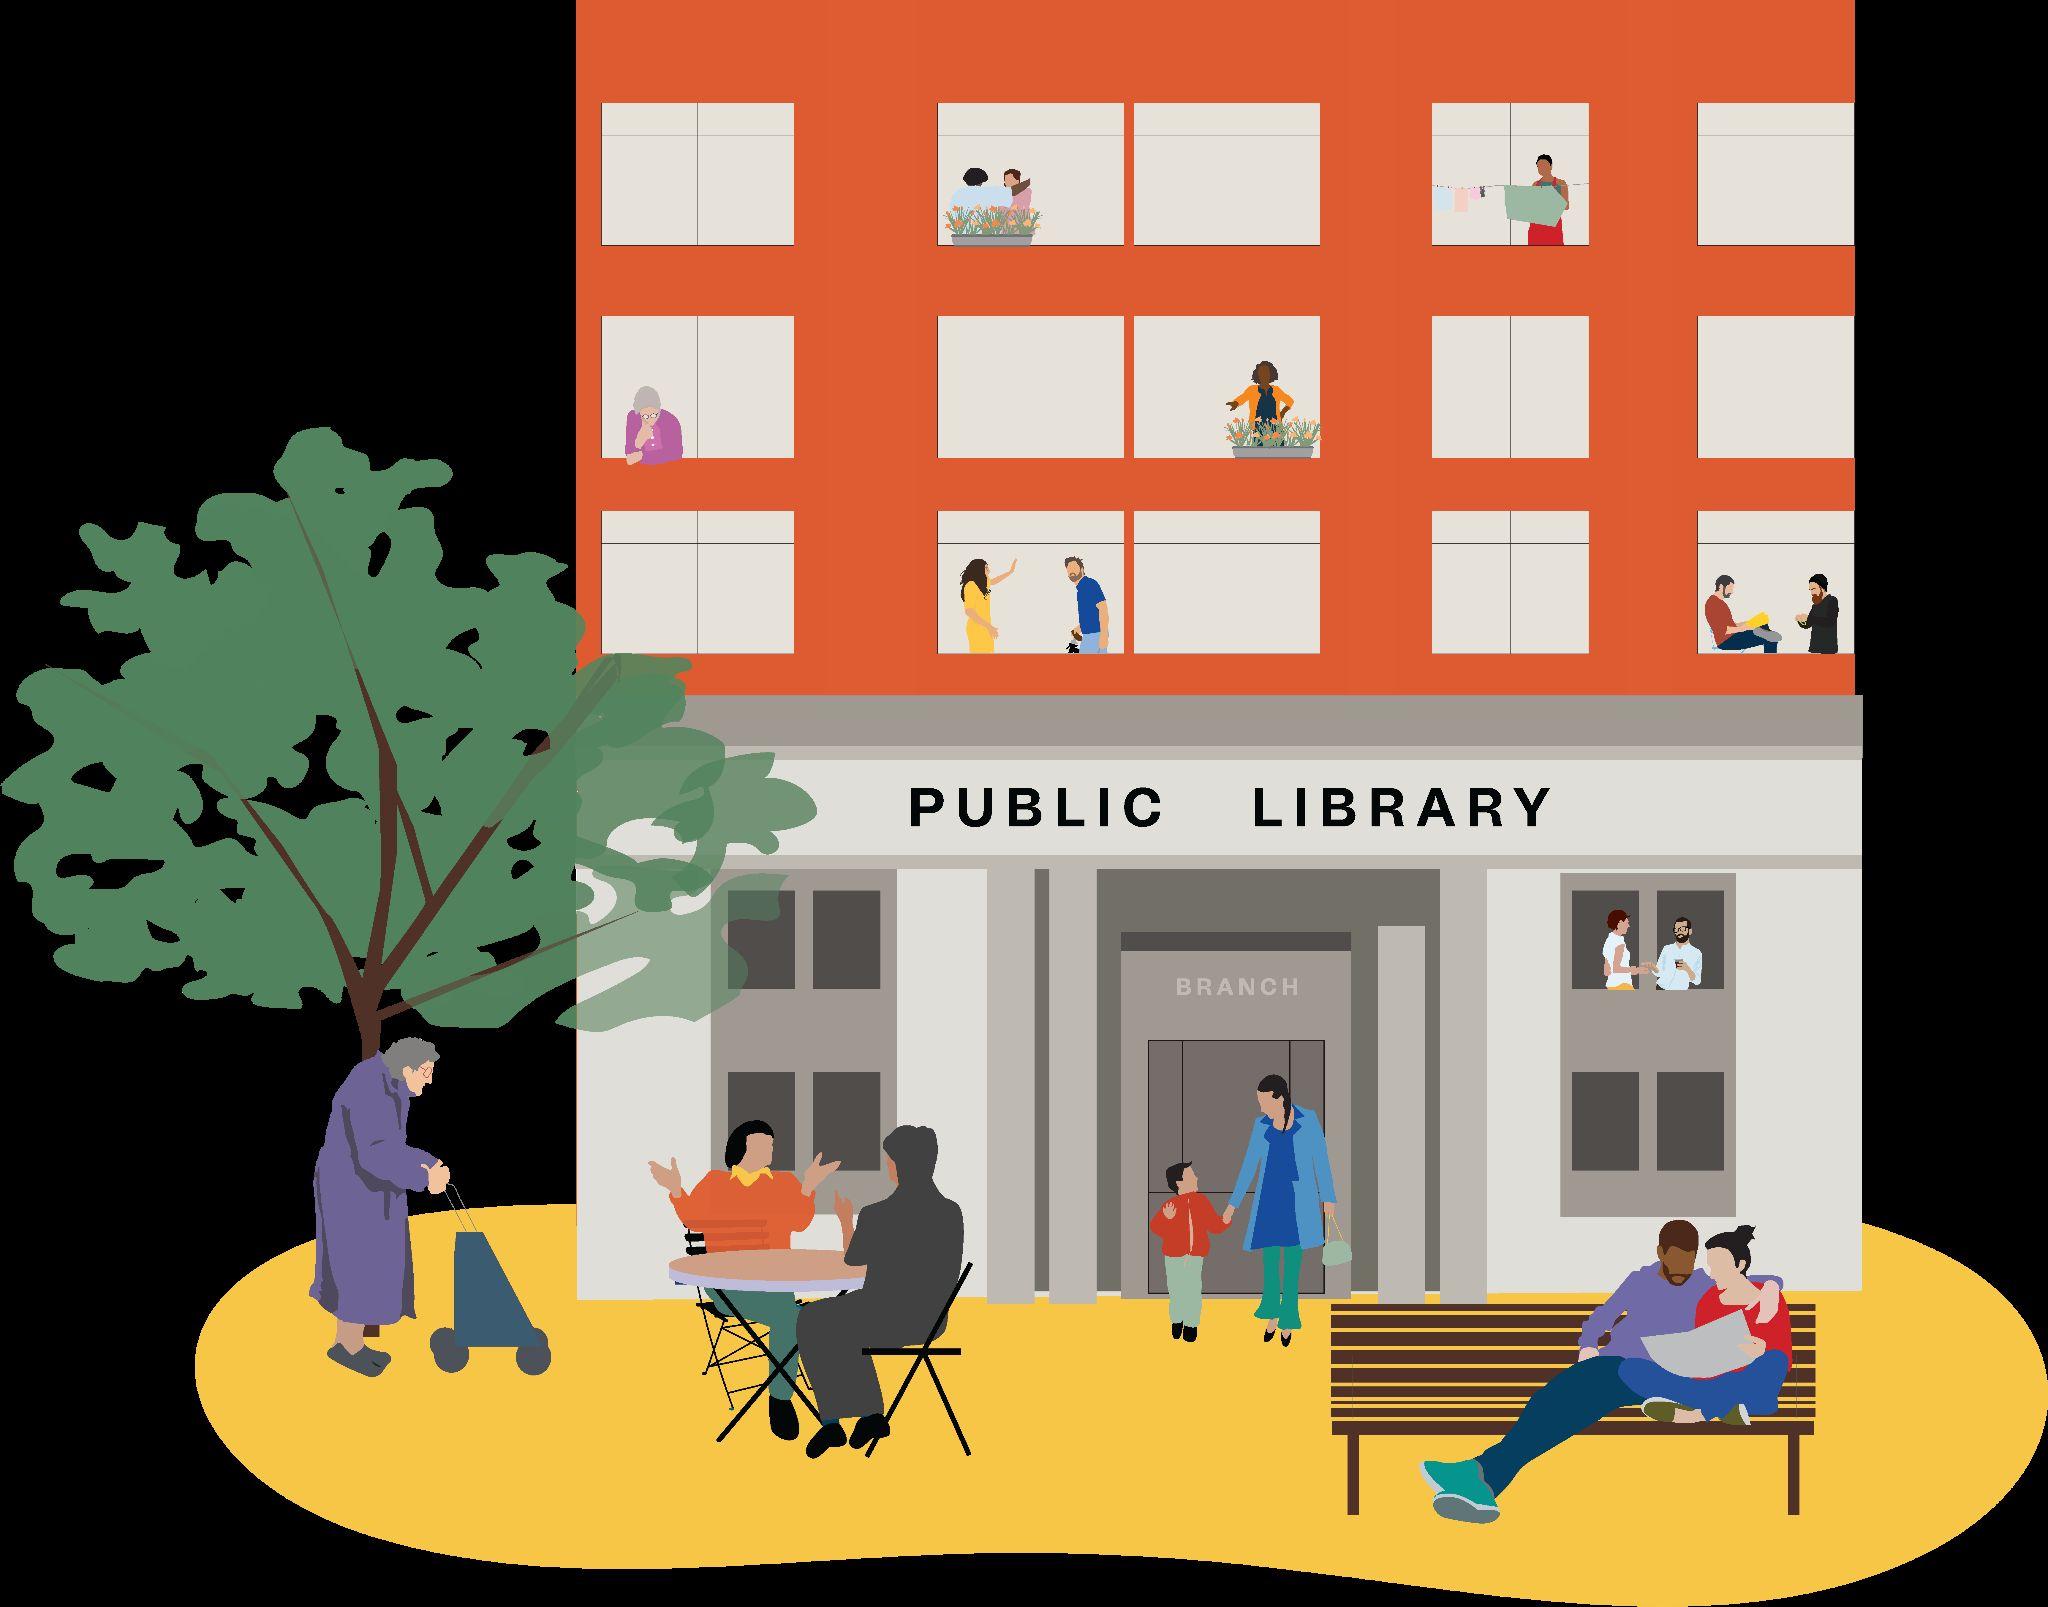
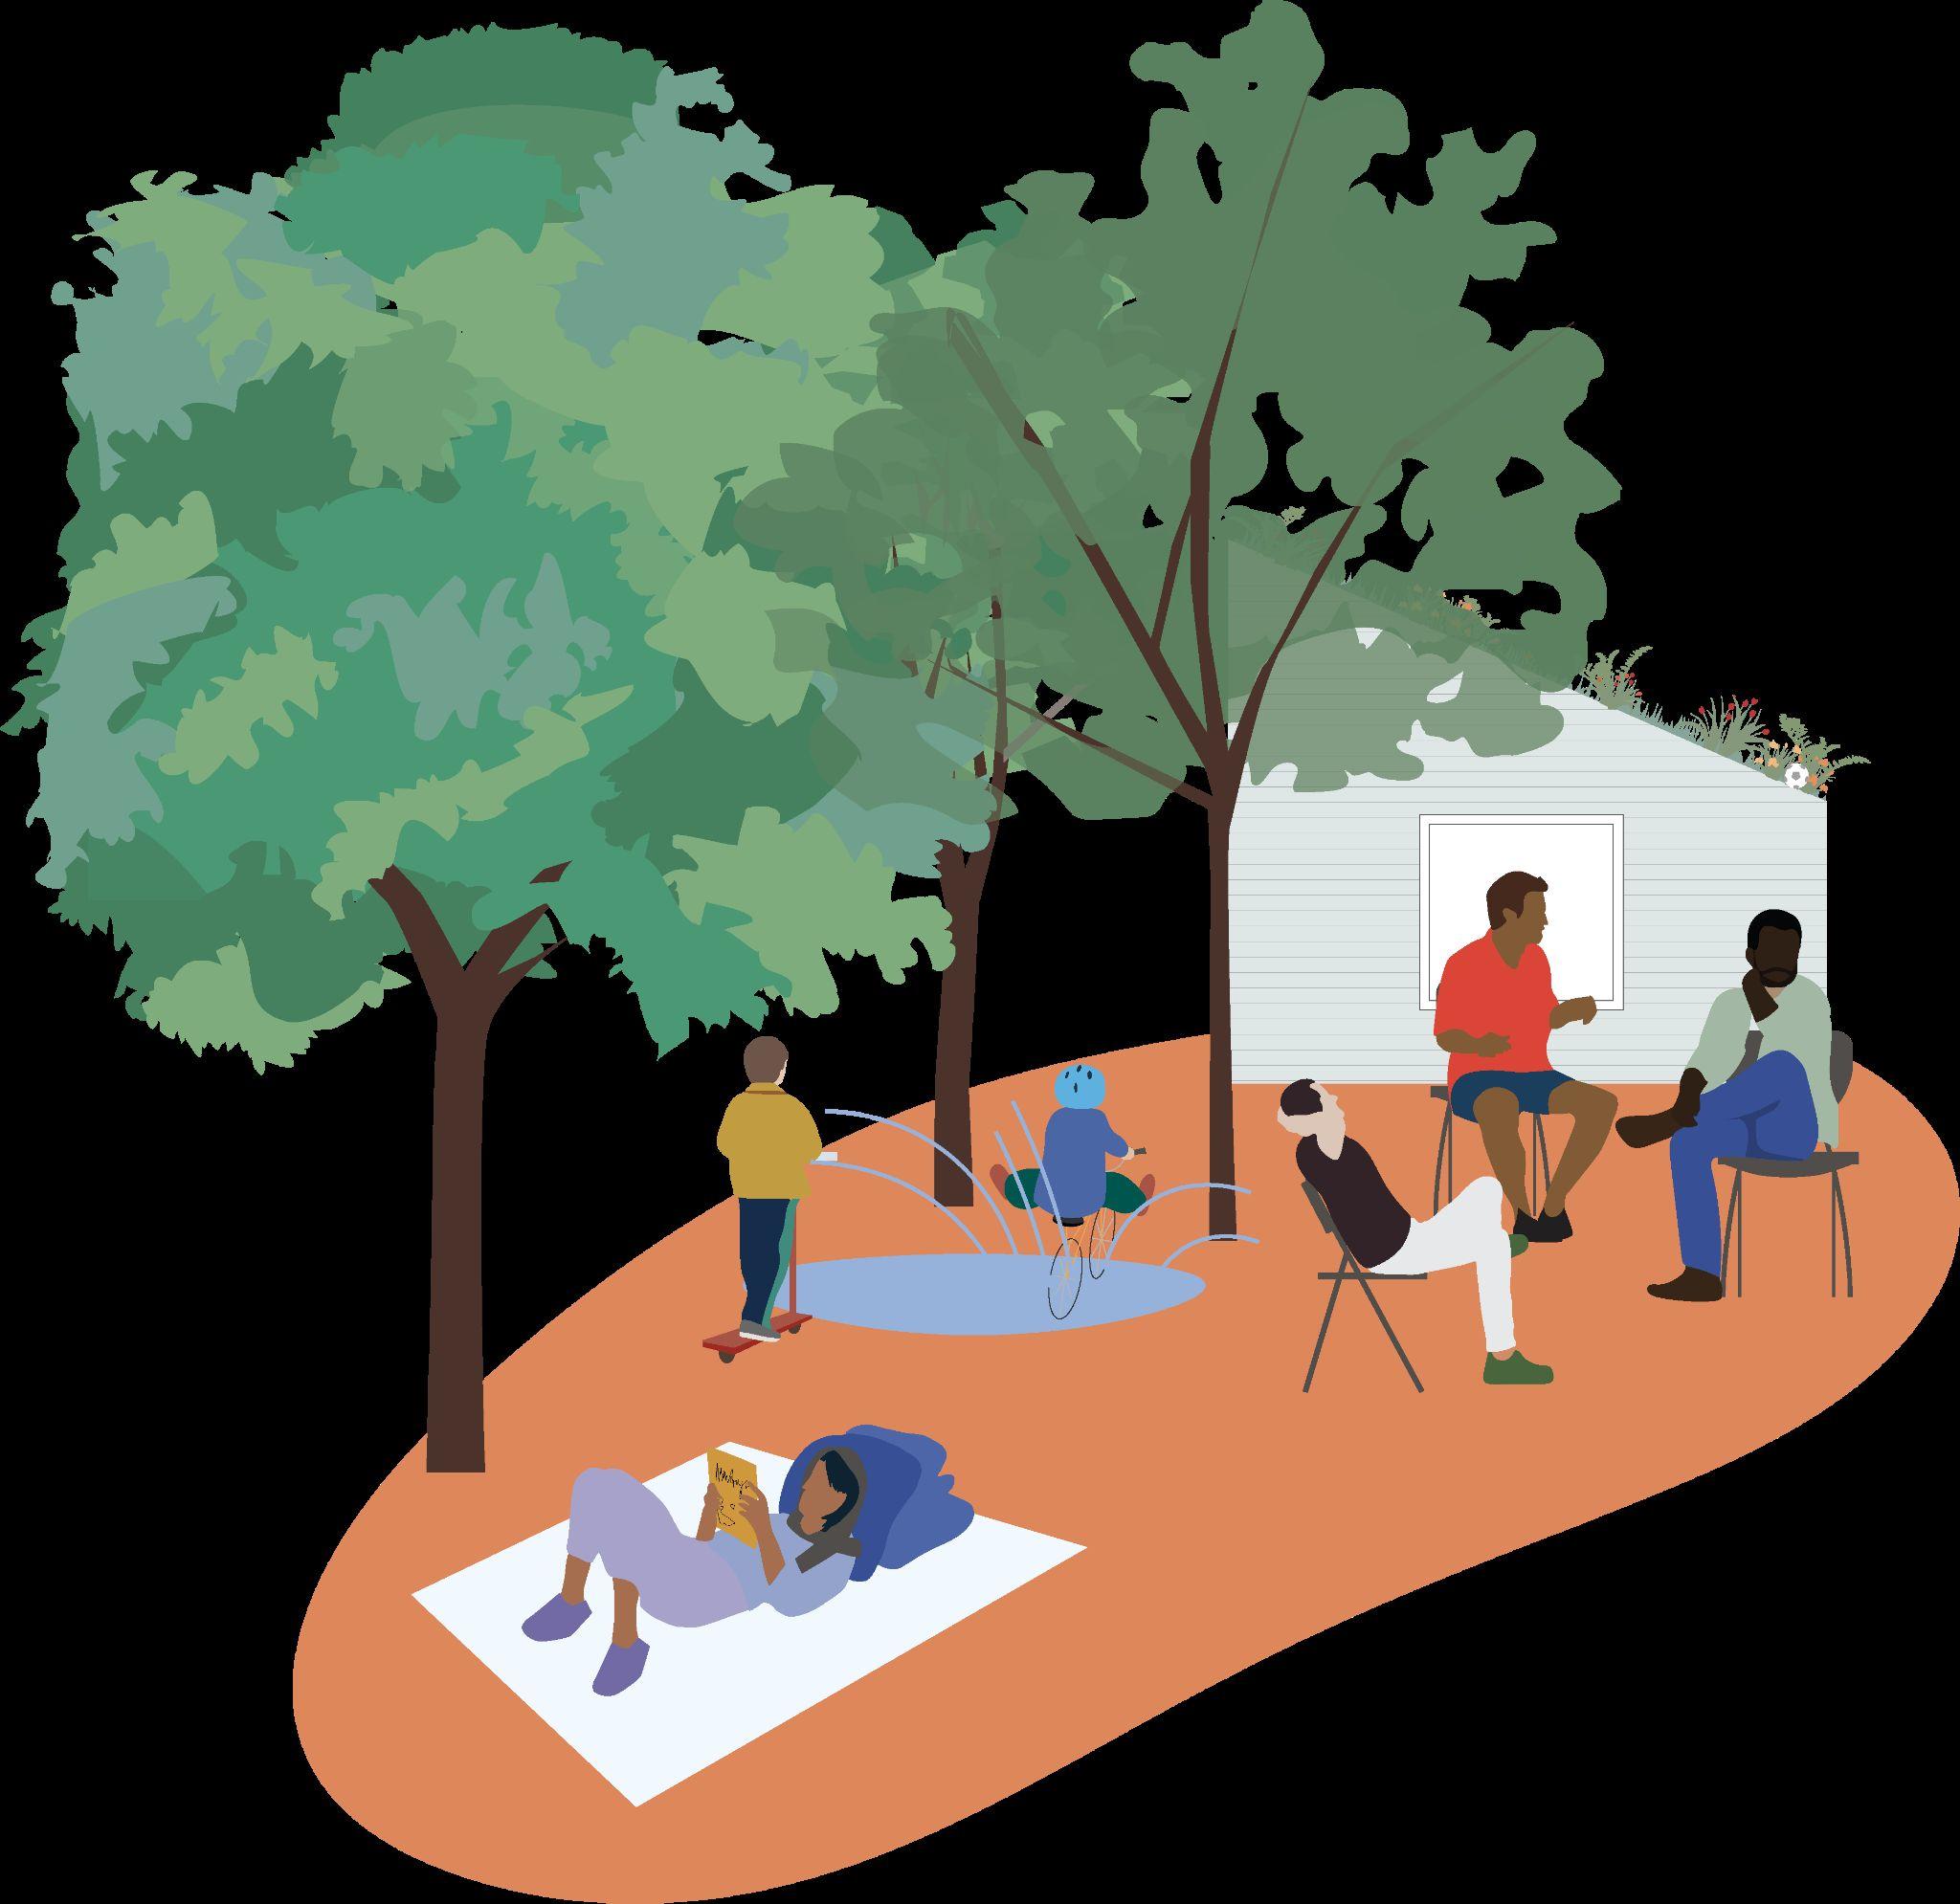
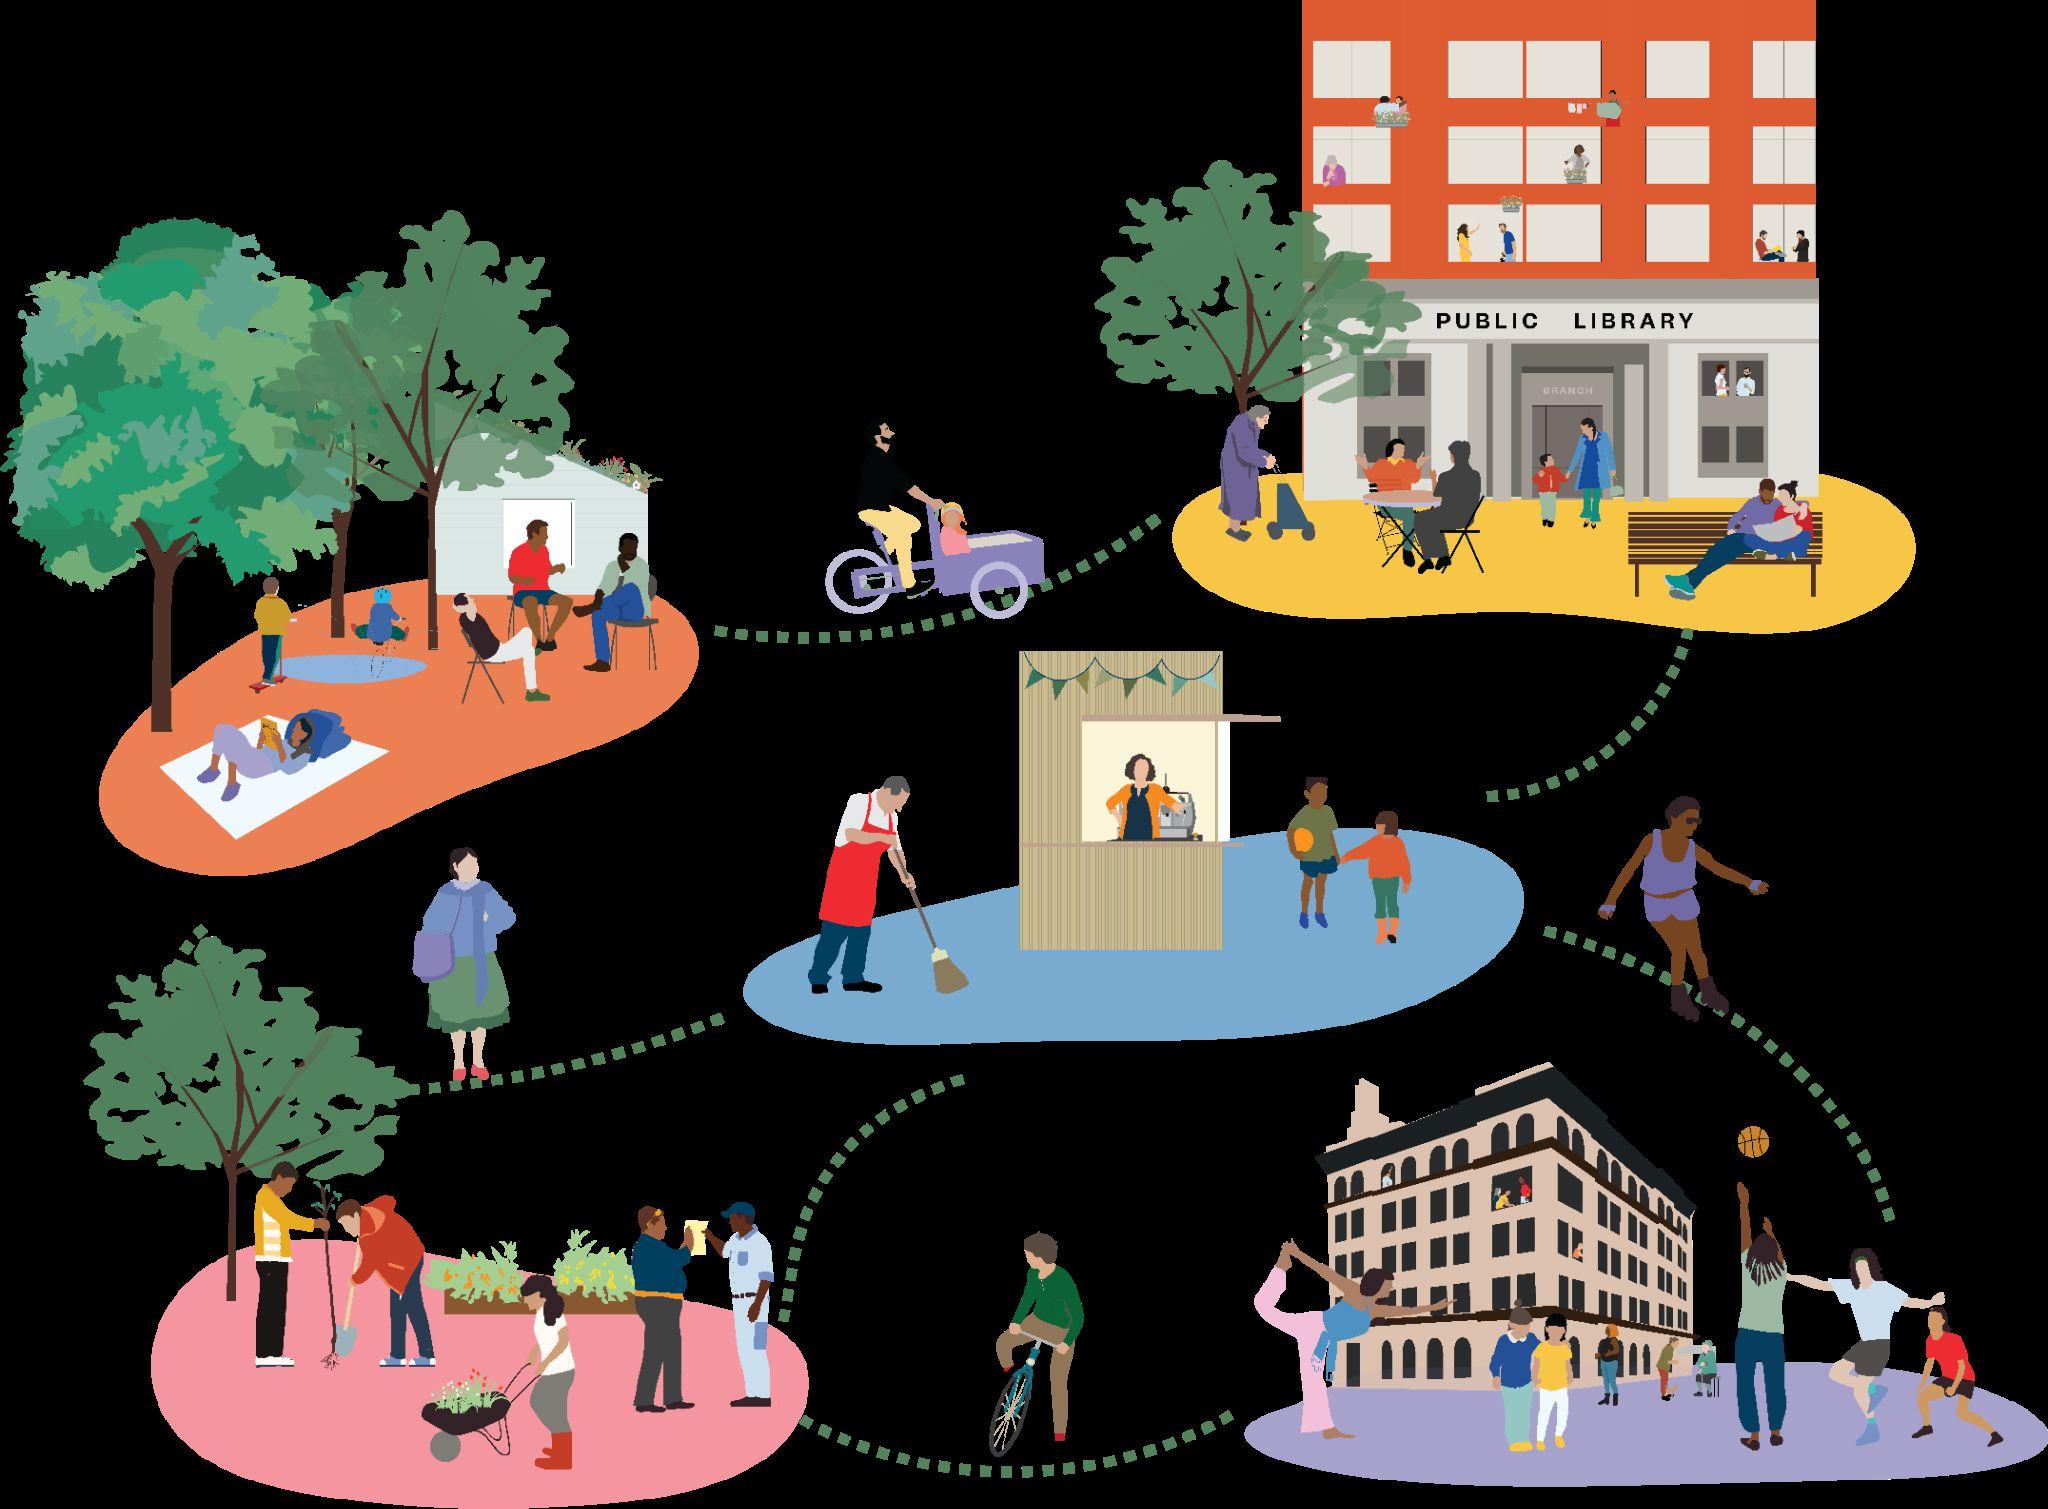
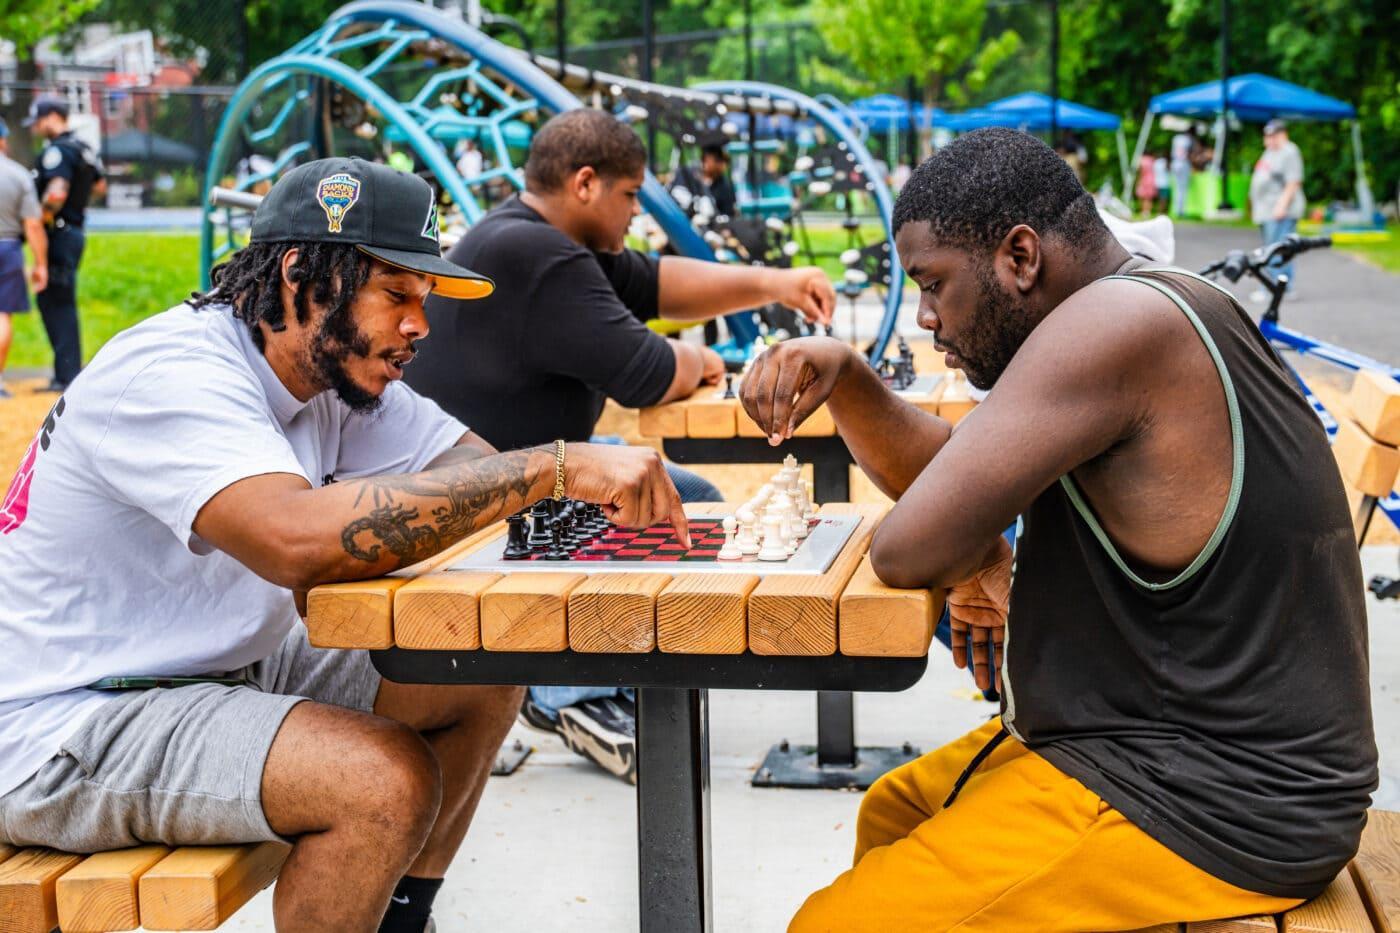
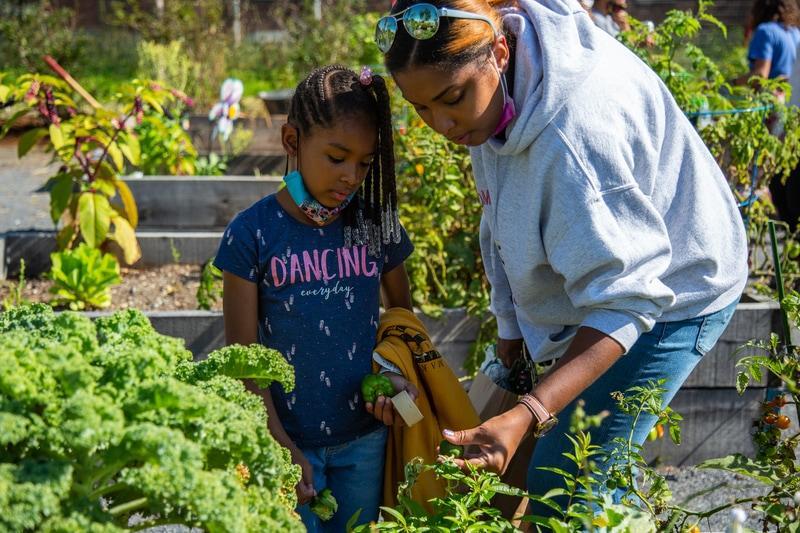
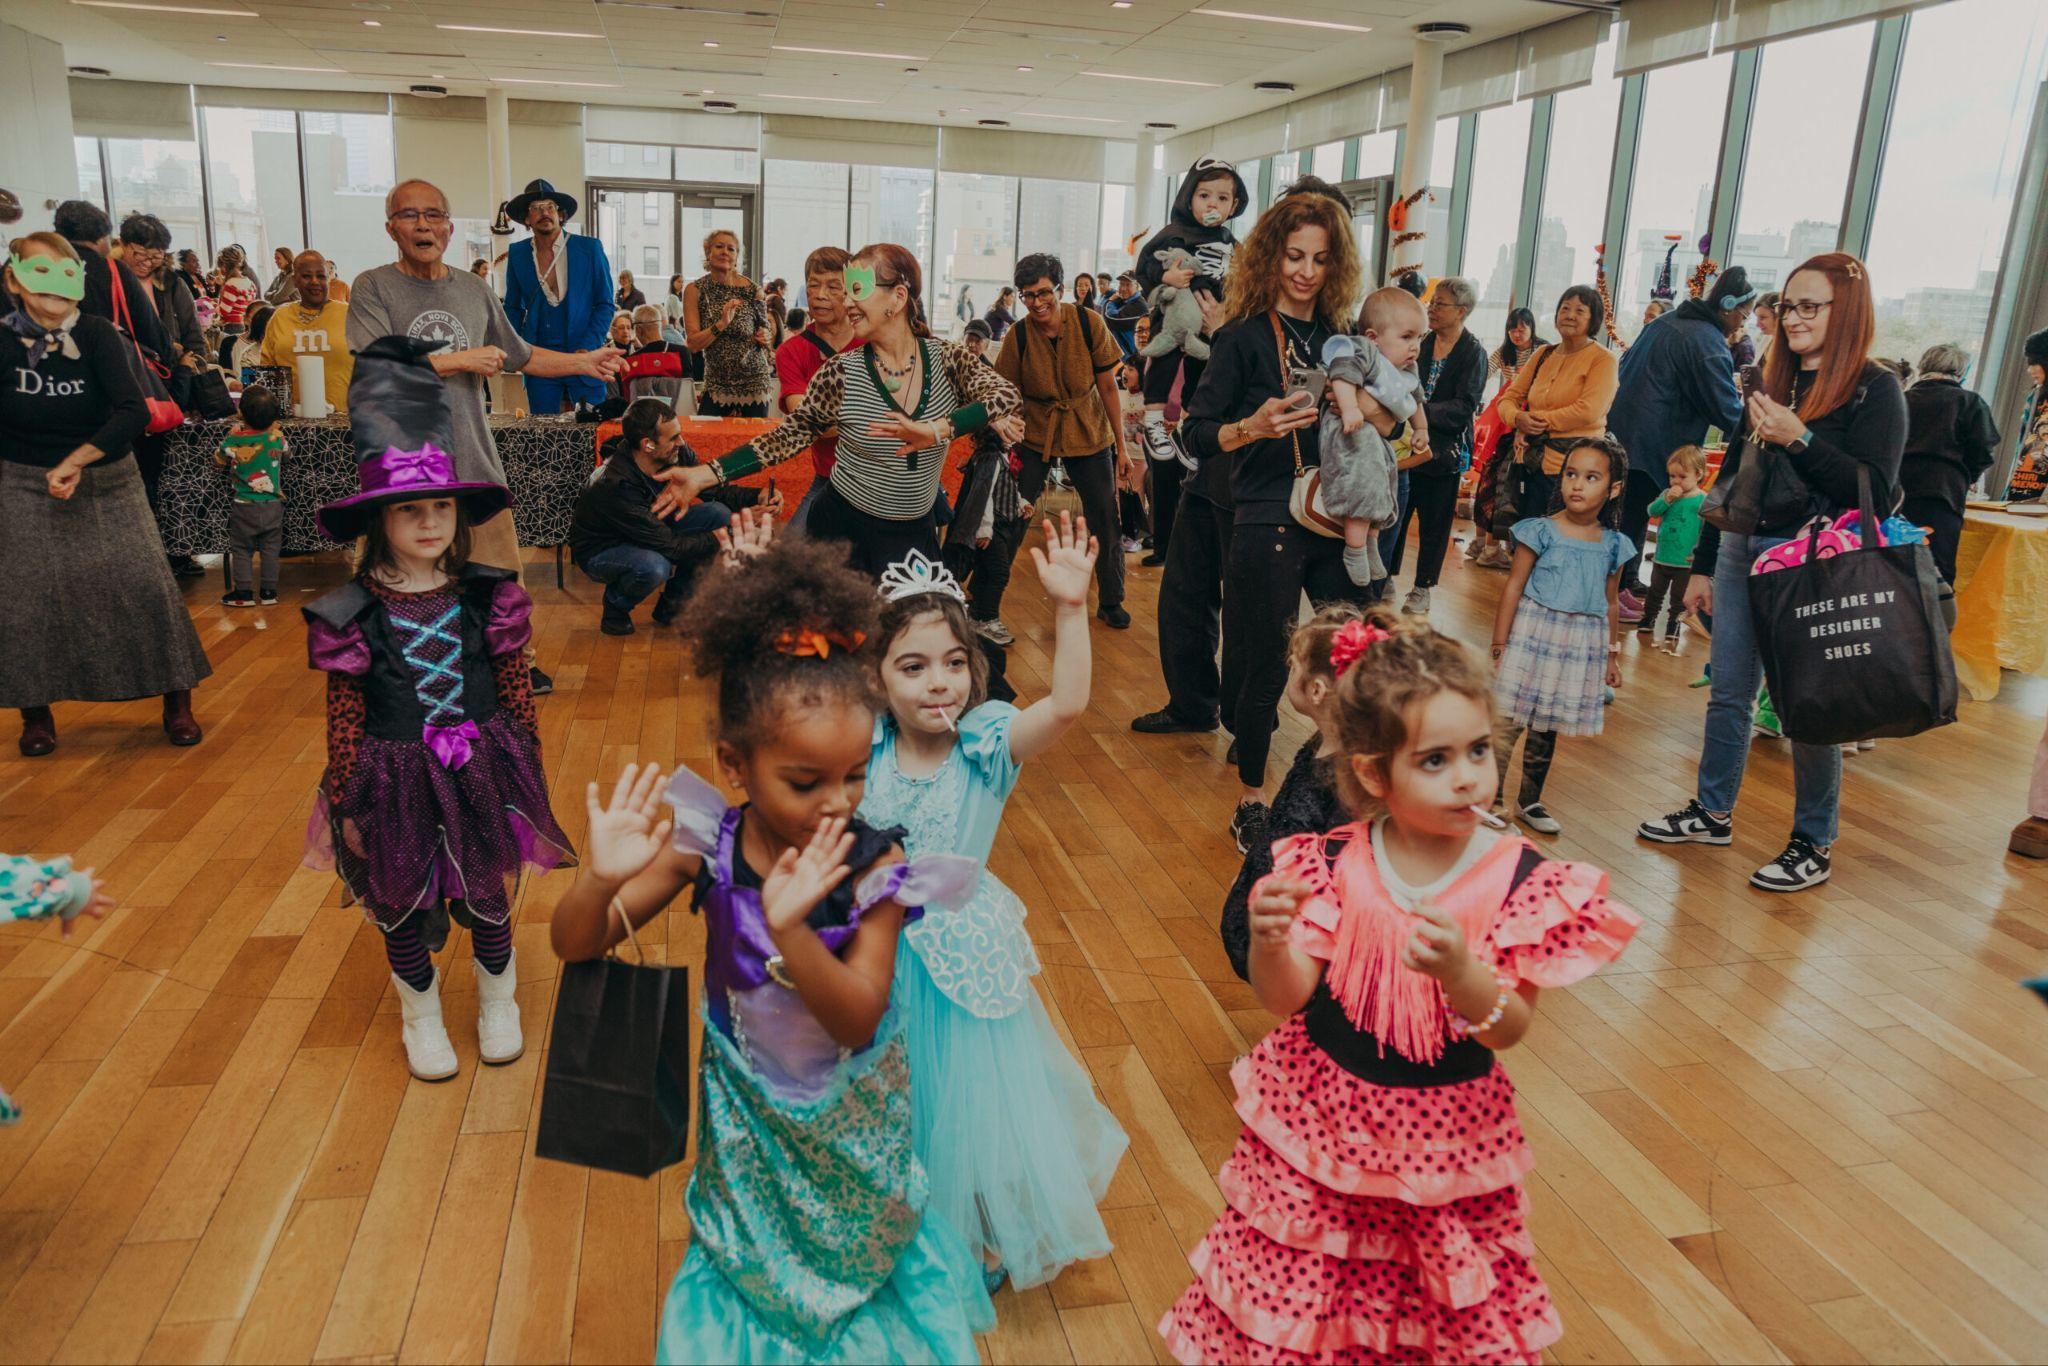
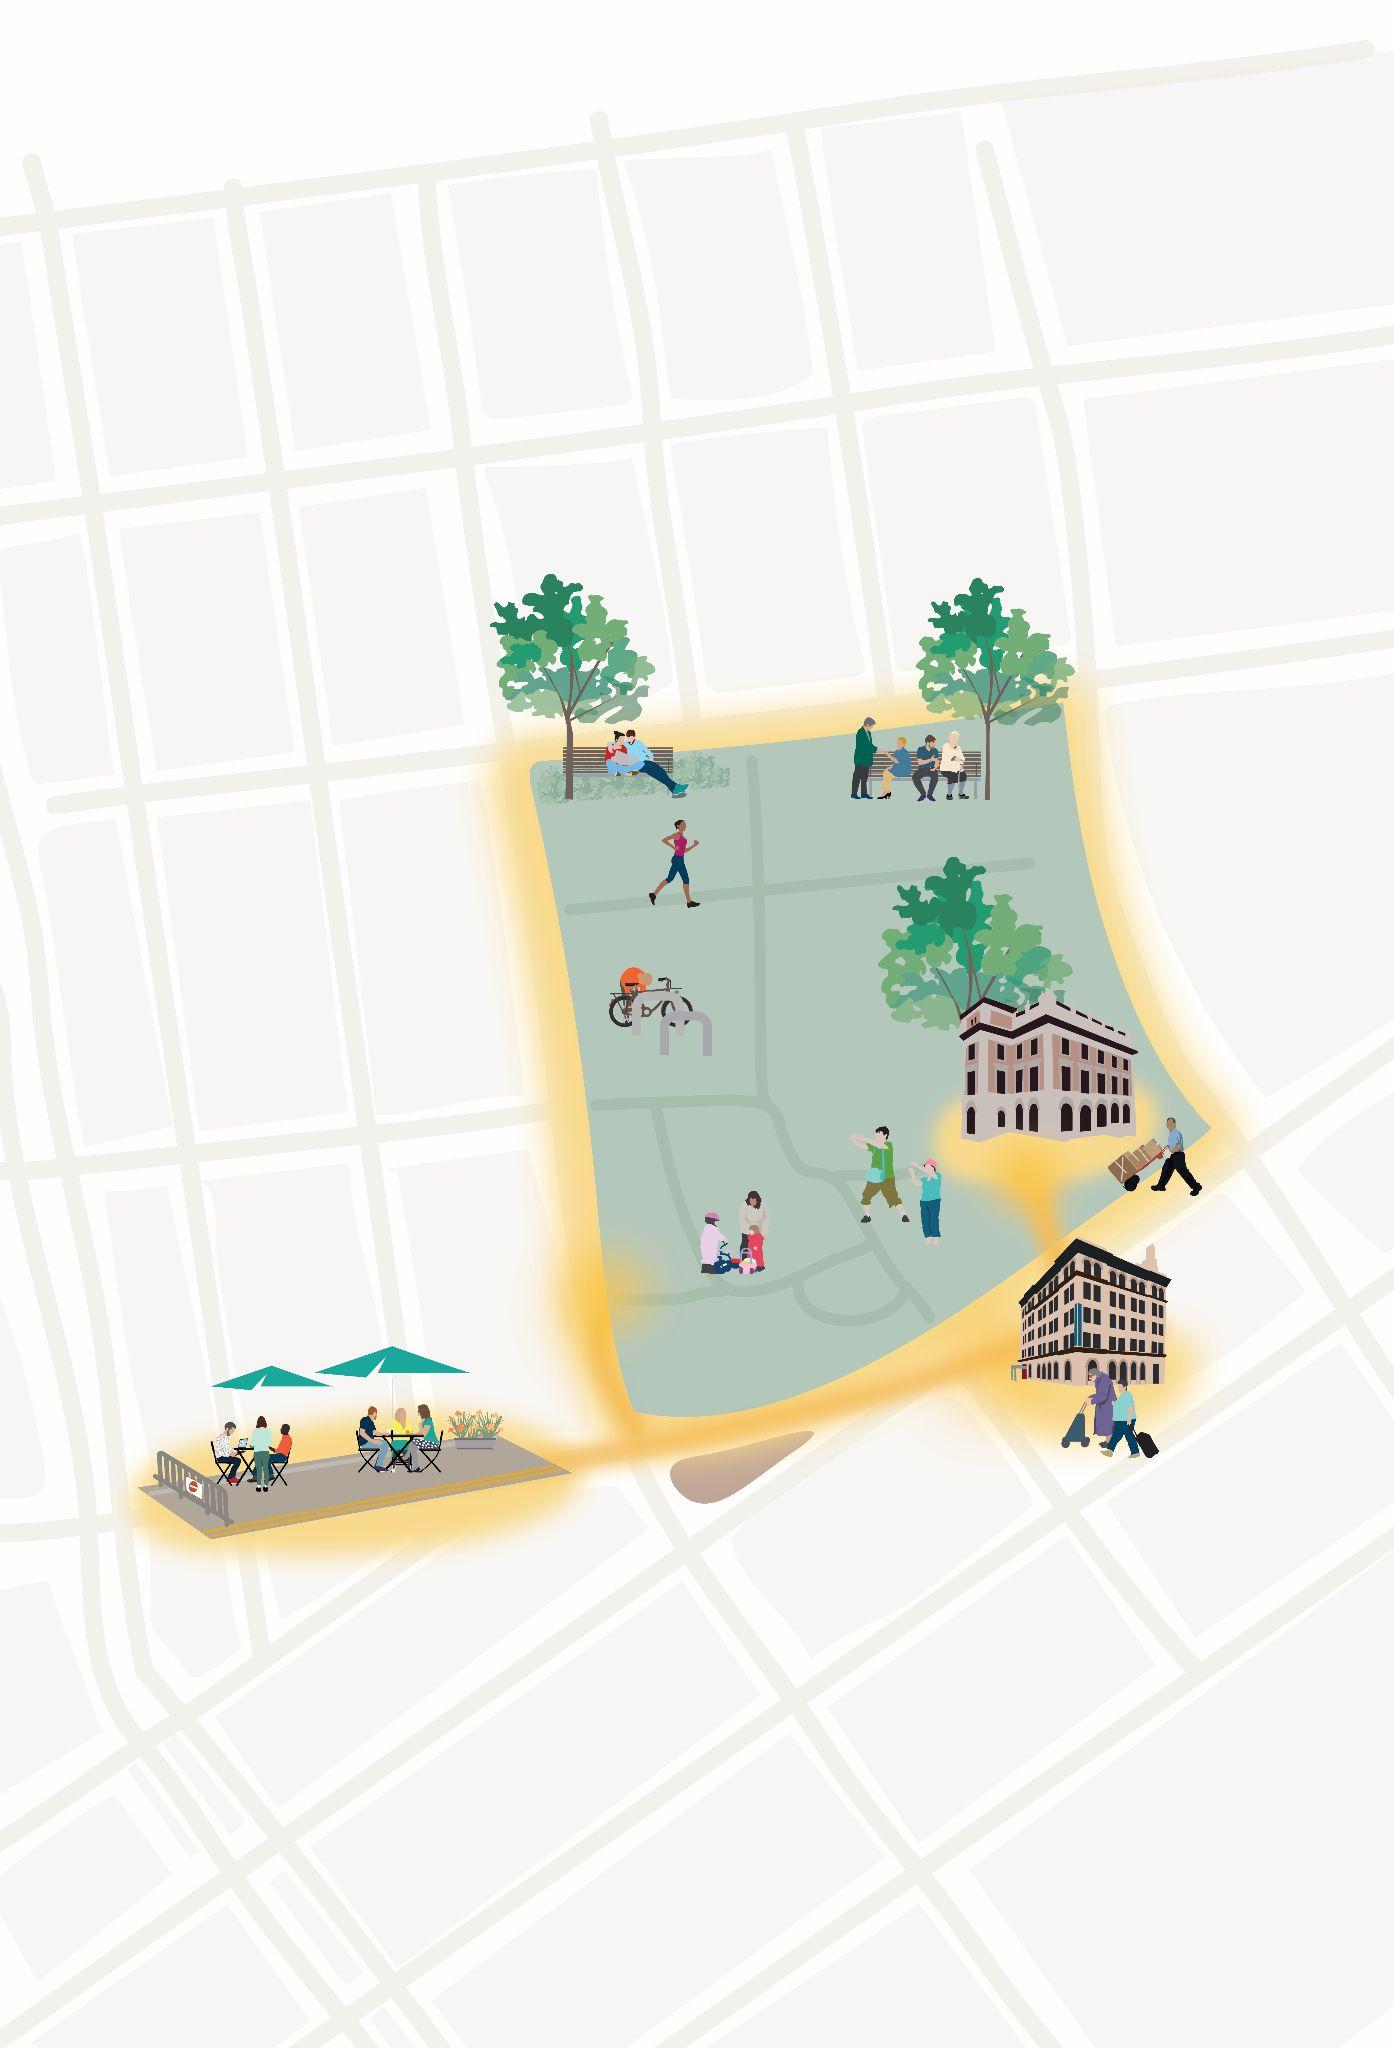
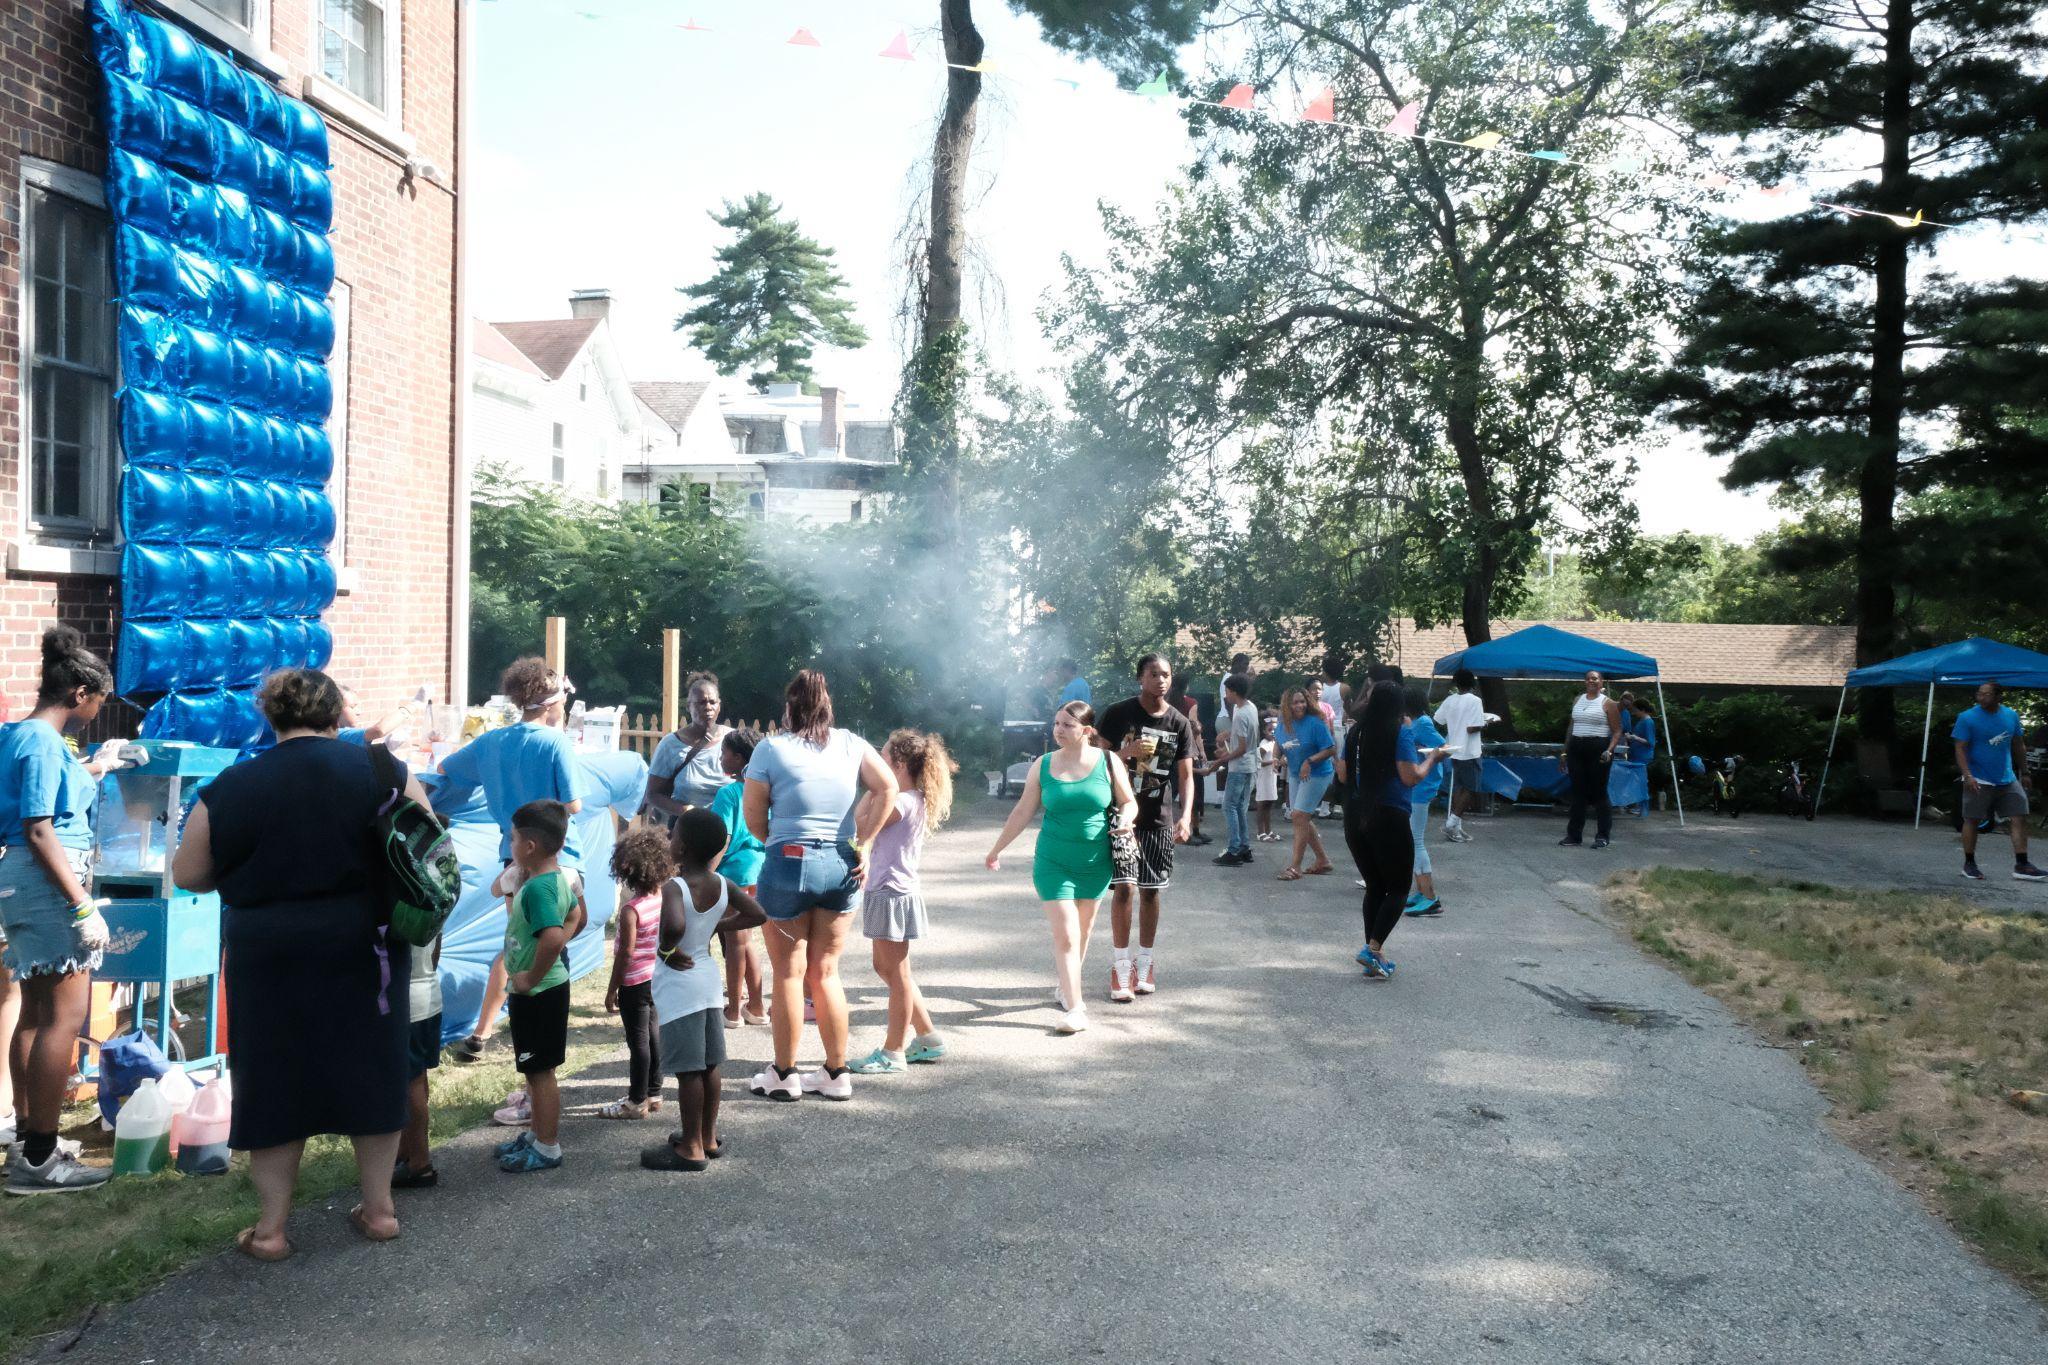
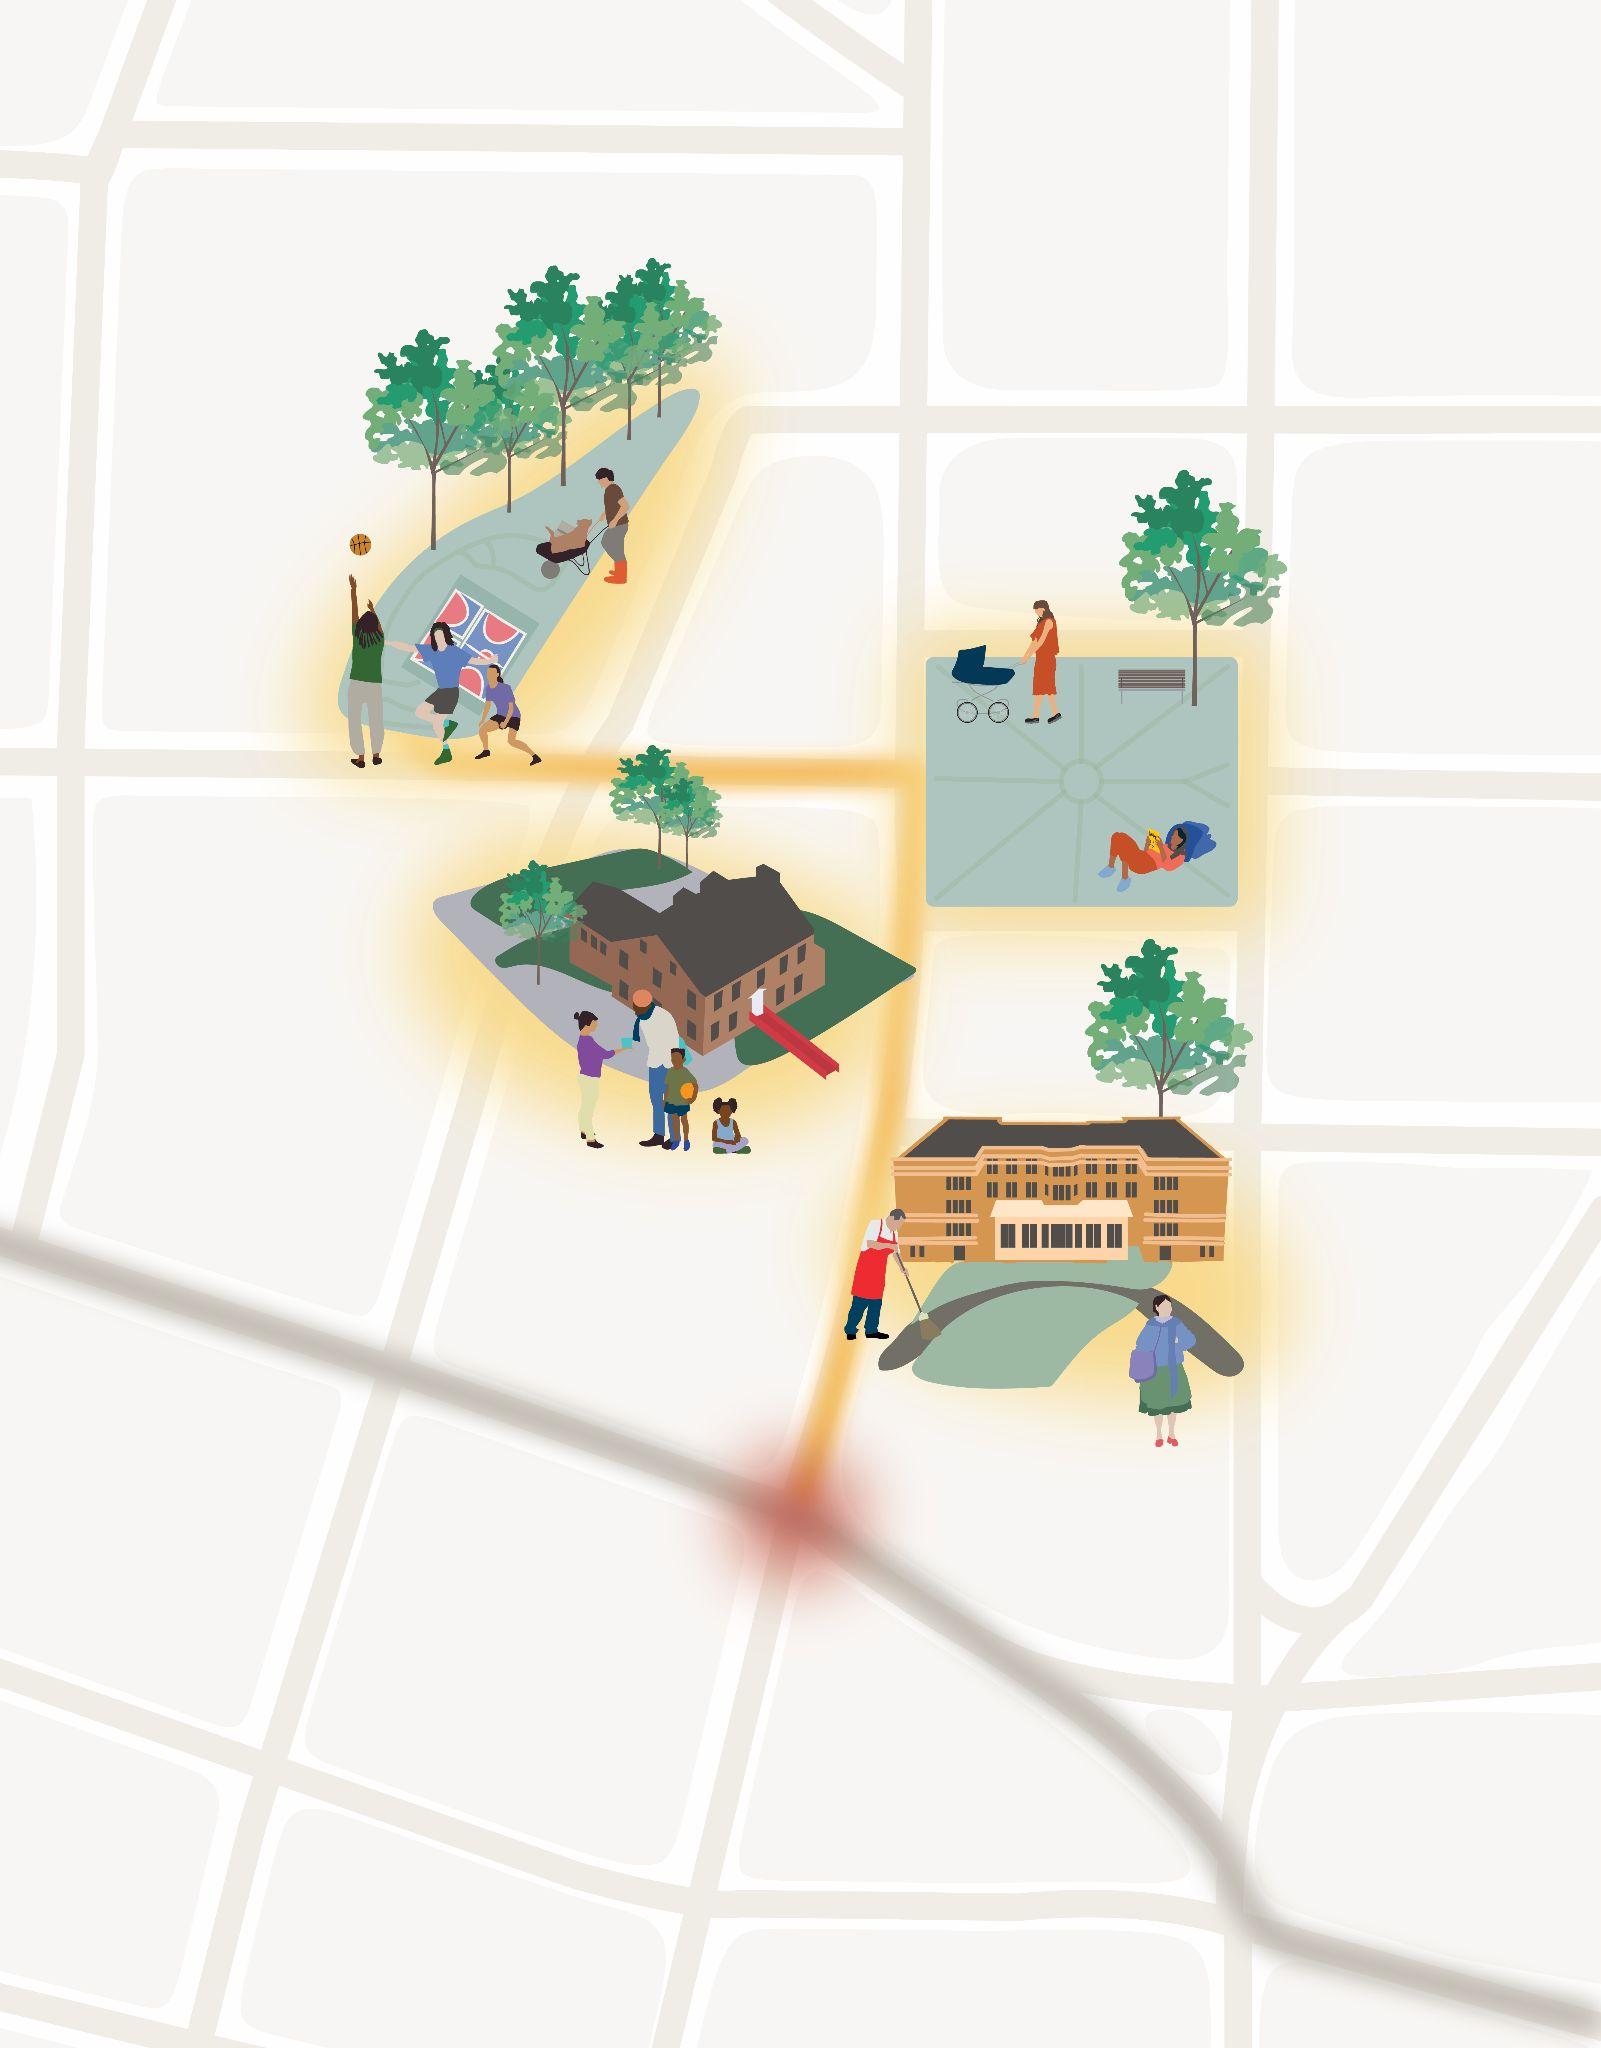
Chances are, these are in public spaces, which play a crucial role in making city living more convenient, communal, and affordable. Spaces like parks, libraries, recreation centers, streets, plazas, and community gardens form the backbone of a city’s public social infrastructure — the physical places that shape our capacity to interact. These are the spaces where community begins: where you nod to a familiar face, play a game of chess, throw a block party with your neighbors, or simply wait for the bus.
In an era marked by deepening political polarization, declining trust in institutions, dire need for affordable housing, and fears of social isolation, the importance of shared physical space has taken on renewed urgency. Across many societies, people are increasingly separated — by income, identity, ideology, and digital life. In NewYork and around the world, many are worrying about where they’ll live, the safety and quality of public transportation, and access to affordable food, childcare, and medical care. These are essential
components of livability, but meeting these fundamental needs is not enough to make a city livable; people need places to coexist and gather outside of home and work. Everyday public places are among the few settings where people encounter difference in informal, humanizing ways. As Jan Gehl has written since the 1960s, public life in well-designed public spaces is fundamental to safe, enjoyable urban life: it is where we see and are seen, where coexistence becomes tangible, and where we practice shared civic culture through
everyday interactions.5
Research shows that the spaces that bring us together help us weather many crises. Investing in the social infrastructure that supports public life is one of the most effective ways to strengthen communities from within. In a series of influential sociological books and research projects, including Palaces for the People and Heat Wave, 6 Eric Klinenberg has demonstrated how social infrastructure fosters democratic participation, economic opportunity, and social mobility, as well as how it can make neighborhoods better connected and more resilient in times of crises. While the return on investment of public space can appear less tangible than that of services like housing or food security, it is essential for a healthy, democratic, resilient society. Despite this, social infrastructure faces key challenges across North America.
There is a gap between what people need and what they can access. For example, recreational facilities and programming once made up nearly one-third of the NYC Parks budget. Today it represents around 5%.7
There is a gap in access between neighborhoods, with social infrastructure unevenly distributed based on demographic factors. For example, in a study of the 100 largest U.S. cities, neighborhoods where most residents are people of color have about 44% less park space than predominantly white neighborhoods. Low-income neighborhoods average 42% less park acreage per person than high-income neighborhoods.8
There is a gap between what people value and what their elected officials and civil servants deliver. For example, 84% of NewYork City residents believe libraries should receive an increase in funding, though the budget for the city’s three public library systems hovers at less than 0.5% of the city’s budget.9
There is a gap in processes and resources that make it easy and sustainable for communities to program and steward public spaces, as many often encounter cumbersome permits and insurance requirements.
There is a gap in how the private sector actors who benefit from quality public spaces are expected to contribute to it. For example, an Emory University study revealed how U.S. cities that invested $10 million in public spaces (e.g., pedestrian streets and bike lanes) saw a 10% increase in nearby property values.10
These gaps persist despite the well-documented benefits of public space to public health, social integration, climate resilience, and more. Parks and public spaces frequently rely on piecemeal funding and stewardship models, resulting in stark disparities in quality and access between neighborhoods. Without sustained public investment and coordinated leadership, these spaces cannot fulfill their full civic potential.
Study Overview
This report responds to these challenges and opportunities by examining how social infrastructure
functions across three distinct New York communities — the Lower East Side, Flatbush, and Poughkeepsie — and identifying what makes these spaces successful. Through a mixed-methods approach using public life observation, surveys, community engagement, and spatial analysis, the research explores three core questions:
● What public places function as social infrastructure?
● Which factors — design, programming, operations, funding, and more — make these sites work?
● What shapes social connection in these spaces?
This work informs recommendations and a framework for policymakers, practitioners and advocates interested in improving how cities plan, design, and manage social infrastructure as connected neighborhood spaces that support everyday life.
The interdisciplinary research team brings together NYU’s Institute for Public Knowledge, led by Klinenberg, and Gehl, a global urban design practice focused on public life. Klinenberg’s work provides the theoretical and empirical foundation for understanding why social infrastructure matters. Gehl’s research — including a recent global study of social infrastructure — demonstrates how different types of places collectively support everyday social life.2
One key finding in Gehl’s study was that social infrastructure can be grouped into three types, organized
around different social outcomes:
● Hangouts are spaces for people of all backgrounds to linger and spend time in coexistence with each other.
● Havens are spaces for people to build deep relationships, often around shared identity.
● Hubs are spaces where people can build community through experiences that bridge different backgrounds.
Together, these place types form an ecosystem that supports both the practical and social dimensions of daily life.
Findings
The findings of this study build on this knowledge, revealing how public social infrastructure is best positioned for outcomes when it meets basic human, site, and neighborhood needs:
● Human Needs: People seek out social infrastructure spaces to meet everyday needs — to rest, create, learn, play — in a social environment.
● Site Needs: These spaces need meaningful resources for features like design, programming, and operations in order to remain effective.
● Neighborhood Needs: A diverse mix of high-quality, accessible spaces expands opportunities for the social connections that form healthy, resilient societies.
Successful social infrastructure is defined by a variety of accessible,
welcoming indoor and outdoor spaces embedded within neighborhoods. At their best, they function as a system of everyday destinations — places where people do what they need to do and love to do. These essential functions draw people in; social benefits follow.
This aligns with emerging policy directions that call for treating different social infrastructure sites — parks, libraries, streets, recreation centers and more — as a mutually reinforcing civic system. One where transportation corridors double as social spaces, parks become ecological classrooms, and libraries become social safe havens.
Recommendations
Realizing this vision of connected and interdependent public spaces requires social infrastructure be treated as essential urban infrastructure — meaning it is planned, funded, and governed with the same seriousness as housing, transportation, and utilities.
This includes developing new and creative mechanisms for funding social infrastructure capital, operating and stewardship expenses. It also requires intentional study and planning, with local partners, at the neighborhood level to understand where there are gaps in access and quality. With new funding and planning paradigms, cities should:
● Supercharge the library
● Revamp recreation and play spaces for all ages
● Make our gathering spaces comfortable and resilient for
extreme weather
● Transform streets into safe, social neighborhood connectors
● Hire and partner with communities to run and activate public spaces
● Assess neighborhood needs and fill gaps
These upgrades to social infrastructure can deliver by improving people’s everyday lives. As a visible neighborhood investment, social infrastructure aligns with the agendas of many mayors, including NewYork City Mayor Zohran Mamdani’s results-oriented first 100 days in office.
To invest in these places is to commit to the social fabric that underpins more equal societies. These are the places where democracy is not an abstract concept, but something lived through everyday encounters, shared experiences, and collective presence in public life. They are places where trust is built, where differences are negotiated, and where a sense of common ground can emerge.
No matter the context, the promise is clear: by providing essential services and extraordinary experiences in convenient locations, social infrastructure makes both the affordable and the joyful city possible. Today, in societies across the planet, we need these spaces and the people who run them more than ever.
Six recommendations for how to invest in upstream democracy and make the more joyful, affordable city possible.
Supercharge the library
Make ourgathering spaces comfortable and resilient for extreme weather
Hire and partnerwith communities to run and activate public spaces
Revamp play and recreational spaces forall ages
Transform streets into safe, social neighborhood connectors
Assess neighborhood social infrastructure needs and fill gaps
Study Overview
This study sought to identify the key drivers of successful social infrastructure networks
Social infrastructure spaces are the physical places that shape our capacity to interact, including libraries, parks, playgrounds, community organizations, recreation centers, and streets. When well-supported, these spaces foster everyday social connections that strengthen communities and contribute to broader civic outcomes.Yet across the United States, social infrastructure is often under-funded, fragmented, and undervalued. Limited funding, siloed systems, and a lack of coordinated long-term planning result in networks that are insufficient, disconnected, and difficult to sustain.
This study seeks to bridge the gap between our needs for social infrastructure and the resources allocated to it. Building on prior research — including Eric Klinenberg’s Palaces for the People, the U.S. Surgeon General’s 2023 report on loneliness, and Gehl’s global study on “Havens, Hubs & Hangouts” — the project advances a more holistic understanding of how social infrastructure functions and how its value can be better measured, supported, and sustained.1,2,10
Study Locations
It identifies a practical framework and policy recommendations that city leaders and practitioners can apply.
Led by NYU’s Institute for Public Knowledge and Gehl, the research explores three core questions: (1) What public places function as social infrastructure?; (2) Which factors — design, programming, operations, funding, and more — make these sites work?; (3) What shapes social connection in these spaces?
Focusing on NewYork State, the team developed profiles of 14 potential study areas across New York City, Western and Central NewYork, and the Hudson Valley. From these, three communities — the Lower East Side, Flatbush, and Poughkeepsie, with a focus on Downtown and the North Side —
were selected for in-depth analysis. Working closely with local partners and community leaders, the team examined 35 sites using a mixed-methods approach.
Drawing on a review of existing social infrastructure indicators, the study developed an assessment framework to evaluate how design, programming, maintenance, and funding shape social connection. By combining multimethod research designed by IPK’s sociologists and Gehl’s urban planners — including quantitative analysis with field research and observation — the research documents patterns and on-the-ground realities related to how people use social infrastructure and how the quality of social infrastructure impacts a range of social connection outcomes.
Poughkeepsie
Lower East Side Flatbush
Hudson Valley
NewYorkCity
Methods Snapshot
Additional Detail in Appendix
Public Life
Observation
3,080 people observed
Stationary visitor activities — including perceived age and gender, posture, group setting, and activity — were recorded anonymously using the Gehl Public Life App to understand who is present at social infrastructure sites and how they spend time there.
Survey 1,100+ individuals surveyed
A 23-question survey was administered to visitors of 21 social infrastructure sites to examine the types and depth of social connections formed at each site.
Public Space Assessment
28 sites
Spatial quality indicators related to the site’s design, programming, and maintenance were assessed to understand the physical conditions of social infrastructure sites.
Interviews
98 interviewees
Interviews with residents, site operators, and community leaders were conducted to understand the level of social connection, operating model, the quality and needs of social infrastructure sites.
Mapping 12 space types
Distinct social infrastructure space types, ranging from parks and playgrounds to streets and plazas, were mapped based on publicly available datasets and on-site research.
Eye Level City 3 walkshops
Focus Groups
3 focus groups
Focus groups with 2-6 residents were conducted in each study location to understand how key stakeholder groups experience and perceive social infrastructure within their communities.
Groups of 5-14 residents participated in photo-journaling walks, followed by post-walk workshops, to share their lived experiences and perceptions of local social infrastructure sites.
People seekout social infrastructure spaces to meet everyday needs — to rest, create, learn, play — in a social environment.
Social infrastructure
sites take many different forms.
In this study, focus was on public, physical sites. From indoor to outdoor, these play essential roles as public spaces that bring people together, from simply being in the same place while waiting for the bus to playing a pick-up sport with strangers. These spaces complement housing and social services by making neighborhoods livable and providing key outlets for intergenerational and diverse social connections.
And more! Social infrastructure takes shape in different forms depending on the context.
Libraries Parks
Plazas Streets & Sidewalks
Community & Recreation Centers
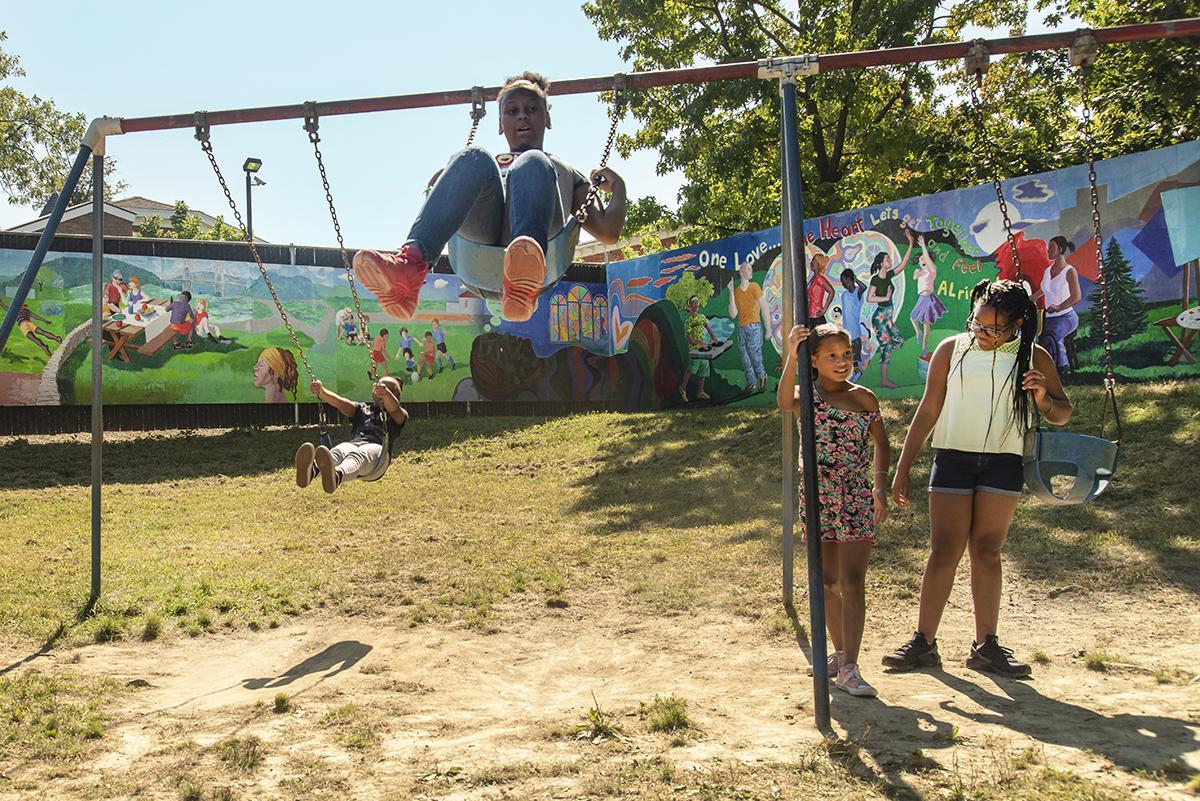
Play Spaces
Sport Courts & Fields
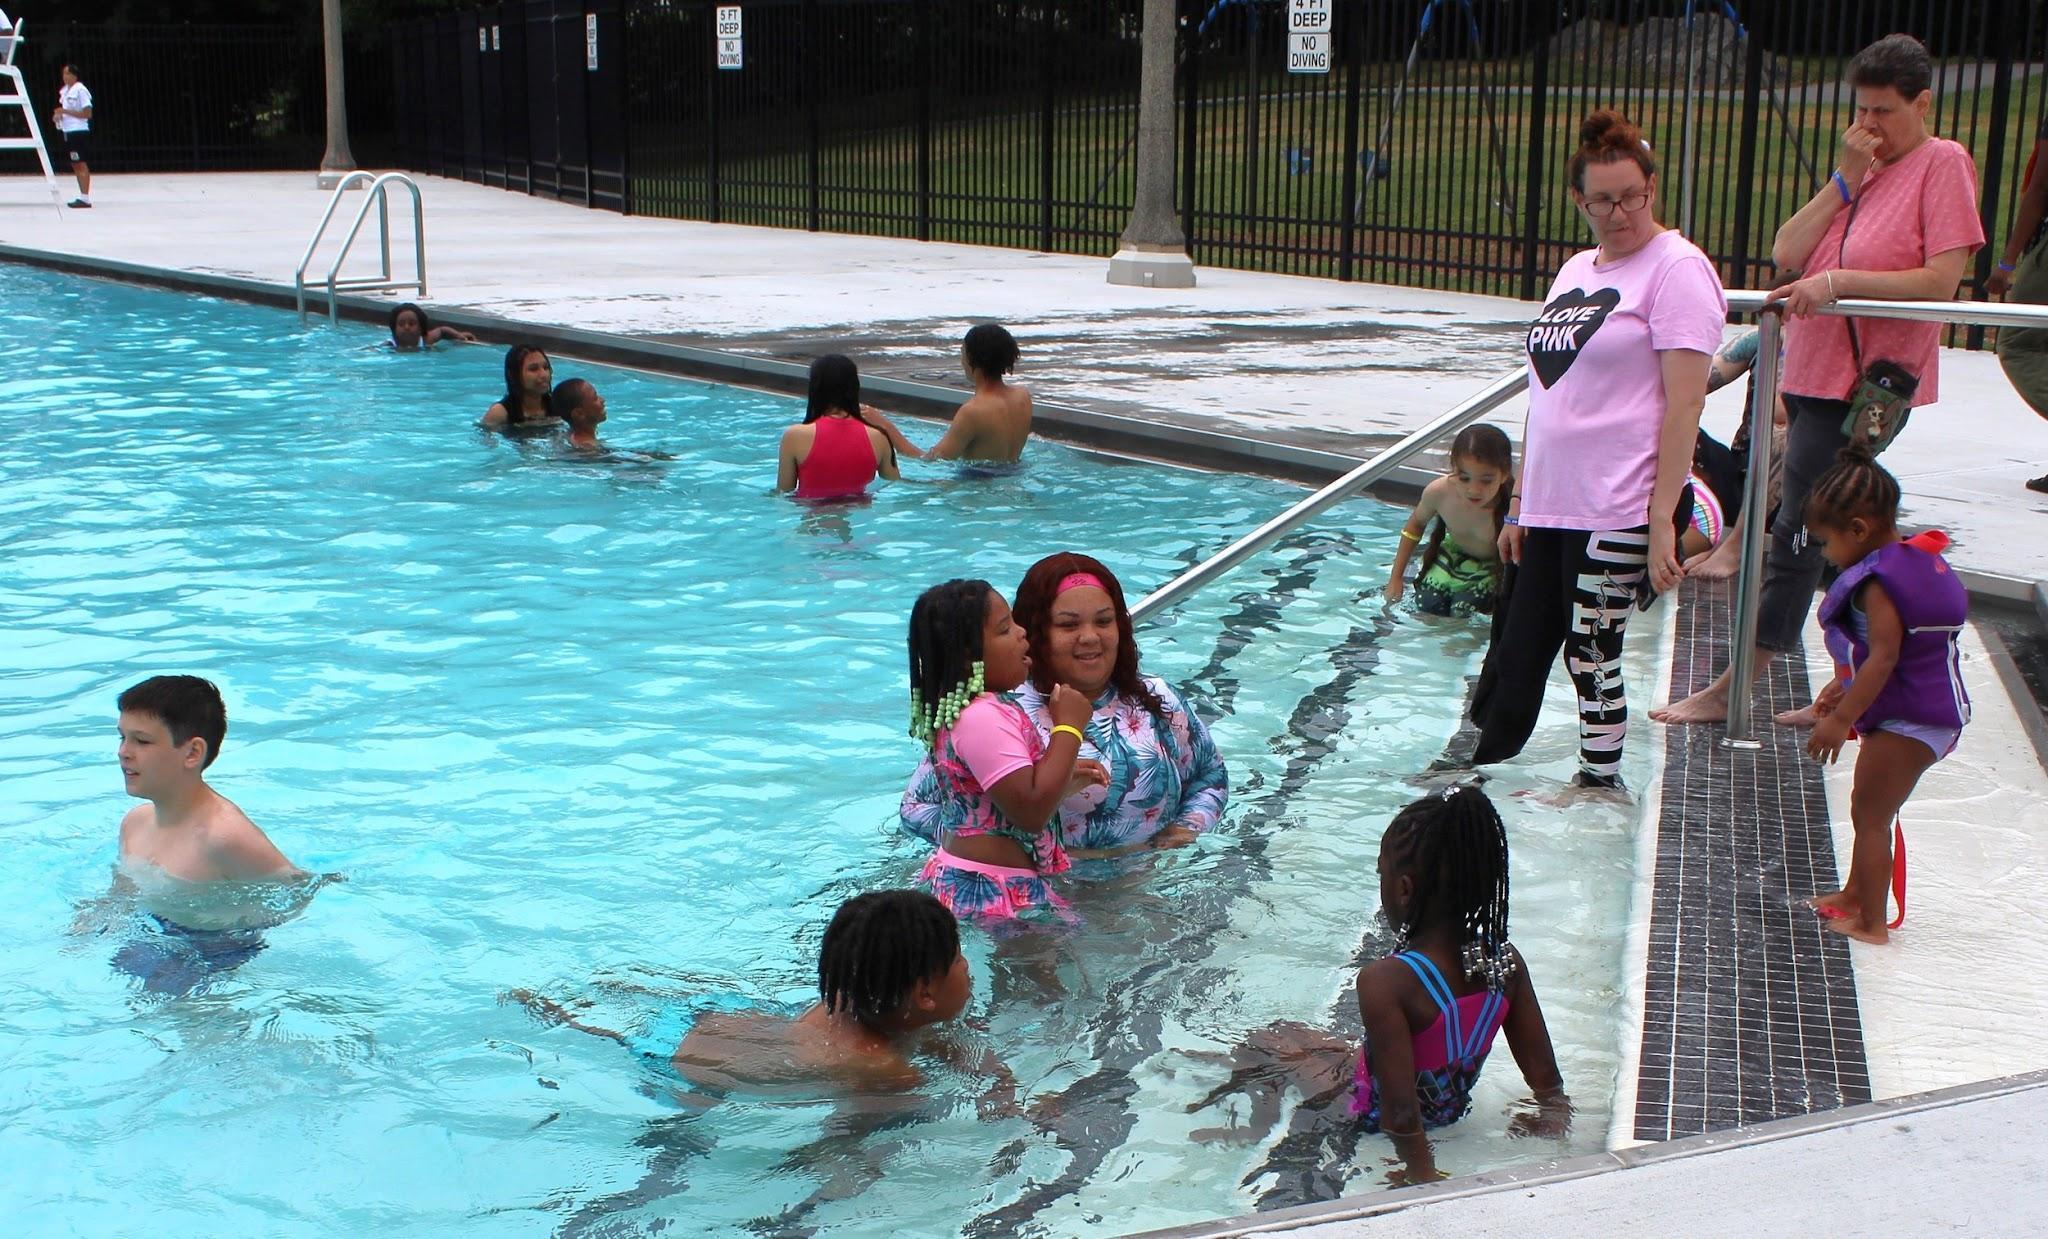
Swimming
Pools
Community Gardens Skateparks Transit Stops
Characteristics of Social Infrastructure
Indoor / Outdoor
Indoor sites provide shelter and are often climate-controlled (e.g., libraries, community centers). Outdoor sites are open-air (e.g., parks, playgrounds, skateparks, dog parks).
Public / Semi-public
Public sites are open to all. Semi-public sites are generally accessible to all but may require participation, membership, or patronage (e.g., recreation centers, community gardens).
Place / Connector
Places have defined edges and are designed for people to stay. Connectors are linear spaces that linkplaces and are designed primarily for movement, often taking the form of streets, sidewalks, or multi-modal transit corridors.
Size
Small sites like pocket parks (<0.25 acres) often serve hyper-local needs (~quarter-mile); medium sites like neighborhood parks (0.25–5 acres) often support general recreation (~quarter- to one-mile); large sites like destination parks (5+ acres) often draw users from a mile or beyond.
Typology
This study examined many different typologies of social infrastructure, listed on the previous page, such as parks, community gardens, play spaces, recreation facilities, plazas, basketball courts, libraries, streets/sidewalks, skateparks, and public markets.
Lt. Federico Narvaez Tot Lot, Flatbush Pier 35, Lower East Side
Flatbush Avenue, Flatbush
Coleman Oval Skatepark, Lower East Side
Manny Cantor Center, Lower East Side
6 & B Community Garden, Lower East Side
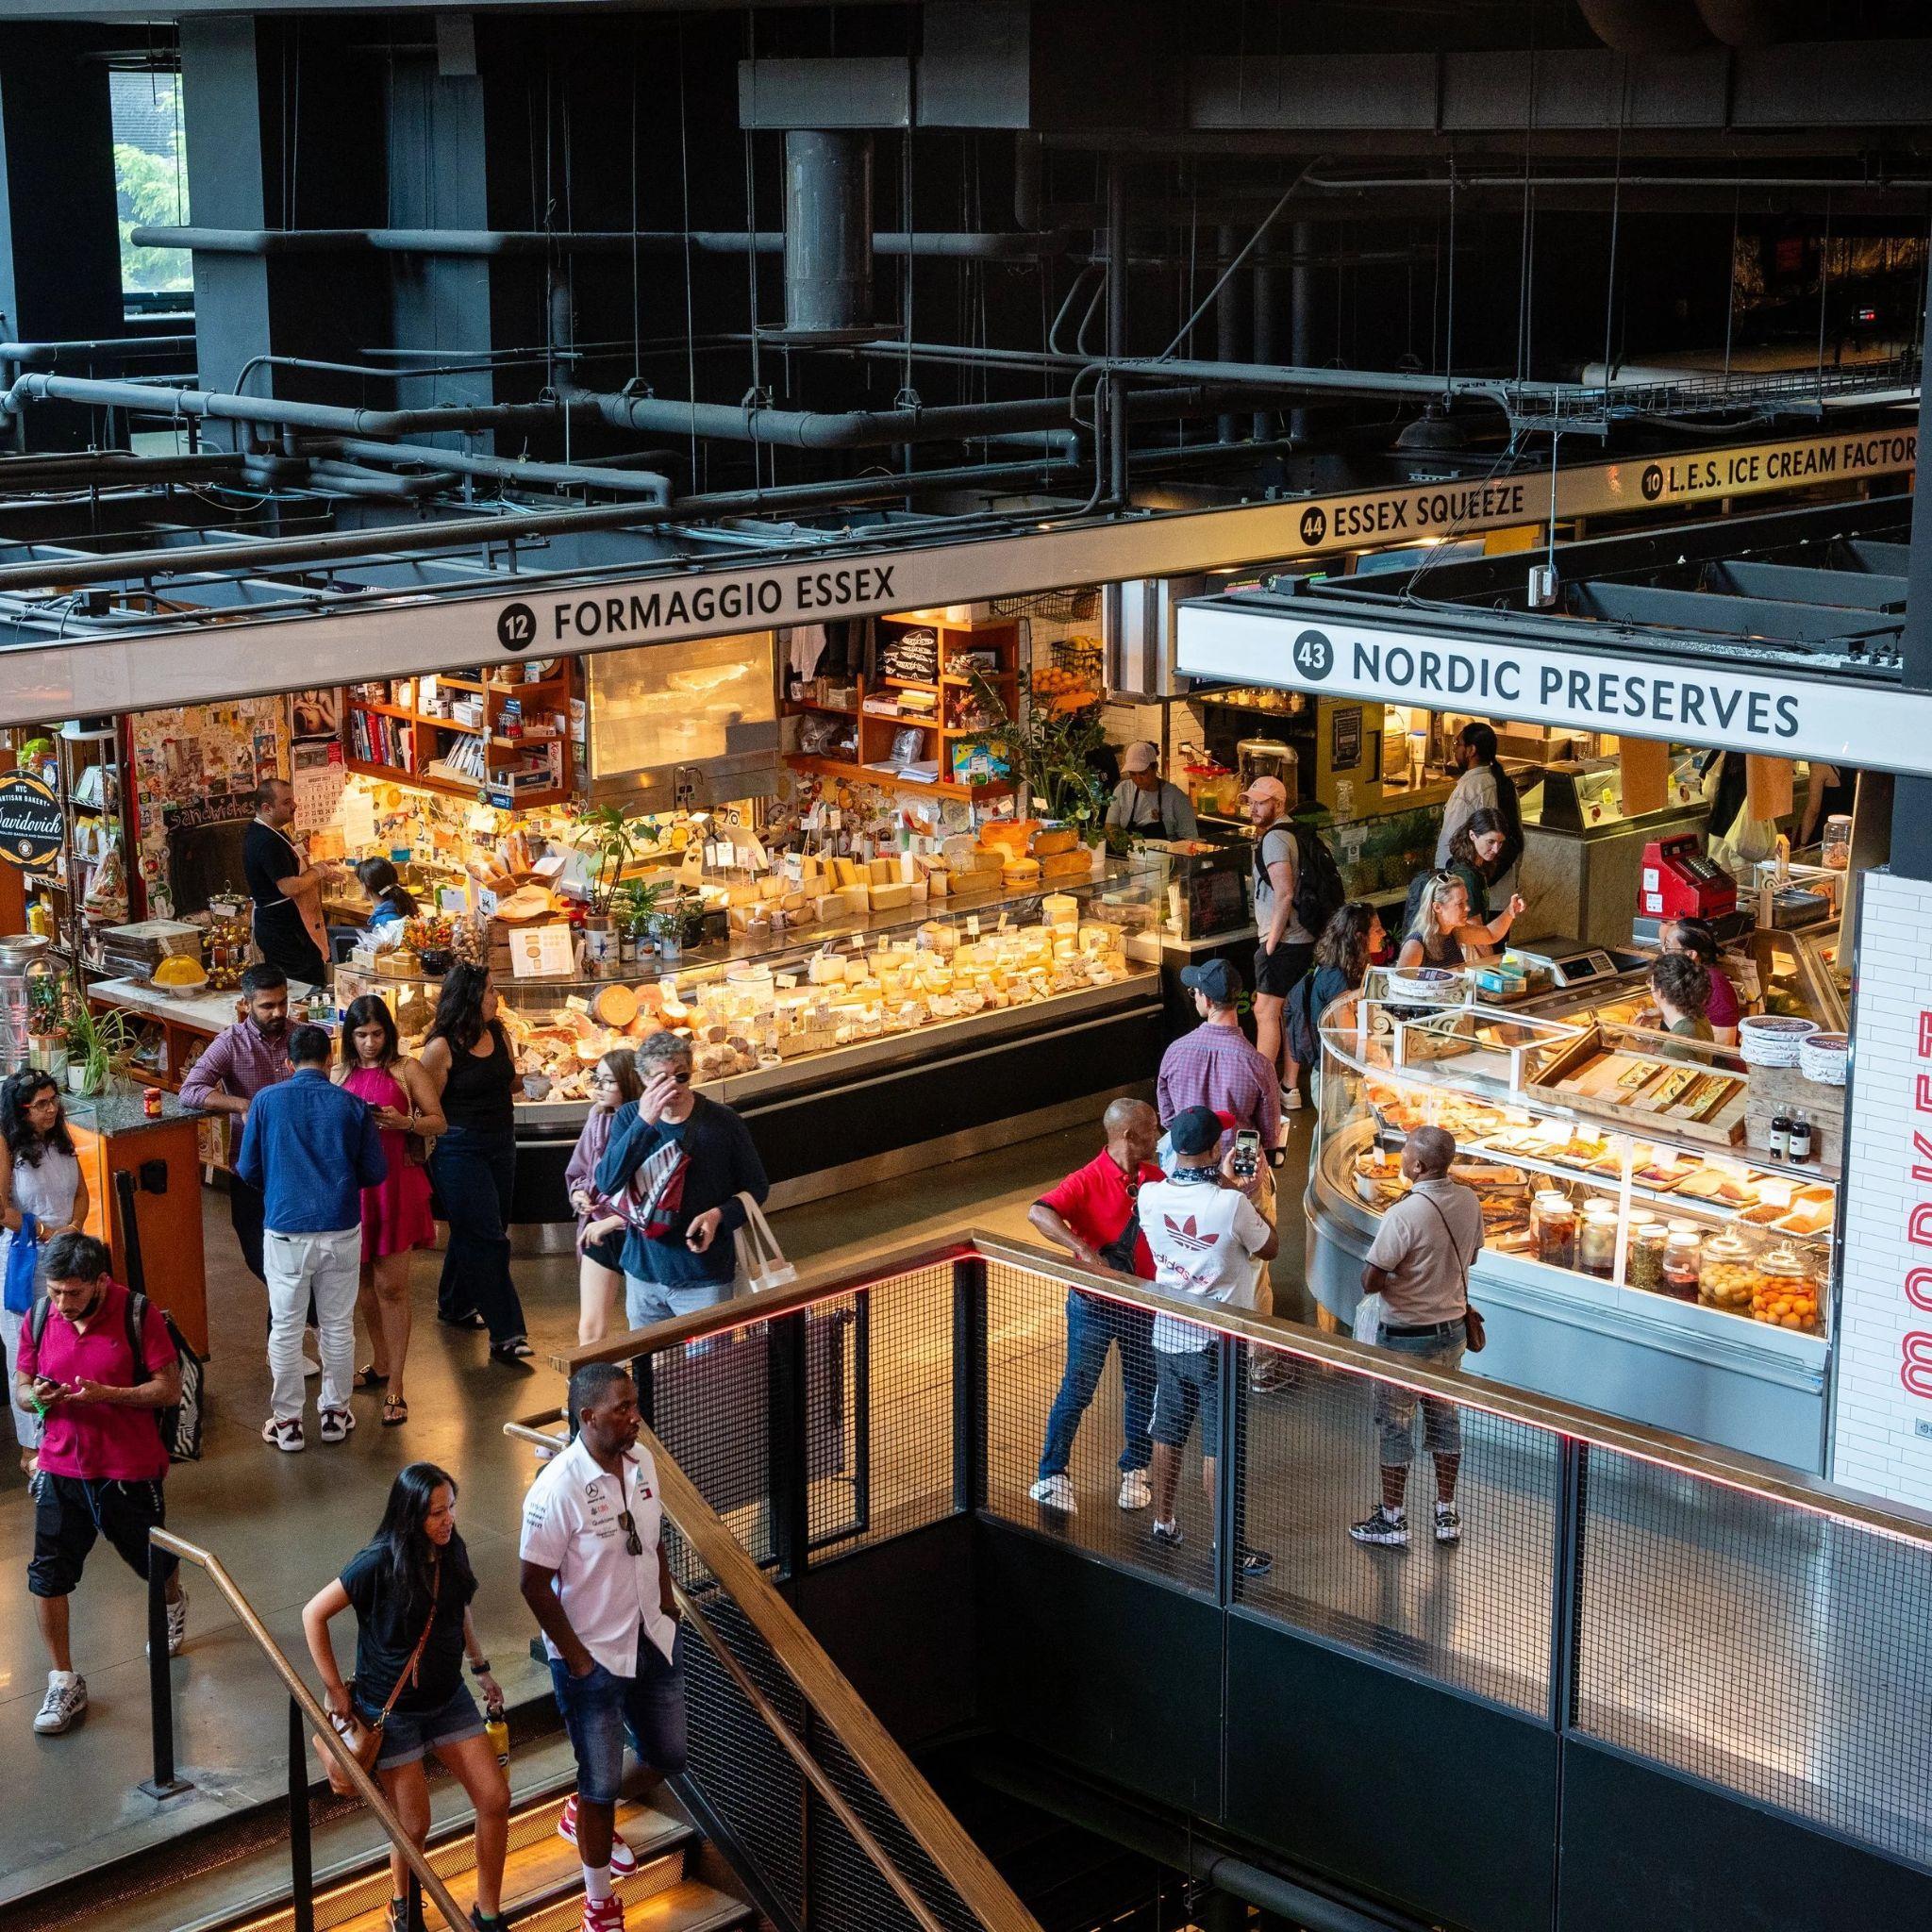
Essex Market, Lower East Side
Malcolm X Park, Poughkeepsie
Tompkins Square Library, Lower East Side
Pershing Avenue Park, Poughkeepsie
At their core, these spaces foster activities people
need and love to do.
While physical social infrastructure may look different depending on the neighborhood, the key is that it provides affordable, enjoyable, social, and convenient gathering places where people can do the essential activities of everyday life. The activities essential to their physical and mental health. Or as Jan Gehl described in Life Between Buildings, the “necessary” activities like commuting to work, studying, and caregiving, as well as the “optional,” like leisurely resting.5
Our research found that the clusters of activities people engaged in centered around four broad activities: resting, playing, creating, and learning. All of these activities happen in the company of others — they’re fun and functional — giving people what they need to survive and thrive.
Cooling
Playing
Playing
Engaged
Skateboarding
Rest Create Play
Learn
Multiple activities co-located or offered in proximity reach a wider audience.
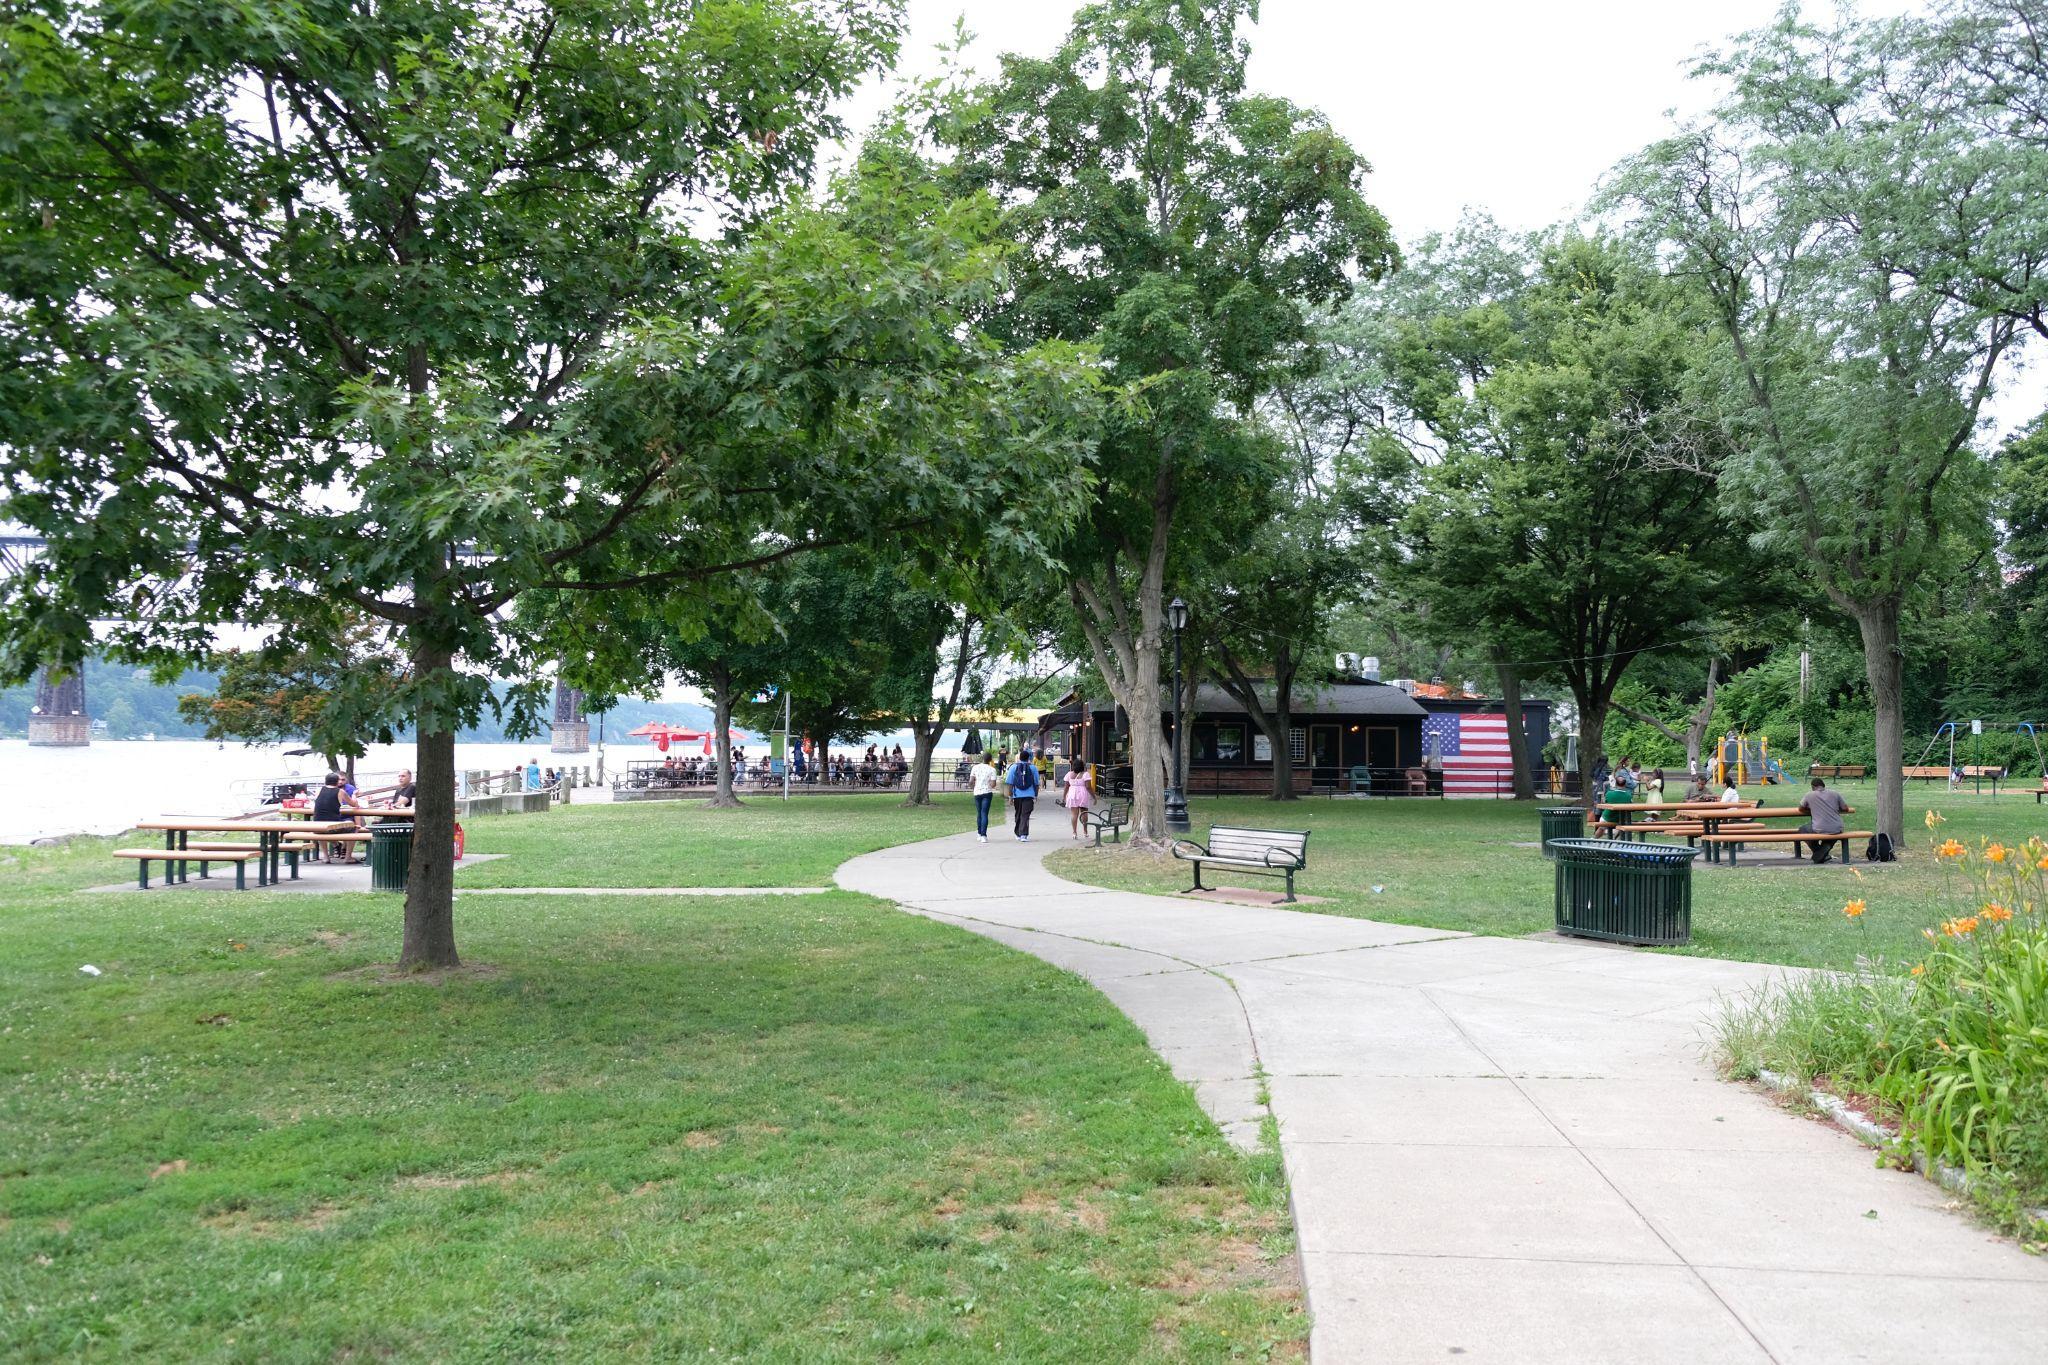
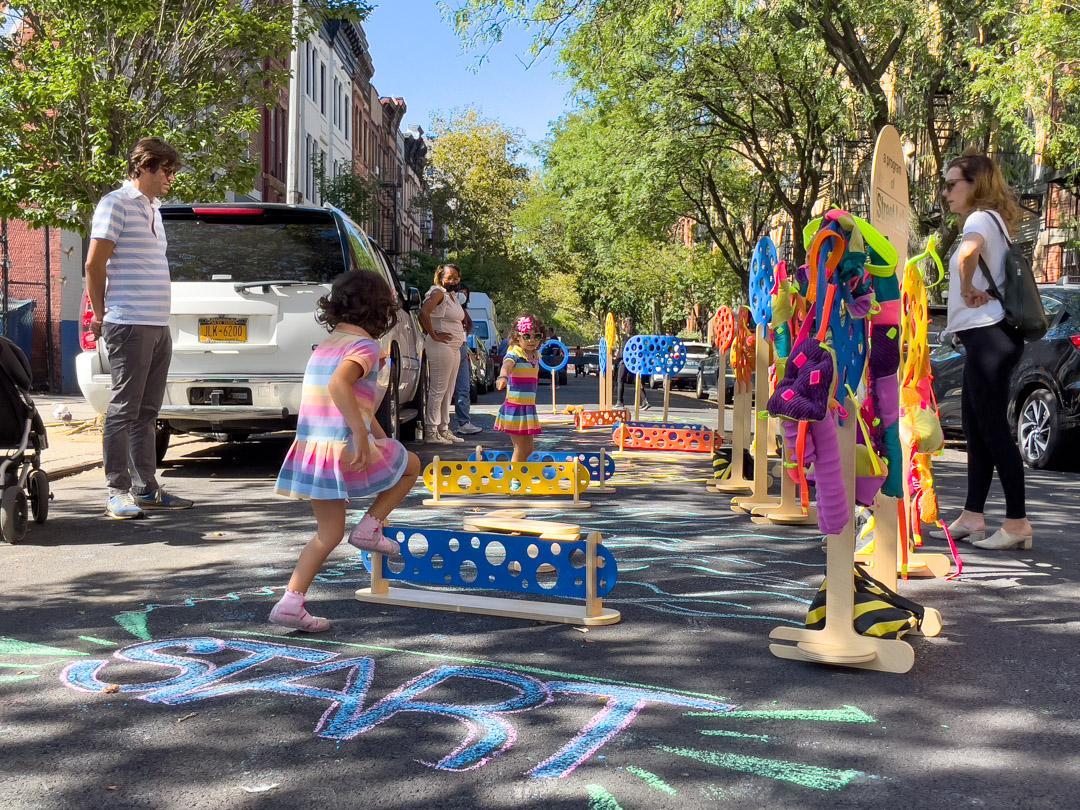
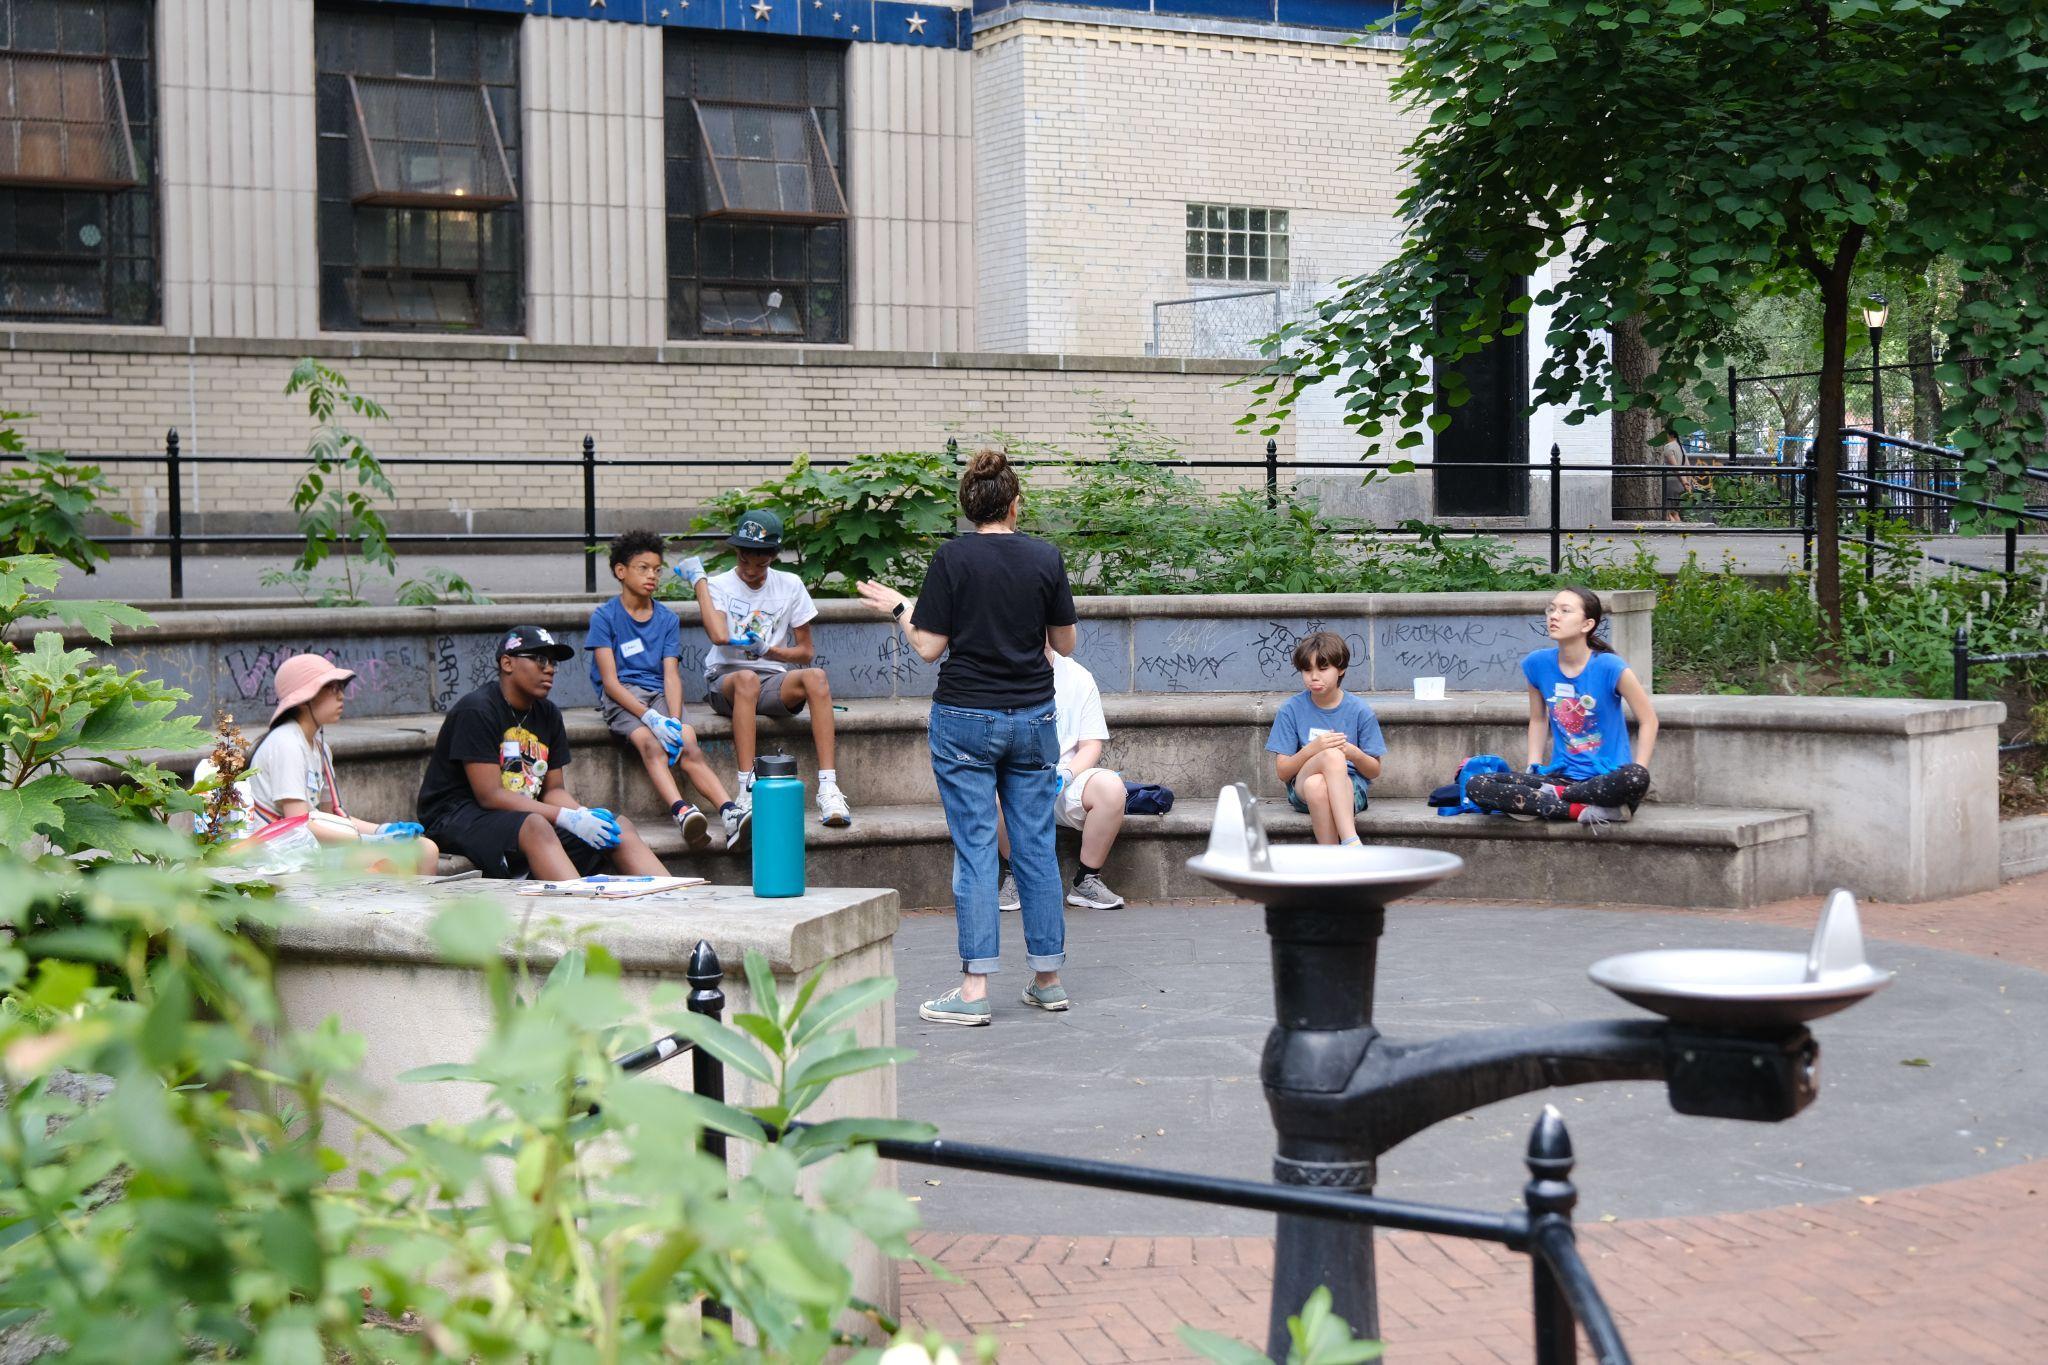
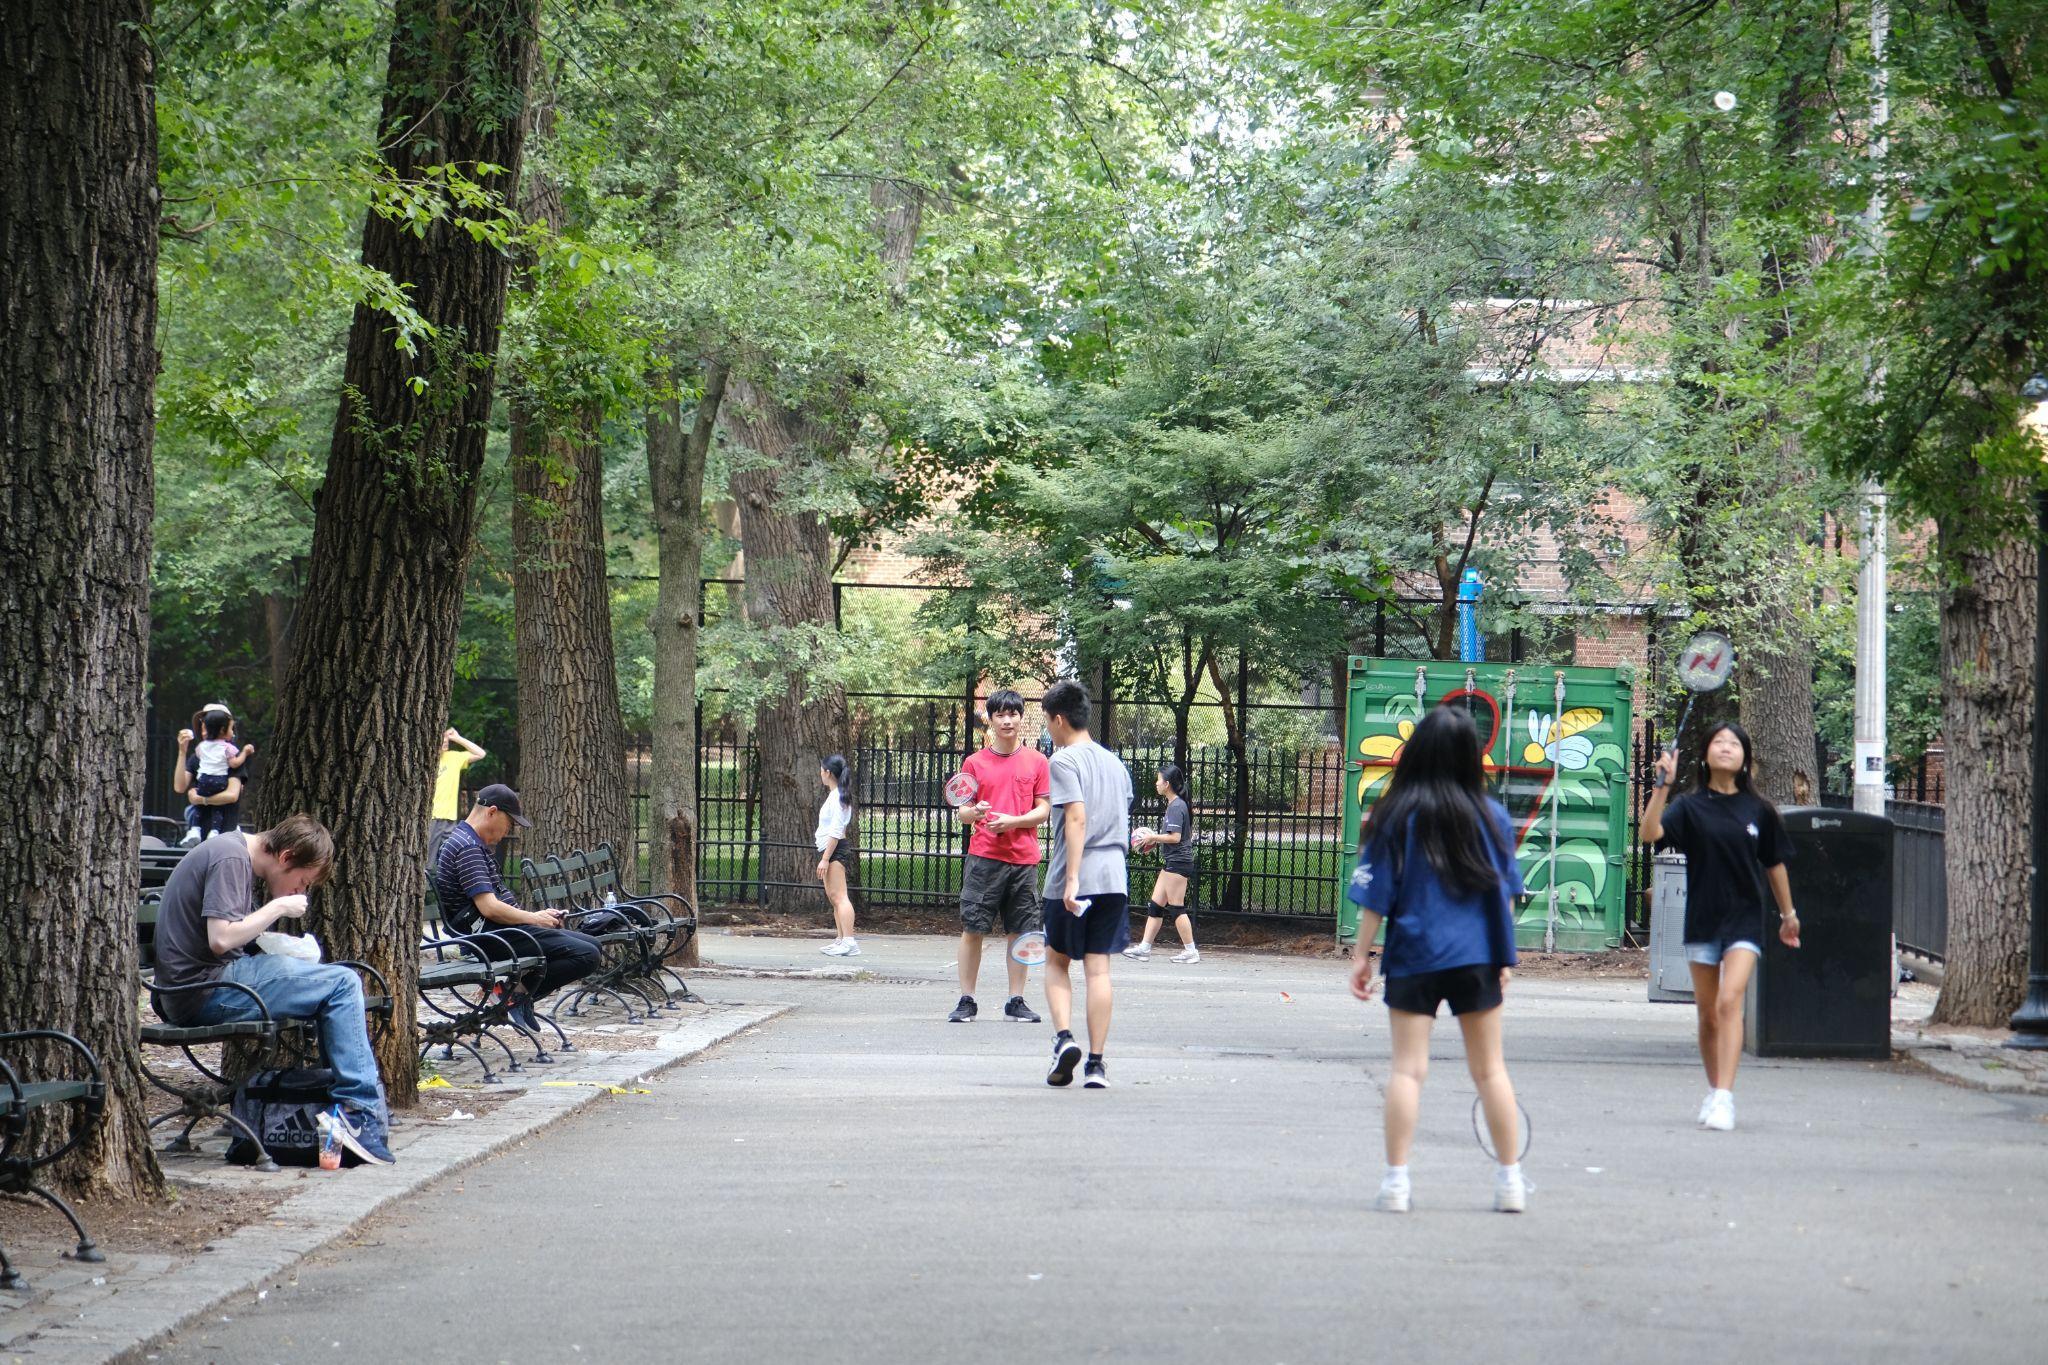
Whether in a permanent public space or a temporary event, clustering areas for different activities encourages people of different backgrounds to mix more easily and participate in shared activities. Seward Park in the Lower East Side has different “rooms,” each of which caters to different age groups based on observation.
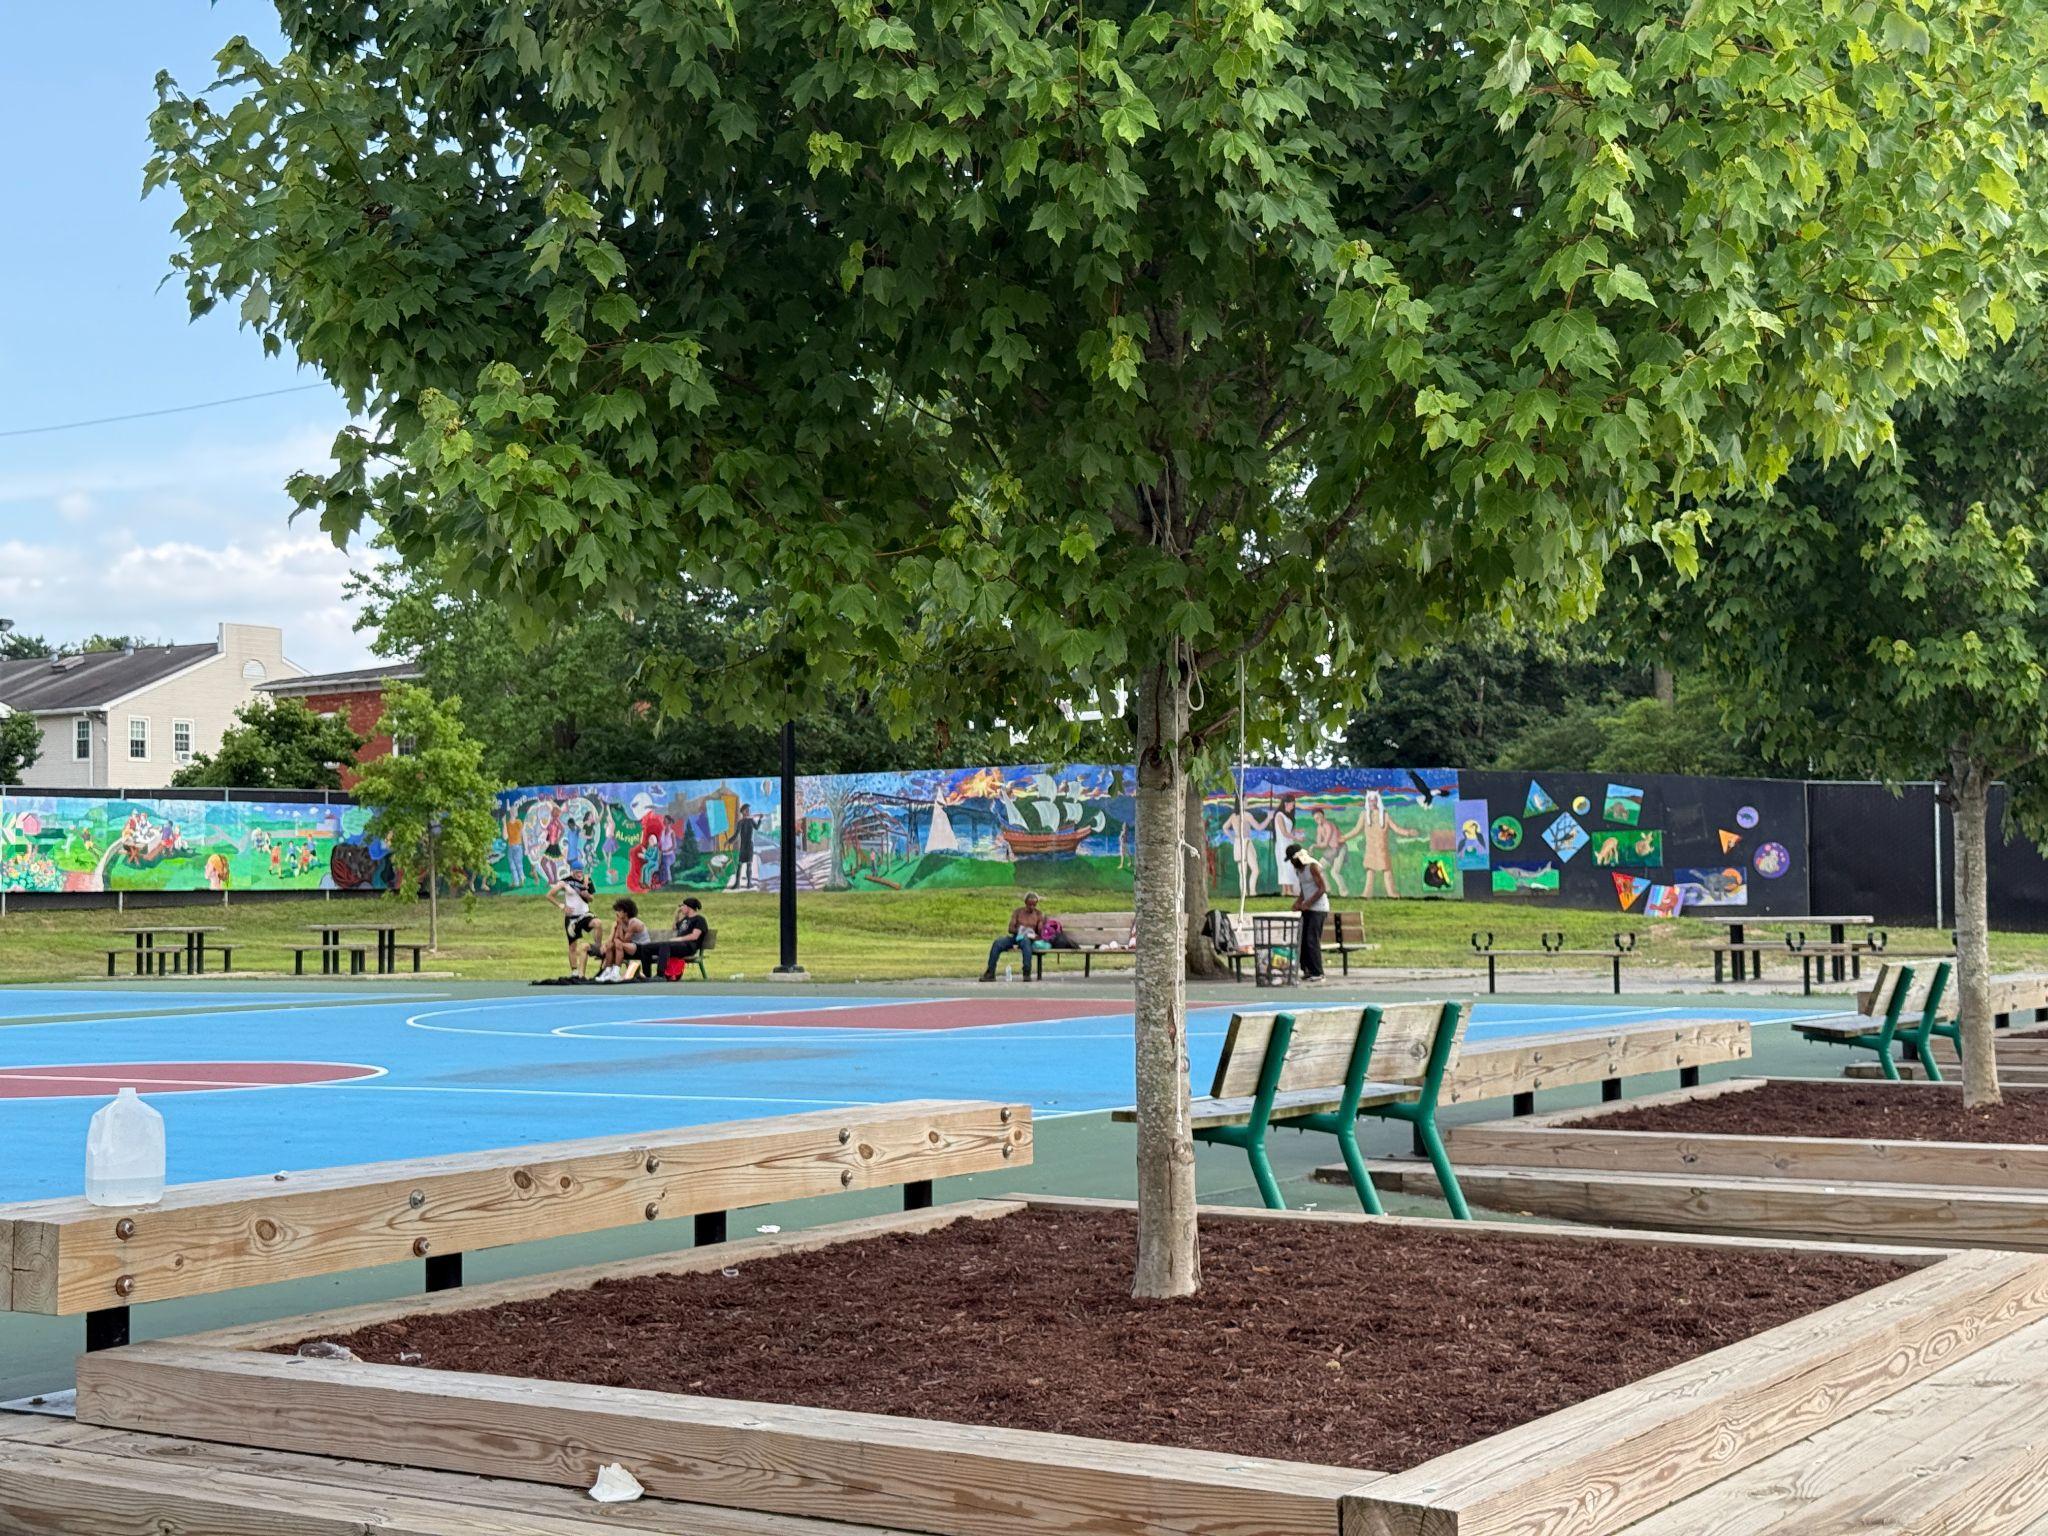
At Pershing Avenue Park in Poughkeepsie, the mix of side-by-side activities, from the community garden to the basketball courts and the neighboring art school encourages interaction across ages, from youth to seniors, and across cultures, bringing together local residents and artists.
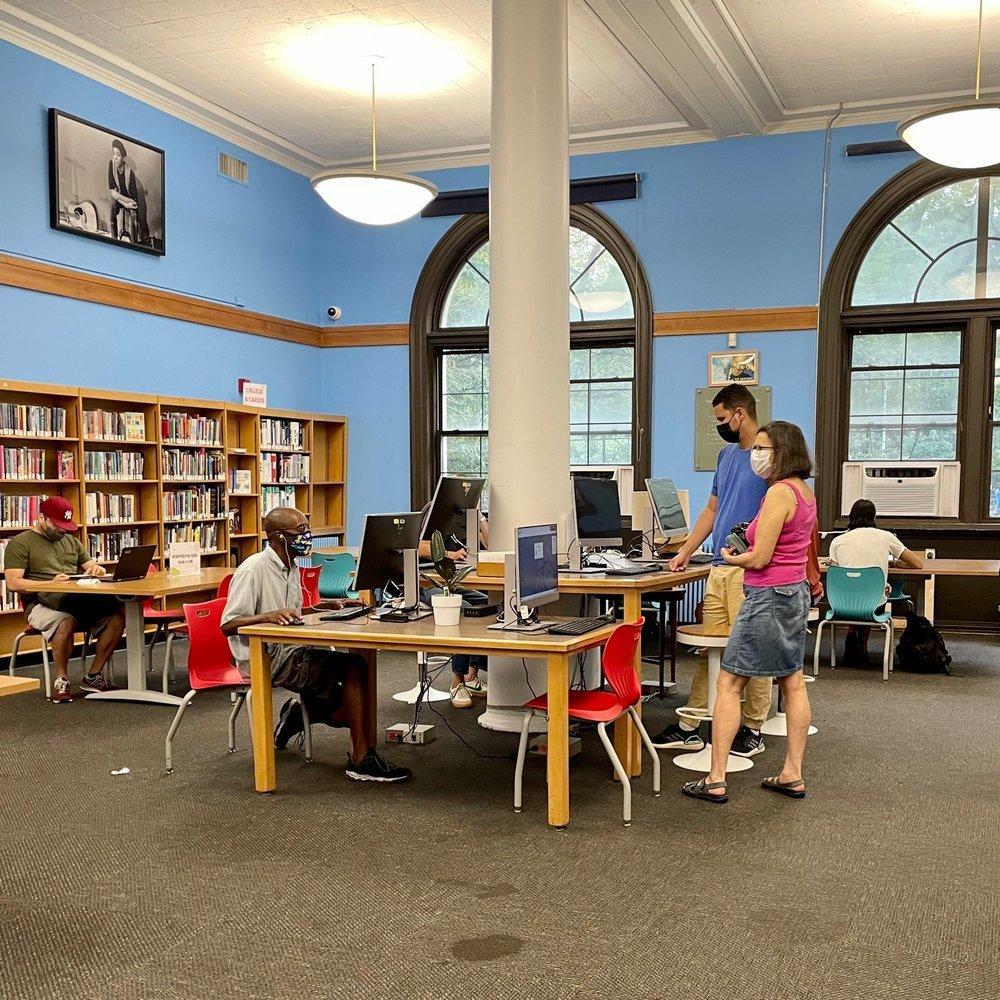
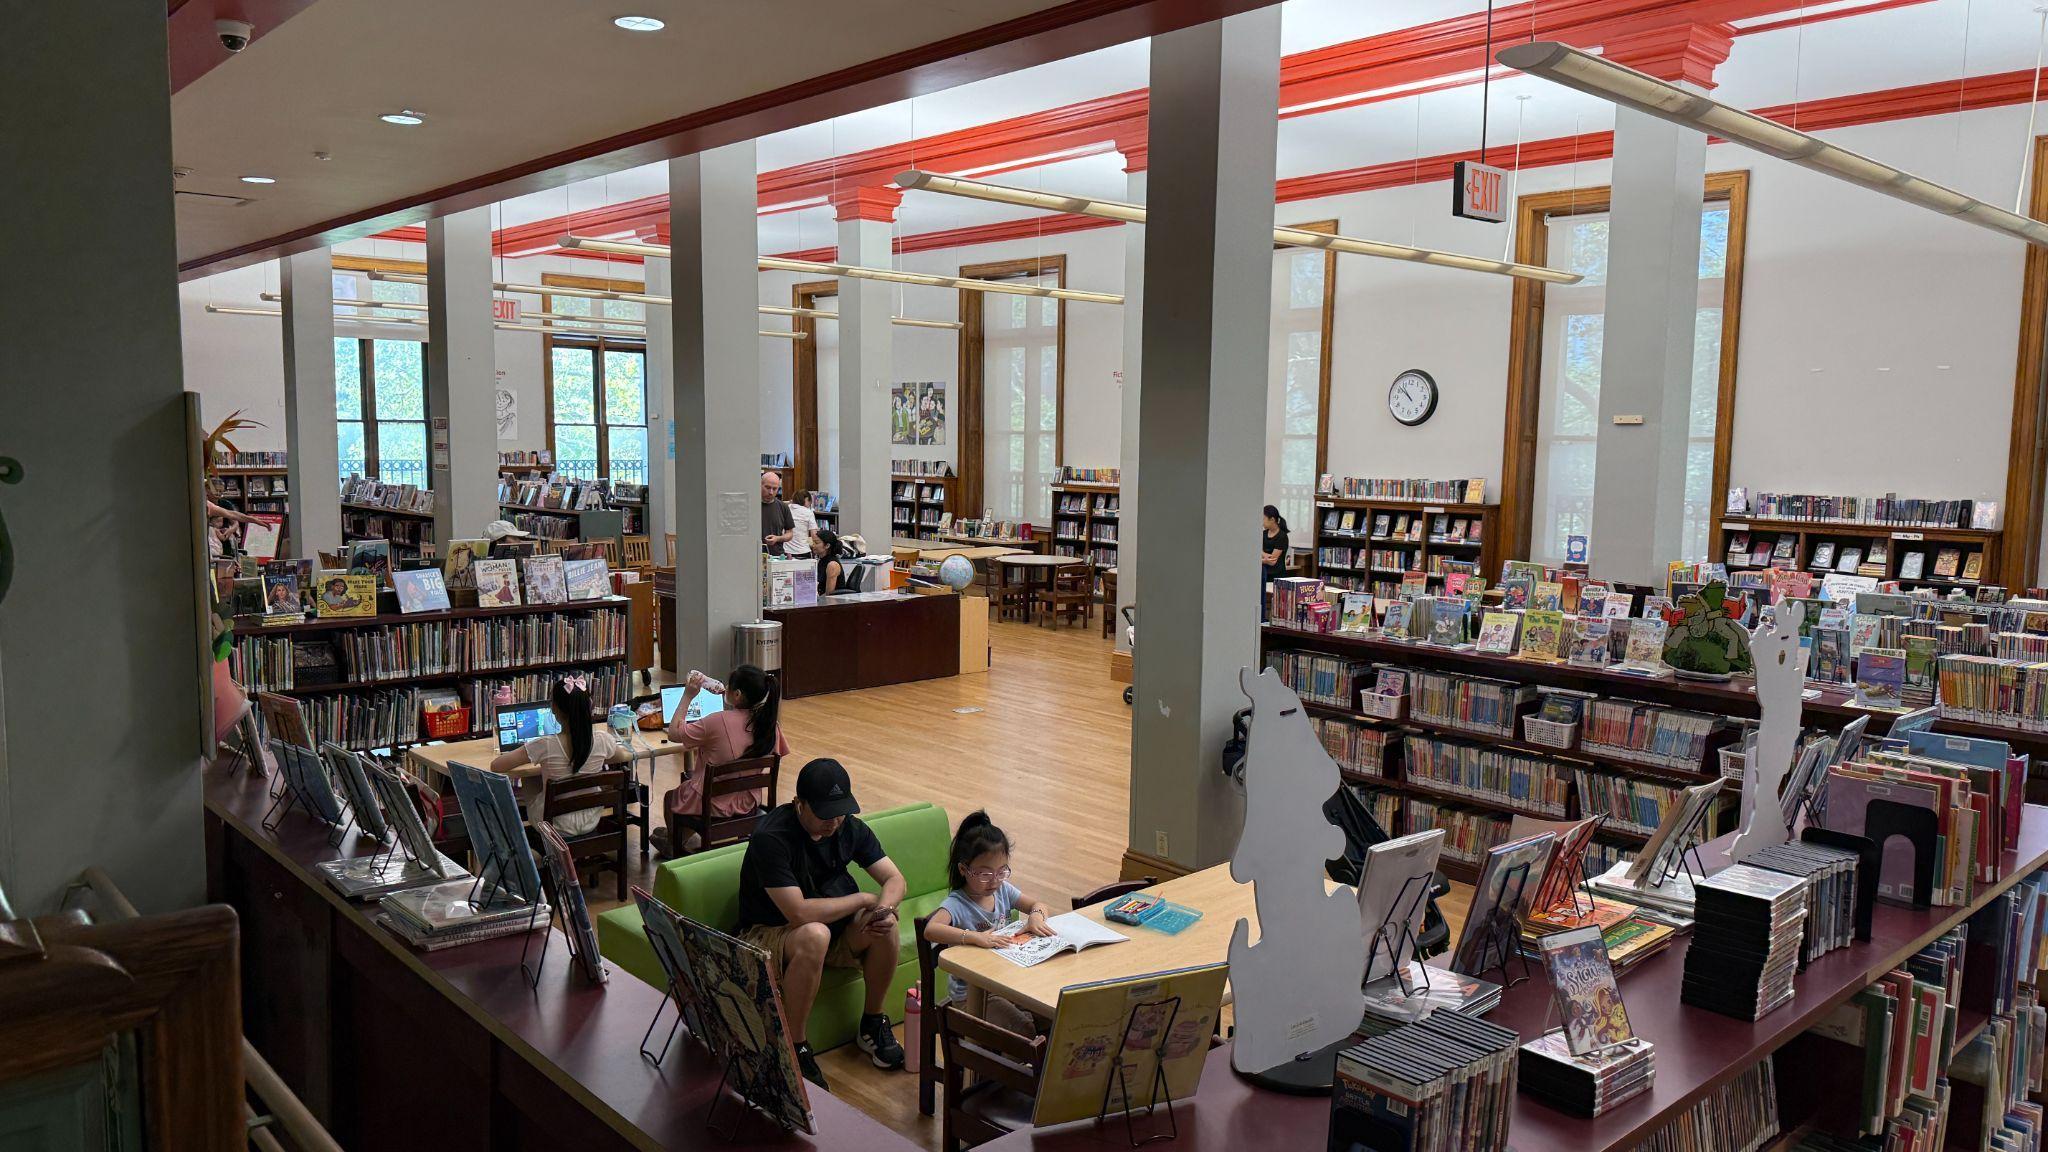
Indoor spaces like the Manny Cantor Center in the Lower East Side and Seward Park Library also foster age diversity through dedicated zones like teen rooms. Seward Park Library had the most age-diverse visitors overall during public life observation.
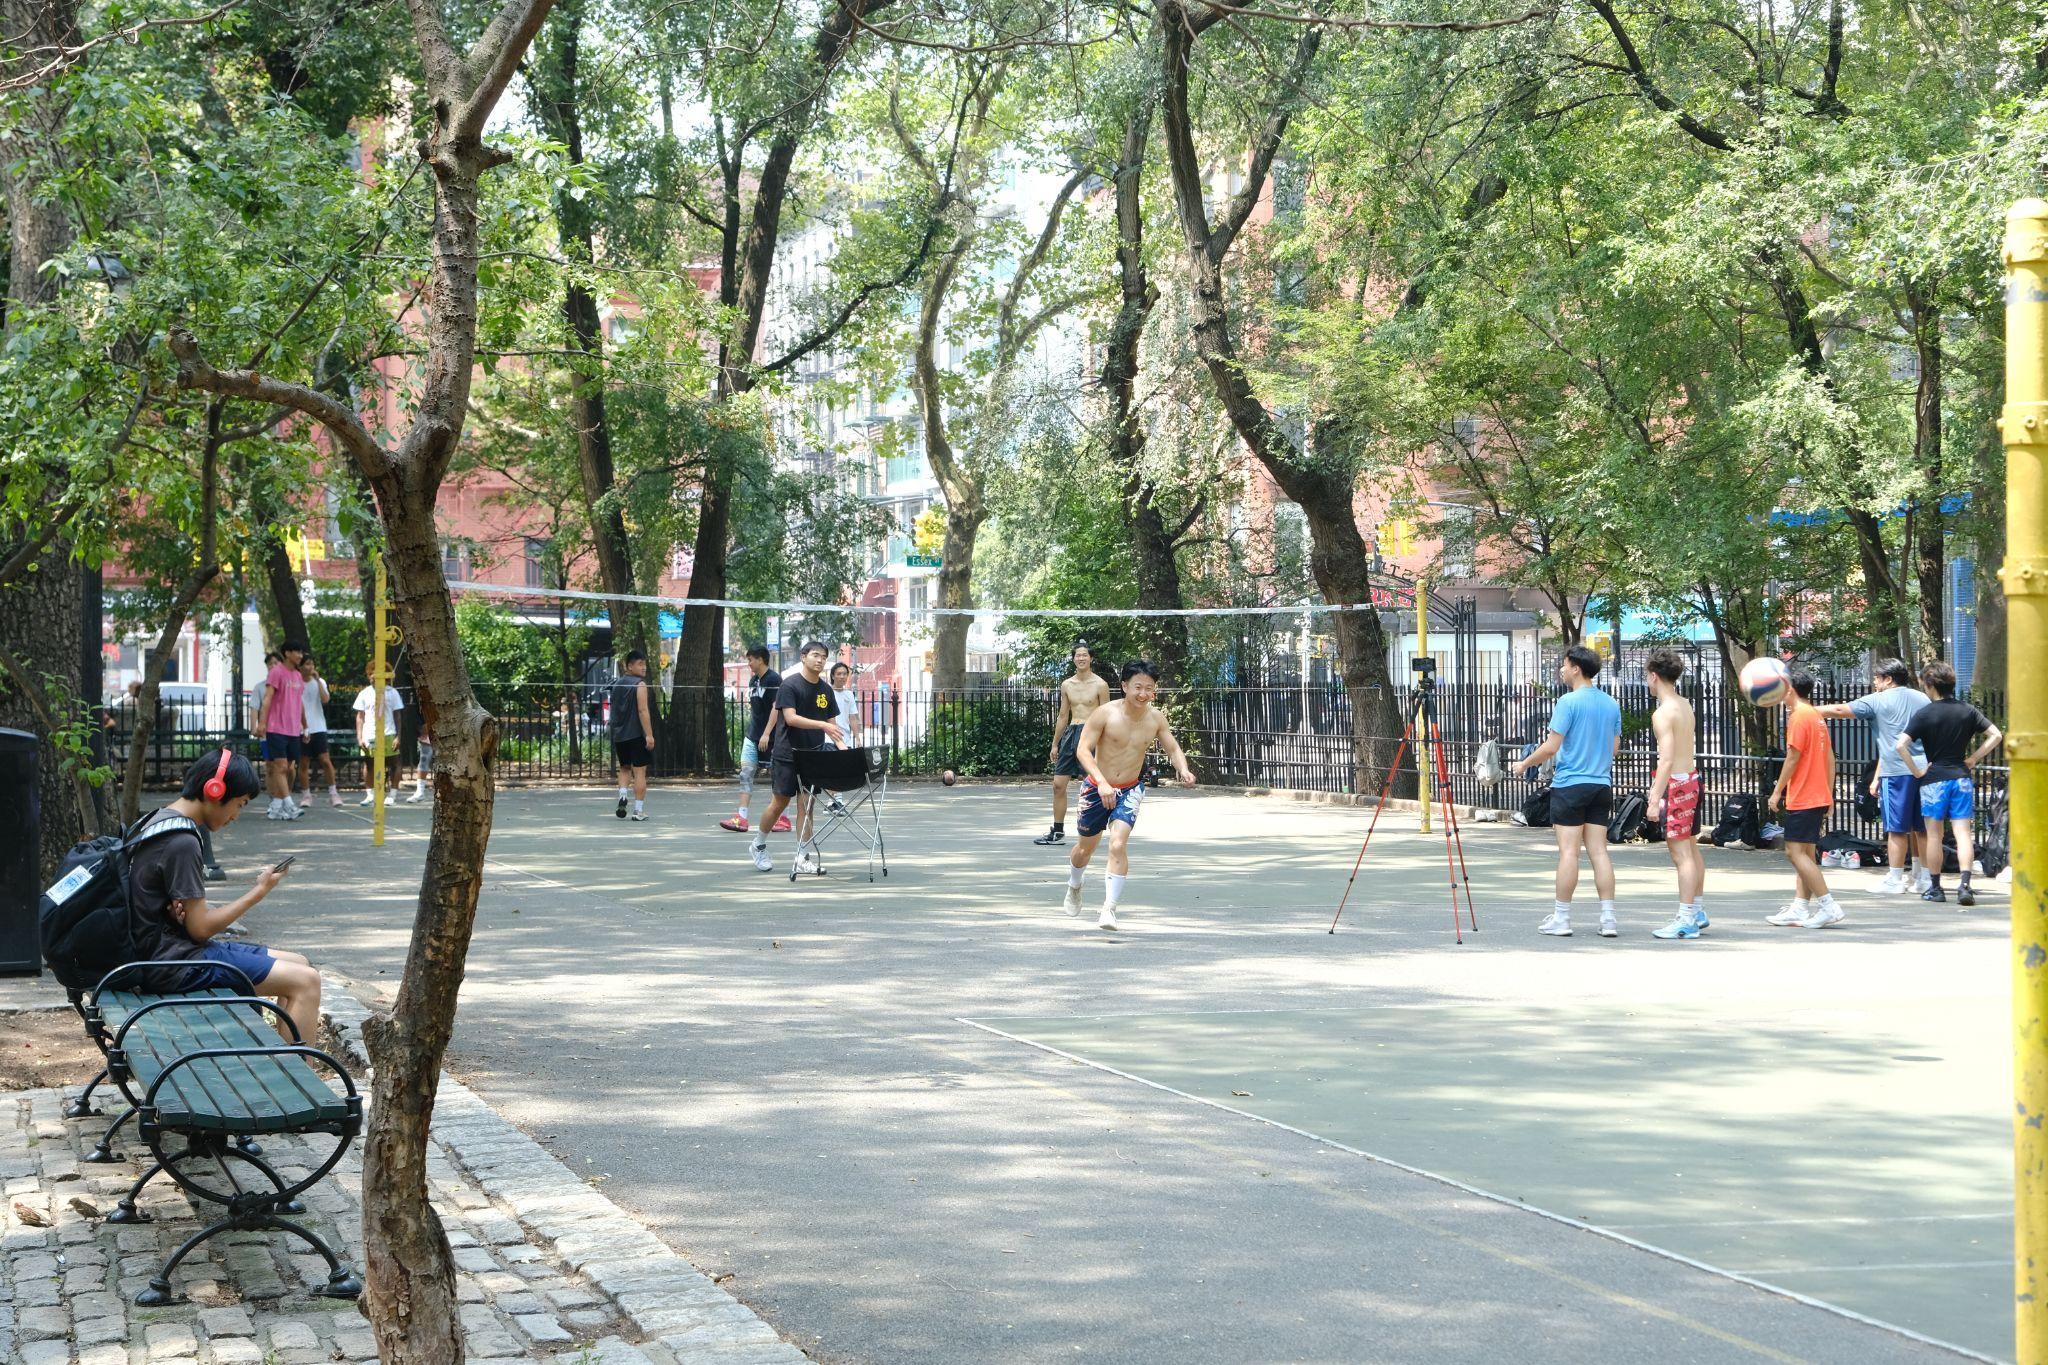
Soccer, Volleyball, Basketball Areas
Adults & Teens
Fountain Splash Pad Young Kids
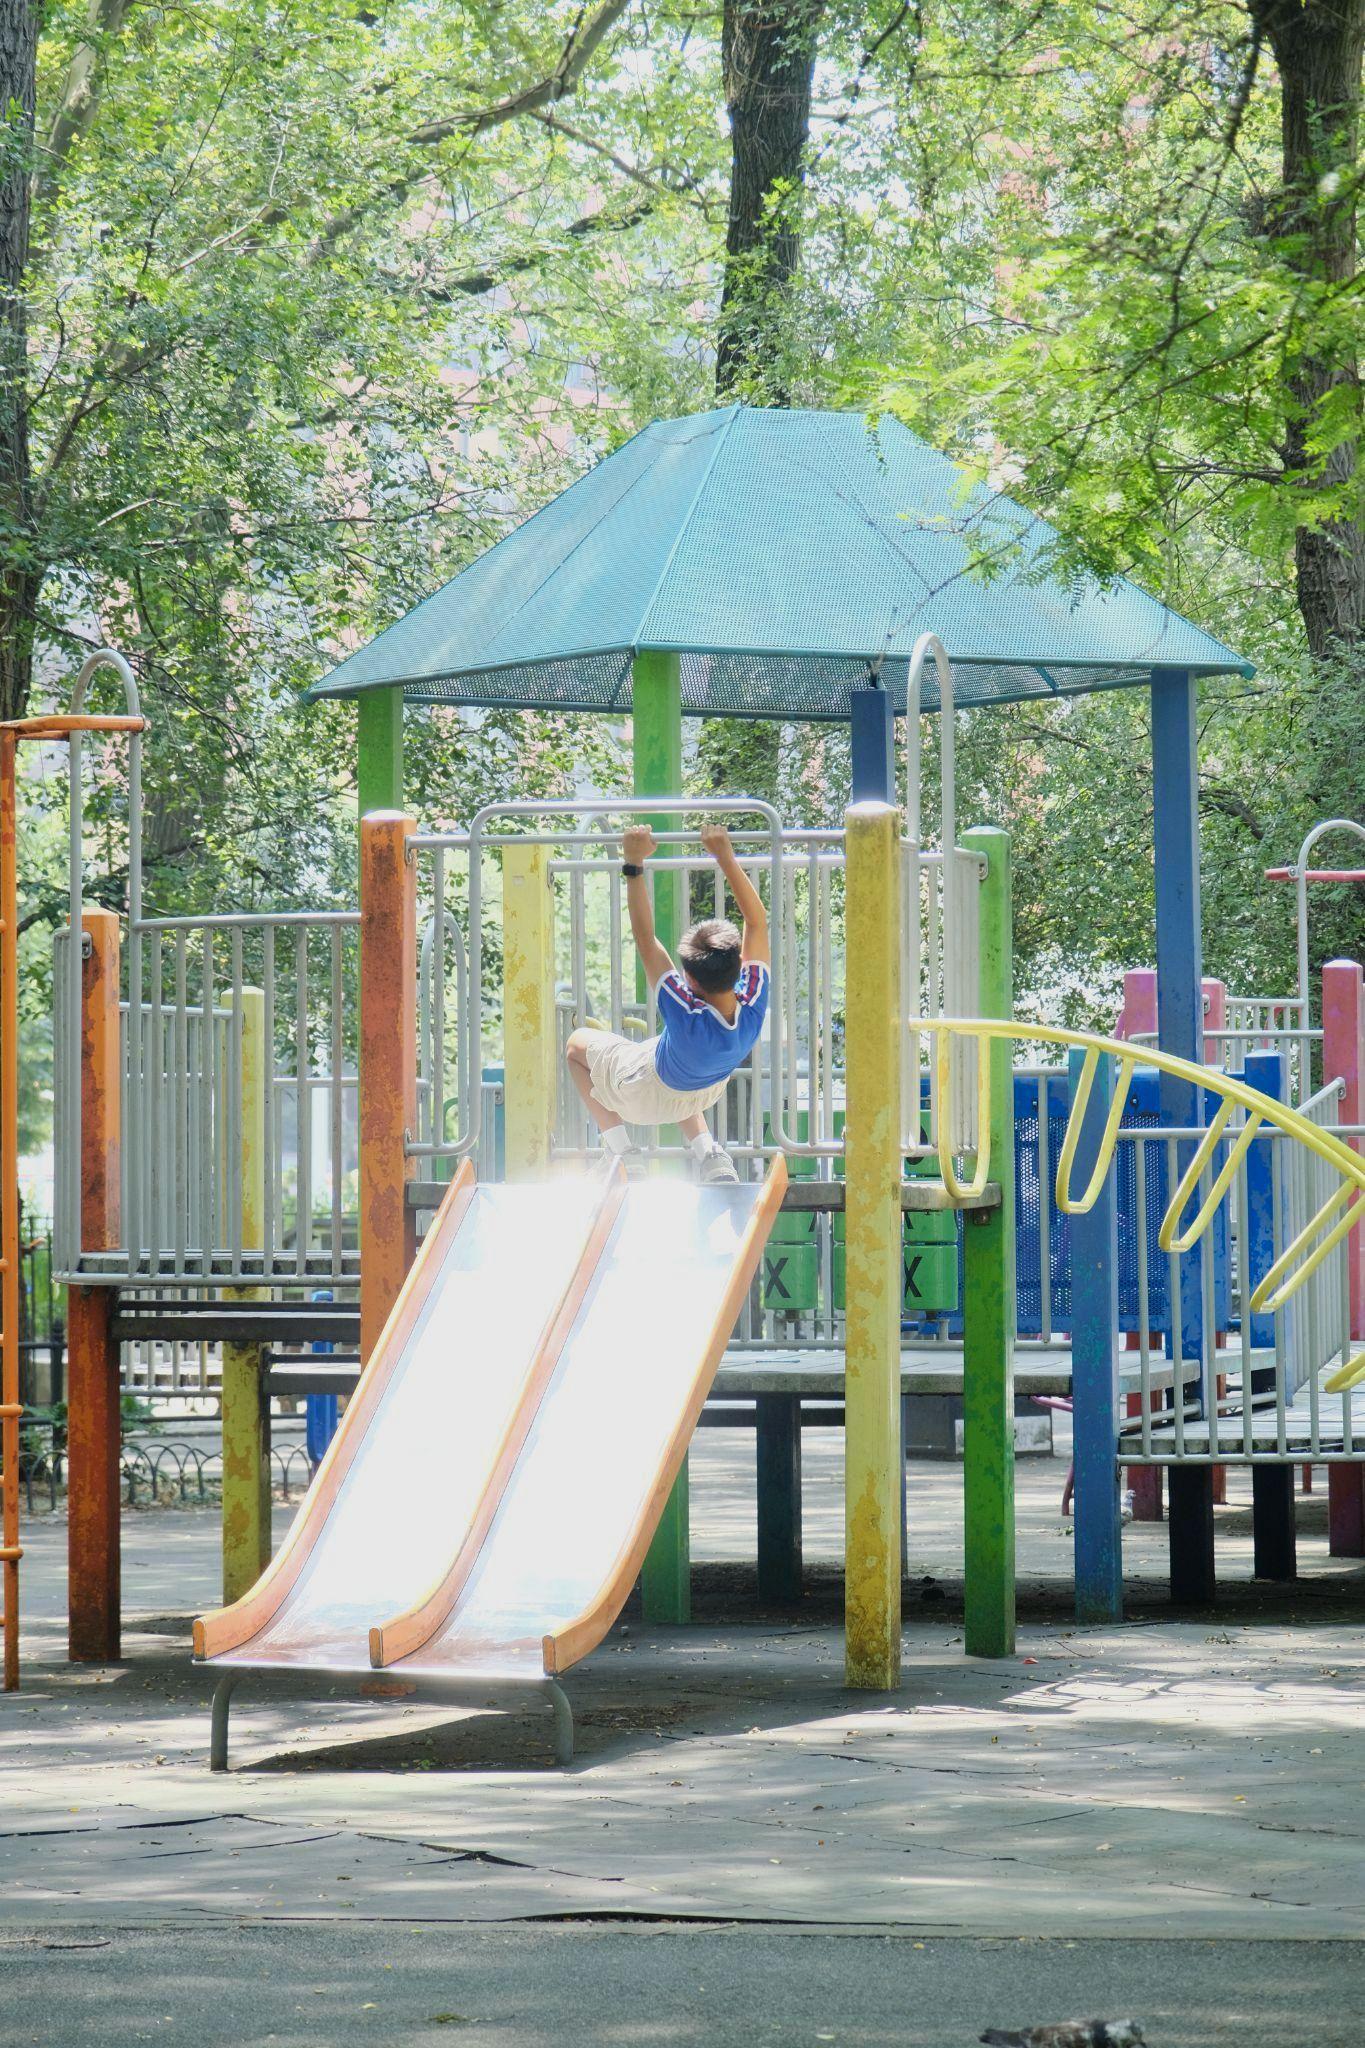
Playground Kids
Library
All ages
Arts School
Rooftop Pavilion Area
All Ages
Health & Fitness Center
All Ages
Classrooms
All Ages
&
All Ages
Picnic Tables & Seating
Seward Park
Manny CantorCenter
Art Studios
Kitchens
Rest
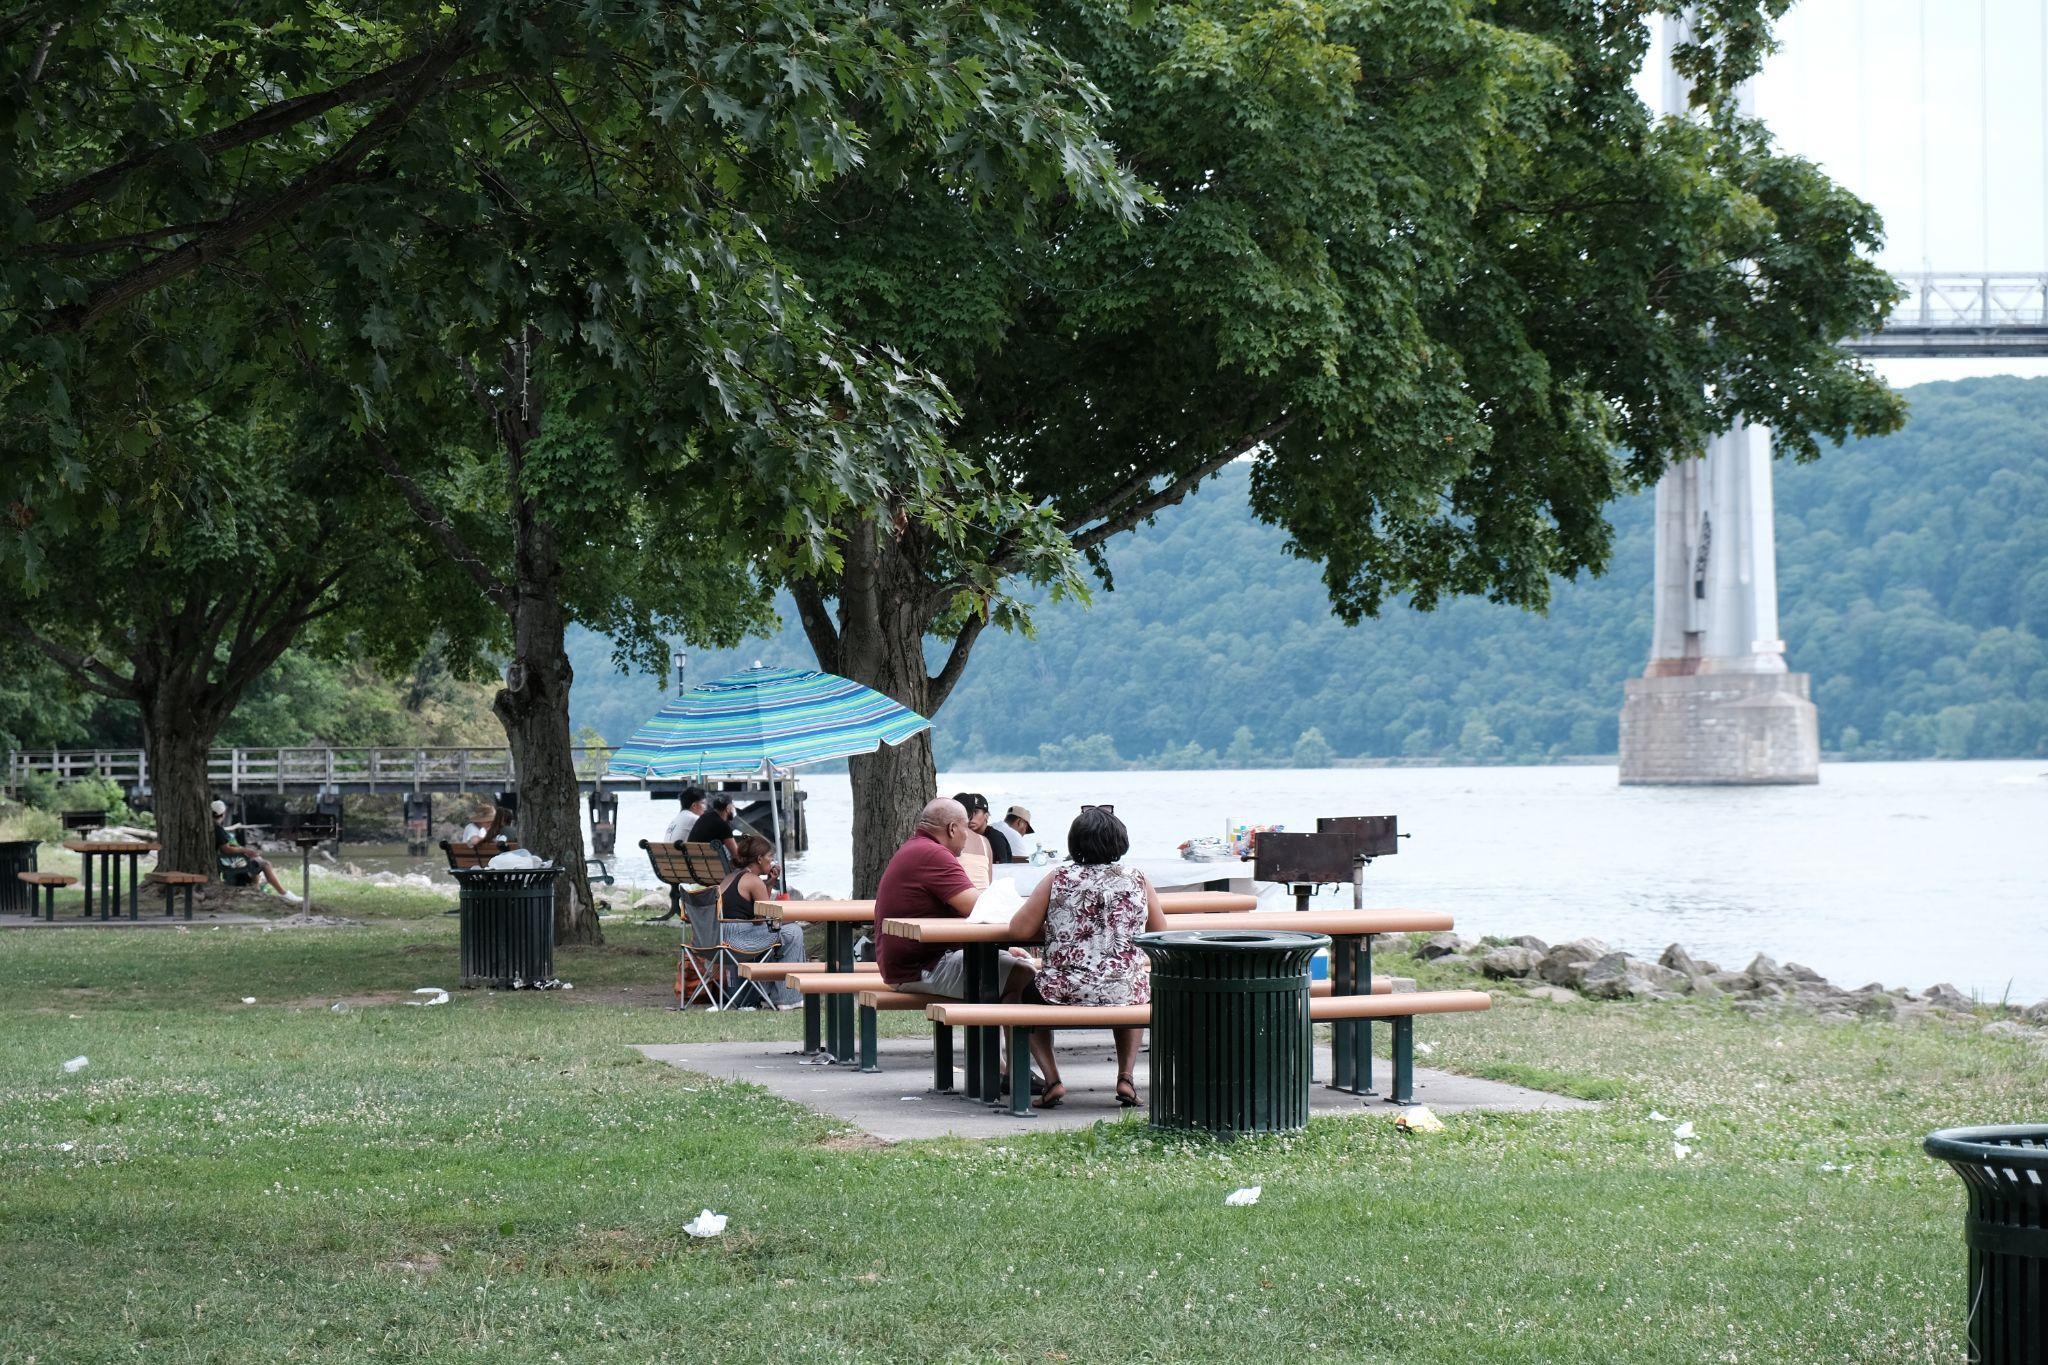
Sometimes the most valuable role of social infrastructure is to offer a place to relax, warm up, or cool off — especially in extreme weather and in an increasingly anxious and unpredictable world.
→ Half of the people observed across all social infrastructure sites were seated or lying down.
Cooling off in the shade
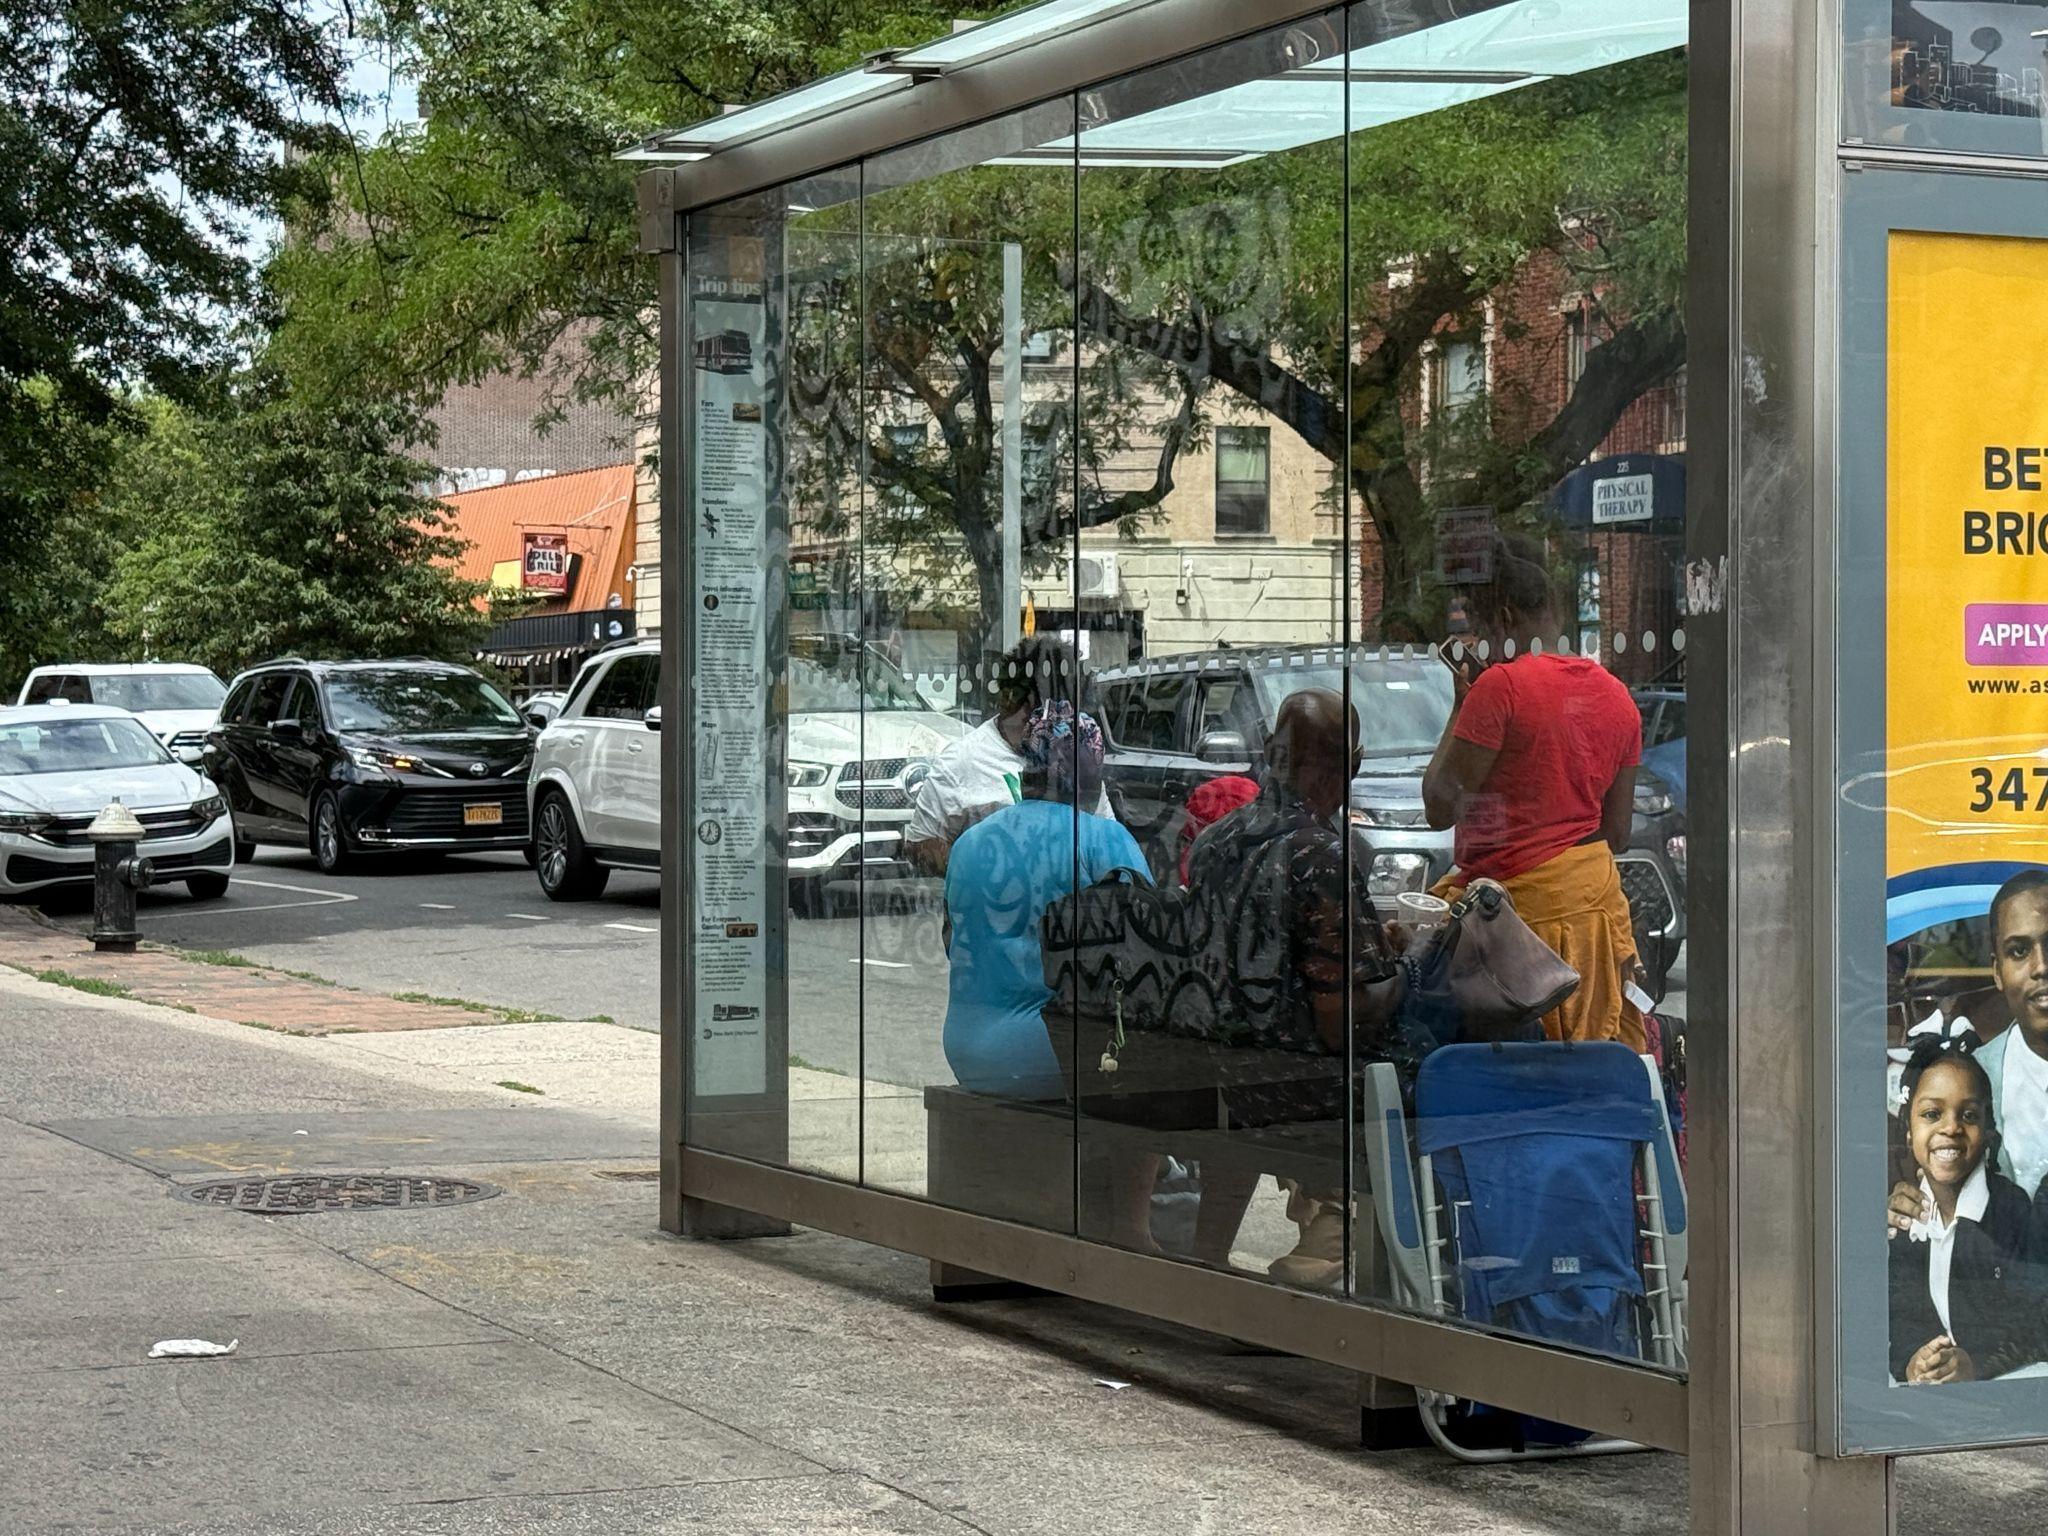
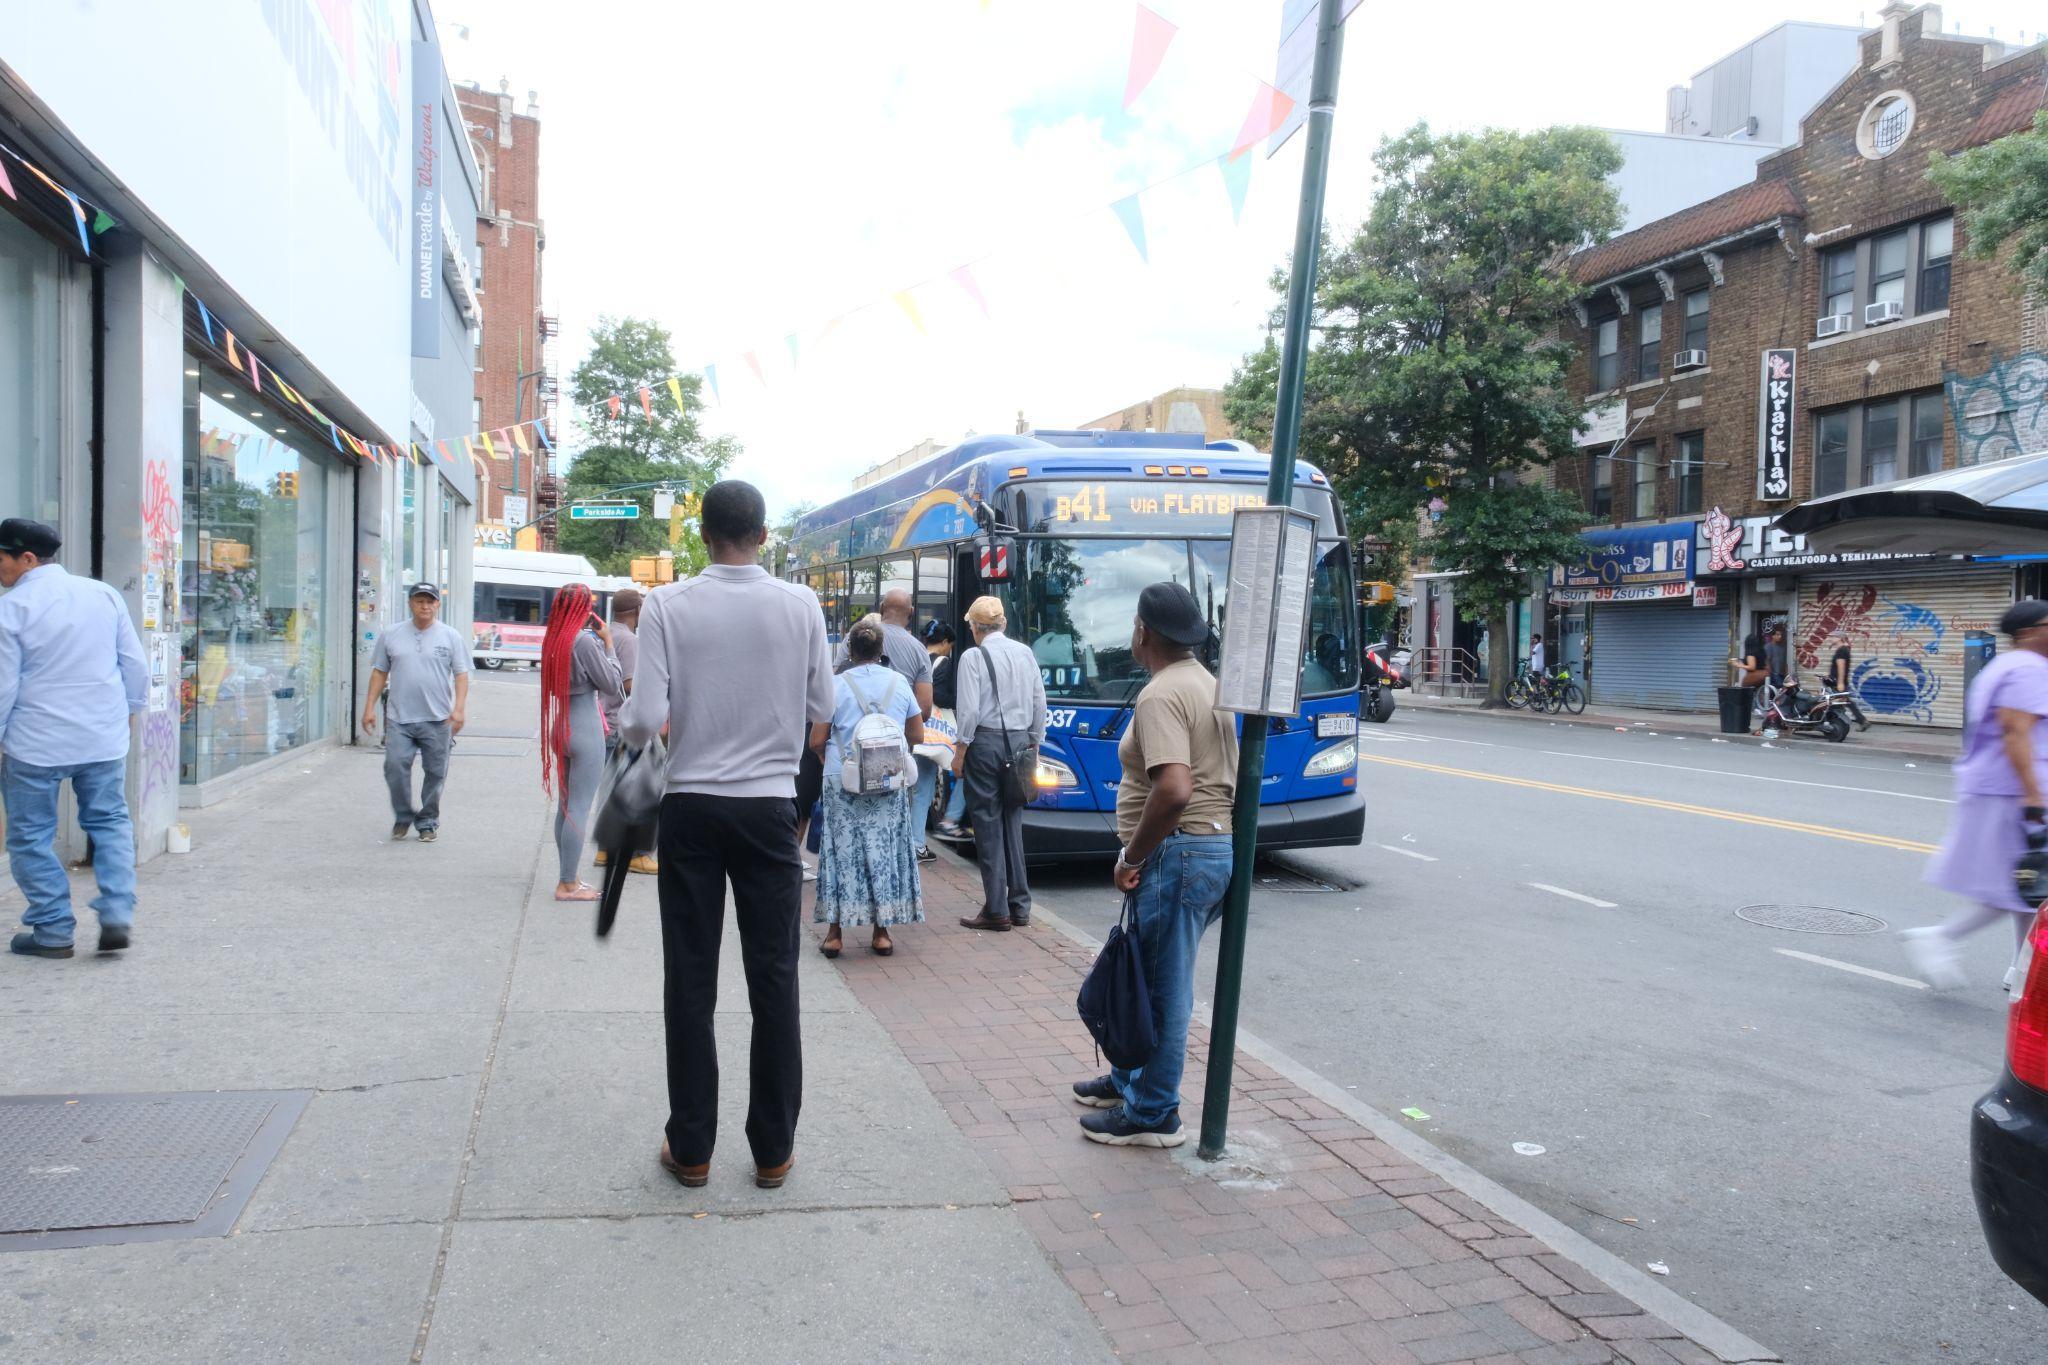
Bus Stops
Flatbush Ave, NewYorkCity
Parks
Waryas Park, Poughkeepsie
Field Notes
Pershing Ave Park
Stewarded by New City Parks, Scenic Hudson, and the City
“Pershing Park has been so utilized by kids. Every day I leave, and I immediately smile, because it's just ball games going on, and that's what should happen in a park. So I’m like, yes, the parks are being utilized by their intended users now.”
– Nicole Fenichel-Hewitt, Executive Director, Art Effect
With revamped basketball courts, a new playground, and a new community farm, Pershing Avenue Park is beginning to develop a better reputation on Poughkeepsie’s North Side. The recent work of non-profit organizations like Scenic Hudson has improved park conditions. Increased programming has led to more people beginning to view Pershing as a safe recreational space.
As recently as 2024, the park was a site where people would pass out on the new basketball courts and picnic tables. Pershing was a site known for violent crime, overdoses, and other unwelcome incidents. “Last year was much worse,” said one source at a nearby non-profit. “More people shouting and sometimes cursing out people who were trying to use the park.” Through police sweeps and more regular programming, the number of incidents in the park has significantly declined.
A typical week at Pershing is still quiet, but park use has steadily increased. Teenagers and young men frequently use the basketball courts, and a handful of unhoused people are often relaxing at the picnic tables. Much like the rest of the city’s public
realm, the playground is often empty, but recent free art activities (Crazy Over Art) for Poughkeepsie youth have led to regular visits from groups of children from nearby daycare facilities. Scenic Hudson’s weekly farm stand, held every Tuesday during the summer from 4 to 6 PM, was another modest-sized program that yielded positive results in 2025. The farm’s staff handed out free fresh produce to 30-40 people each week, with about a third also checking on their garden plots. It is clear that the farm had developed a small but loyal group of regulars who became increasingly invested in Pershing’s future. Improvements to the park’s day-to-day use still vary, but more residents are cautiously optimistic in regarding Pershing Avenue Park as a social infrastructure site.
Play
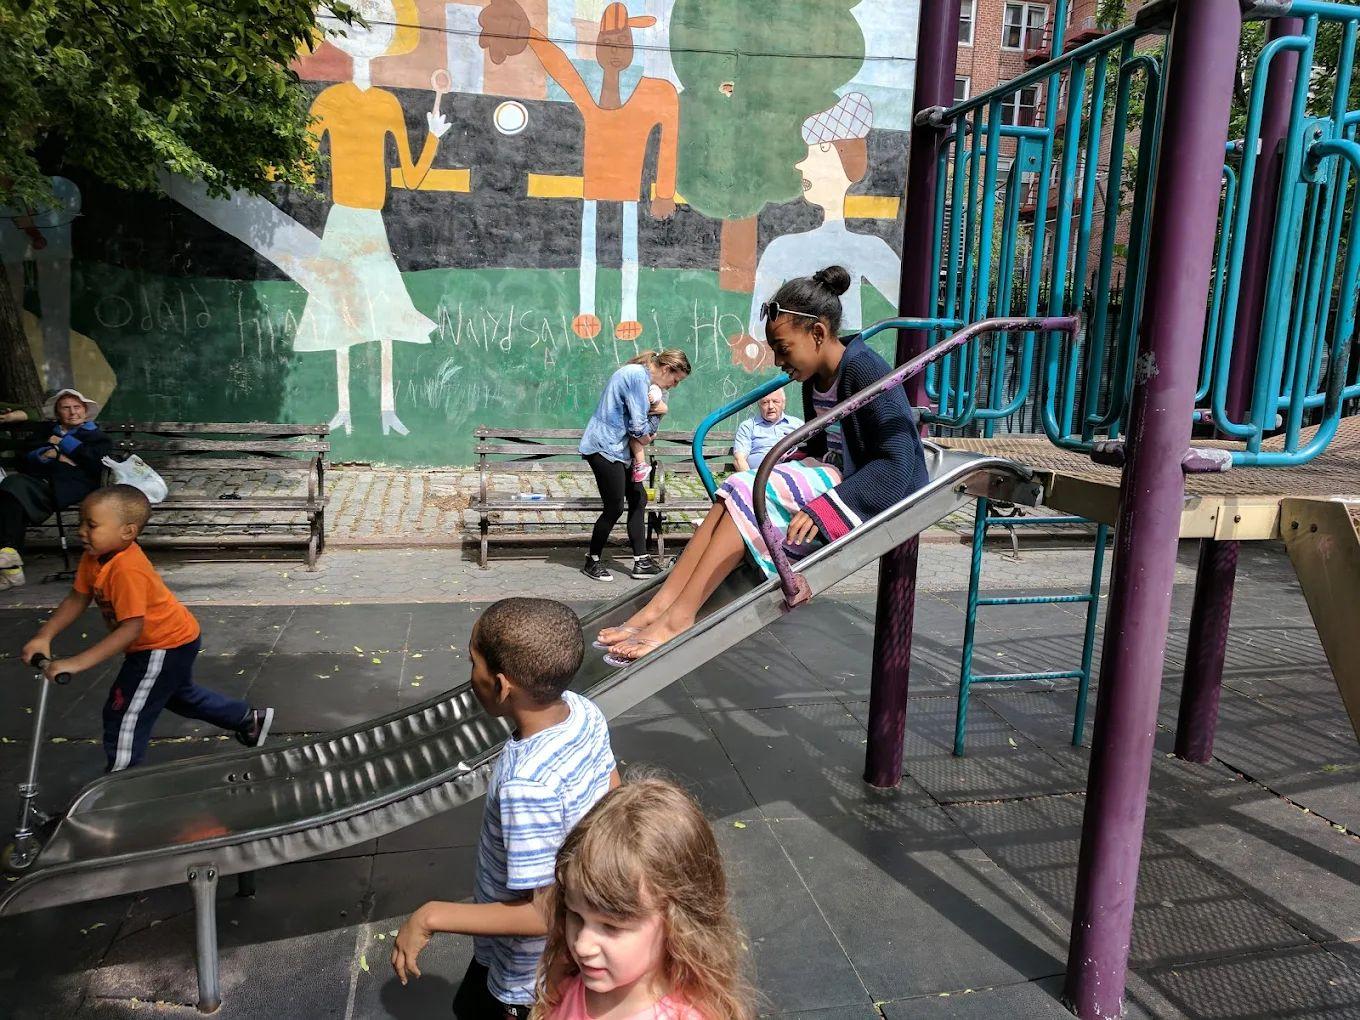
From organized sports to free play with friends and neighbors, spaces for play at every age help keep bodies and minds active and healthy, and create more equitable access to recreation.
→
Over25% of the people observed across all social infrastructure sites in the Lower East Side were engaged in play or exercise.
Image source: Poughkeepsie Public Library District
Create
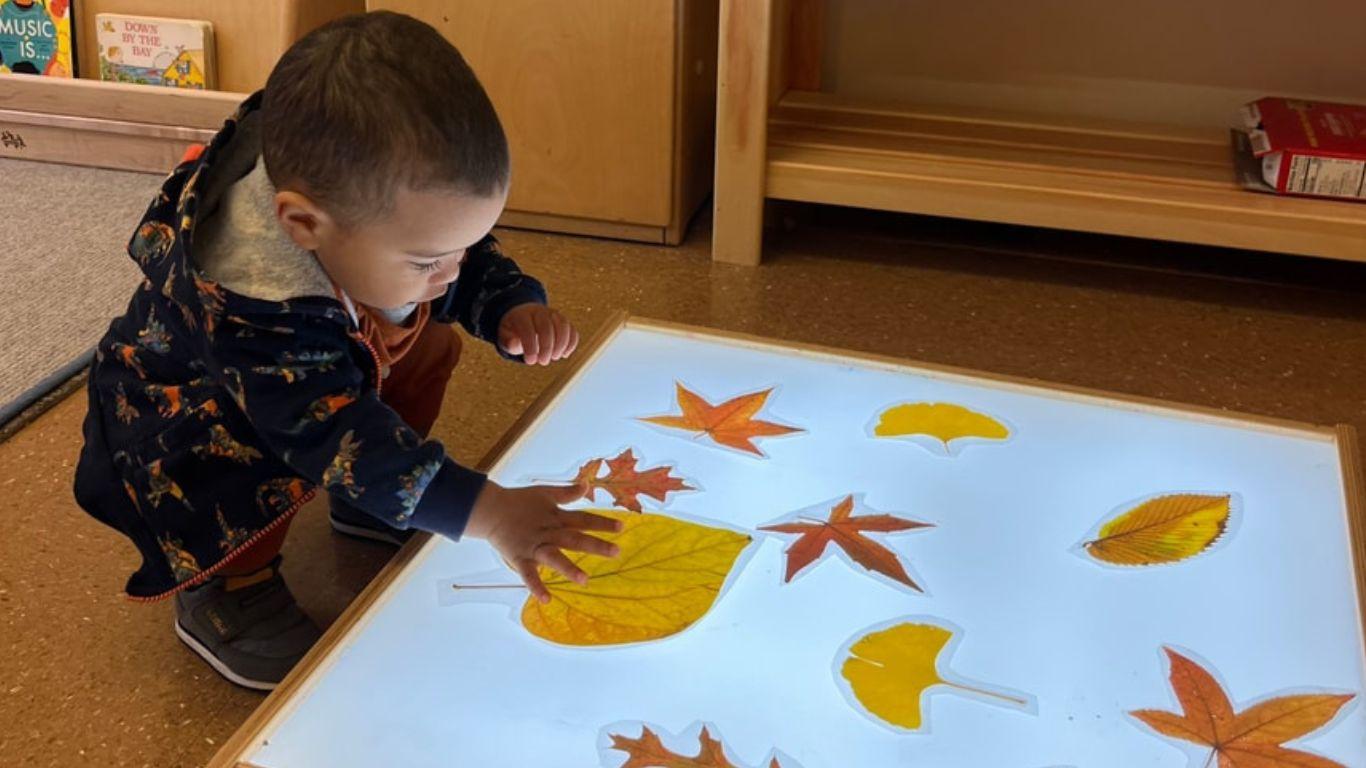
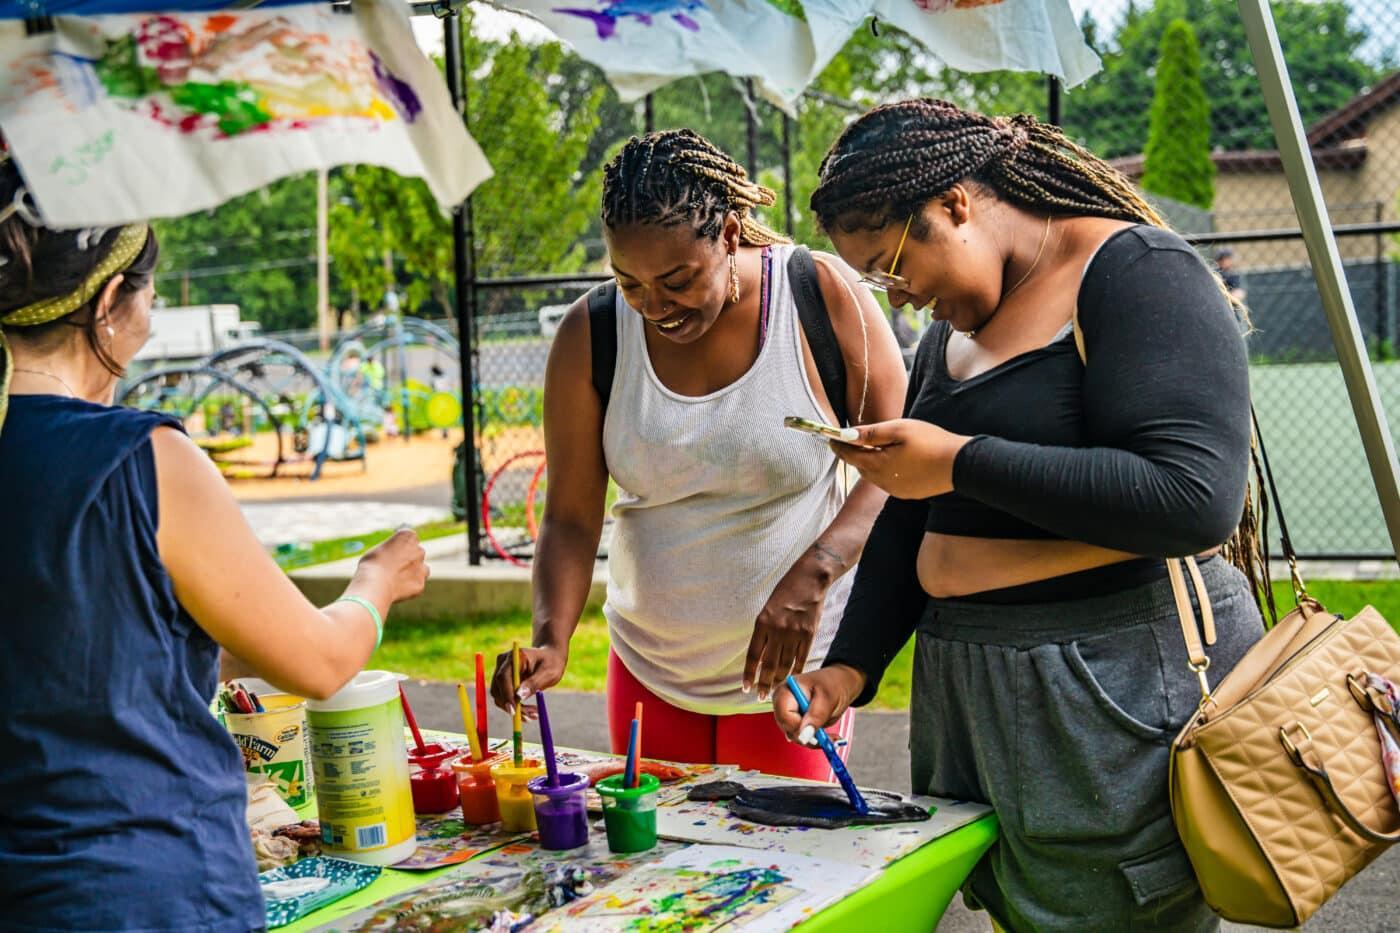
From growing plants to making ceramics, these spaces connect people to their creative instincts and passions.
“
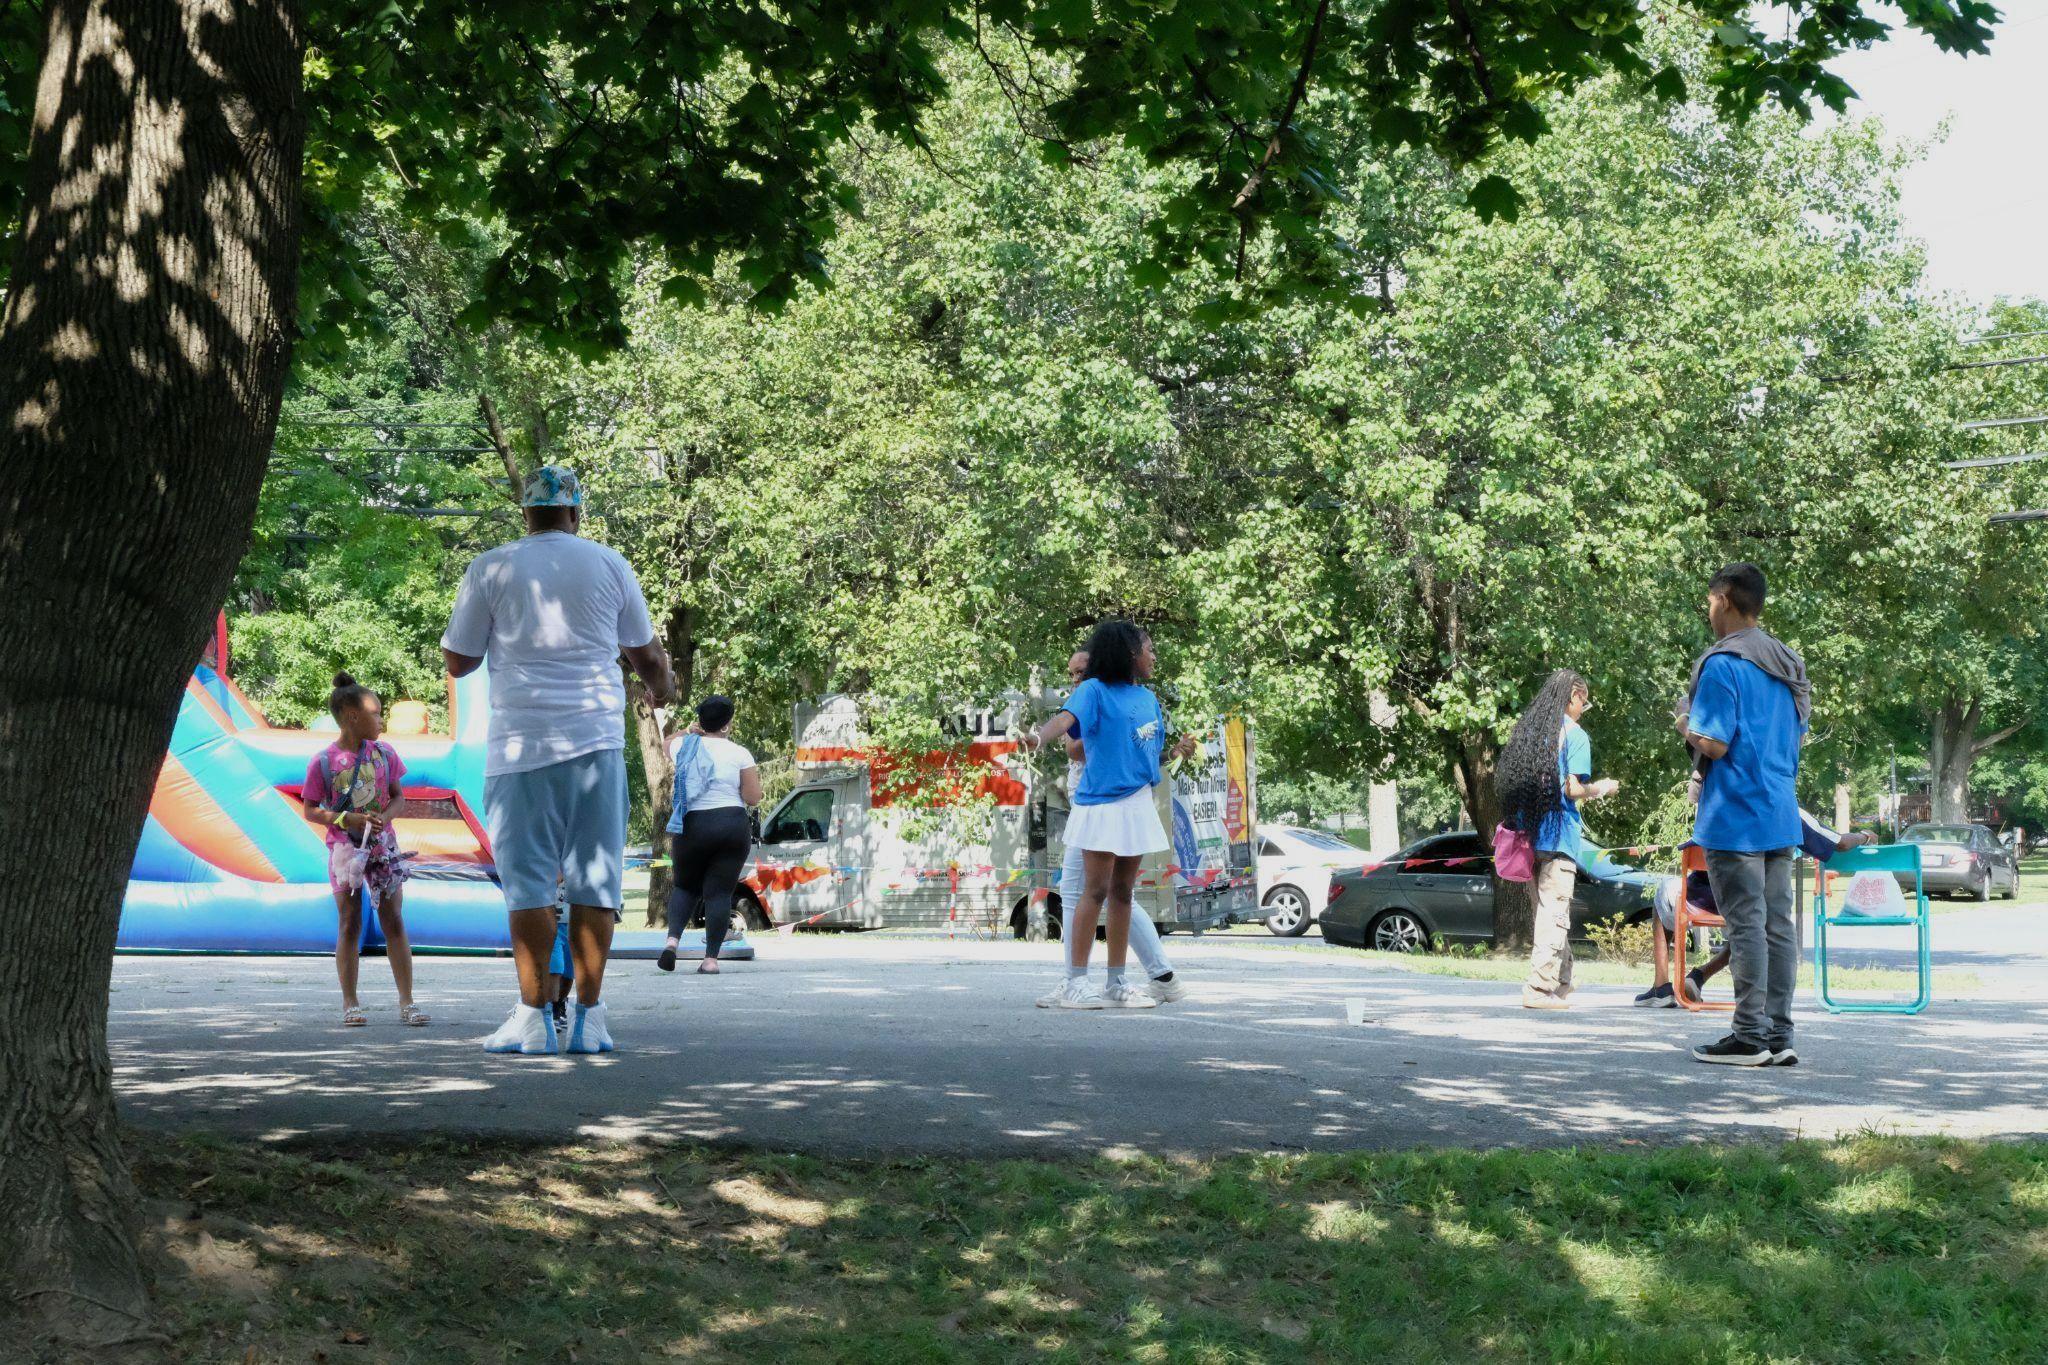
One of the main projects we launched was the Saturday parkevents to bring families into the parkto do fun things: to enjoy music, create art, learn about resources, but mostly just creating opportunities to see their neighbors.
Melissa Aase, CEO of University Settlement
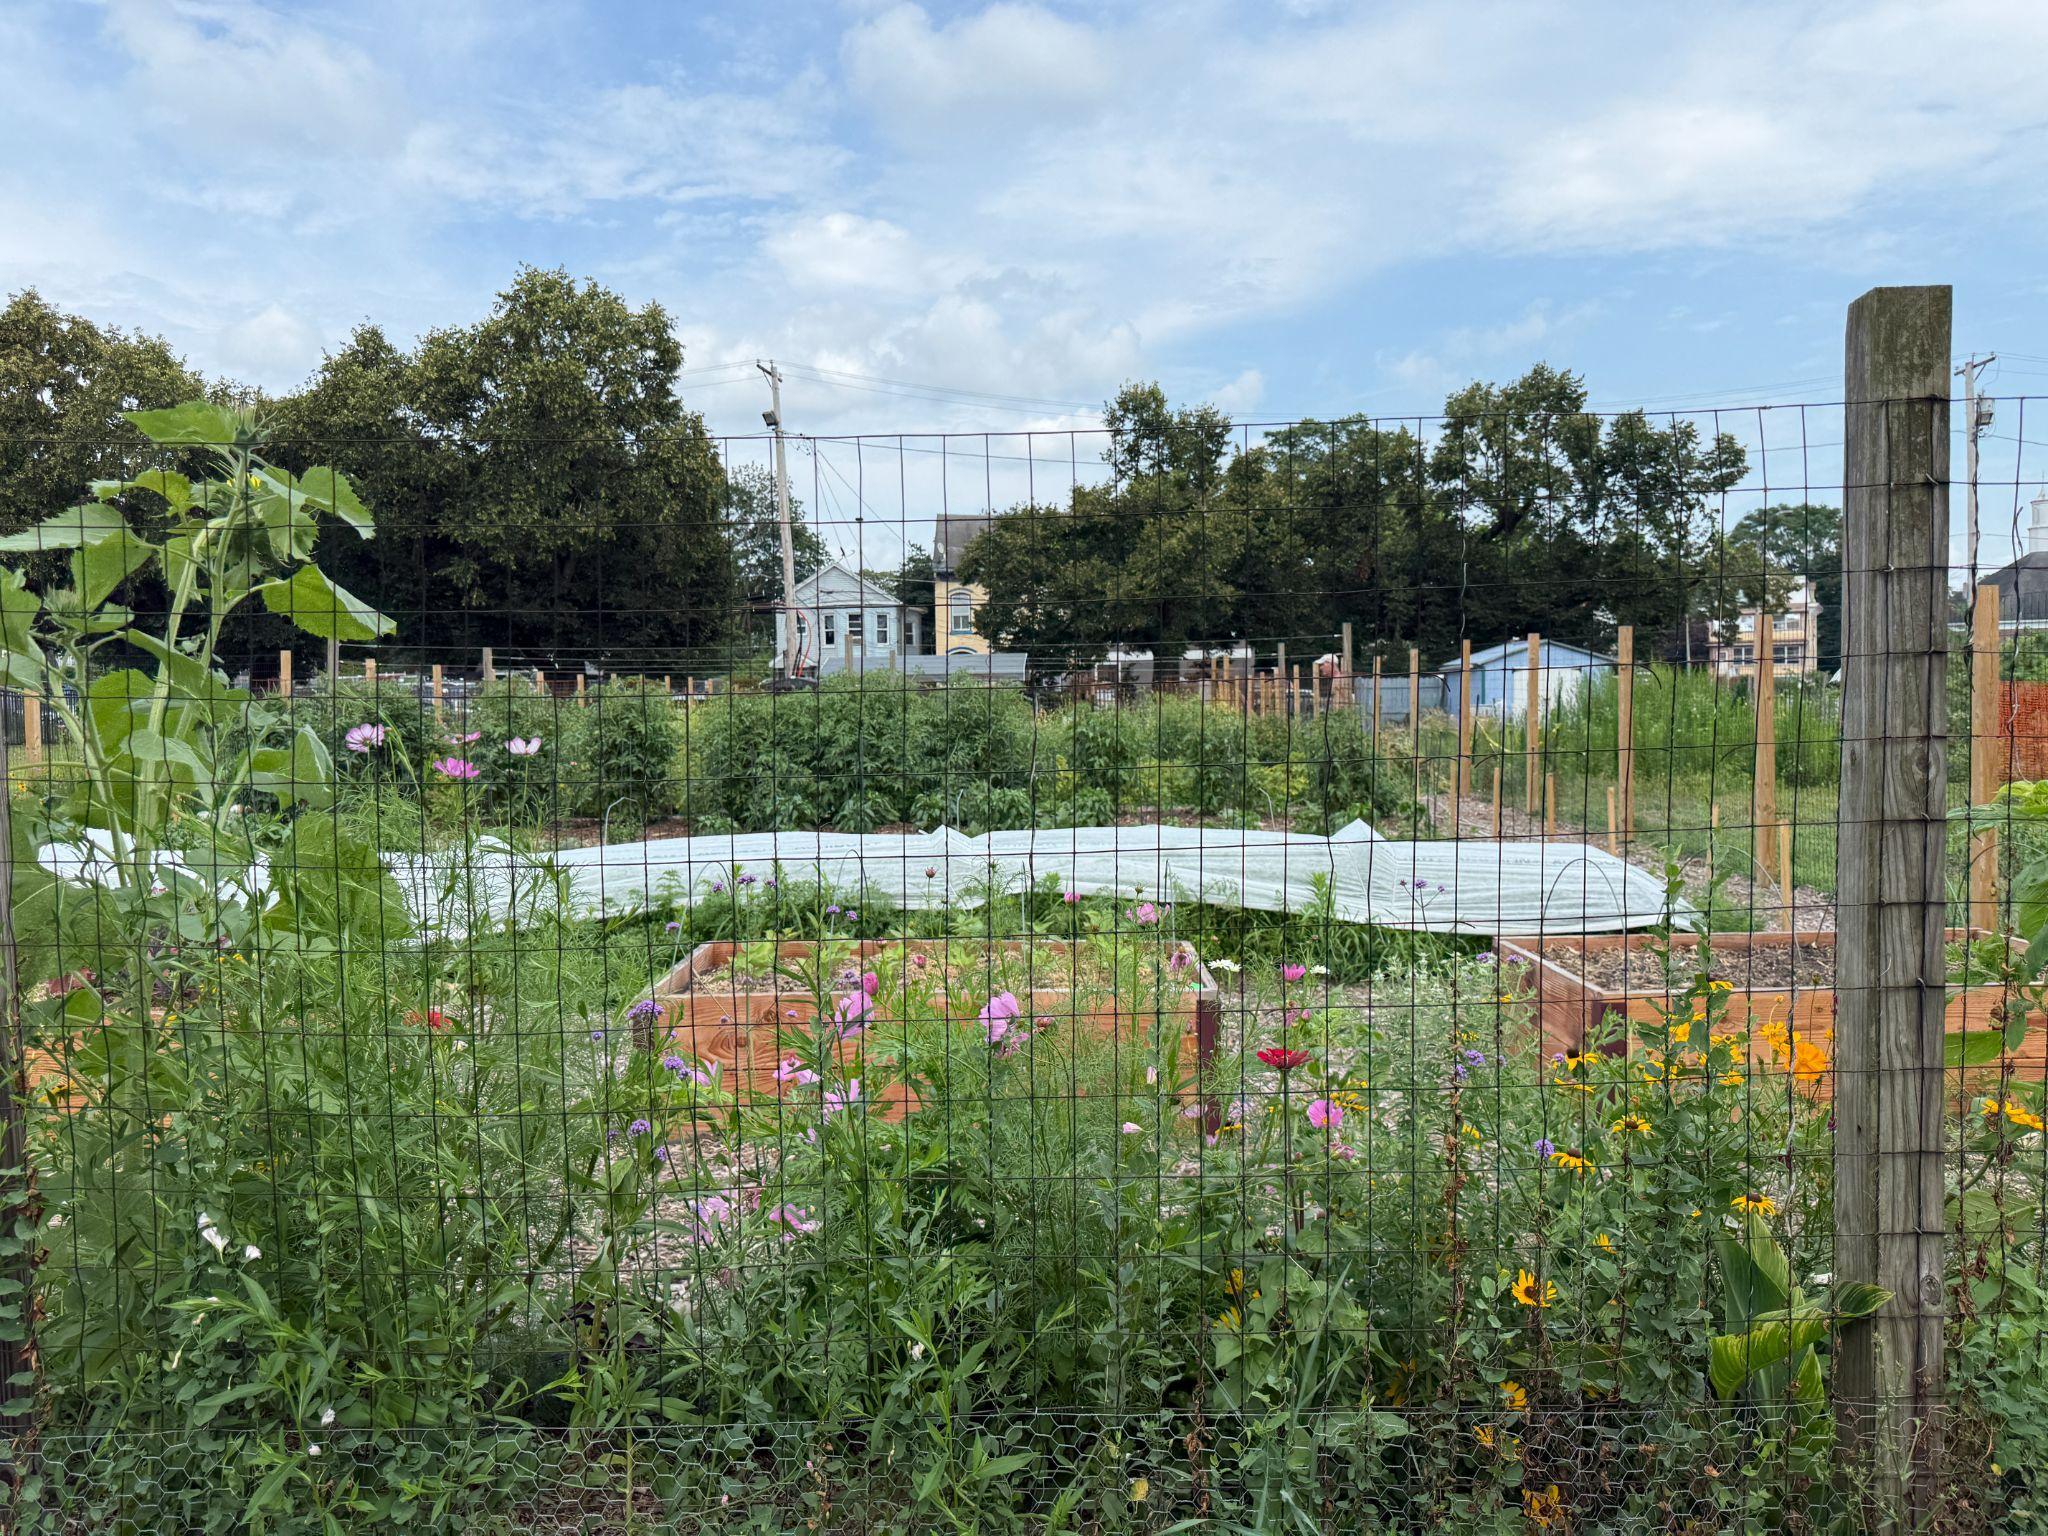
Community Gardens
Pershing Ave Community Farm, Poughkeepsie Parks Seward Park, NewYorkCity
Streets Flatbush Avenue, NewYorkCity
Community Centers
Manny Cantor Center, NewYorkCity
Image source: Manny Cantor Center
source: Scenic Hudson
Field Notes
Manny CantorCenter Stewarded by Educational Alliance
These spaces need meaningful resources for features like design, programming, and operations to remain effective.
Effective social infrastructure relies on funding forthe physical space and the people who care forand program it.
Ingredients of Effective Social Infrastructure
Operations Is it well-run and governed?
Maintenance Does it feel cared for?
Across the sites studied, the most active and socially diverse places shared a common foundation: they were readily available, easily accessed, comfortably designed, active with a mix of invitations, and consistently cared for and governed. All of these details rely on consistent funding for the resources that make these sites work. Read on for findings on how these different factors are reflected in spaces across the three communities studied.
Availability
Is there somewhere to go at convenient hours?
Funding Are these facets meaningfully resourced?
Programming Is there something to do? And is it reflective of community needs and interests?
Access
Can you get there safely and conveniently?
Design Is it comfortable to spend time there?
People value having a mix of indoorand outdoorspaces that meet different needs.
A variety of social infrastructure options in convenient locations drives use and meets diverse needs.
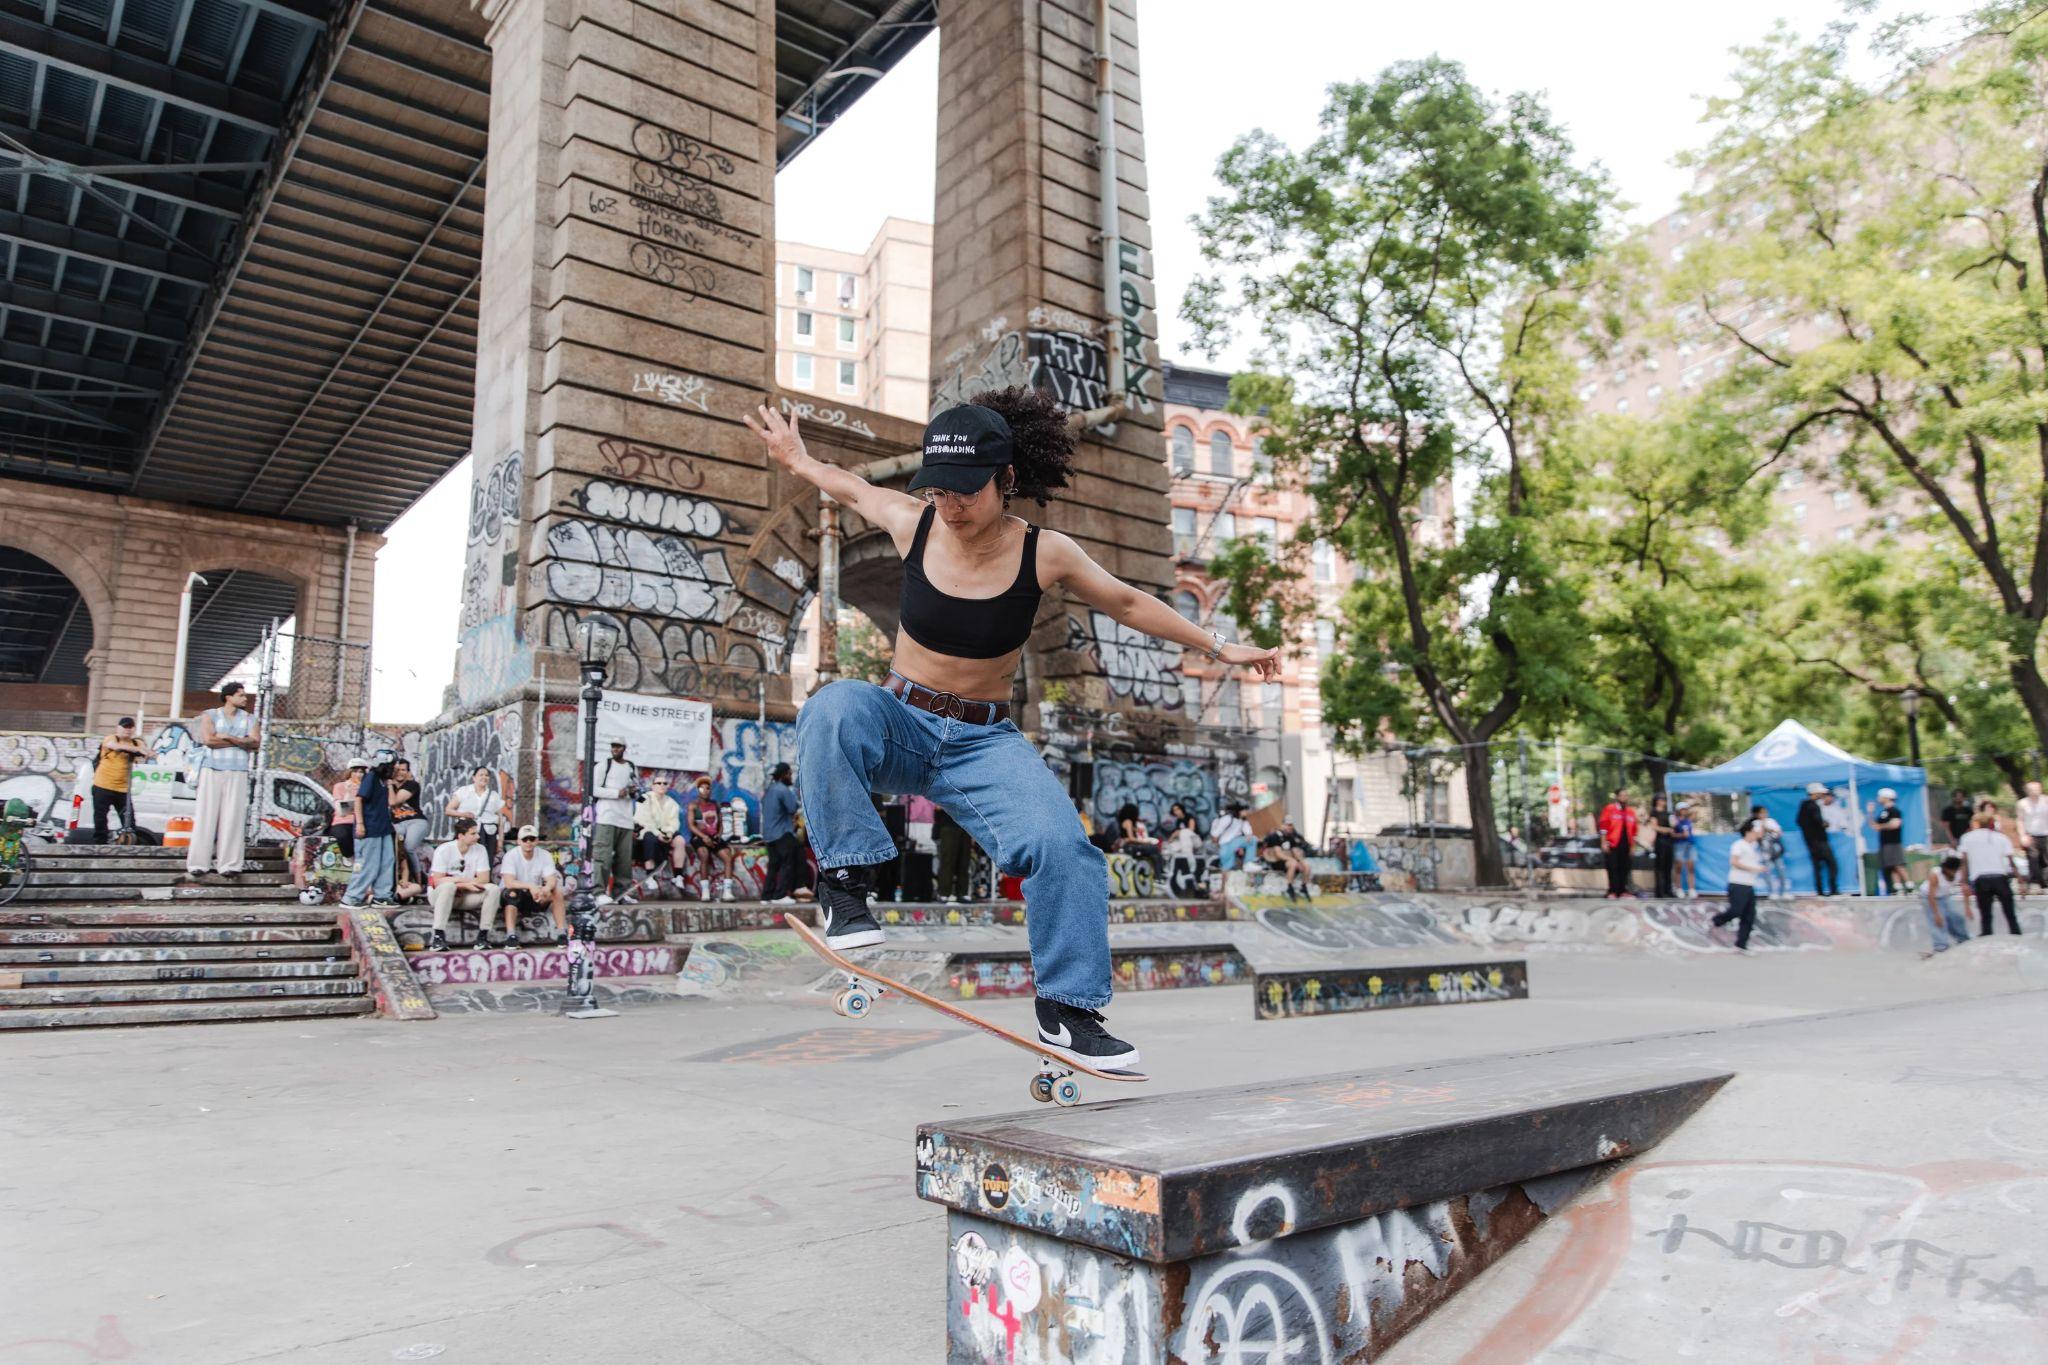
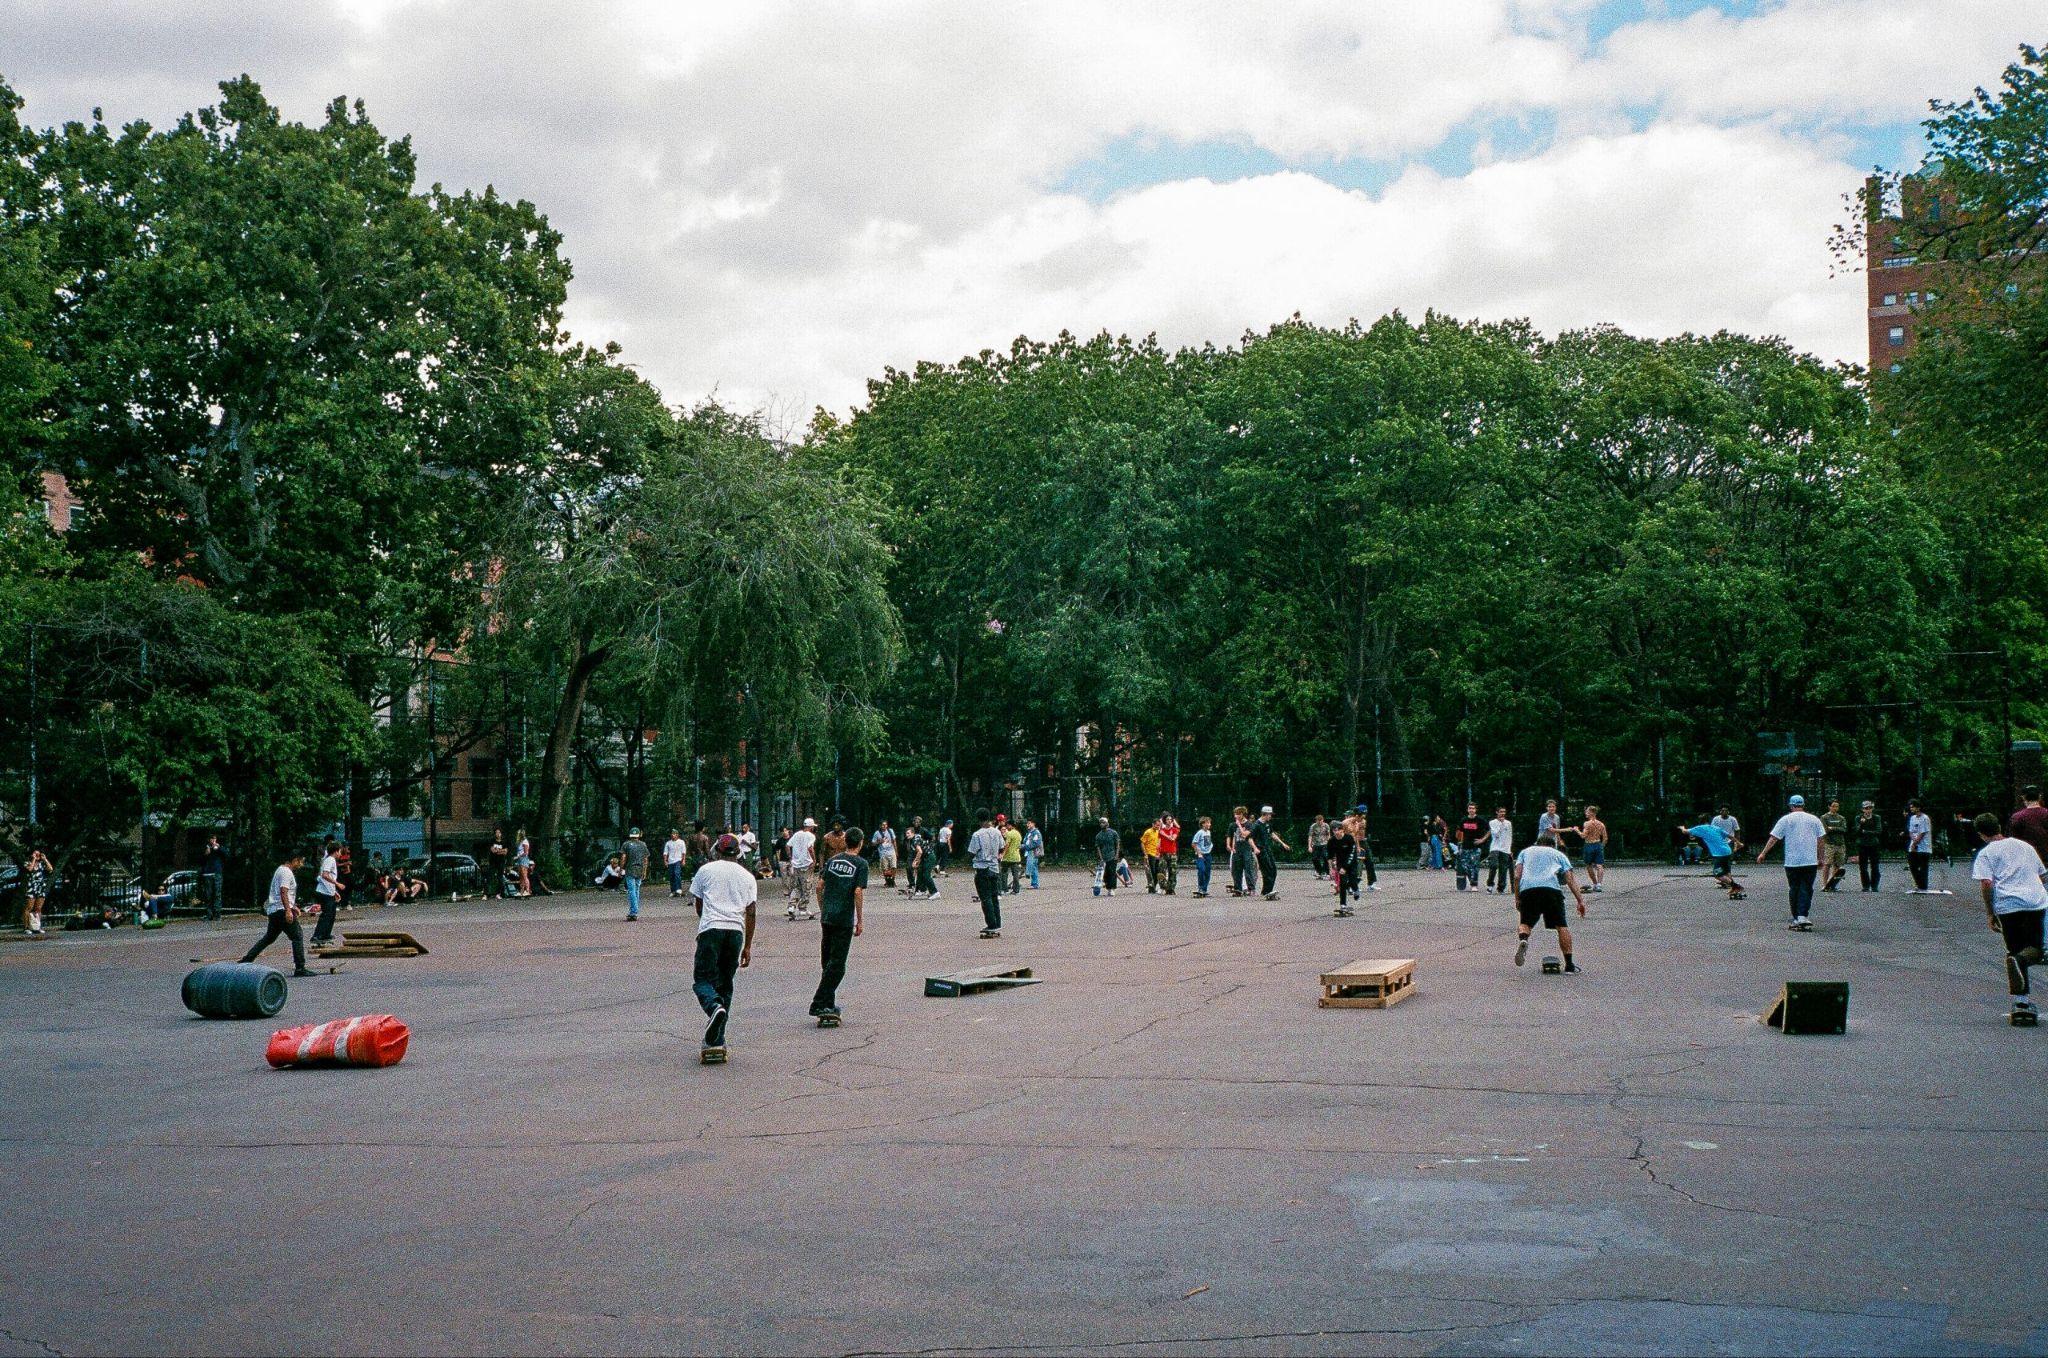
Social infrastructure sites come in different forms. Embracing this diversity is key, since spaces play distinct roles depending on the season, neighborhood, or person. For example, workshops in the Lower East Side found that many teens prefer LES Coleman Skatepark and the East River Waterfront to Seward Park — even if (or maybe because) that park is a major draw for adults, younger kids, and seniors. The siting of these spaces for optimal convenience and regular visits is critical. Most visitors to these sites are coming from nearby and visiting often. For example, 10 minutes is the median time it takes for survey respondents to get to the site (with the exception of 20 minutes for outdoor sites in less dense Poughkeepsie). 90% of respondents across all communities had previously visited the site. People visit often, too; for outdoor spaces in the Lower East Side and Flatbush, respondents reported going 4-5 times a week.
A lackof quality indoorspaces leads young people to stay at home or engage in unsafe activity.
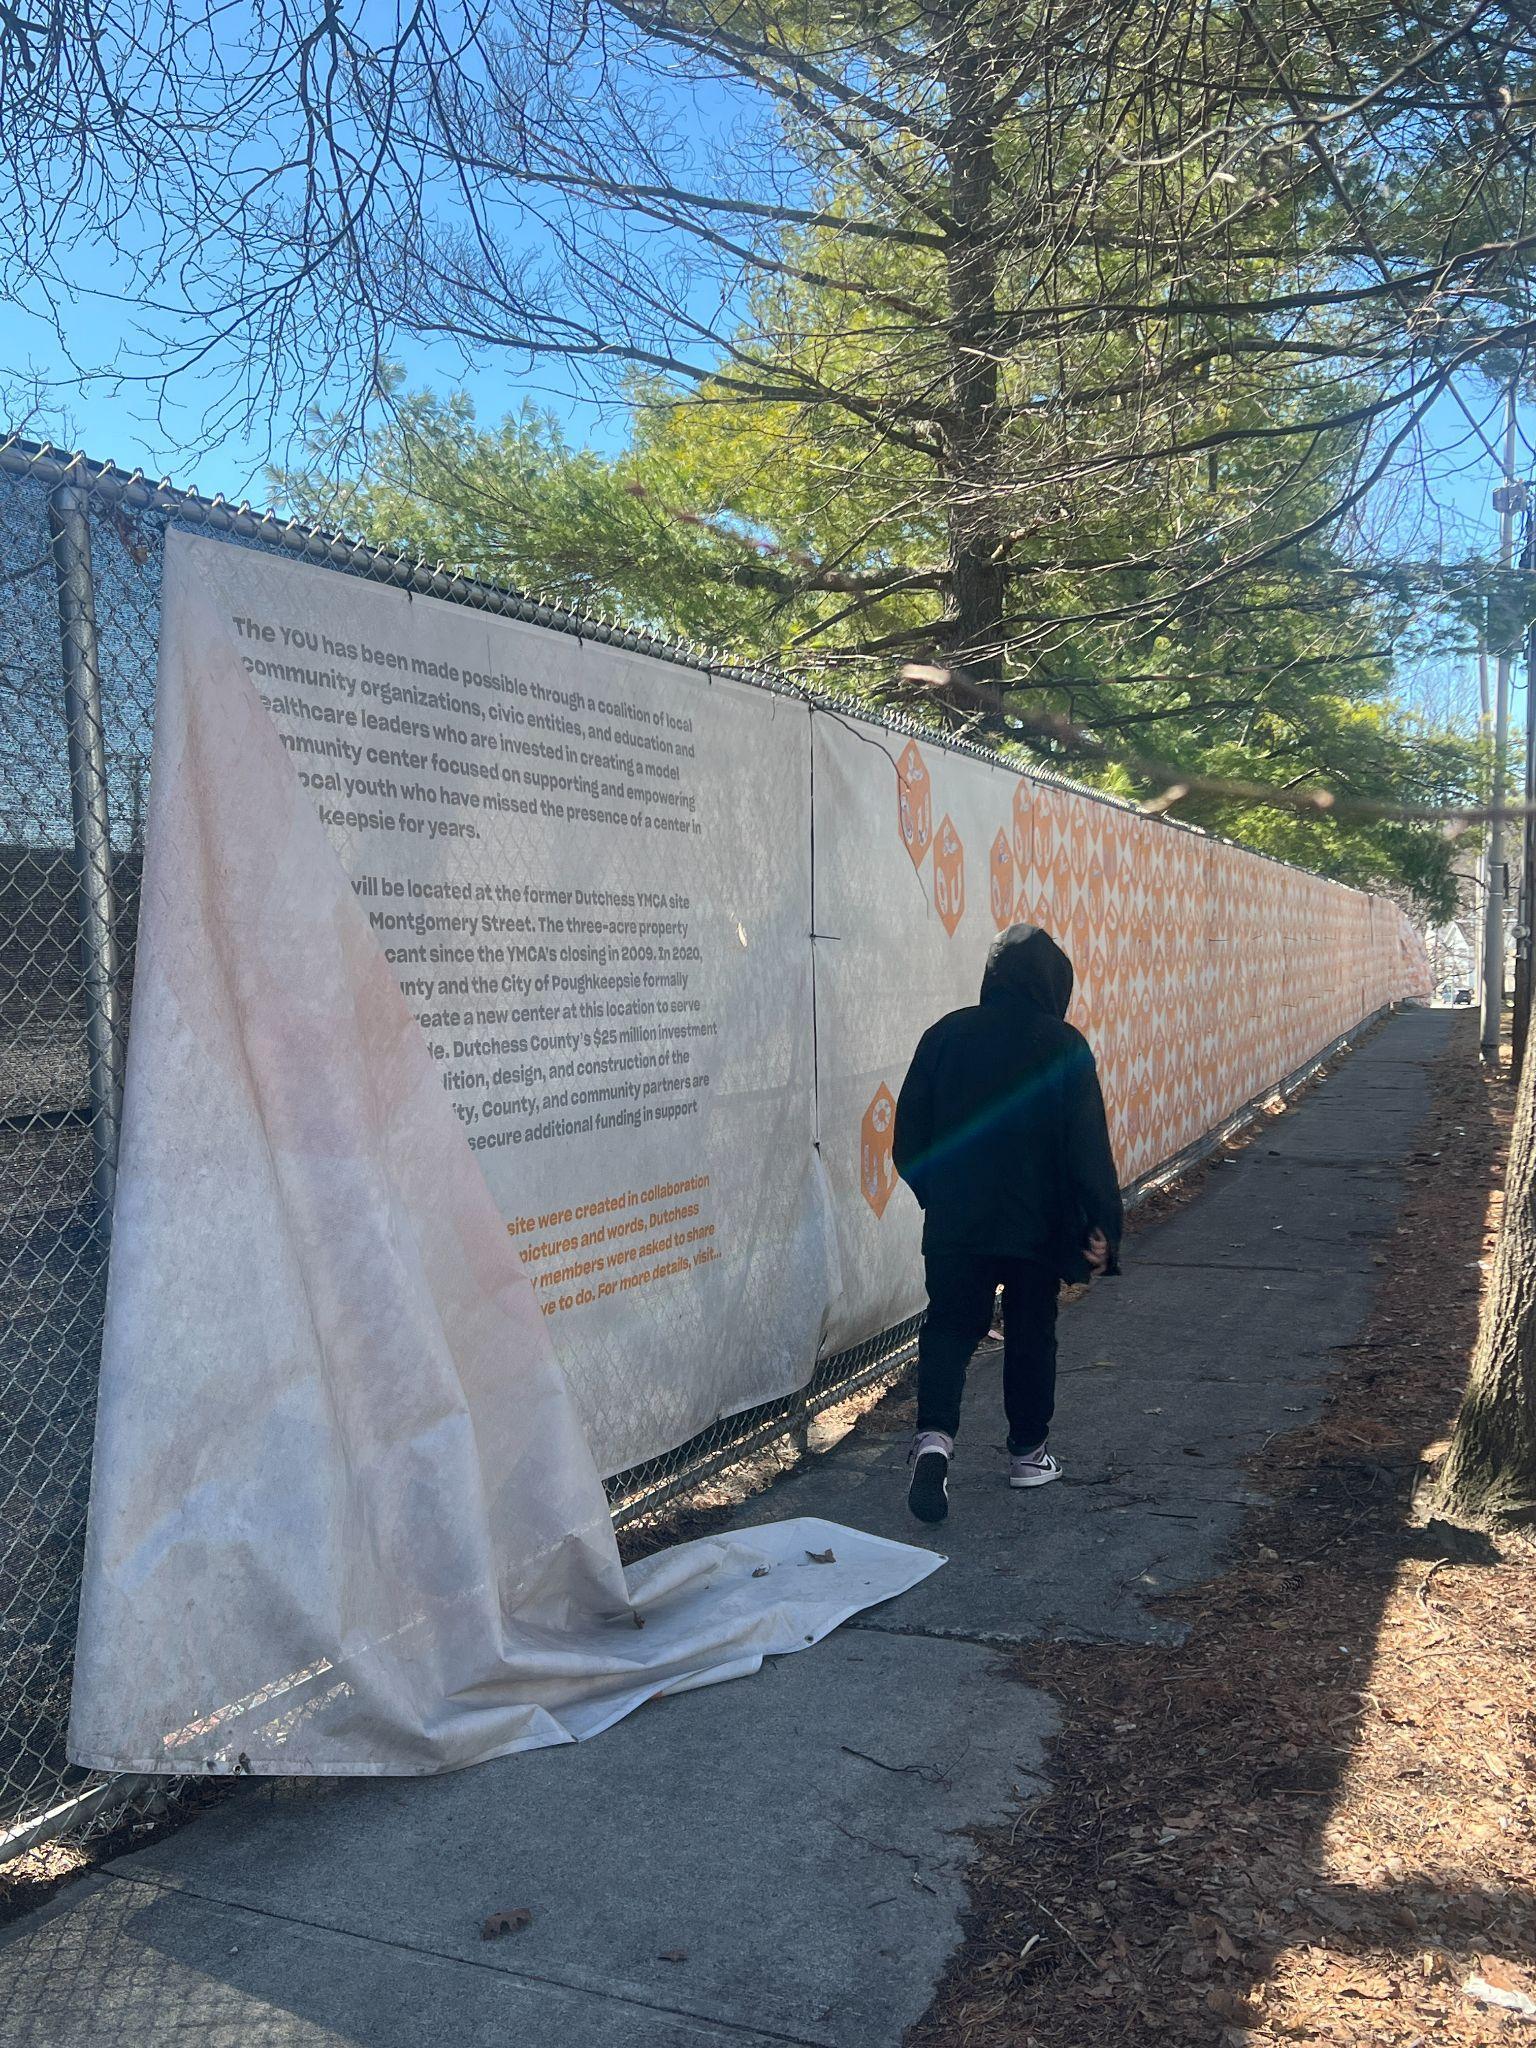
Interviewees repeatedly cited the risks of insufficient indoor space for young people — a risk well-documented in previous research.12,13 In Poughkeepsie, funding shortfalls and long-term closures are to blame. The plannedYouth Opportunity Union near Downtown is at a standstill, following the 2009 closure of the DutchessYMCA and the 2020 closure of the Catharine Street Community Center building. While sites like the Family Partnership Center continue to function as youth hubs, they face tight budgets and access barriers that reduce participation. Over time, this erosion has created a generational gap in both access to and awareness of community centers. L’Quette Taylor, Founder and CEO of Community Matters 2, says “I have a 19-year-old son. He knows nothing of a community center. He has no idea what it is. I’m like, man. That’s where you did everything. That’s where everything happened.”
Youth Opportunity Union Site
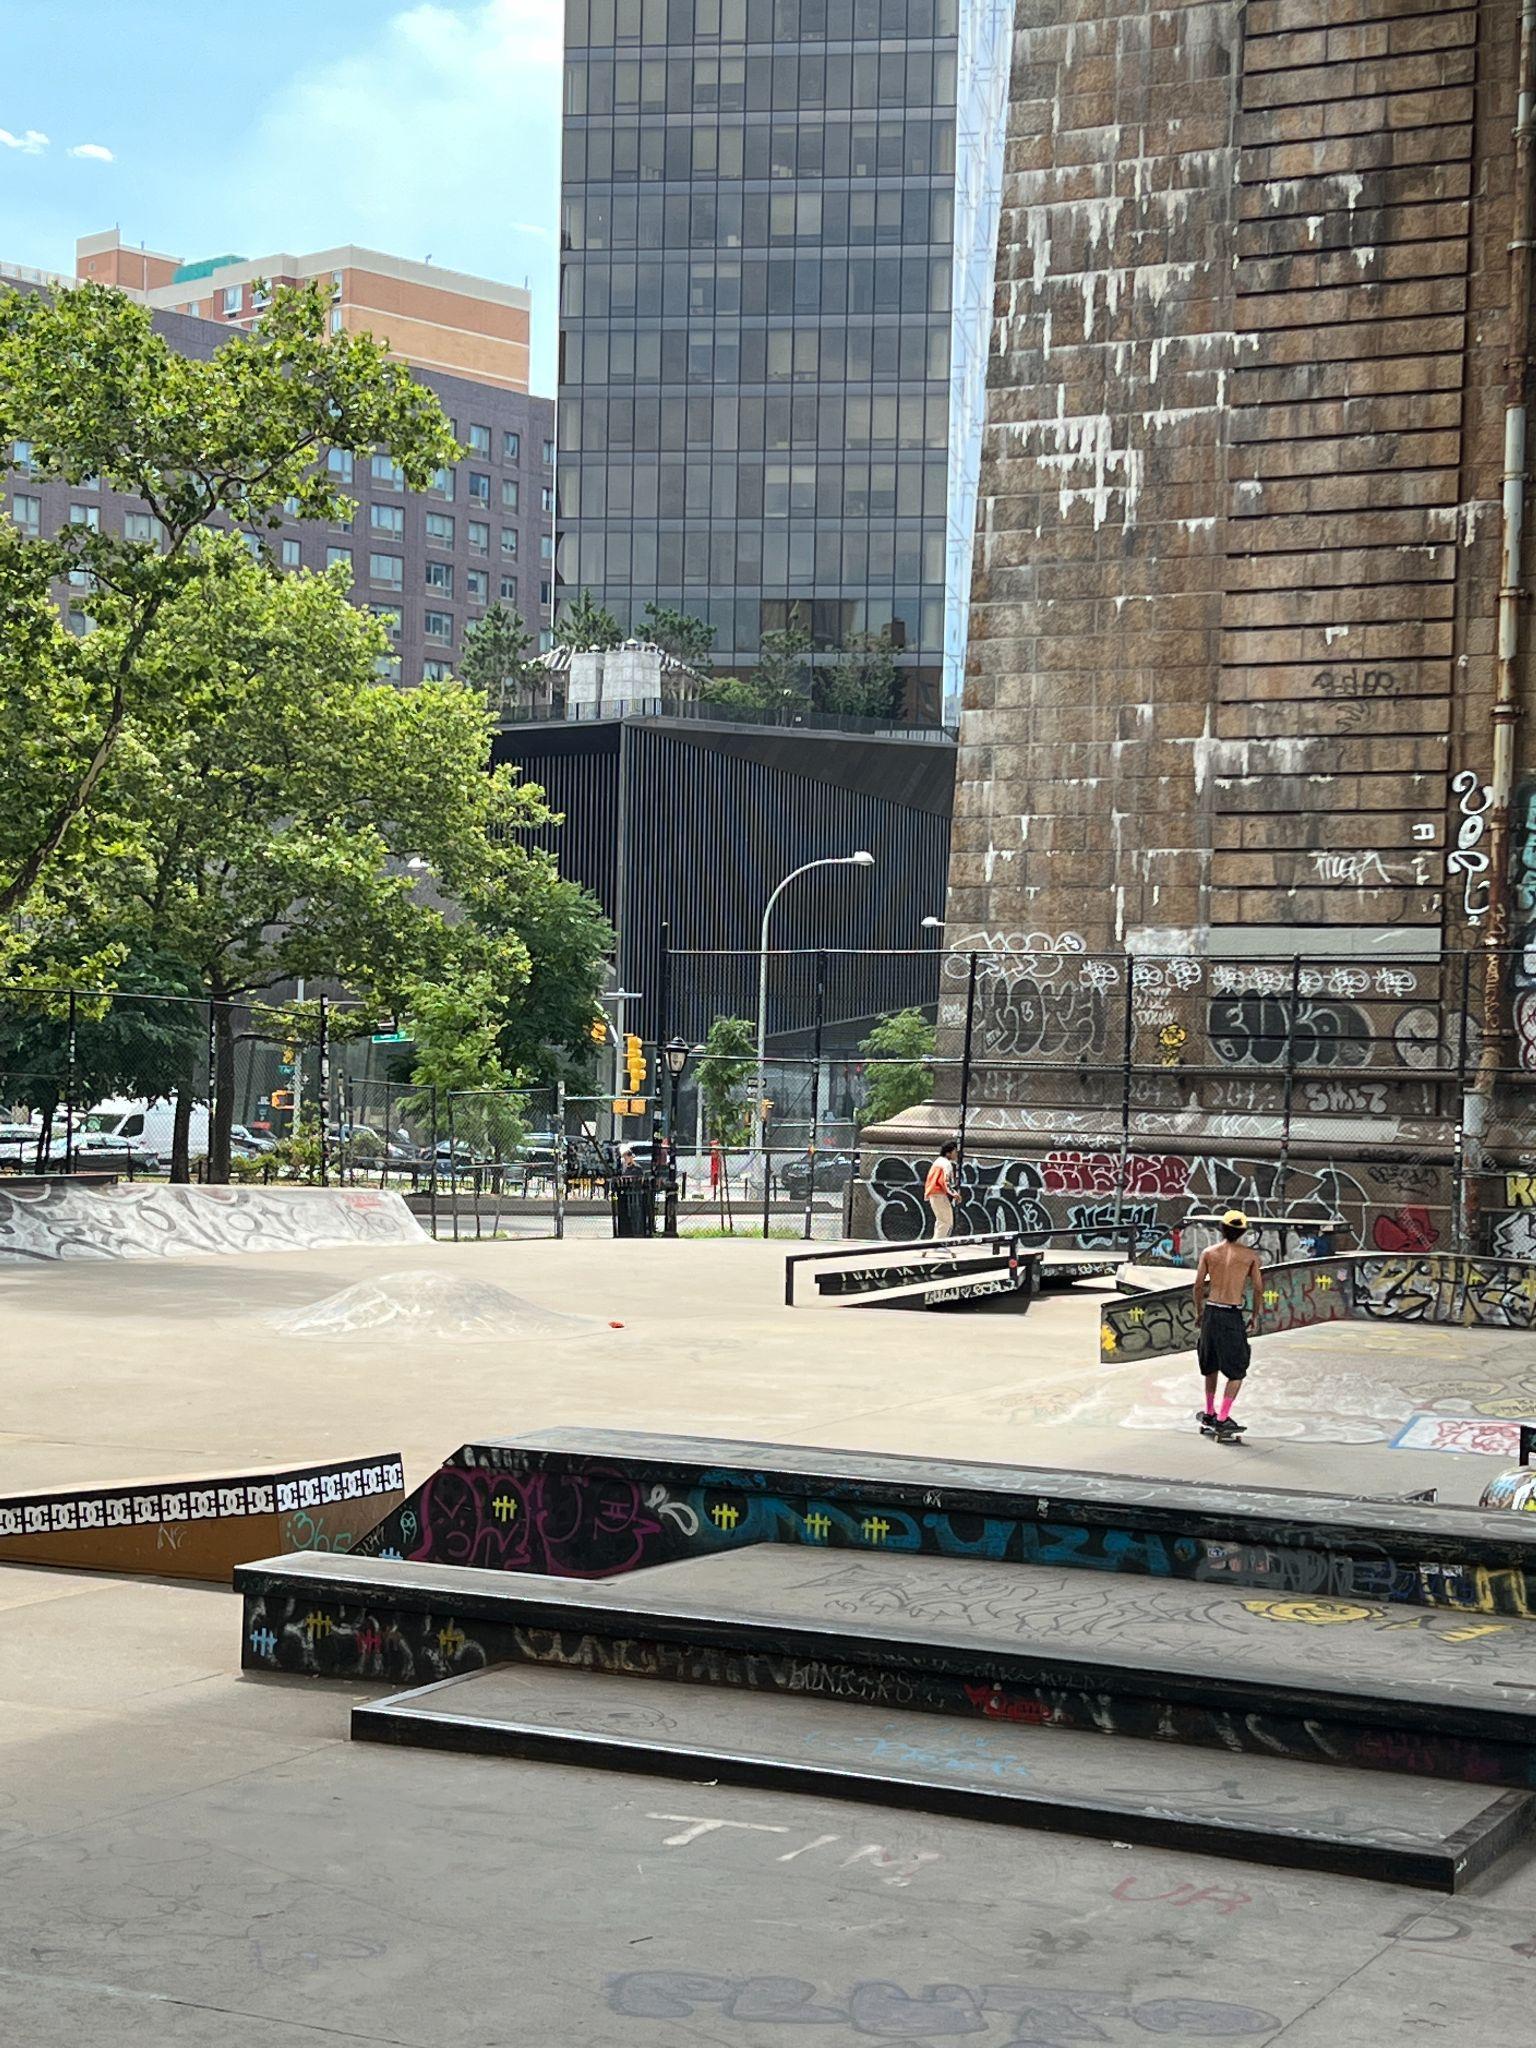
LES Coleman Skatepark
Image source: The Skatepark Project
To be there you need to get there.
Weak spatial links and opaque edges deteruse.
Little protection next to so many cars and few places to cross
Access to social infrastructure is more difficult without safe, convenient connections.
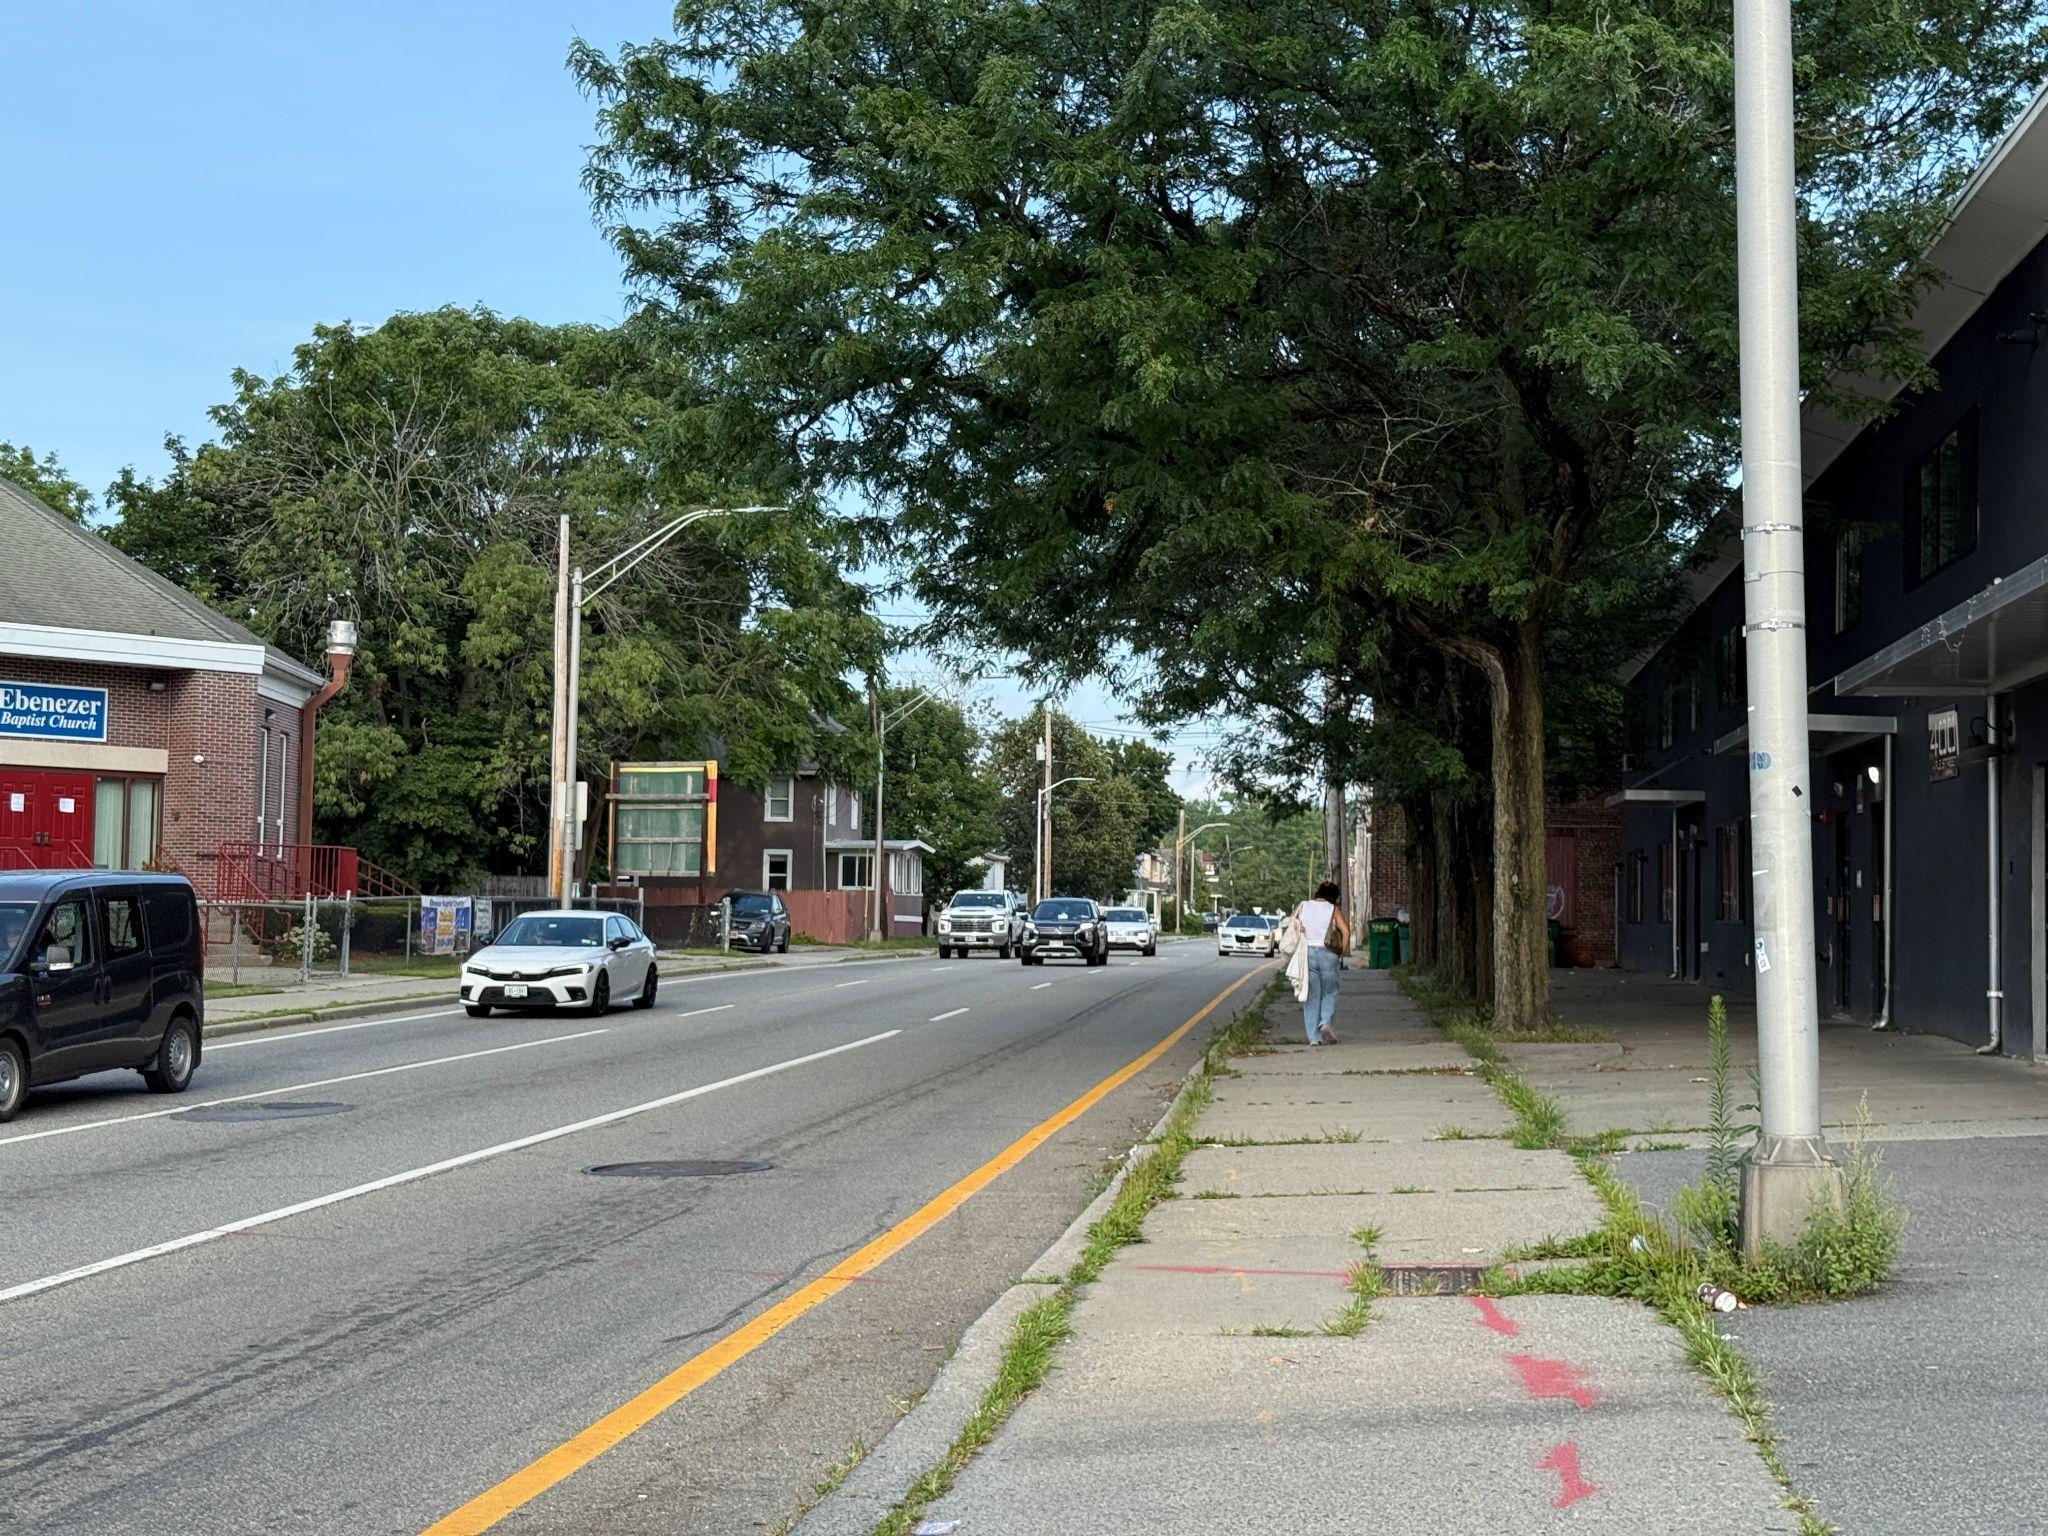
In Poughkeepsie, interviewees and focus group participants identified high-speed arterial roads — where multiple pedestrian injuries and fatalities occur — as barriers for young people reaching key sites like the Family Partnership Center. For example, the 25-minute walk from the local high school requires crossing two arterials, discouraging everyday visits on foot.
Similarly, Lower East Side teens described the waterfront as a favorite hangout, but the photos they submitted from Eye Level City walks revealed that ongoing construction made crossings stressful and difficult. These barriers make it harder for people to visit sites, even if they are proximate.
Street experience matters — building facades and edges of indoorsites can invite ordeter.
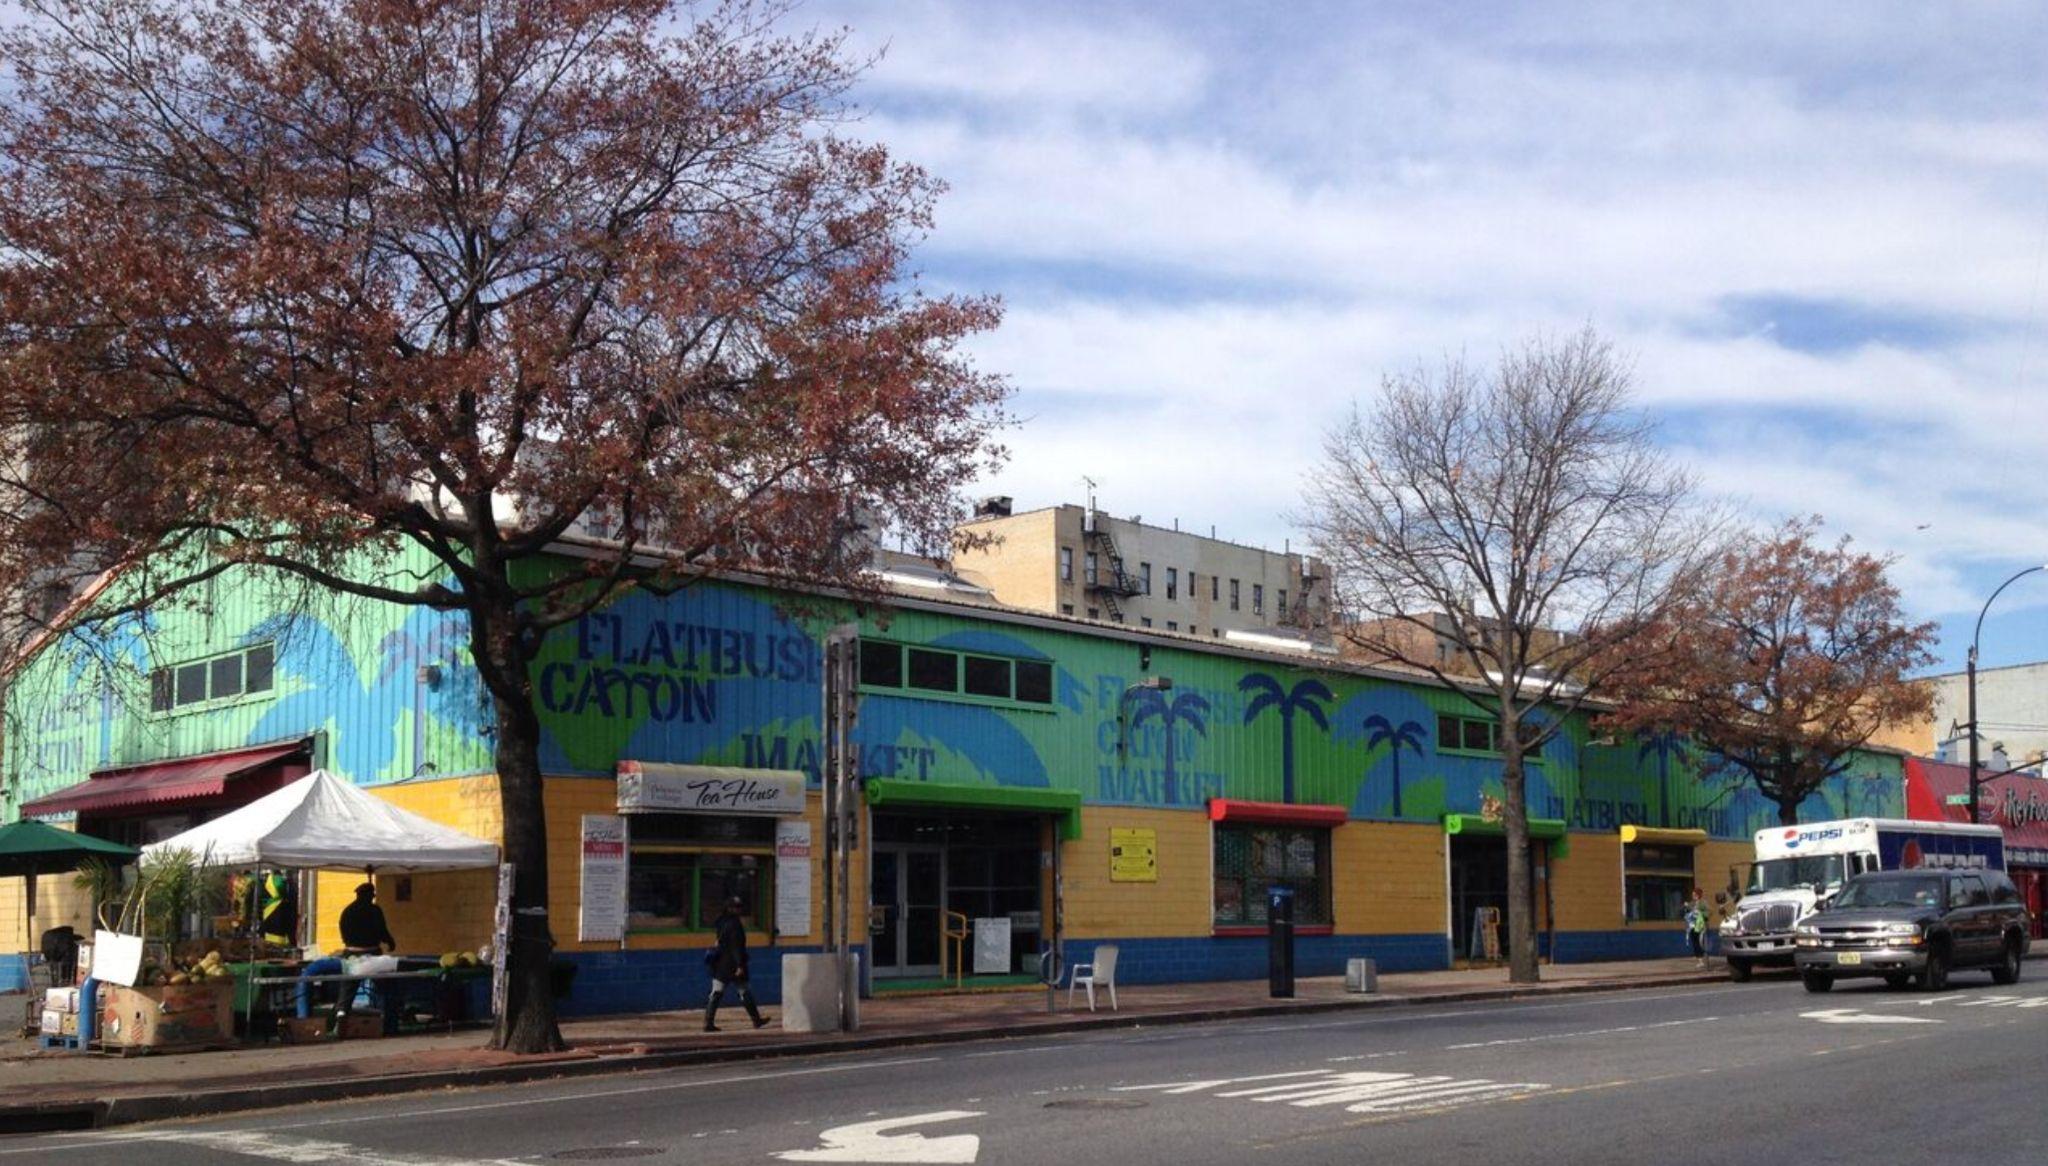
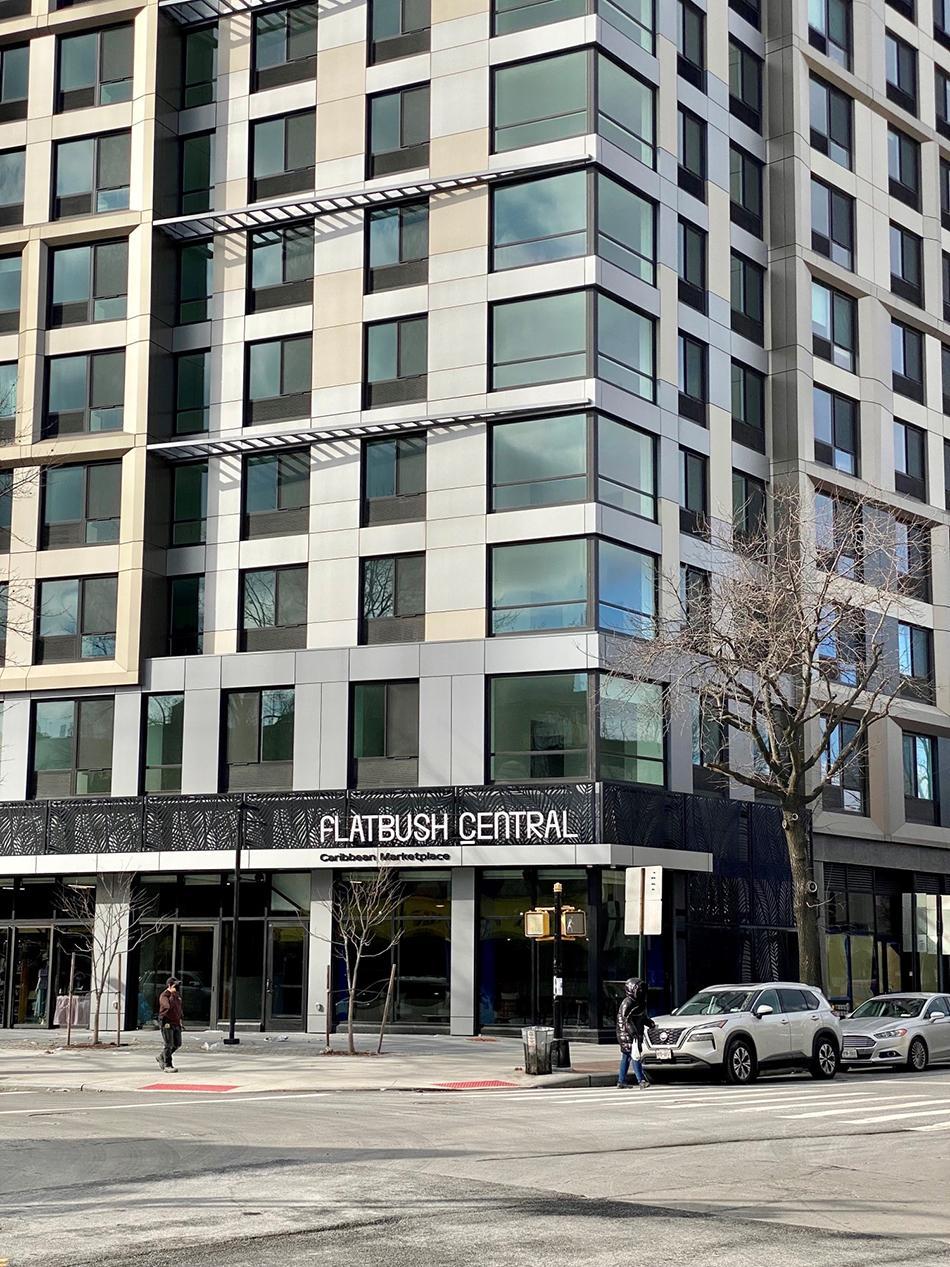
While indoor social infrastructure is essential, unwelcoming or poorly oriented exterior edges can discourage use. For example, the plaza outside the updated Caribbean Marketplace in Flatbush sees little activity (just 23 people over 5 hours) despite the market’s cultural and historical significance. The former market featured warm, colorful facades and window bays oriented toward Flatbush Avenue, while the renovated building has cool, monochrome facades of glass and steel, with entrances tucked onto a side street away from the main avenue. In a place where the local community already perceives problems — interviews revealed avoidance of the market due to lack of affordability and inauthenticity — low-quality building edge conditions compound access challenges.
Then
Warm, colorful facade
Entrance and window bay oriented to street
Monochrome facade
Entrance and plaza oriented on cross street away from Flatbush Ave
Features that keep people comfortable invite them in and extend theirstays.
Sittable ledges
Comfortable seating encourages people to spend time in a place.
In Seward Park, plentiful seating — benches, ledges, and library steps — invites people to rest and connect; three out of five visitors are seated.
In Flatbush, limited seating signals that gathering is not encouraged, contributing to comparably low satisfaction in the sites (78% vs. 90% elsewhere) and less on-site socializing, despite frequent recognition among residents. As Rona Taylor of CXSE Brooklyn CDC notes, “Any kind of seating where people can just sit and relax really matters. There isn’t much of that in the community, and people often feel discouraged from gathering.”
Prior Gehl research on public space interventions at The Bentway in Toronto found that 71% of survey respondents said that public seating enhanced their meaningful interactions.3 While seating is not new to urban design guidelines, this new research highlights its importance for more than physical comfort.
No shade, no seating
Exposure to microclimate (such as heat orcold) determines whether people use public spaces.
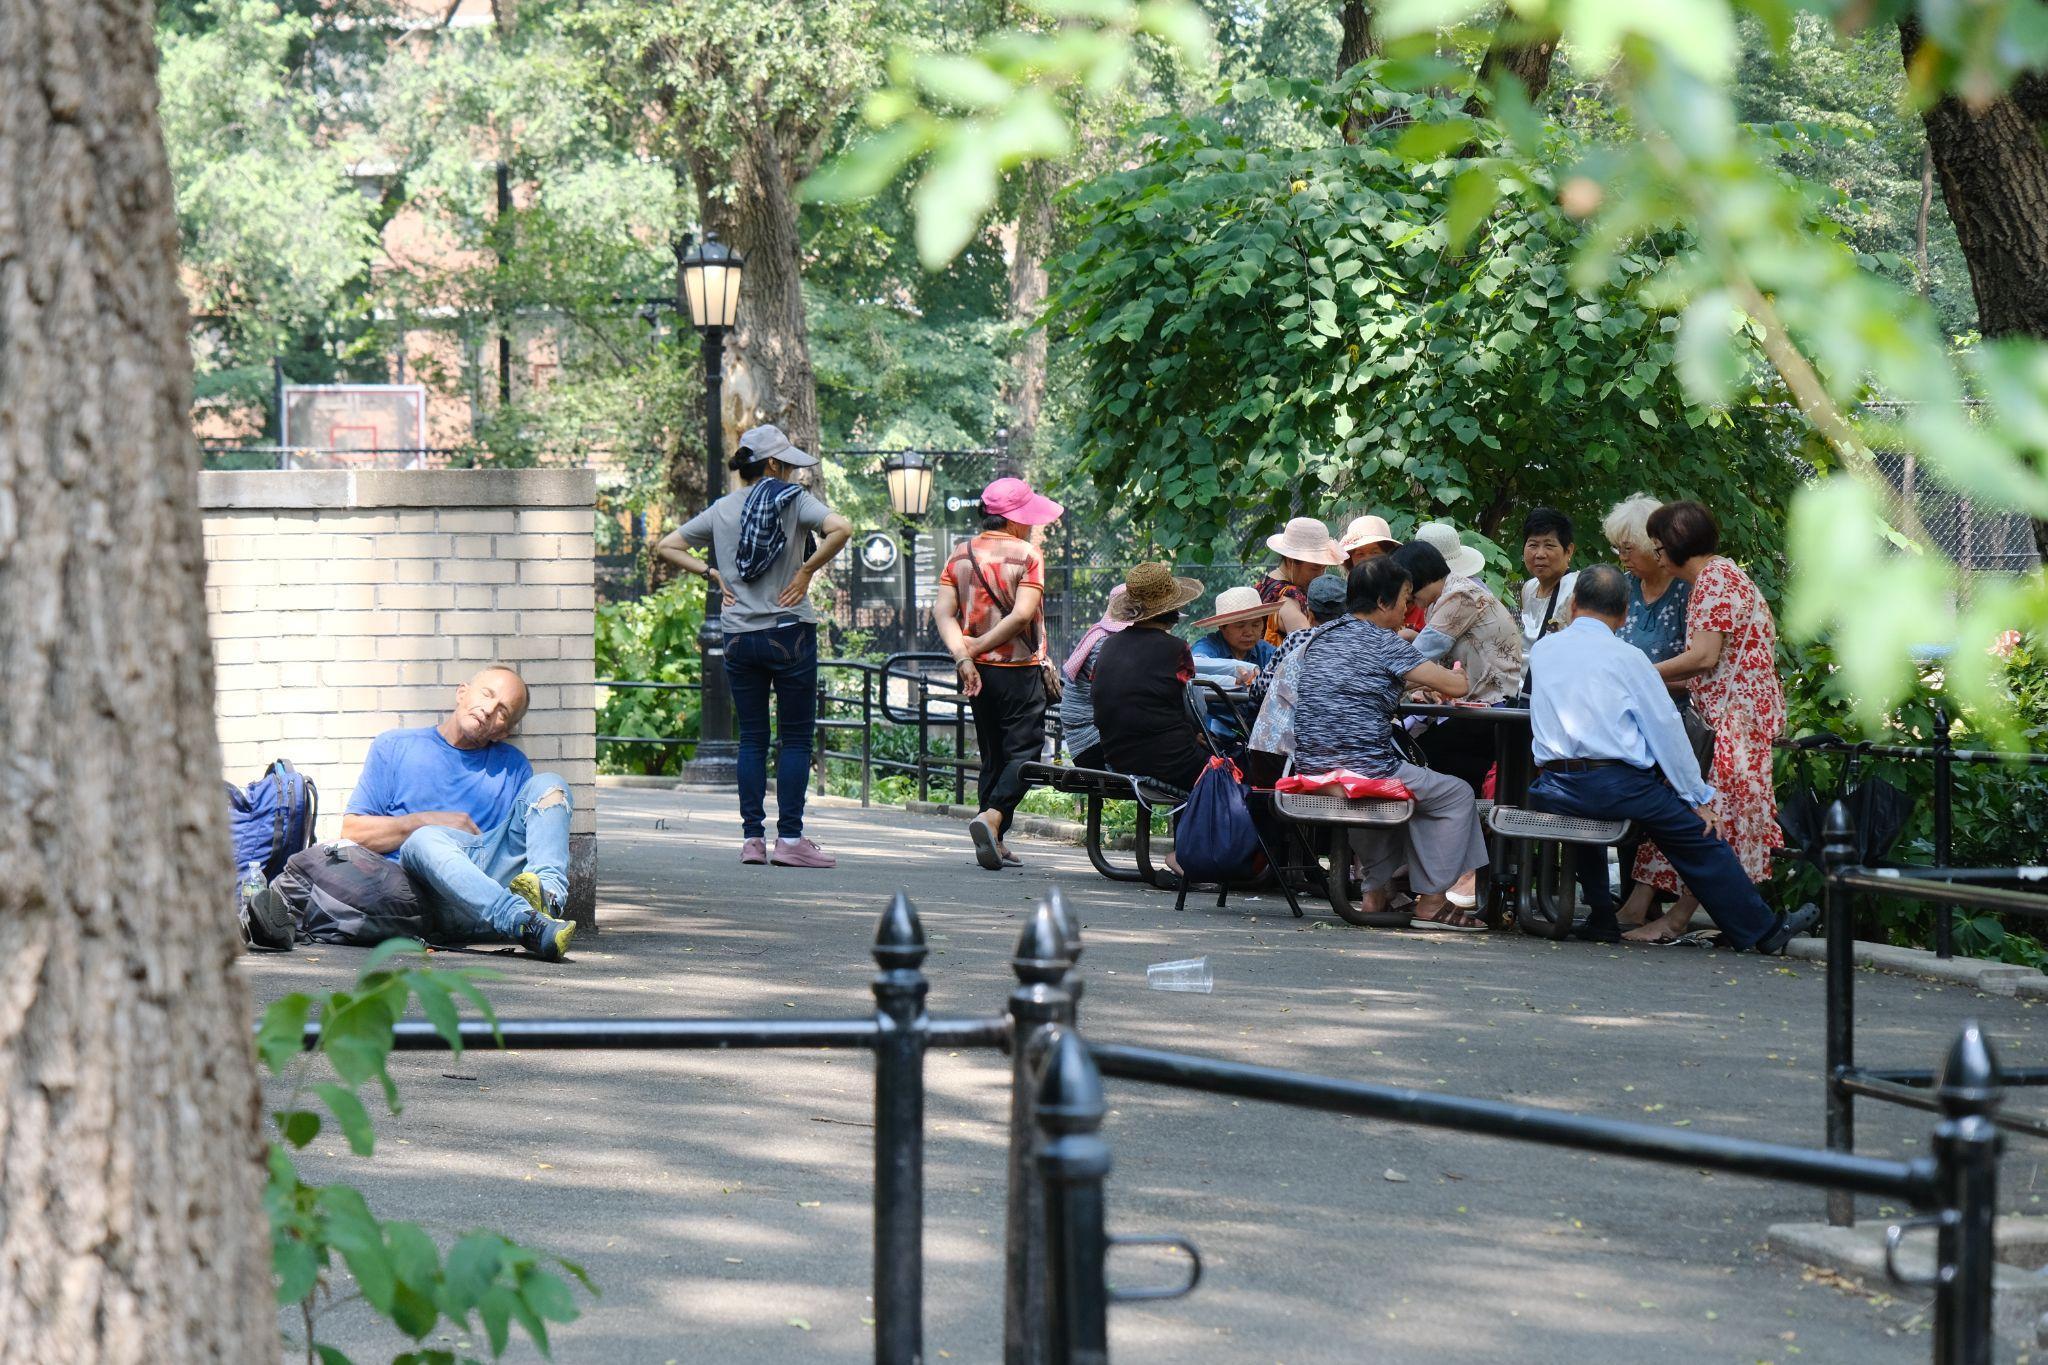
Visitors to Seward Park value shade and fresh air, often gathering under trees and the air-conditioned interiors of the Seward Park Library. When surveyed, many cited “cooling down in summer,” “getting fresh air,” and “being with the community” as primary reasons for visiting, underscoring how shade and thermal comfort encourage people to stay, rest, and socialize.
By contrast, Flatbush Avenue offers little shade or shelter, despite serving as a major corridor for neighborhood activity in an area with limited green space. Exposed sidewalks and unsheltered bus stops provide few comfortable places to pause, forcing residents and transit riders to hang out in the sun. At night, inconsistent lighting along the corridor deters use even further, particularly for women, whose presence tends to decline after dark and cluster in better-lit areas.
Everyday low orno-cost activities are most effective at generating consistent use.
Everyday, self-organized activity is the key to consistent visits — not once-in-a-blue-moon festivals.
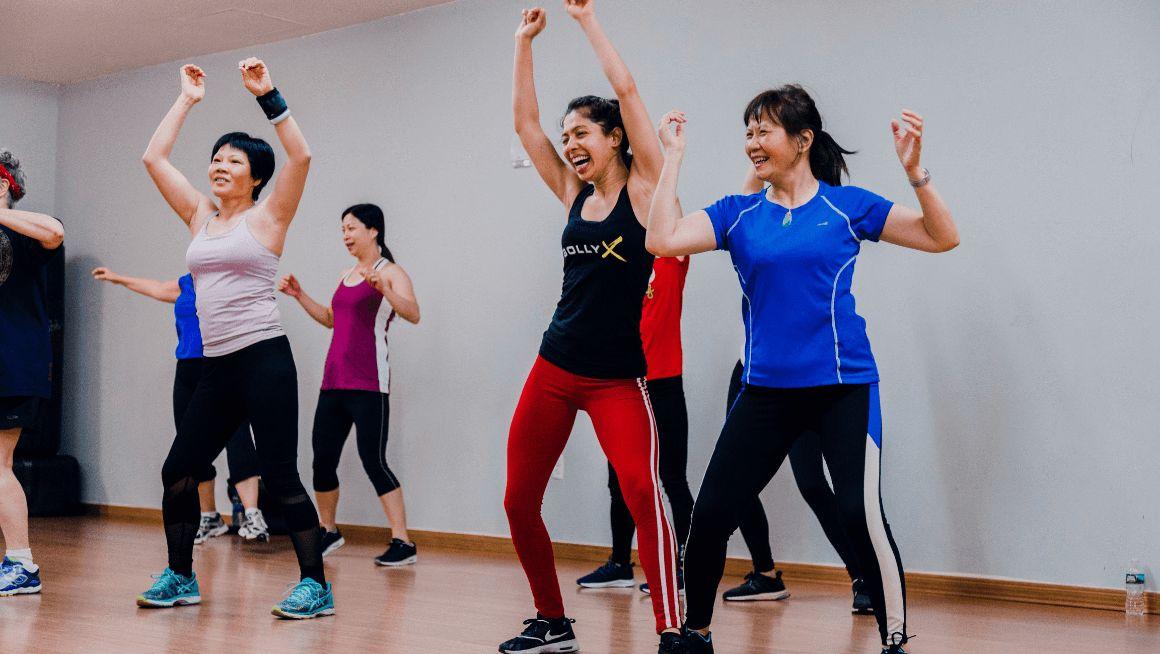
Seward Park clearly demonstrates the value of everyday programming: informal dance groups and ping-pong competitions draw steady, age-diverse participation, with children, teens, adults, and seniors regularly sharing the space. Observations show that 60% of park users are non-adults, including 10% children under the age of 12 — closely reflecting neighborhood demographics.
In contrast, while Poughkeepsie residents value large festivals and one-off events, many emphasized the need for more consistent, accessible programming. Estefany Umbach of Day One Early Learning Community noted that empowering residents to help sustain public spaces and activities could strengthen everyday community use.
Free orlow-cost programming is more likely to invite the whole neighborhood, ratherthan expensive events.
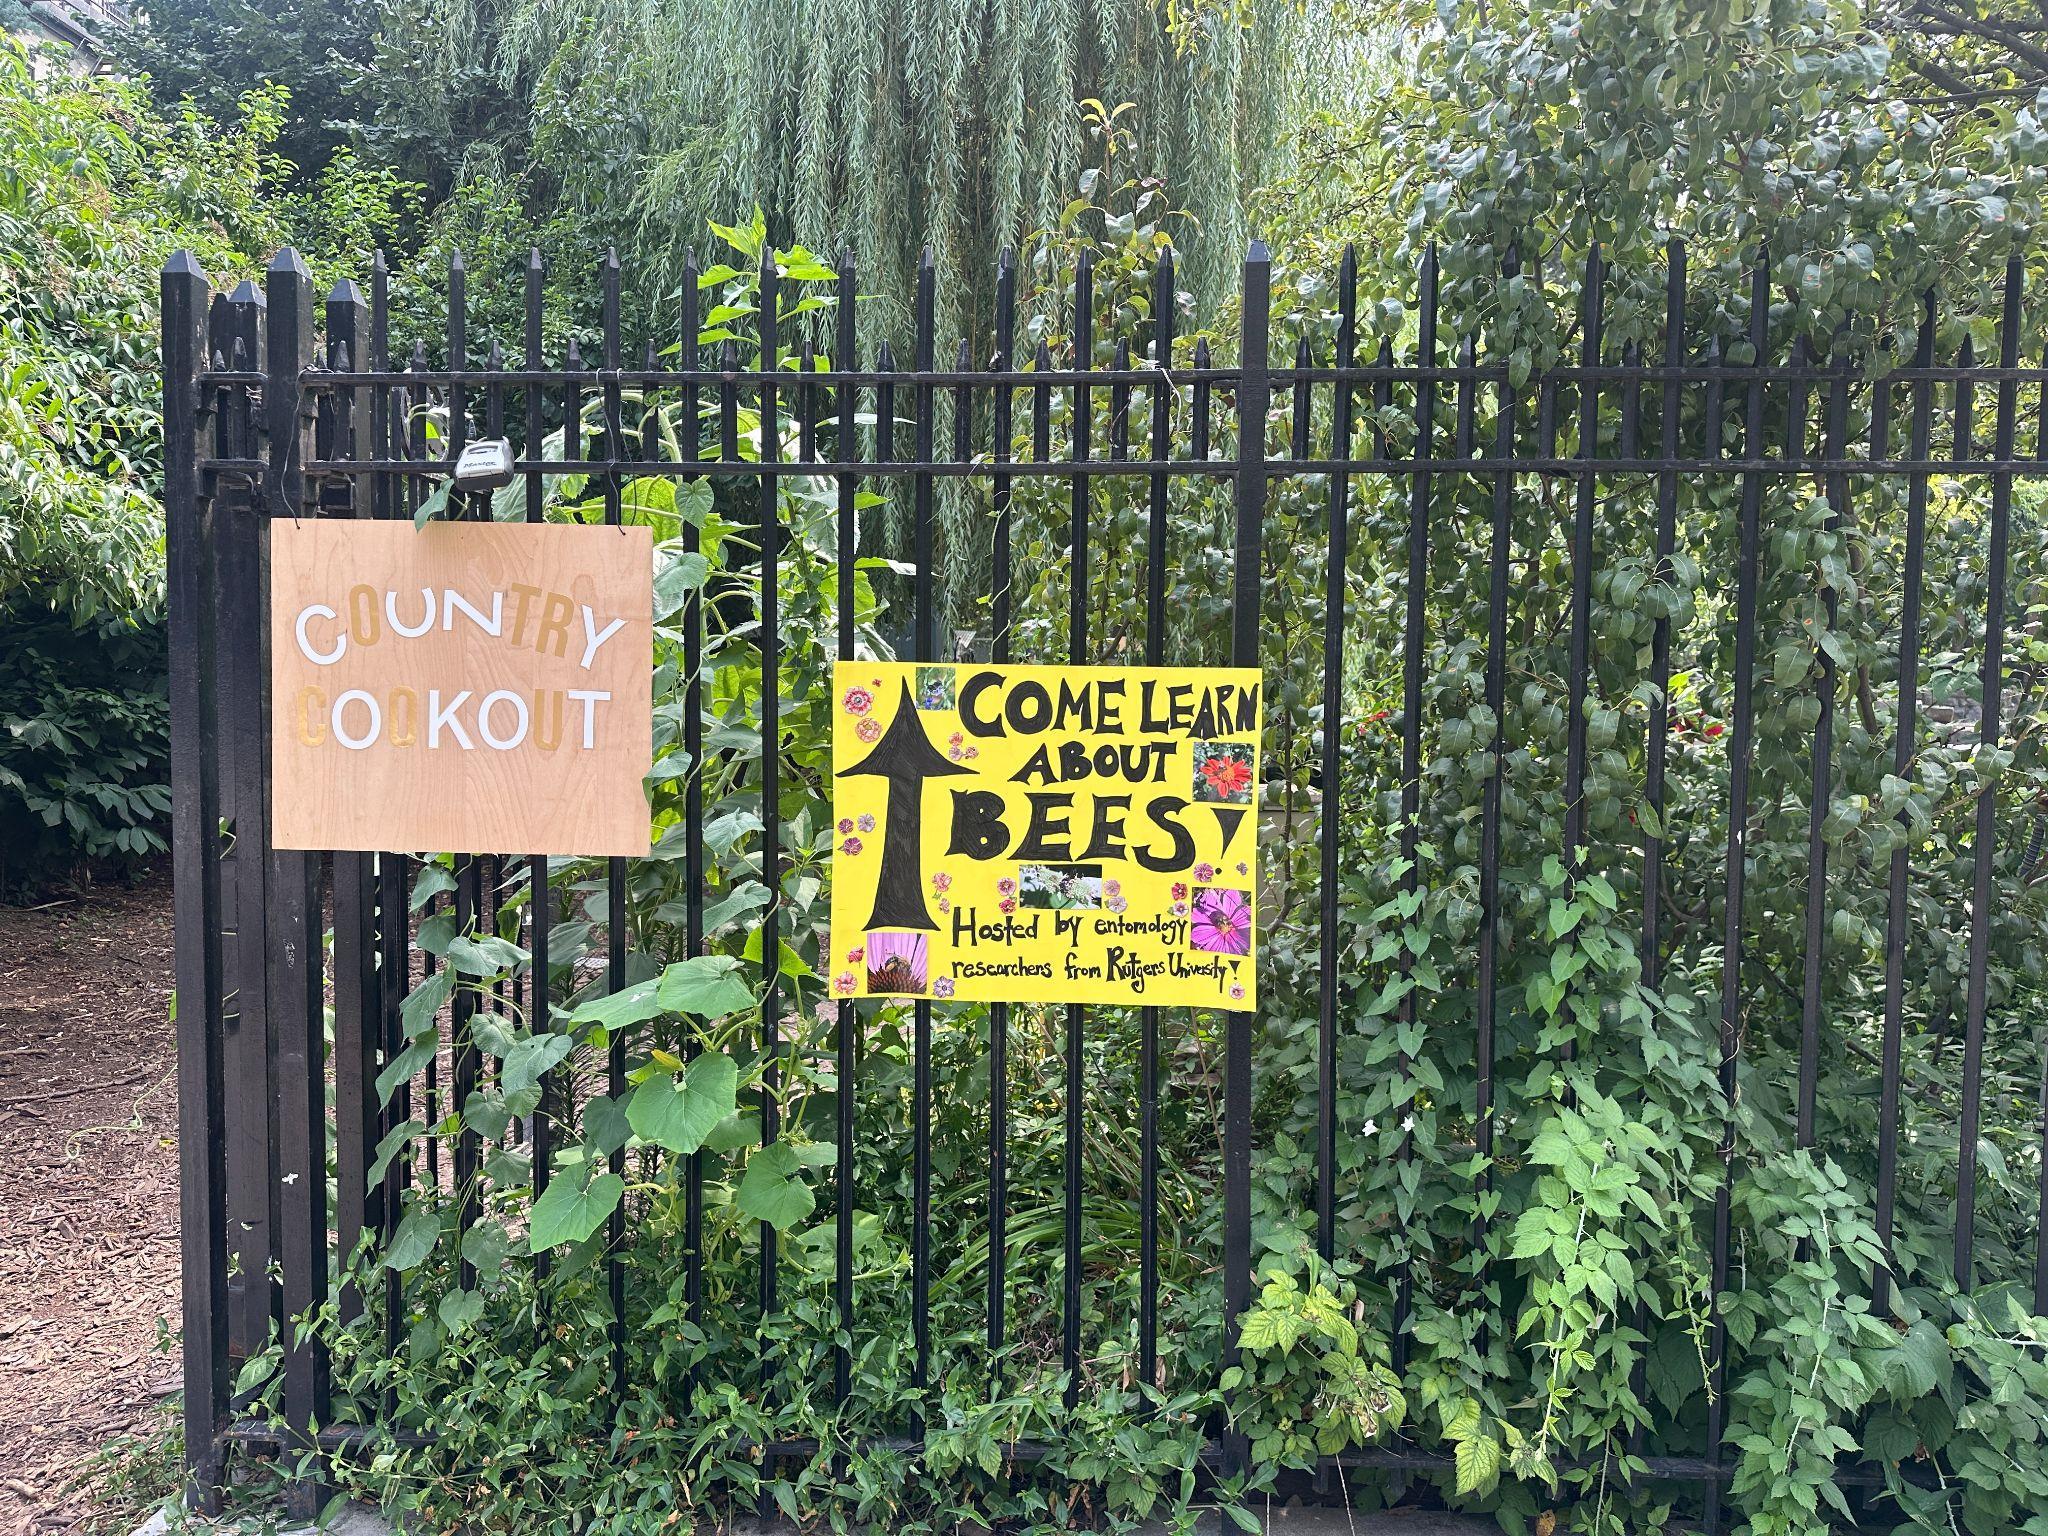
Cost of entry shapes who participates. Observations showed a greater diversity of ages and activities when programs offered were free or low-cost — such as storytime at the library, tai chi in the park, and community cookouts. For teens engaged in the Eye Level City workshops, spaces that had affordable food options, like low-cost food trucks nearby, drew more interest and larger crowds.
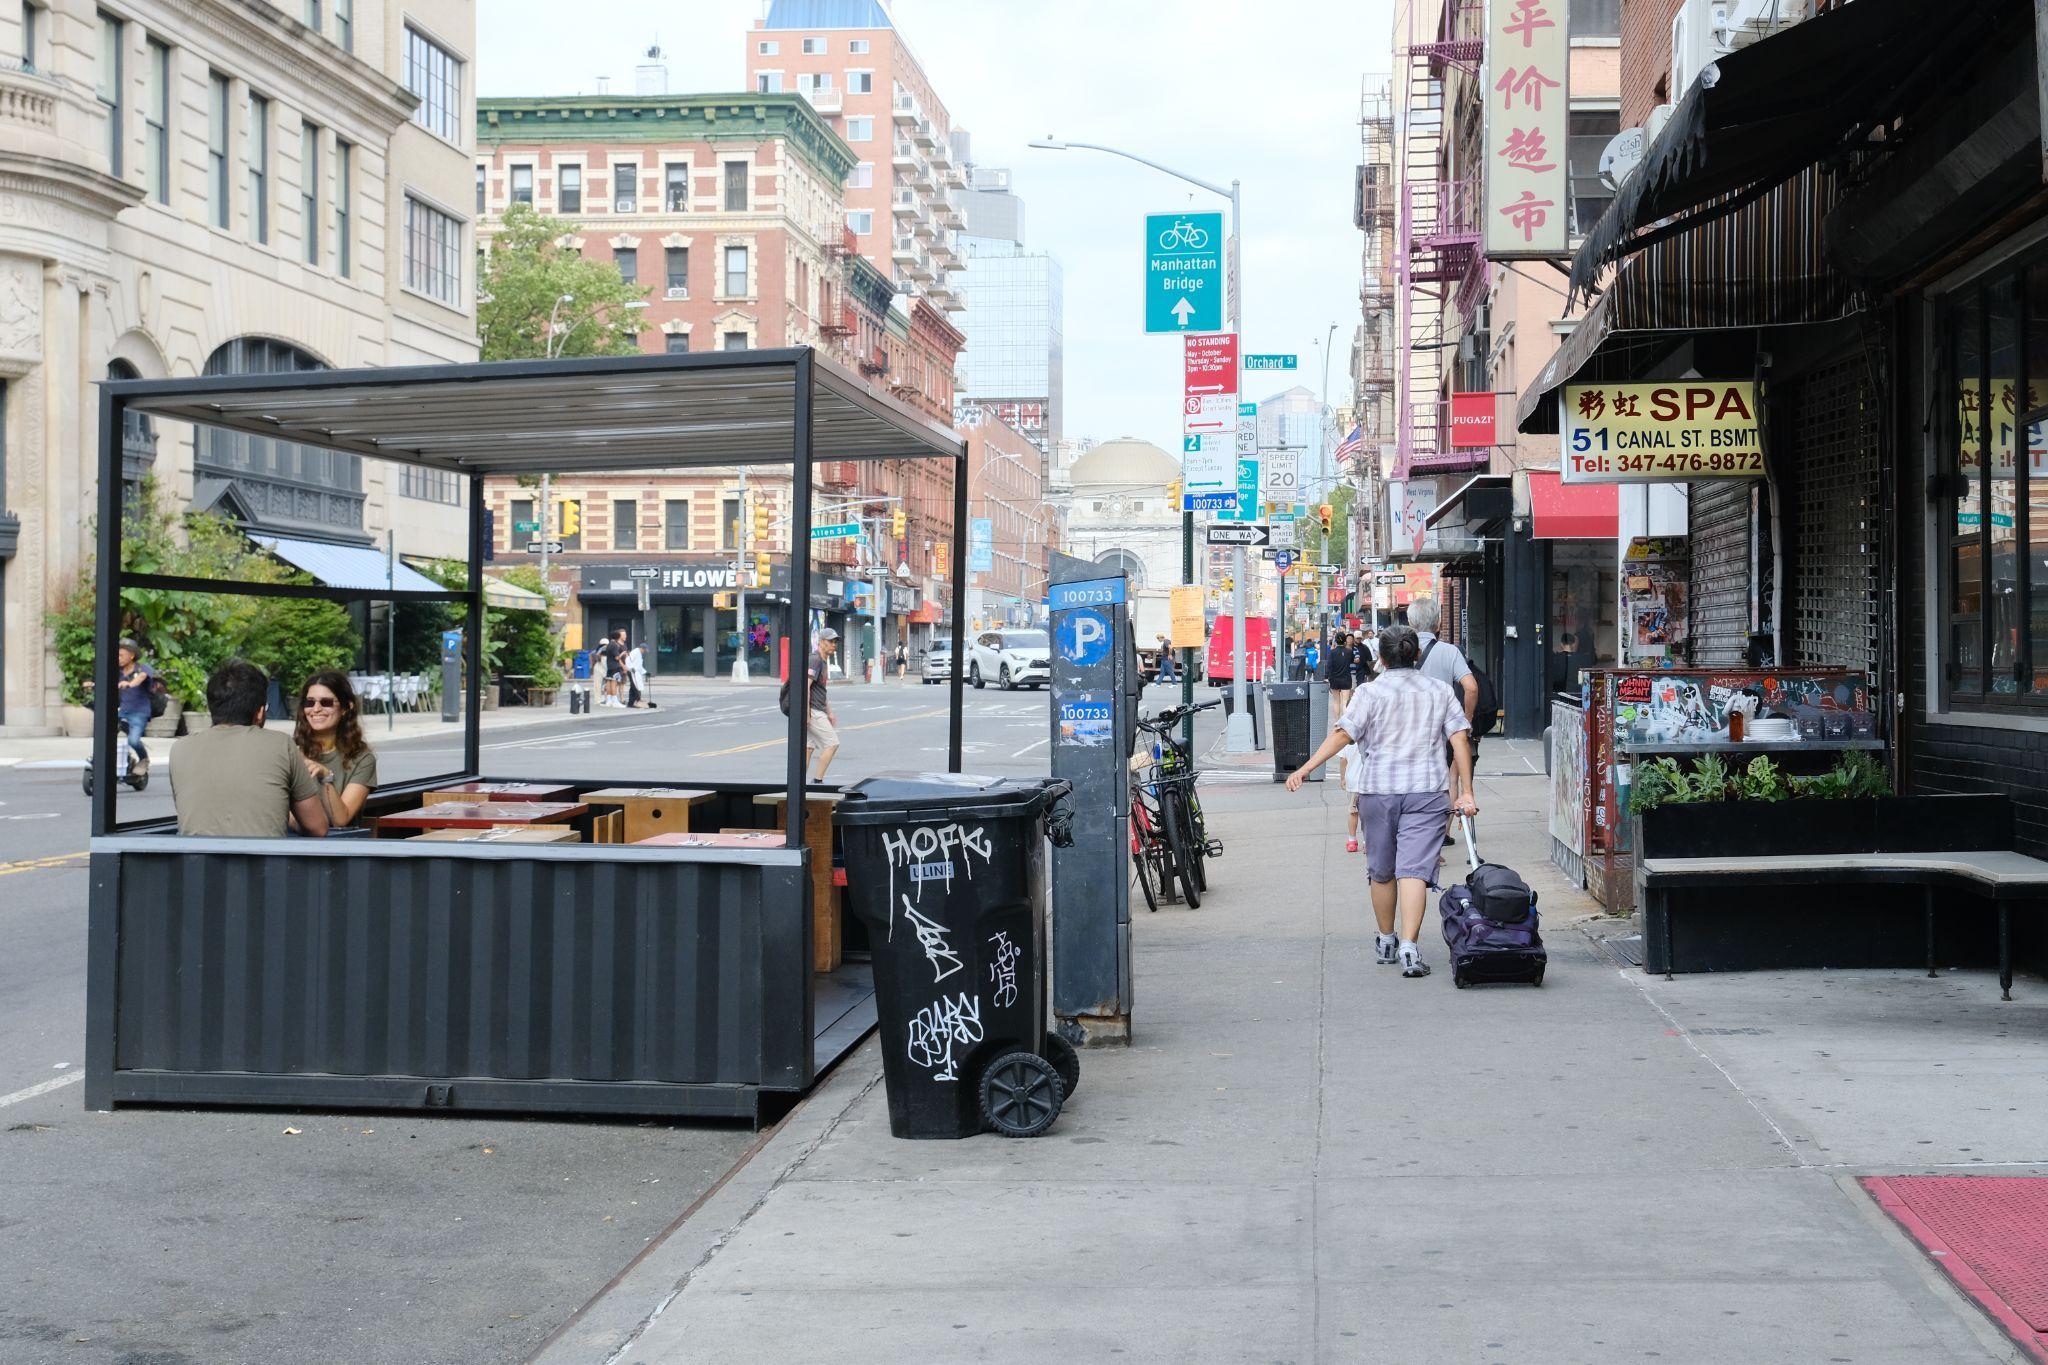
By contrast, Open Streets tended to attract a narrower age range and limit opportunities for social mixing. On Canal Street Open Street, for example, 100% of users observed during weekend operating hours from 9 AM to 9 PM were adults, with no children or seniors present. The Open Street offered no alternative programming outside of outdoor seating for restaurants and bars.
Cortelyou Library Storytime
Clean spaces paired with friendly faces make fora more welcoming environment.
93%
of photos of poorly maintained conditions were tagged with negative emotions. e.g.,
Forall ages, a clean, cared-forspace sets a first impression of perceived safety and desirability.
Eye Level City photo data across all participants, spanning the ages of 16 to 78, reinforces this finding: markers of poorly maintained conditions, such as litter, broken sidewalks, pollution, and vandalism, are consistently associated with negative emotions. Teen participants in particular were so put off by a perceived lack of cleanliness in spaces like Seward Park that they turned to nearby spaces like East River Park instead.
Past research shows that failure to maintain a space can compound into bigger civic challenges: poorly maintained spaces have been strongly associated with lower civic pride, trust in neighbors, and trust in local government.13
Having people in place to steward spaces — not just clean them — can help set a more welcoming tone.
In Poughkeepsie, Scenic Hudson and Hudson River Housing have hired full-time park stewards — not law enforcement or social workers — to serve as friendly, community-facing staff at Pershing Avenue Park and Malcolm X Park. As Director of Urban Conservation Duane Martinez explained, the program helps reduce the power imbalance some residents feel with law enforcement.
While publicly funded workers must remain the primary stewards of public space, grassroots stewardship, like volunteering in gardens or helping at events complements professional staff, fostering ownership, social connection, and well-being.15 At Lower East Side and Poughkeepsie community gardens, focus group participants reported a mix of professional staff and volunteers has strengthened daily maintenance and the social life of the space.
Operators face bureaucratic roadblocks and coordination challenges.
“So many nonprofits competing with each otherforgrants.”
Poughkeepsie non-profit leader
“Capital projects take a very long time — is there a ‘capital lite’ version?”
Funding Time Approvals Insurance
“We have trouble staffing up ourafter-school programs because people do not have the right licenses.” Poughkeepsie government interviewee
NYC DOT interviewee
Park Conservancy
Parks Department
“Fornew ideas, we are often finding out requirements in real time.” NYC DOT interviewee
Navigating varied applications for insurance, licenses, and grants consumes operators’ time, labor, and energy.
In Poughkeepsie, youth programming requires city and state licenses that many nonprofits struggle to secure. About 40 separate grants were required to support a single after-school program at the Family Partnership Center, according to Tamer Janakat, Director of Operations. Permitting and insurance also complicate activation, from special Department of Transportation approvals for public art in Hillel Plaza to heavy insurance requirements for Open Streets.
Creation of new sites also moves at a slow pace. A site for future community gathering, the Flatbush African Burial Ground has relied for years on unpaid community labor and short-term support. “We don’t have [spaces] where people can host community events,” says Allyson Martinez, Executive Director of Brooklyn Level Up. “It’s mostly closed and lifeless.”
‘Friends of’ Groups
Business Improvement District
Public Library System
Department of Transportation
Non-Profit Social Services Organizations
Fragmented governance makes it difficult to clarify responsibility and secure long-term funding.
Responsibility for social infrastructure spans multiple agencies and organizations, creating unclear roles and diffused responsibility. In NewYork City, for example, coordination between Transportation and Parks can be murky — such as at Seward Park and Straus Square, where maintenance and storage require interagency negotiation. Moreover, to fill public funding gaps, nonprofits, conservancies, business improvement districts, and volunteers increasingly support maintenance, programming, and capital improvements — often through under-resourced “invisible labor.”
By contrast, the Educational Alliance in Lower East Side stands out for its hybrid funding model, the scale and mix of spaces it operates, and the diversity of people it serves. With over $58 million in annual revenue, it runs 15+ multi-use sites serving over 50,000 people annually (ages 0–100), integrating education, wellness, and cultural programming for multi-ethnic, multi-income communities.
Insufficient funding jeopardizes sites now and in the long term.
Government funding for social infrastructure has fallen significantly in recent decades. For example, public funding for parks as a percentage of the total NewYork City budget has decreased over time, from between 1% and 2% before the 1970s, to roughly 0.5% over the past 30+ years.16 In Poughkeepsie, the budget for parks is similarly limited. NewYork City libraries have also had funding pressures, with budget allocations flattening or declining as costs have significantly increased.17 In 2023, the shortfall was so dire that Sunday library service was suspended for up to 8 months.18
To compensate for gaps in public funding, nonprofits and informal neighbor networks have emerged to steward sites and corral funds from different sectors. At the smallest scale, community voluneeters, parks conservancies, ‘friends of’ groups, and business improvement districts take ownership of day-to-day maintenance, programming, and sometimes capital improvements. While local volunteerism and stewardship is to be applauded, the result of this model, according to interviewees, is a network of “invisible labor” that governments rely on but do not meaningfully fund. At a city scale, groups like the City Parks Foundation in NewYork City issue grants to nonprofits for programming, volunteer stewardship, and targeted restoration projects. Intermediary organizations like New City Parks also guide local governments in piecing together parks funding — as they did with Malcolm X and Pershing Avenue Parks in Poughkeepsie. While less common, private development may also be leveraged as an opportunity for capital improvements. In Sunset Park and Brooklyn Heights, for example, new public library branches are co-located with housing developments financed through public-private partnerships.
Programmatic support
Contributions to capital projects
Community groups and leaders
Corporate sponsorships
Private development agreements
Contributions to BIDs or Conservancies
Who and what funds social infrastructure?
Federal funding
State funding
Municipal department budgets
Special grants / programs
Tax levies
This dynamic — unstable public funding and the explosion of a supportive resident volunteer and non-profit ecosystem — creates many challenges. First, governments struggle to deliver on foundational operations, maintenance, and capital improvement needs. Second, individuals and nonprofits who are filling the void are faced with endless, competitive cycles of grant applications that reward organizations with strong staff capacity and fundraising savvy, but places those with fewer resources at a distinct disadvantage. Third, this patchworked funding reality requires high levels of coordination across sectors, agencies, and organizations. Volunteers know their communities well and play an integral role in building trust, engaging neighbors, and designing and managing places, but this piecemeal approach ultimately undermines long-term stability; site operators consistently cited the need for stable funding over one-off, short-term grants — for operations and maintenance, long-term capital improvements, and nonprofit staff.
A diverse mix of high-quality, accessible spaces expands opportunities forthe social connections that form healthy,
Social infrastructure can
facilitate different types of social connection — all of which are essential to individual and collective health.
Belonging
Feeling accepted, valued, and included
Sense of Connection
Feeling less alone or isolated
Gathering
Spending time with family and friends there
Recognition
Knowing at least a few familiar faces at the site
Engagement
Doing activities with others there
Familiarity
Casual interactions have been linked with greater happiness, sense of belonging, healthier aging, and social cohesion 19,20
Befriending
Making new friends on-site
Relationships
Friendship networks and frequent contact are tied to more social trust, less stress, and better health.21
A healthy balance of friendships with people of different backgrounds has been tied to higher social cohesion in neighborhoods and, in turn, higher levels of well-being.22
Trust
Feeling most people there are willing to help others
Bridging
Connecting with people who are of a different class or race / ethnicity
Community
People with higher levels of trust — in both others and institutions — report higher levels of subjective well-being, an important indicator of quality of life and predictor of health and longevity.23A sense of belonging has also been tied to higher life satisfaction, better mental health outcomes, and greater resilience in the face of adversity.24
Across study areas, social infrastructure drives high levels of belonging, trust, and connection.
LowerEast Side Flatbush Poughkeepsie
Recognize
% who report recognizing at least a few others at the site.
Engage
% who report participating in activities with others on site
Befriend
% who report making new friends at the site
Gather
% who report spending time with friends, family, acquaintances, or new people on site
Connection
% who report spending time there makes them feel less alone or isolated
Bridge race
% who report spending time with people who are mostly of different races
Bridge class
% who report spending time with people who are mostly of different classes
Belong
% who report feeling a sense of belonging
Trust
% who report thinking people there are generally willing to help others
Note: Survey data is for outdoor spaces only — In the Lower East Side, samples cover general seating areas in parks, basketball courts, dog parks, tracks and fields, skate parks, tennis and handball courts, soccer fields, and swimming pools. Flatbush samples include sidewalks and plazas. Poughkeepsie samples include parks and walkways.
Rates of social connection reflect the quality and mix in each community’s social infrastructure.
Diverse, dense, urban core
✔ 148,789 people
✔ 1.6 square mile
✔ 66% people of color
✔ $56,550 median household income
– with high poverty rate at 25%
✔ Served by 7 subway lines and 8 bus routes – highly walkable and transit-connected area
A diverse mix of sites connected by a walkable grid
✔ High public space assessment score (10 sites)
✔ Many spaces with quality design and programming
✔ Strong connections between
✔ Healthy mix of indoor and outdoor sites in proximity
Many types of connection across the spectrum
✔ Familiarity: High rates of recognition and engaging in activities with others
✔ Relationships: High rates of befriending and connection
✔ Community: High rates of bridging across race, belonging, and trust
While the three study areas differ in context, all are demographically diverse and economically disadvantaged relative to their city and state, making them broadly relatable to similar communities. Their social connection and social infrastructure vary: the Lower East Side has a strong mix of sites and shows strong social connection of all types. Flatbush and Poughkeepsie each face spatial challenges (e.g., few quality gathering spaces in Flatbush, weak connections between sites in Poughkeepsie), which may influence the types of social connection that are possible in each community.
Outer-borough commerce hub
✔ 153,524 people
✔ 3.3 square mile
✔ 65% people of color
✔ $82,330 median household income
– with high income inequality
✔ Served by 4 subway lines and 14 bus routes but bus service remains inconsistent
A buzzing corridorin need of more spaces forconnection
✔ Medium public space assessment score (7 sites)
✔ A busy corridor with few invitations to stay
✔ Limited access to quality indoor and outdoor spaces
✔ Unreliable bus infrastructure
Casual connection without intentional gathering
✔ Familiarity: High rate of recognition but low rate of engaging in activities with others
✔ Relationships: Low rates of gathering with others they know
✔ Community: High levels of bridging across class, high levels of belonging and trust
Mid-sized, car-oriented city
✔ 31,577 people
✔ 5.7 square mile
✔ 61% people of color
✔ $60,741 median household income
– largely working-class with disparities tied to arterials
✔ Mobility constrained by car-centric infrastructure and limited transit
Revived spaces in need of more everyday activity
✔ Low median public space assessment score (8 sites)
✔ Recent renovation of key indoor and outdoor spaces
✔ Inconsistent programming
✔ High-speed roads discouraging walkability
Planned connection with limited informal social mixing
✔ Familiarity: Low rates of recognition but moderate levels of engaging in activities
✔ Relationships: High rates of gathering with others but low rates of befriending new people
✔ Community: Low rates of bridging (race + class) and trust
Social Connection
Social Infrastructure
LowerEast Side Flatbush
Poughkeepsie
A mix of quality, well-connected spaces generates more social outcomes.
Form
A mix of spaces that take different physical forms
Because a single space can rarely meet a neighborhood’s full range of social needs, a healthy mix of quality, complementary public spaces is essential — all connected within a reasonable distance by safe, comfortable streets. A mix of spaces taking different forms, serving different functions, and generating different outcomes is critical to an effective social infrastructure ecosystem.
What makes a complete social infrastructure network?
Function
A mix of spaces that meet core needs
● Spaces to rest (e.g., to sit, cool off)
● Spaces to play (e.g., to play chess or pickup basketball)
● Spaces to learn (e.g., for studying or building a new skill)
● Create (e.g., for making art or cultivating plants)
*Prior Gehl research into best practices in social infrastructure from around the world found that different spaces tended to fall into one or more of these typologies of social outcome.
Outcomes
A mix of spaces for different social connections
● Hangouts (e.g., spaces to build familiarity with others and just be in public space)
● Havens (e.g., spaces to deepen relationships with others)
● Hubs (e.g., spaces to build community across difference)*
A diverse mix of sites
People in Seward Parkwere engaged in the most diverse mix
groups and activities.
This cluster works well because of intentional diversity, proximity, and connectivity, as well as because of high residential density and age diversity in the neighborhood. Sites differ in size, typology, openness, and indoor-outdoor conditions, allowing them to serve distinct but complementary roles. Within each, a mix of design features exists to encourage all-day use — from coveted ping pong tables in Seward Park to dance studios in the Manny Cantor Center.
Together, these sites foster a continuous rhythm of activity: Seward Park is most active in the morning, Open Streets in the evening, while the library maintains steady use during operating hours. Each site also attracts different age groups: the library is the most age-diverse, the park skews toward children, adults, and seniors, and Open Streets toward young adults.
Networkin Focus Seward ParkArea
Form
The Lower East Side has many different indoor and outdoors spaces connected by a walkable grid.
Function
Spaces cater to a mix of activities — from casual chats on a parkbench to creative pursuits like ceramics.
Outcomes
Lower East Side spaces see many types of social connection, including deeper bridging and trust.
Canal Street Open Street
Form: Outdoor, open street
Function: Primarily to rest Outcomes: Hangout
Public Life Activities
Park
Midday buzz with peaknear 300 people per hour Dinner-time pop-off
All-day hum
Manny CantorCenter
Seward ParkLibrary
Steady with an afternoon lift
Seward ParkLibrary
Form: Indoor, library
Seward Park
Form: Outdoor, park
Function: Primarily to play, rest
Outcomes: Hub, hangout
Function: Primarily to learn, create Outcomes: Hub, hangout
Manny CantorCenter
Form: Indoor, recreation center
Function: Primarily to create, learn, play
Outcomes: Hub, haven
84% of people recognized at least a few others at Flatbush sites, the highest of all communities.
Flatbush
A buzzing corridorin need of more spaces forconnection
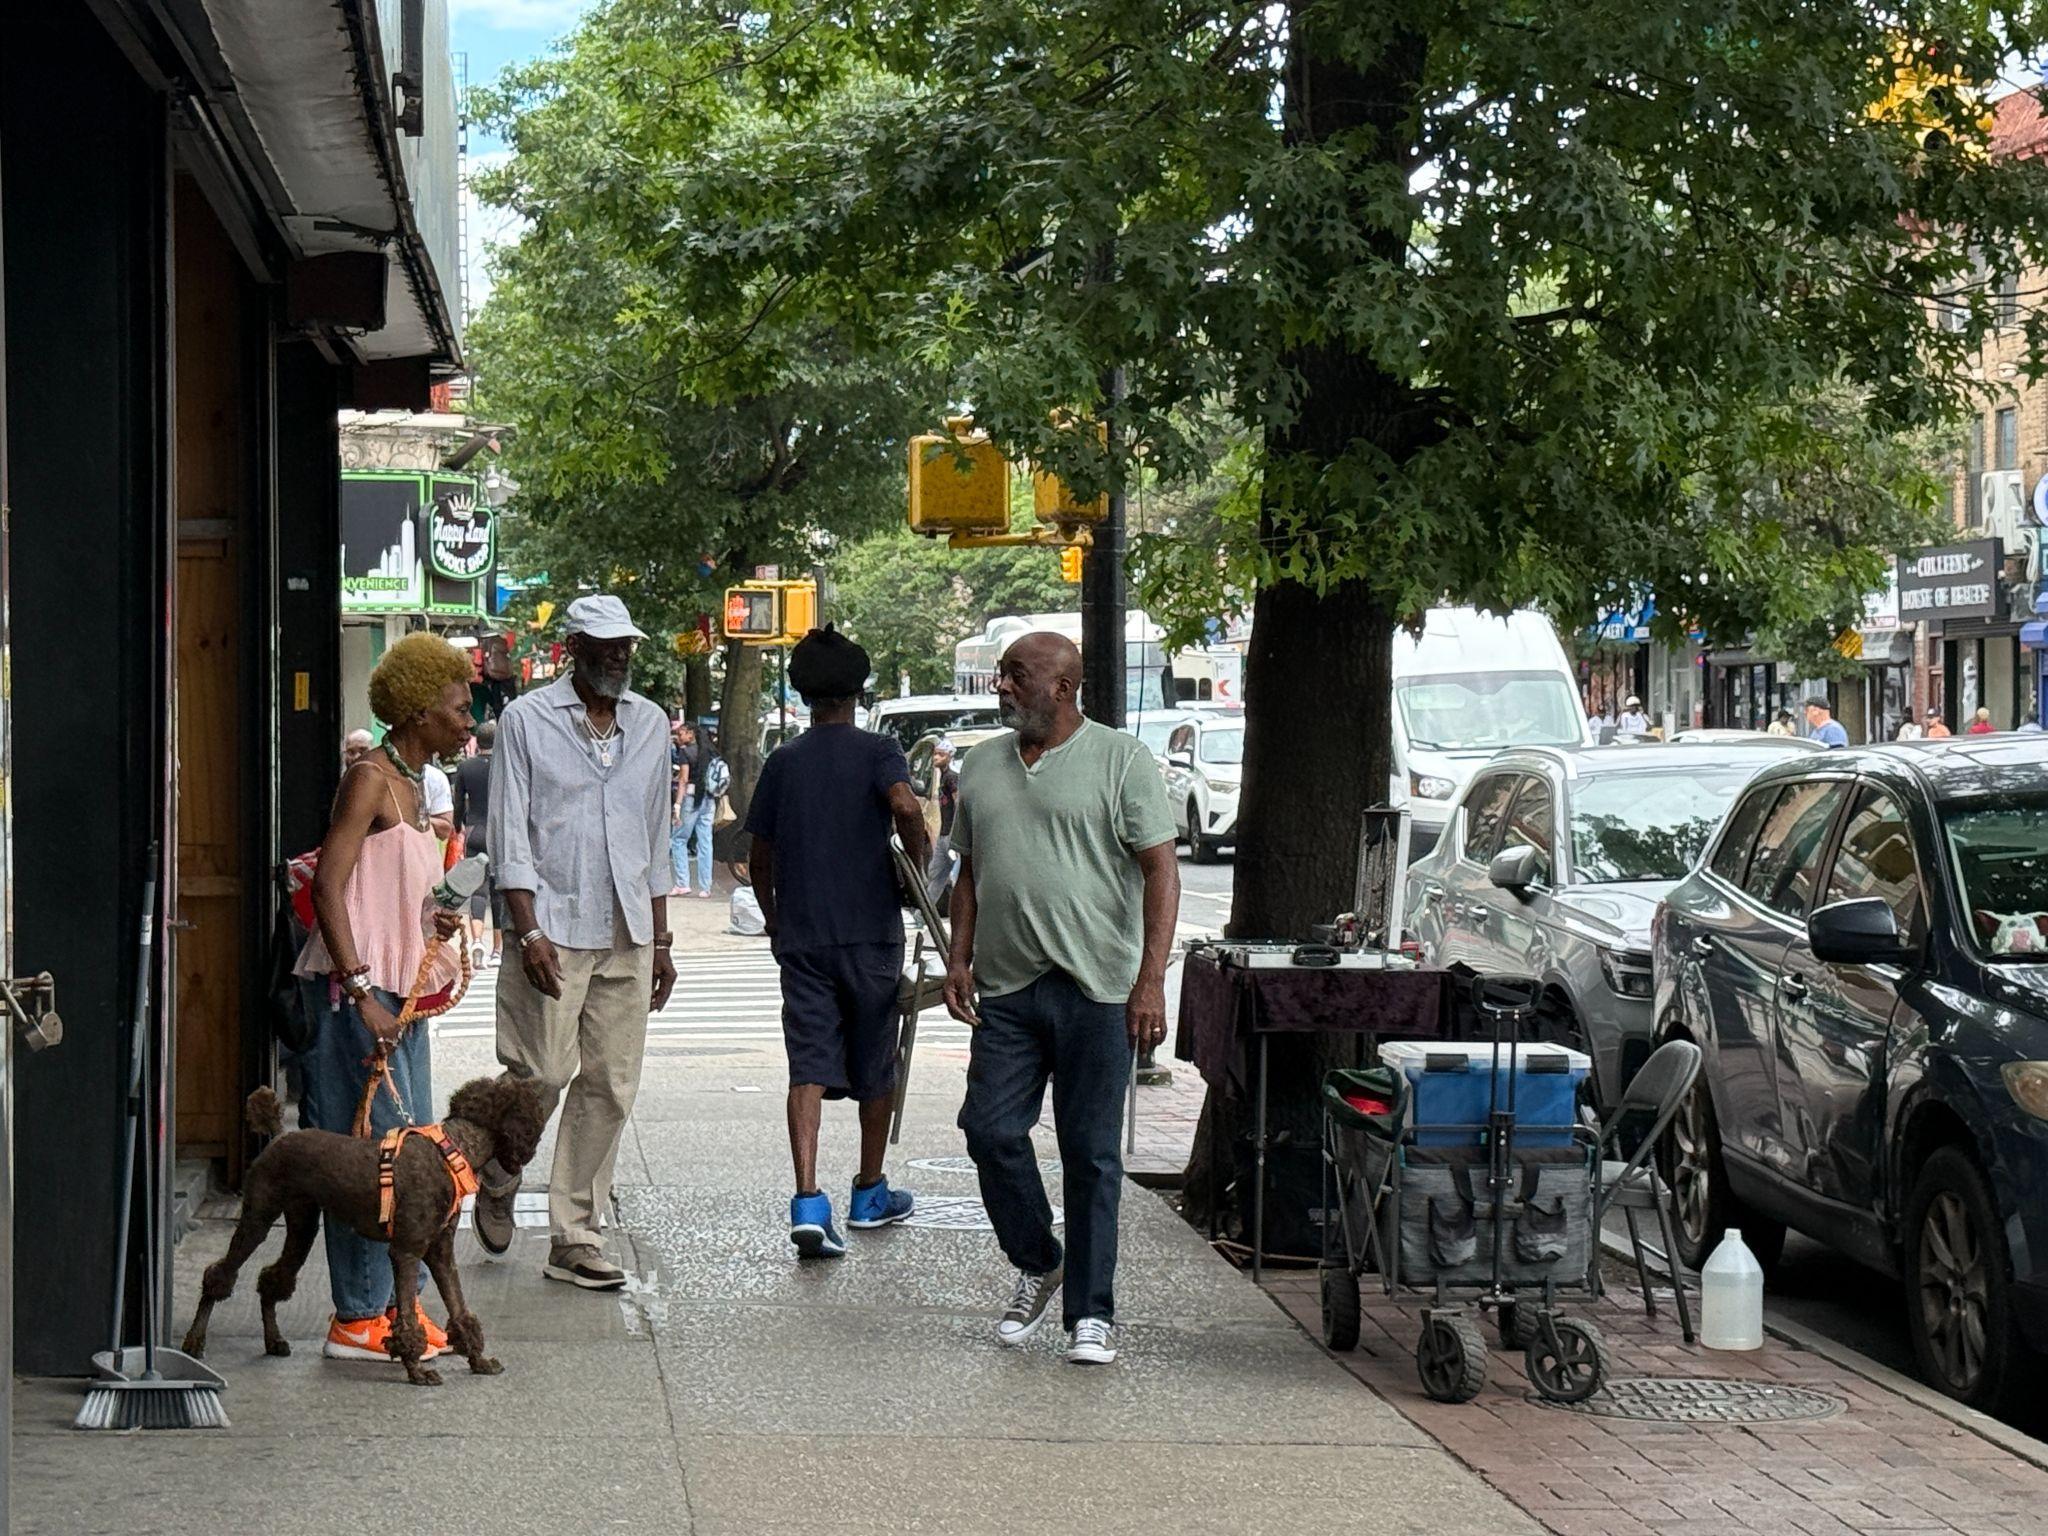
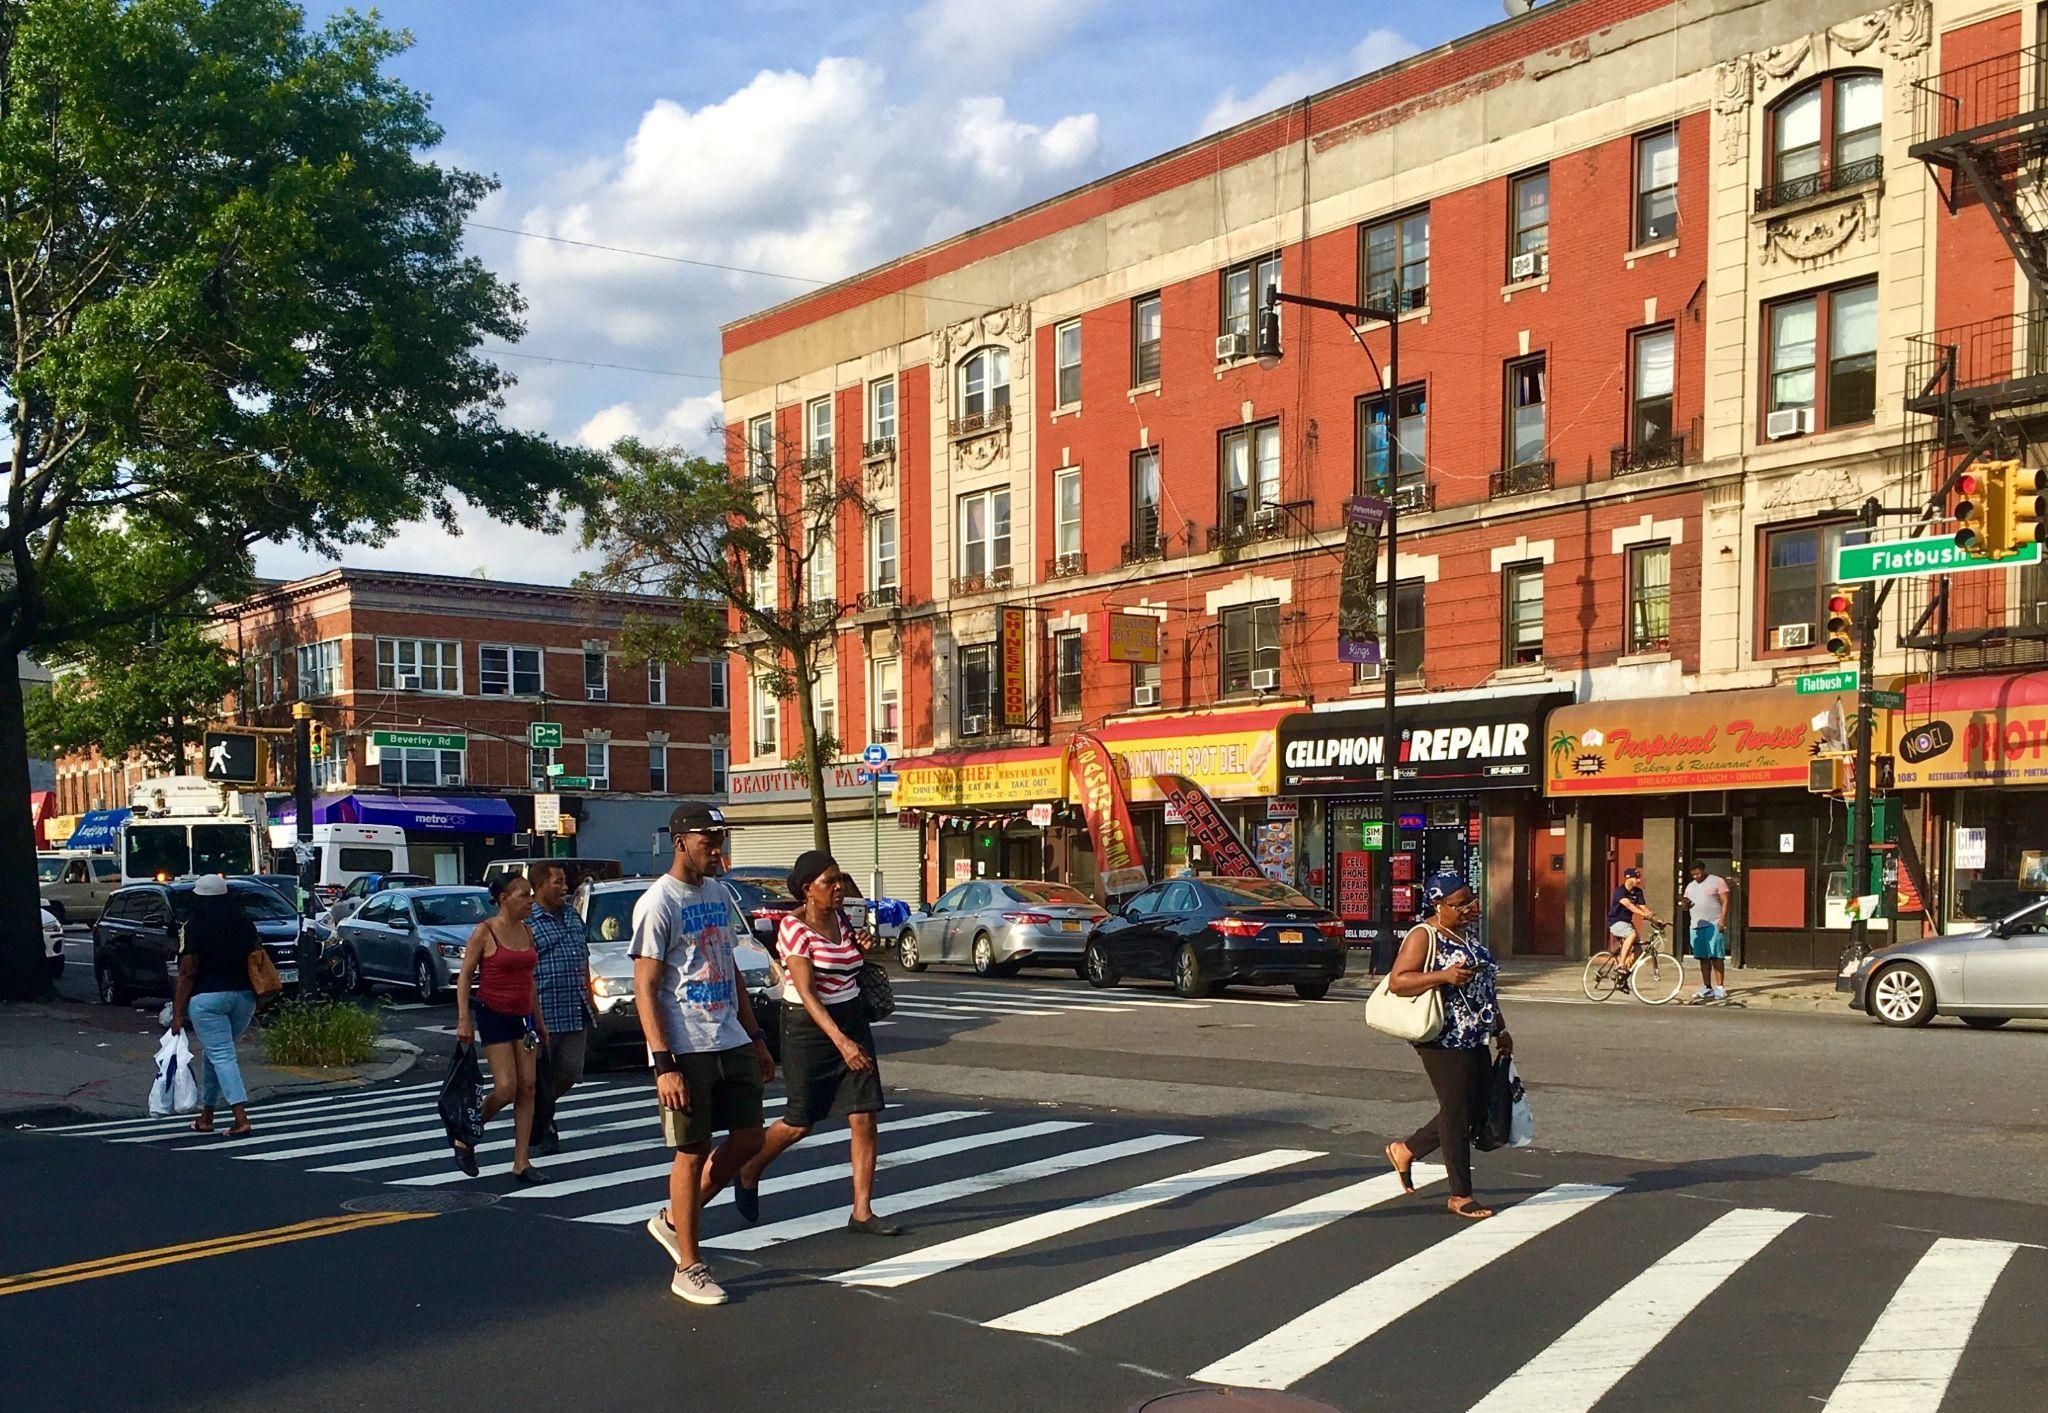
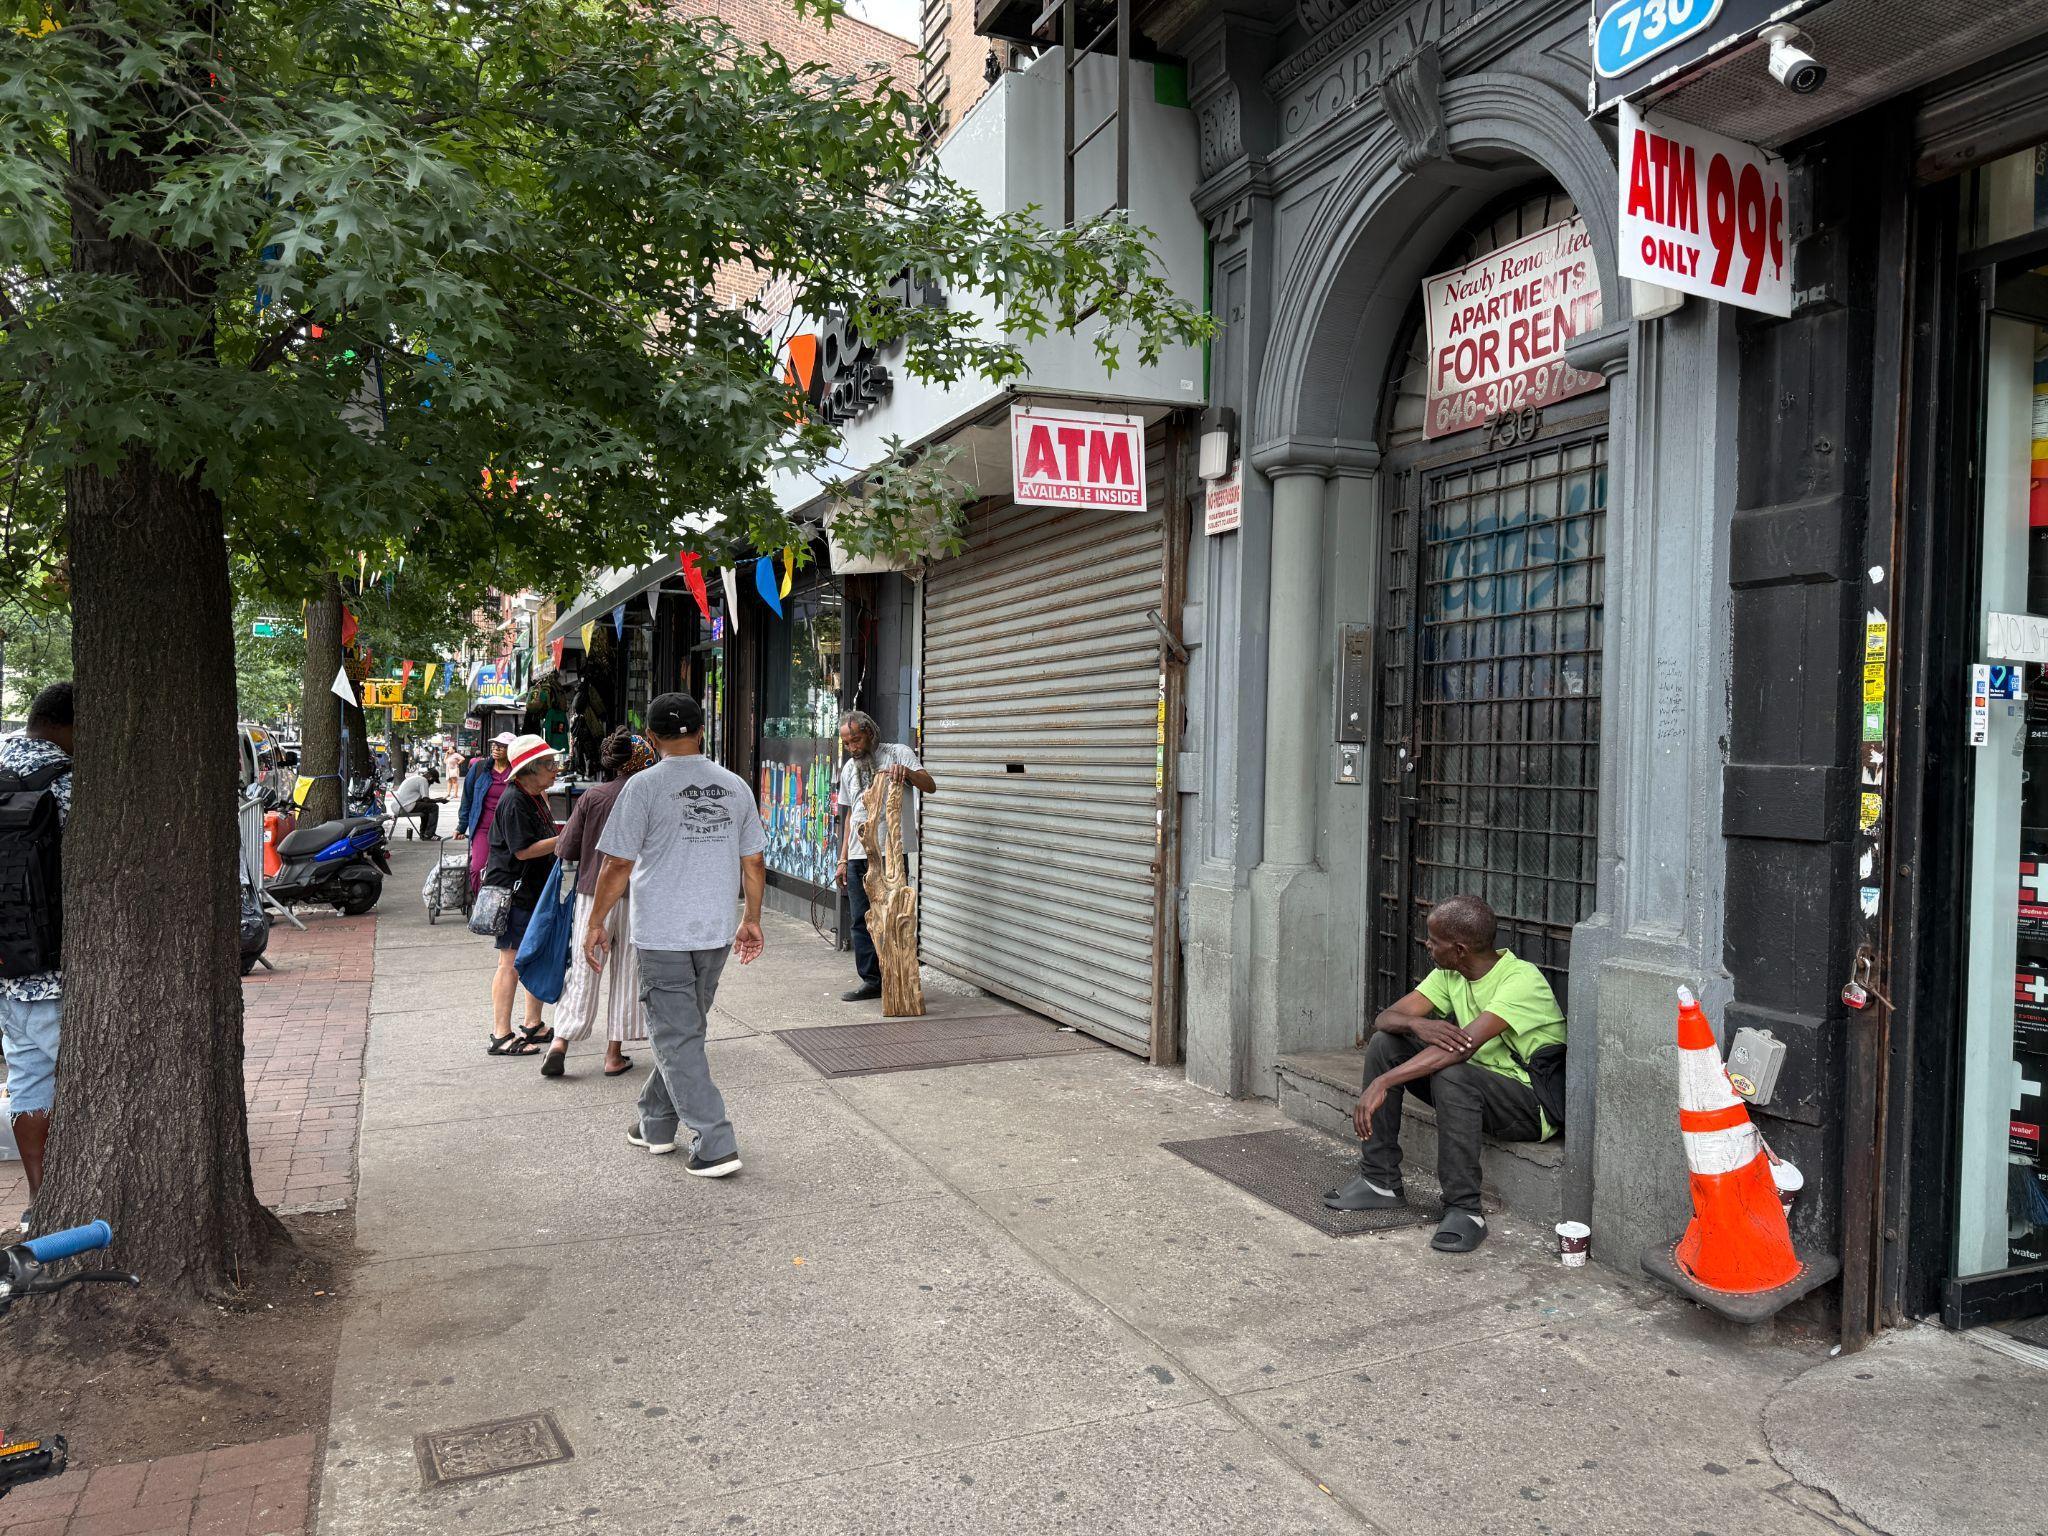
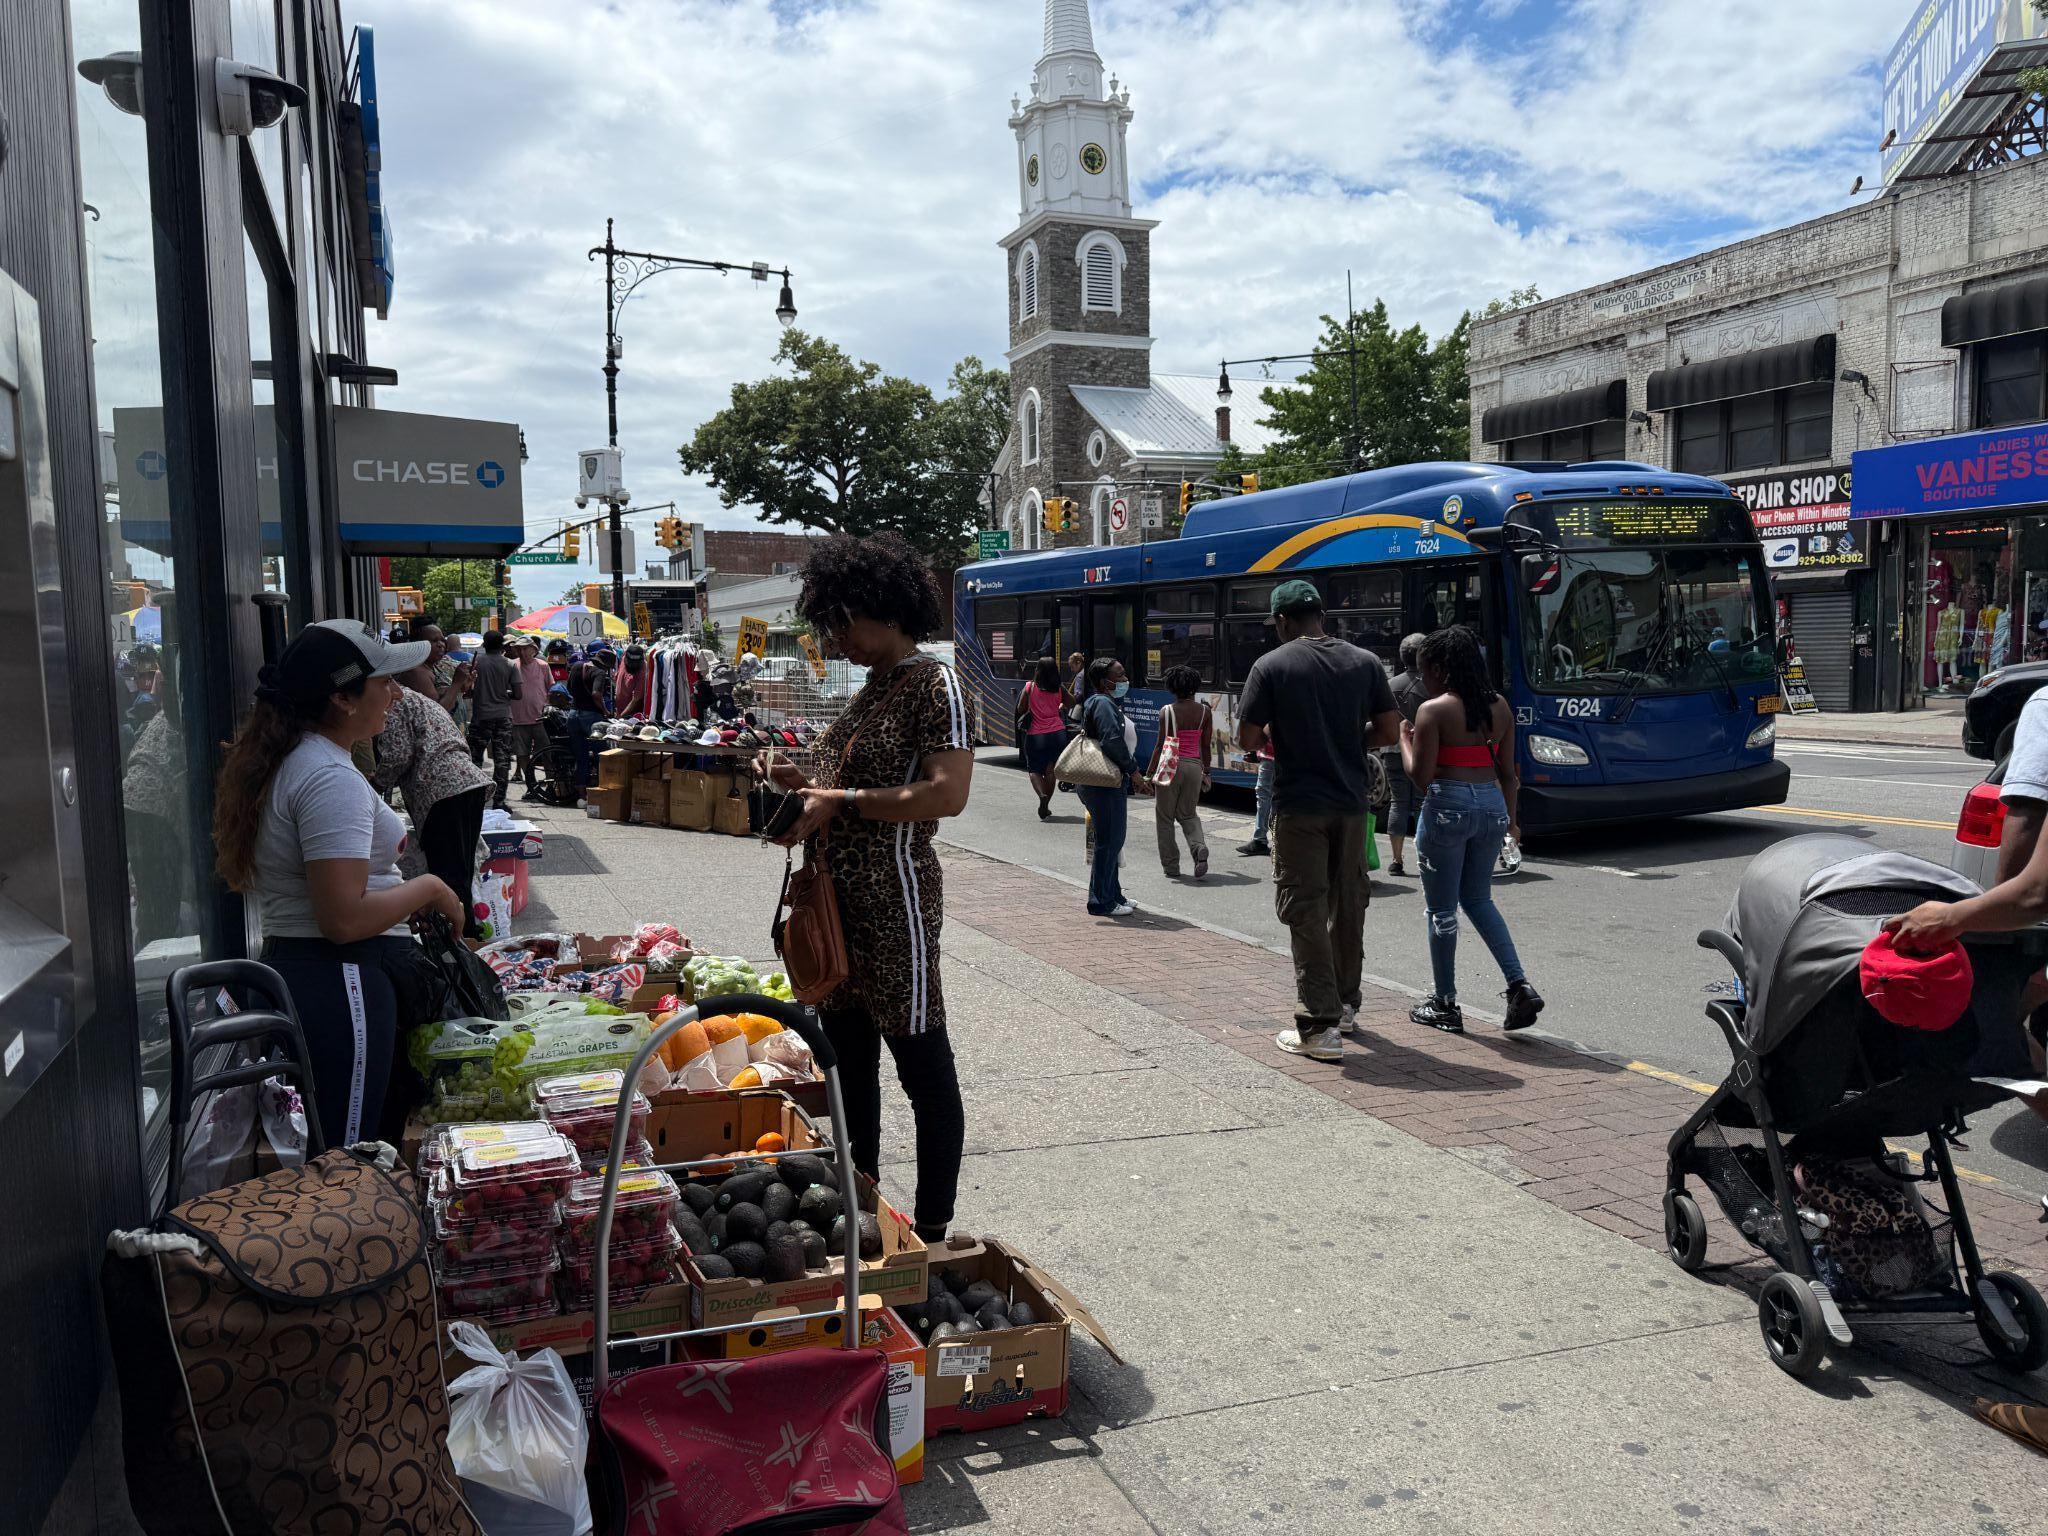
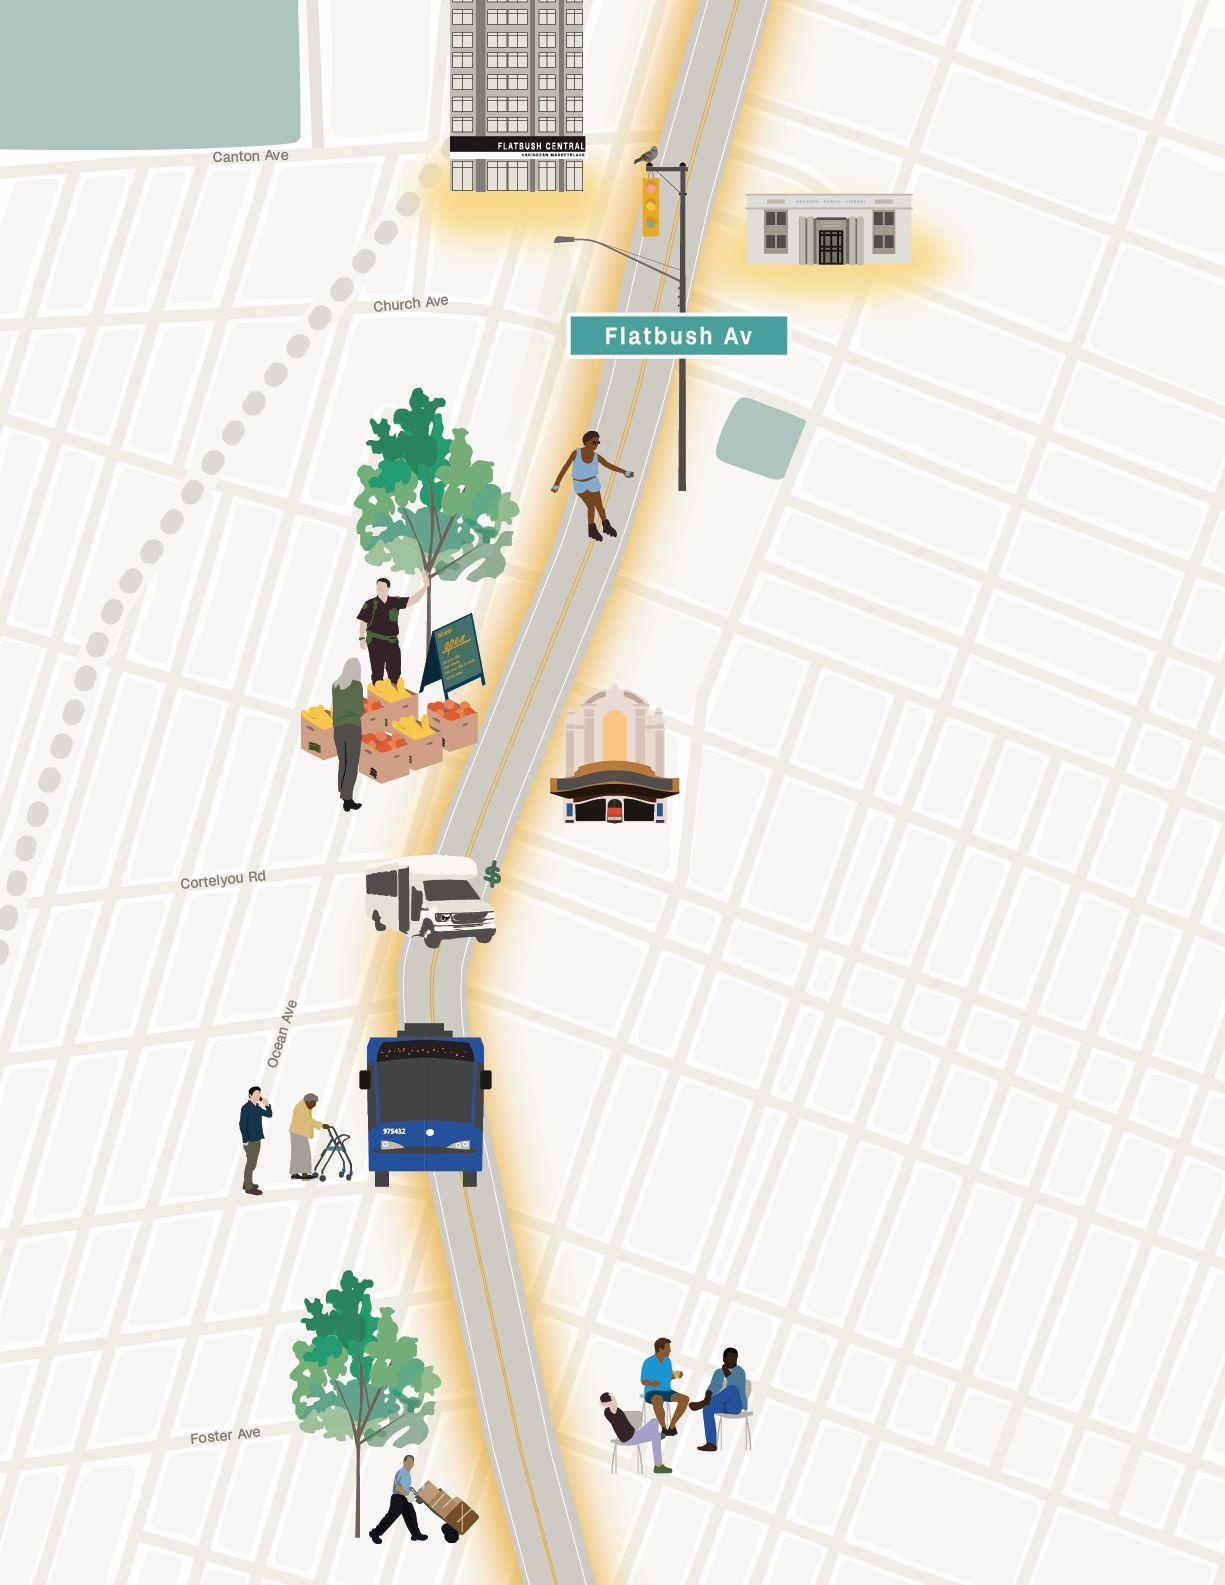
Running for almost two miles through the neighborhood, Flatbush Avenue is a commercial corridor lined with shops where high rates of people walking creates opportunities for spontaneous and planned interactions. On a warm day, the atmosphere is festive, with a cacophony of overlapping music — rap thumping out of car stereos, reggae from restaurants, corridos from boomboxes.
Watching the avenue for even an hour, one witnesses countless chance exchanges between local residents. Shop owners post up outside their stores to greet long-time customers, women running errands pause to chat with each other, young men lean out of cars, calling to friends. This pattern shows up in the data: Flatbush had a high rate (84%) of people recognizing others. Flatbush Avenue’s street life makes it a site of social infrastructure in its own right.
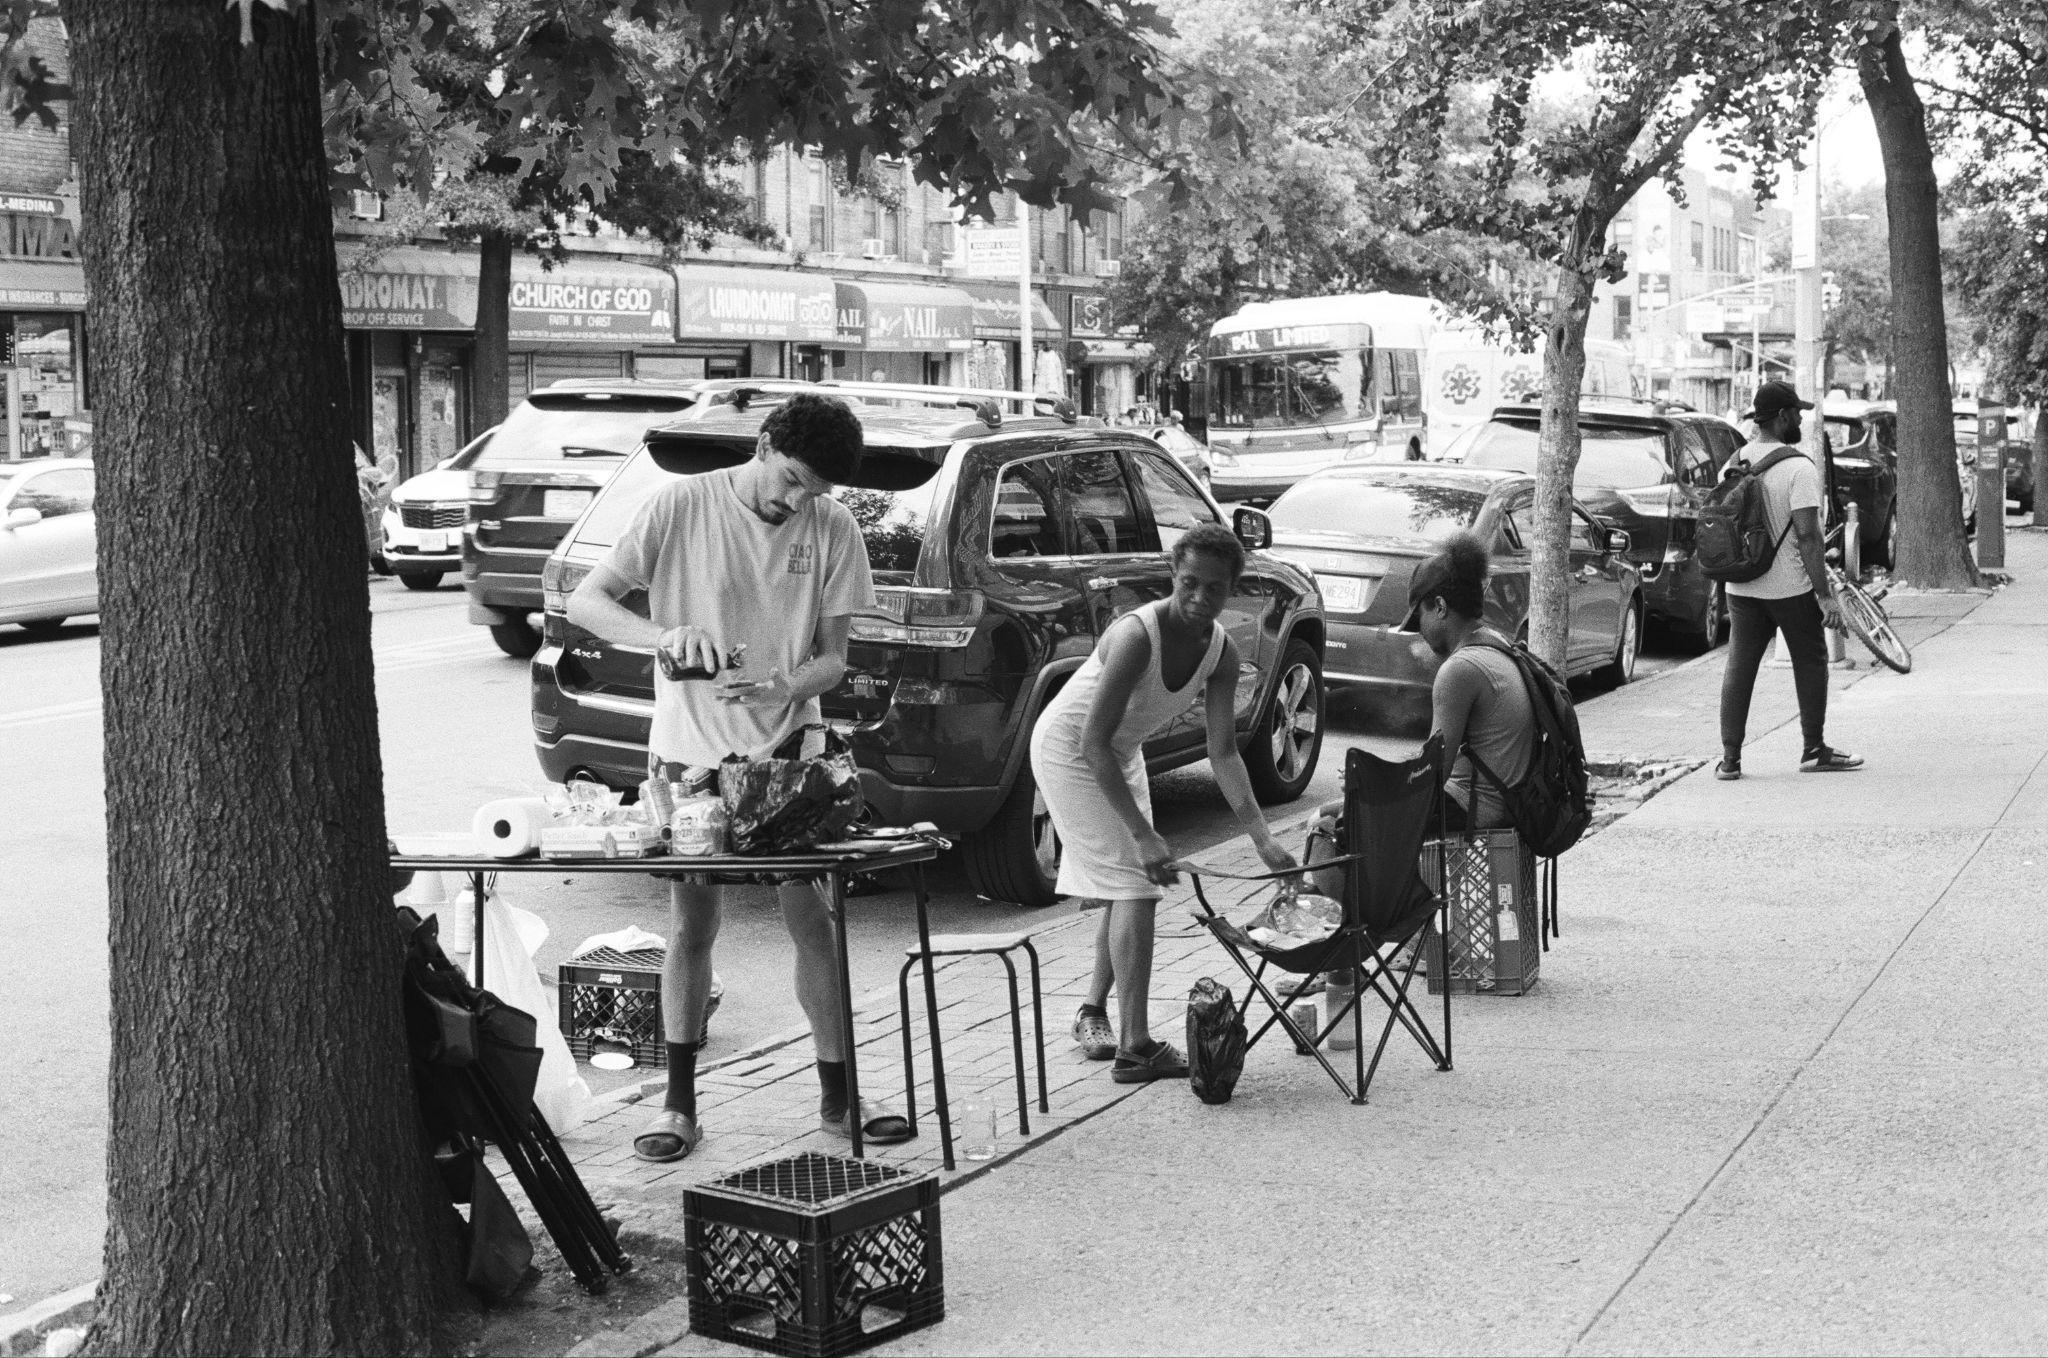
20% of people observed brought makeshift seating to Flatbush Ave, filling a gap in available seating.
What Flatbush lacks however, is formal social infrastructure spaces that sustain more prolonged social activity. Indeed, it has far fewer social infrastructure sites per capita than the Lower East Side and Poughkeepsie. Under 50% of Flatbush survey respondents reported engaging in activities with others and gathering with people they knew. In interviews, local stakeholders complained about the dearth of physical spaces to assemble outside of churches, schools, cafes, and restaurants. Prospect Park, despite its proximity, poses physical and psychological barriers to access. As a result, Flatbush Avenue is the place to be, remaining consistently active throughout the day, with 20% of people observed bringing makeshift seating, such as baskets, stools, or lawn chairs. This makeshift social infrastructure demonstrates how collective life persists through improvisation in response to lackluster street design.
Networkin Focus Flatbush Avenue
Form
Defined by Flatbush Avenue, with few green / open spaces and indoor gathering spots.
Function
Spaces struggle to meet core needs, so residents bring their own fixings (e.g., dominoes, fold-out chairs).
Outcomes
Flatbush Avenue is a hangout space of familiarity, but the lackof gathering spaces may minimize deep connection.
Flatbush Avenue
Form: Connector
Function: Primarily to move through, rest Outcomes: Hangout
Fresh produce market spillouts
Form: Outdoor, market
Function: Primarily to shop, informal chats Outcomes: Hangout
Flatbush & Cortelyou Public Libraries
Form: Indoor, library
Function: Primarily to learn Outcomes: Haven, hangout
Bus Stops
Form: Outdoor
Function: Primarily to rest Outcomes: Hangout
Hillel Plaza
Form: Outdoor, plaza
Function: Primarily to rest Outcomes: Hangout
Public Life Activities Number of people per hour
Flatbush Ave Total
Steady all day with an average of 200+ people per hour stay along the 1.3-mile stretch of the Avenue
to
Ave to
Rd
Church
Cortelyou
Caribbean Market
Flatbush Library
Kings Theatre
Hillel Plaza
minute walk
Prospect Park 30+ minute walk from most of Flatbush
Cortelyou Public Library
Flatbush African Burial Ground
20 people were at Malcolm X Park on a Saturday at 9pm, drawn to a new, well-lit basketball court.
Poughkeepsie
Revived spaces in need of more everyday activity
Poughkeepsie has recently seen a range of upgrades to its social infrastructure. Malcolm X Park and Pershing Avenue Park — two neighborhood parks on the North Side — underwent major redesigns, with an infusion of American Rescue Plan Act funding in 2022-2023. Today, they house basketball courts, ample seating, and community garden plots. Pulaski Pool and Pool House reopened in 2024 as a new facility featuring a splash pad, locker rooms, family bathrooms, and updated lighting. The Family Partnership Center — a community center home to about 20 local non-profits — underwent a $19.1 million renovation in 2022.
81% of people at Poughkeepsie sites spend time with people they know on site.
These and other public spaces throughout Poughkeepsie are home to programming that brings people together in public space. For example, Community Matters 2, a local non-profit, drew the highest public life activity of all Poughkeepsie sites observed during its summer cookout — 370 people per hour. Indeed, festivals were consistently cited by interviewees as a highlight of Poughkeepsie life — a rare but coveted moment to come together. Everyday socializing in public spaes is less common. Respondents visited outdoor social infrastructure sites a median of 1.5 times a month and 33% reported making new friends there.
Despite quality design and dedicated non-profit stewards, social infrastructure sites have low levels of funding, staffing, and physical connectivity, which hampers everyday use. For example, two wide, high-speed arterial roads bisect Poughkeepsie, cause injuries and fatalities,26 and impede everyday connectivity. Getting from the local high school to the Family Partnership Center for after-school programs, for example, is a risky 25-minute walk that requires crossing both arterials.
Networkin Focus North Side in Poughkeepsie
Form
Many different types of spaces, but challenges walking between them due to unsafe arterials and car-centric mobility.
Function
Ample opportunities to rest, learn, play, or create — often through events and programming.
Outcomes
The North Side has many places to hang out and gather with people you already know, but fewer hubs to bridge difference. Public Life Activities
Malcolm X Park
Form: Outdoor, recreation center
Function: Primarily to play, rest
Outcomes: Haven, hangout Community Matters
Earline Patrice Park
Form: Outdoor, park
Function: Primarily to rest Outcomes: Hangout
Family Partnership Center
Form: Indoor, recreation center
Function: Primarily to learn, play, create Outcomes: Haven, hangout
Pershing Ave Park 15 minute walk
Poughkeepsie High School 25 minute walk
Pulaski Pool 15 minute walk
Poughkeepsie Public Library 15 minute walk
High-Speed Road & Unsafe Crossing
Recommendations
Reinvesting in social infrastructure at the city scale and human scale
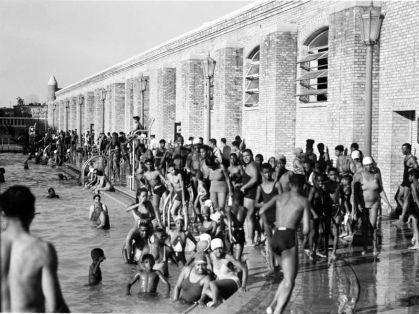
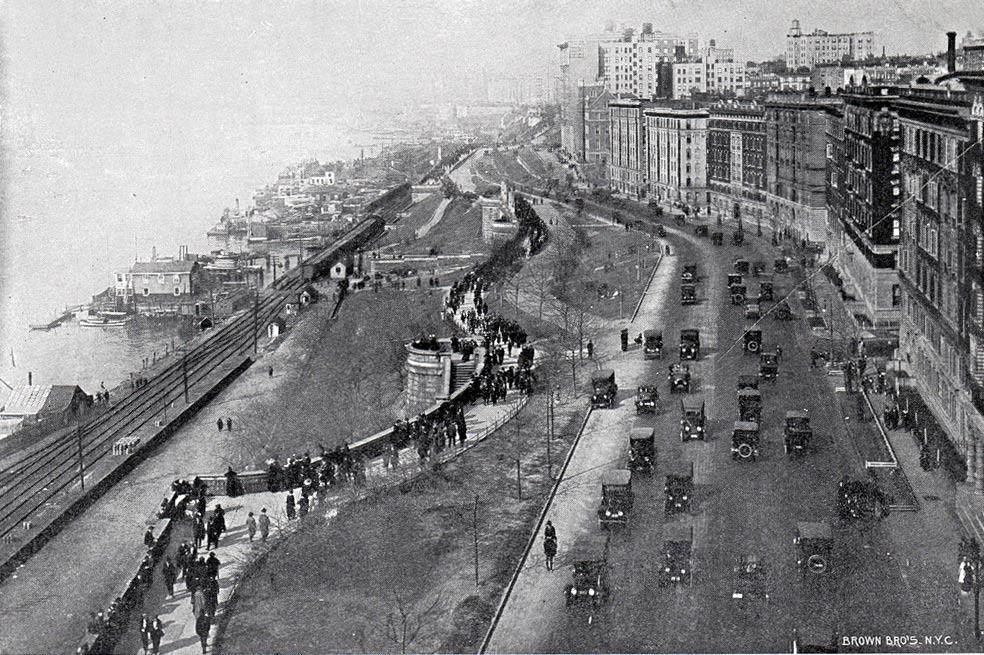
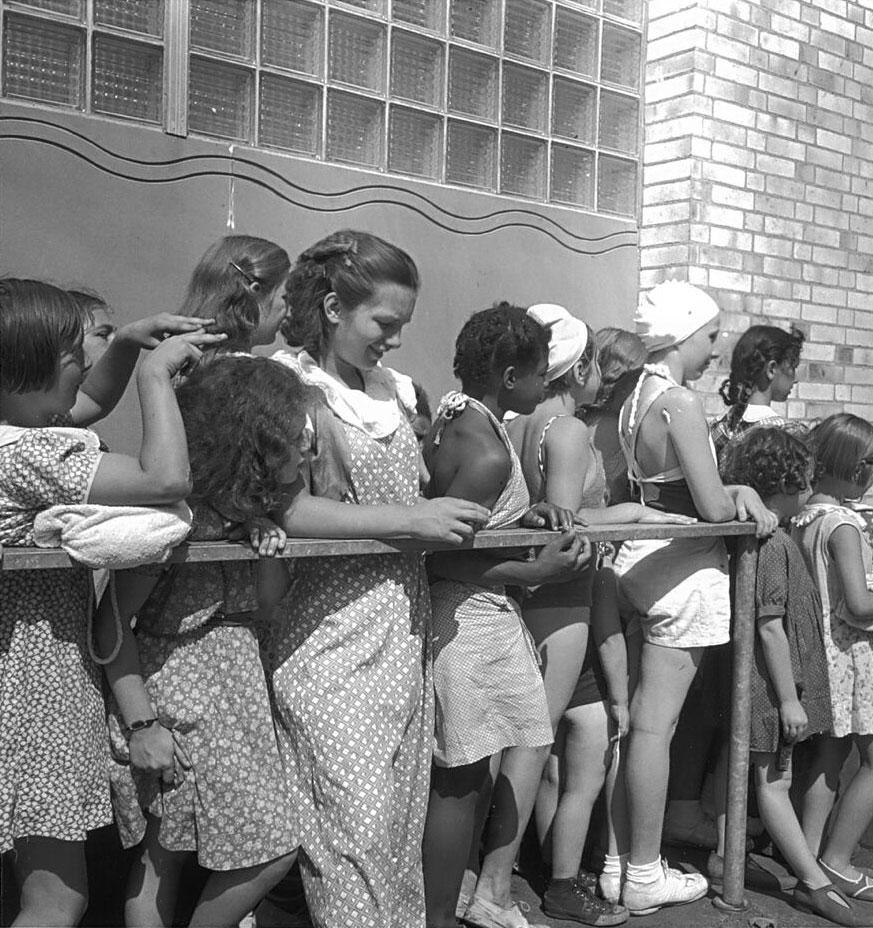
We have invested in social infrastructure at scale before, through efforts in the early 20th century.
851
sites were created and improved through the New Deal in NYC.29
67
According to a recent NewYorkTimes the public ranks parks and libraries as a number one priority.Yet the two agencies always face the biggest cuts when it comes to balancing the annual city budget.
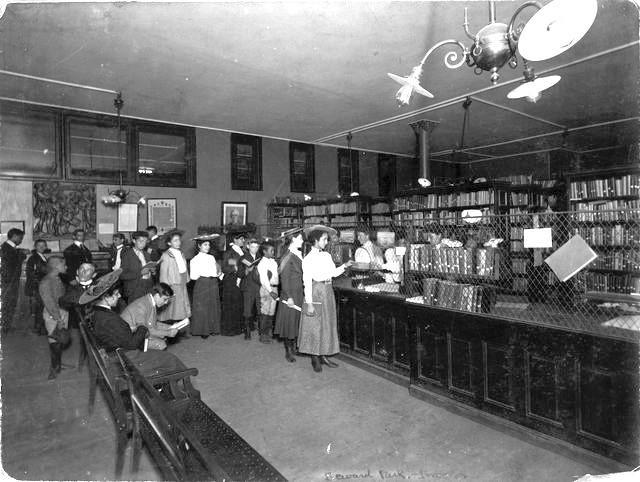
library branches in NYC were funded and opened through the Carnegie Agreement between 1899 and 1923.30
Today, we are seeing signs of progress. The time is now to match the level of ambition seen a century ago.
Sunset ParkLibrary, reopened in 2023
Far Rockaway Library, reopened in 2024
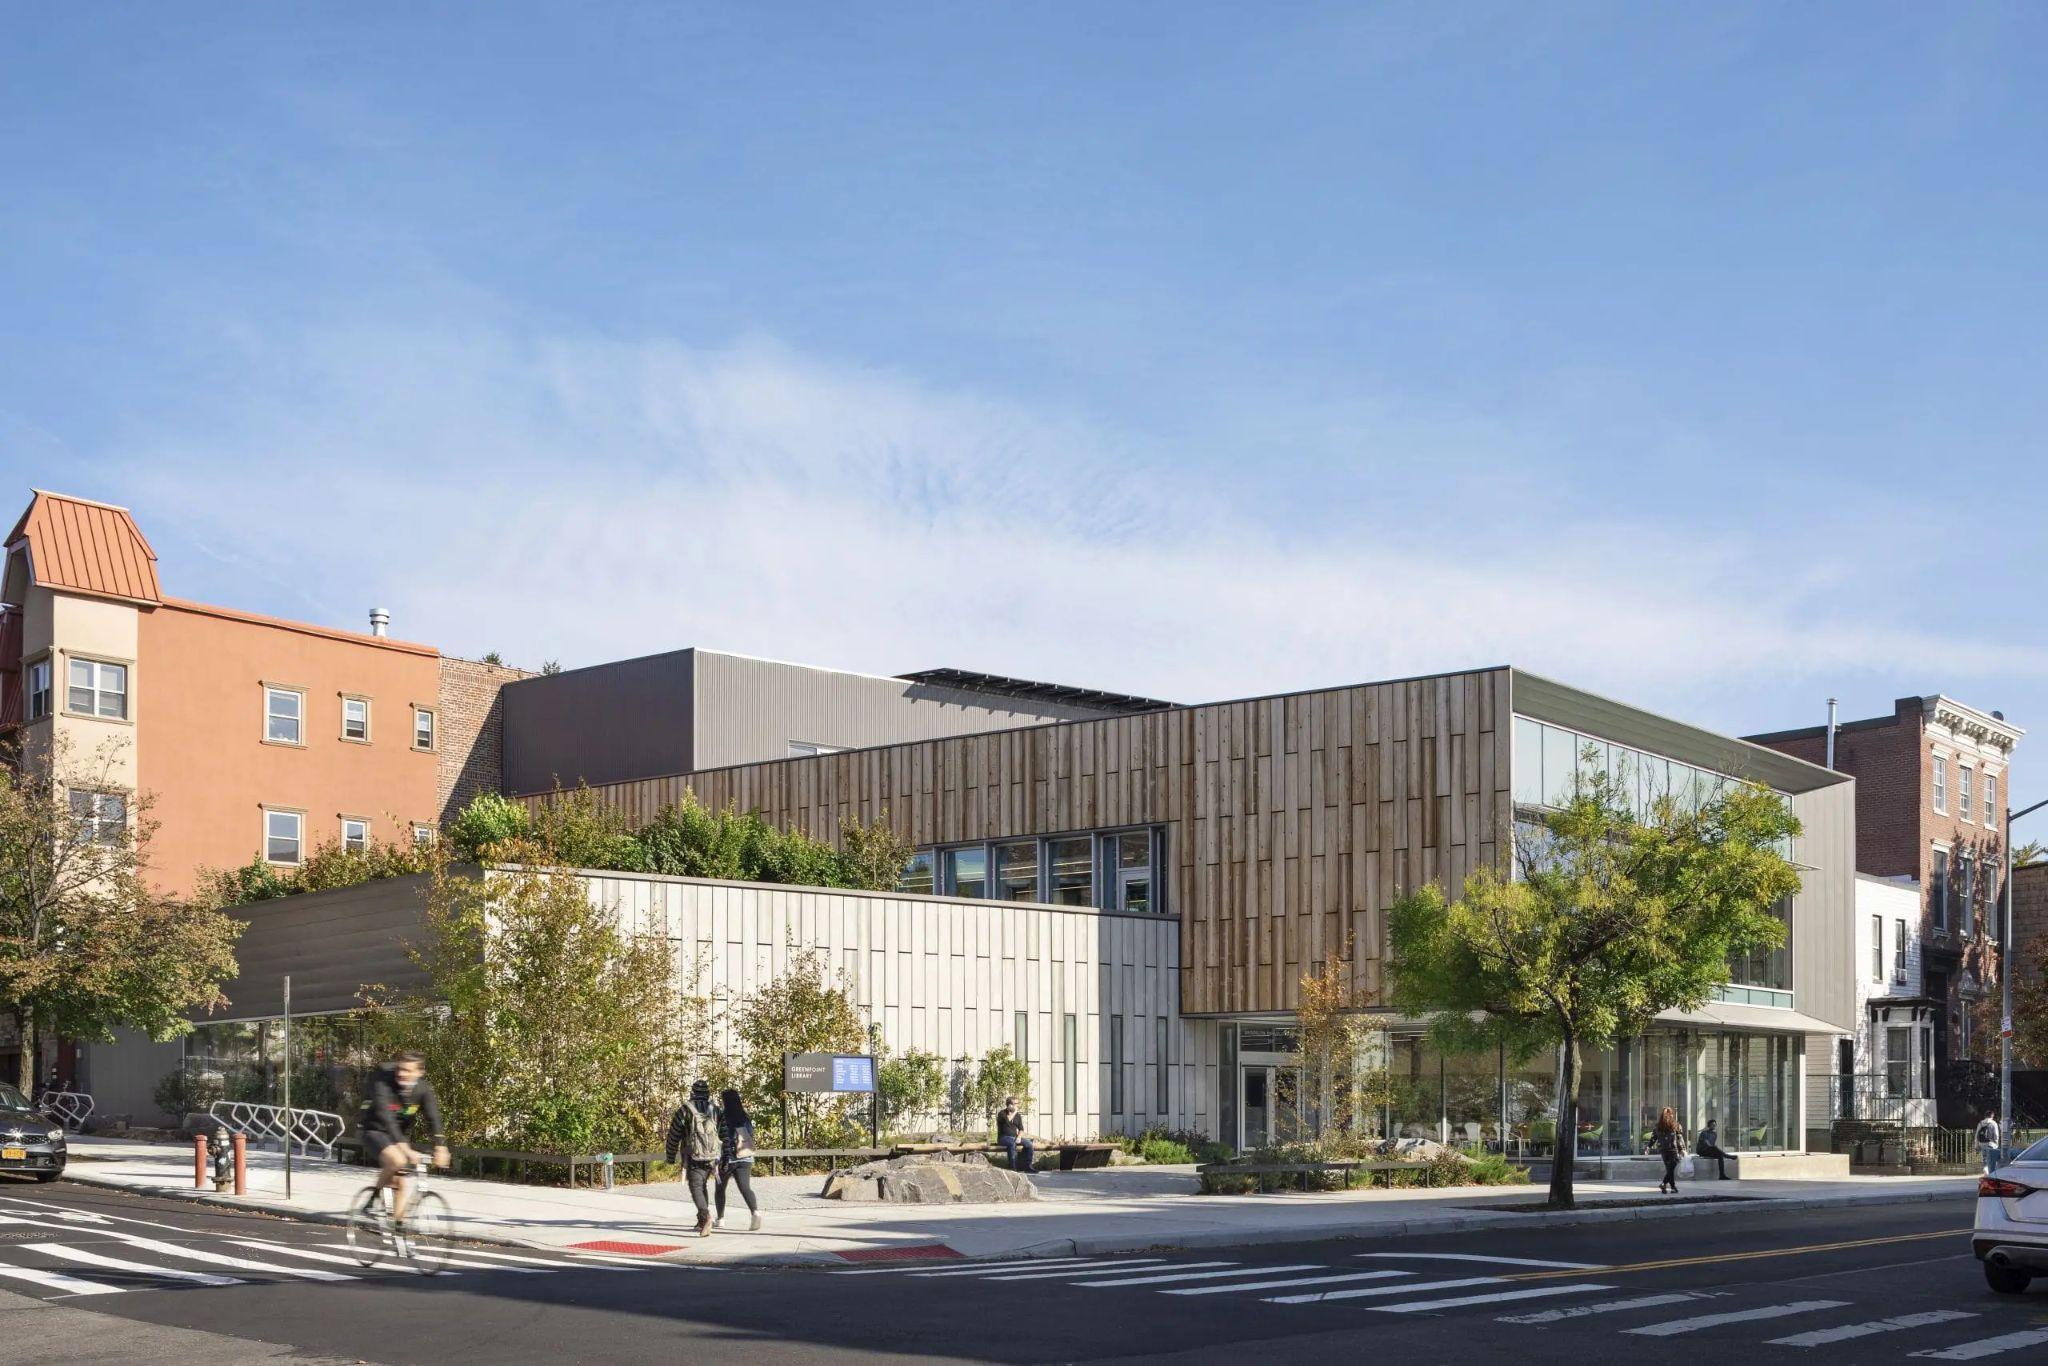
Greenpoint Library and Environmental Education Center, opened in 2020
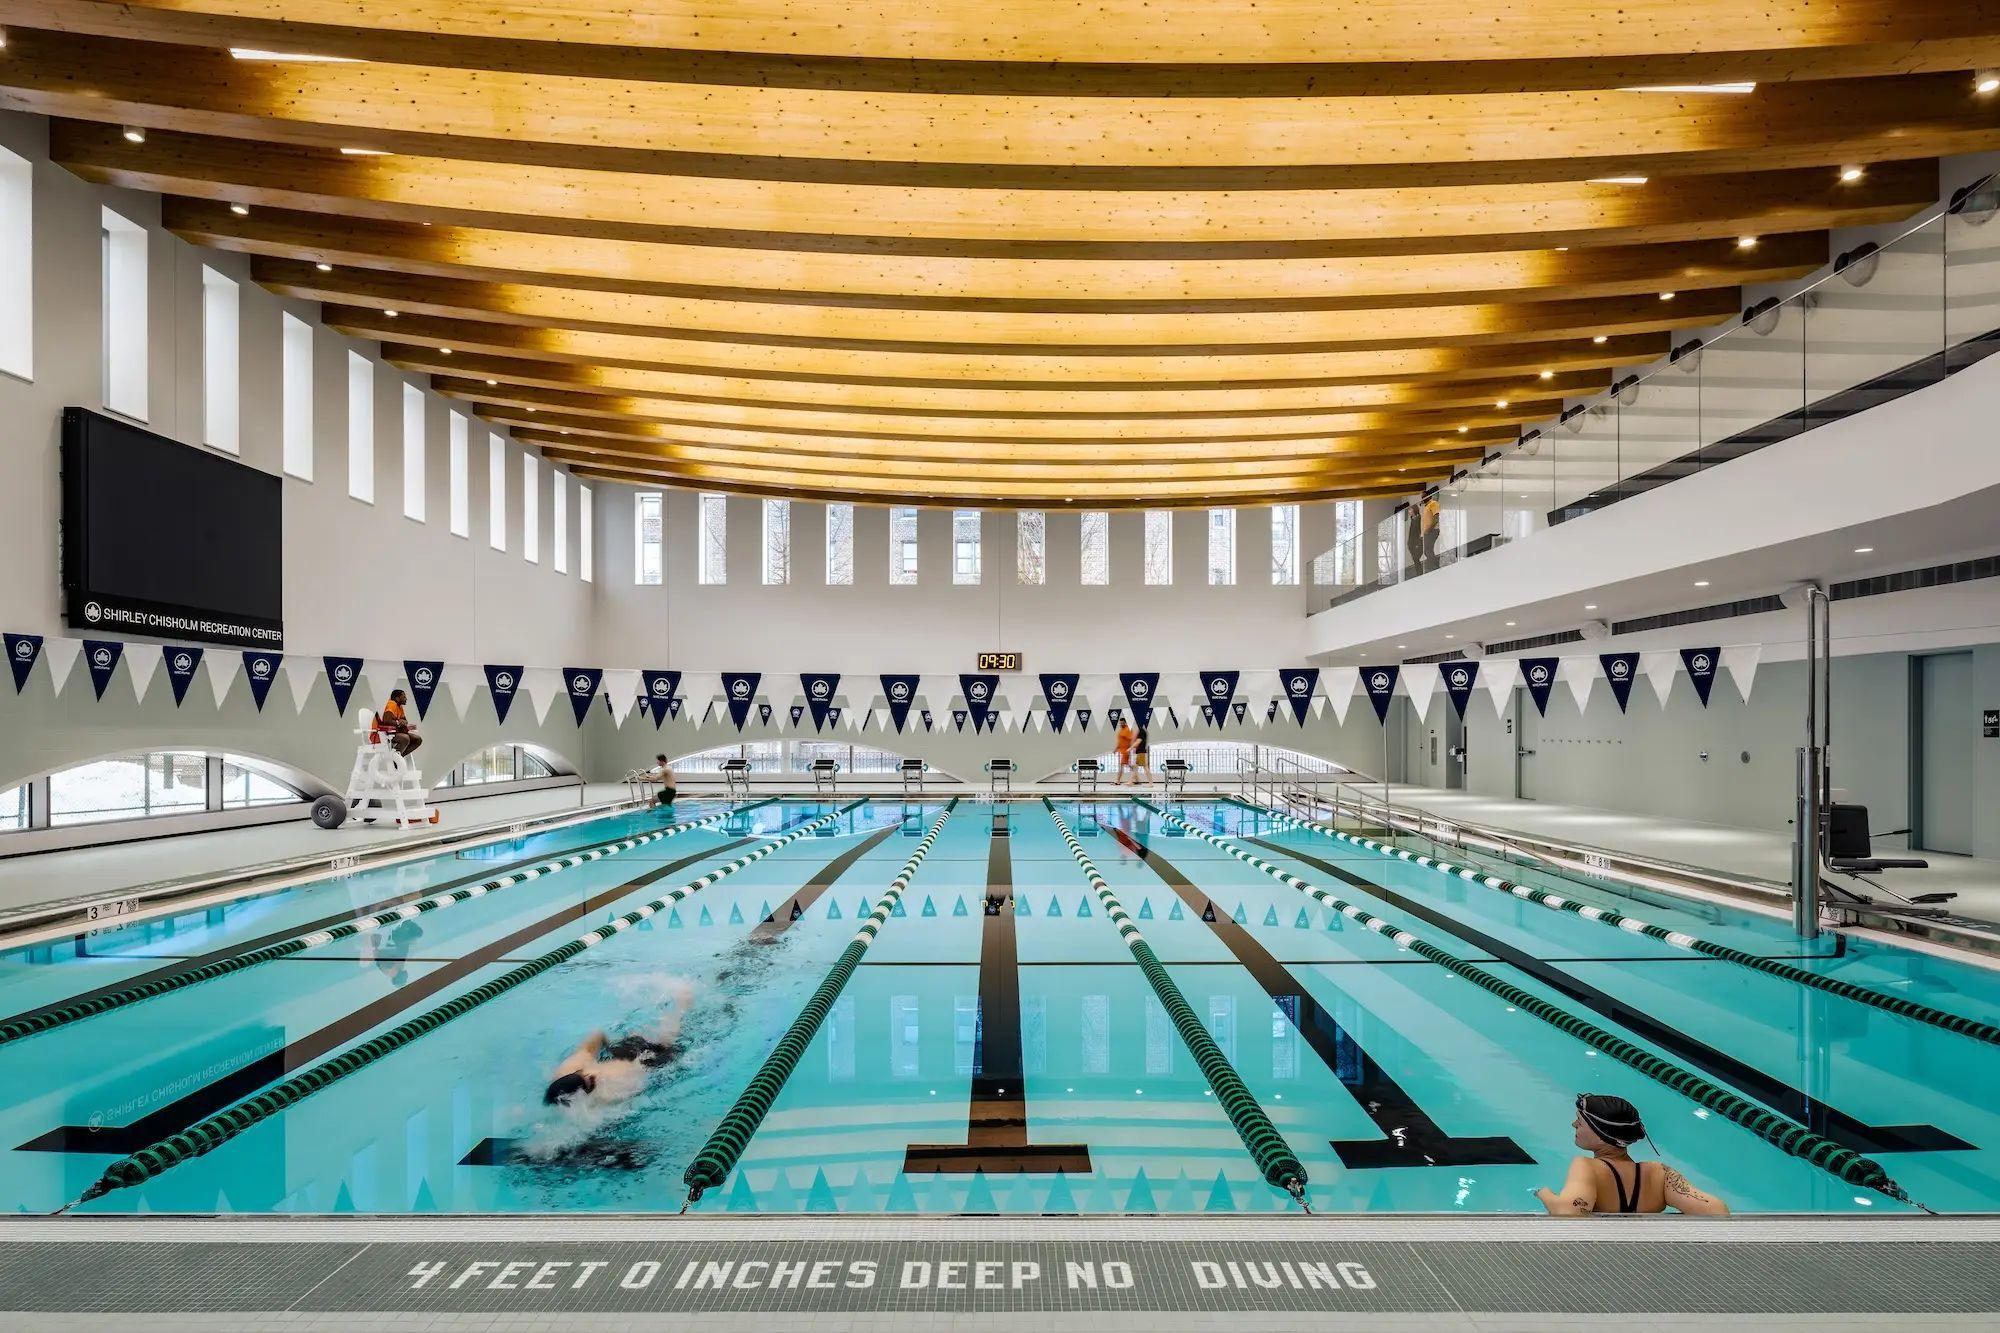
Shirley Chisholm Recreation Center, opened in 2026
Riverside Park, 1925
Betsy Head Recreation Center, 1939
Colonial ParkPool, opened in 1936 Seward ParkLibrary, opened in 1909
Image source: Jeff Goldberg
Reinvesting in social infrastructure at the city scale and human scale.
Our recommendations are based on the main finding of our research: social infrastructure is essential infrastructure. We need to invest in it. We need to design it well. We need to program it. We need to maintain it. If we do this, the returns to our neighborhoods and communities will be significant and meaningful. If we don’t, the joyful, affordable city will be out of reach for most of us, and the problems of inequality and polarization will grow more dire.
About a century ago, from the Progressive Era through the New Deal, Americans faced dangers similar to those of today. At a moment of rising unrest and conflict, the United States built a vast supply of social infrastructure, opening public schools, public libraries, public parks, public swimming pools, and public housing complexes where ordinary people could gather, lifting themselves — and each other — up. The hard-won projects were the government’s response to social movements demanding changes to the structure of the nation’s economy and society. Ordinary Americans, immigrant and native-born, were not only poor and hungry; they were fed up with hazardous working conditions, crowded housing, and political corruption, and incensed by a Gilded Age overclass whose accumulation of wealth came directly at their expense.
The dramatic improvement in working and living conditions across the United States changed the course of American history, helping stave off the threat of fascism and propelling the nation towards its apex of power and prosperity. The material gains from these great projects extended beyond household finances and into the social fabric of our towns and cities. They complemented new housing construction by creating spaces not merely to reside, but to live a good life. Instead of confining themselves to factories, tenements, and the mean streets of the metropolis, working people won access to beautiful new places made for playing, learning, and associating freely. Places that recognized and dignified them. Places that told them they belonged.
This is not the 1930s. There is no New Deal, nor anything suggesting that the federal government is poised to make a massive investment in social infrastructure any time soon. But things change fast in American politics and culture, and NewYork can begin building better gathering places right now.
The work has already begun in places, with recent projects in NewYork City, from libraries co-located with affordable housing, to gleaming new recreation centers and upgraded swimming pools.
Additionally, civic leaders and volunteers have stepped in to organize and program social infrastructure, like Paseo Park. Nonprofits fill programming gaps with pop-up, moveable activities and furniture. In his first 100 days the mayor of NewYork has already developed public-private funding approaches to invest in new initiatives like universal childcare, and is poised to create more.
Here are six recommendations for how to invest in upstream democracy, amplify existing efforts, and make the more joyful, affordable city possible.
Supercharge the library
Revamp recreation and play spaces for all ages
Make our gathering spaces comfortable and resilient for extreme weather
Transform streets into safe, social neighborhood connectors
Hire and partner with communities to run and activate public spaces
Assess neighborhood social infrastructure needs and fill gaps
Supercharge the library
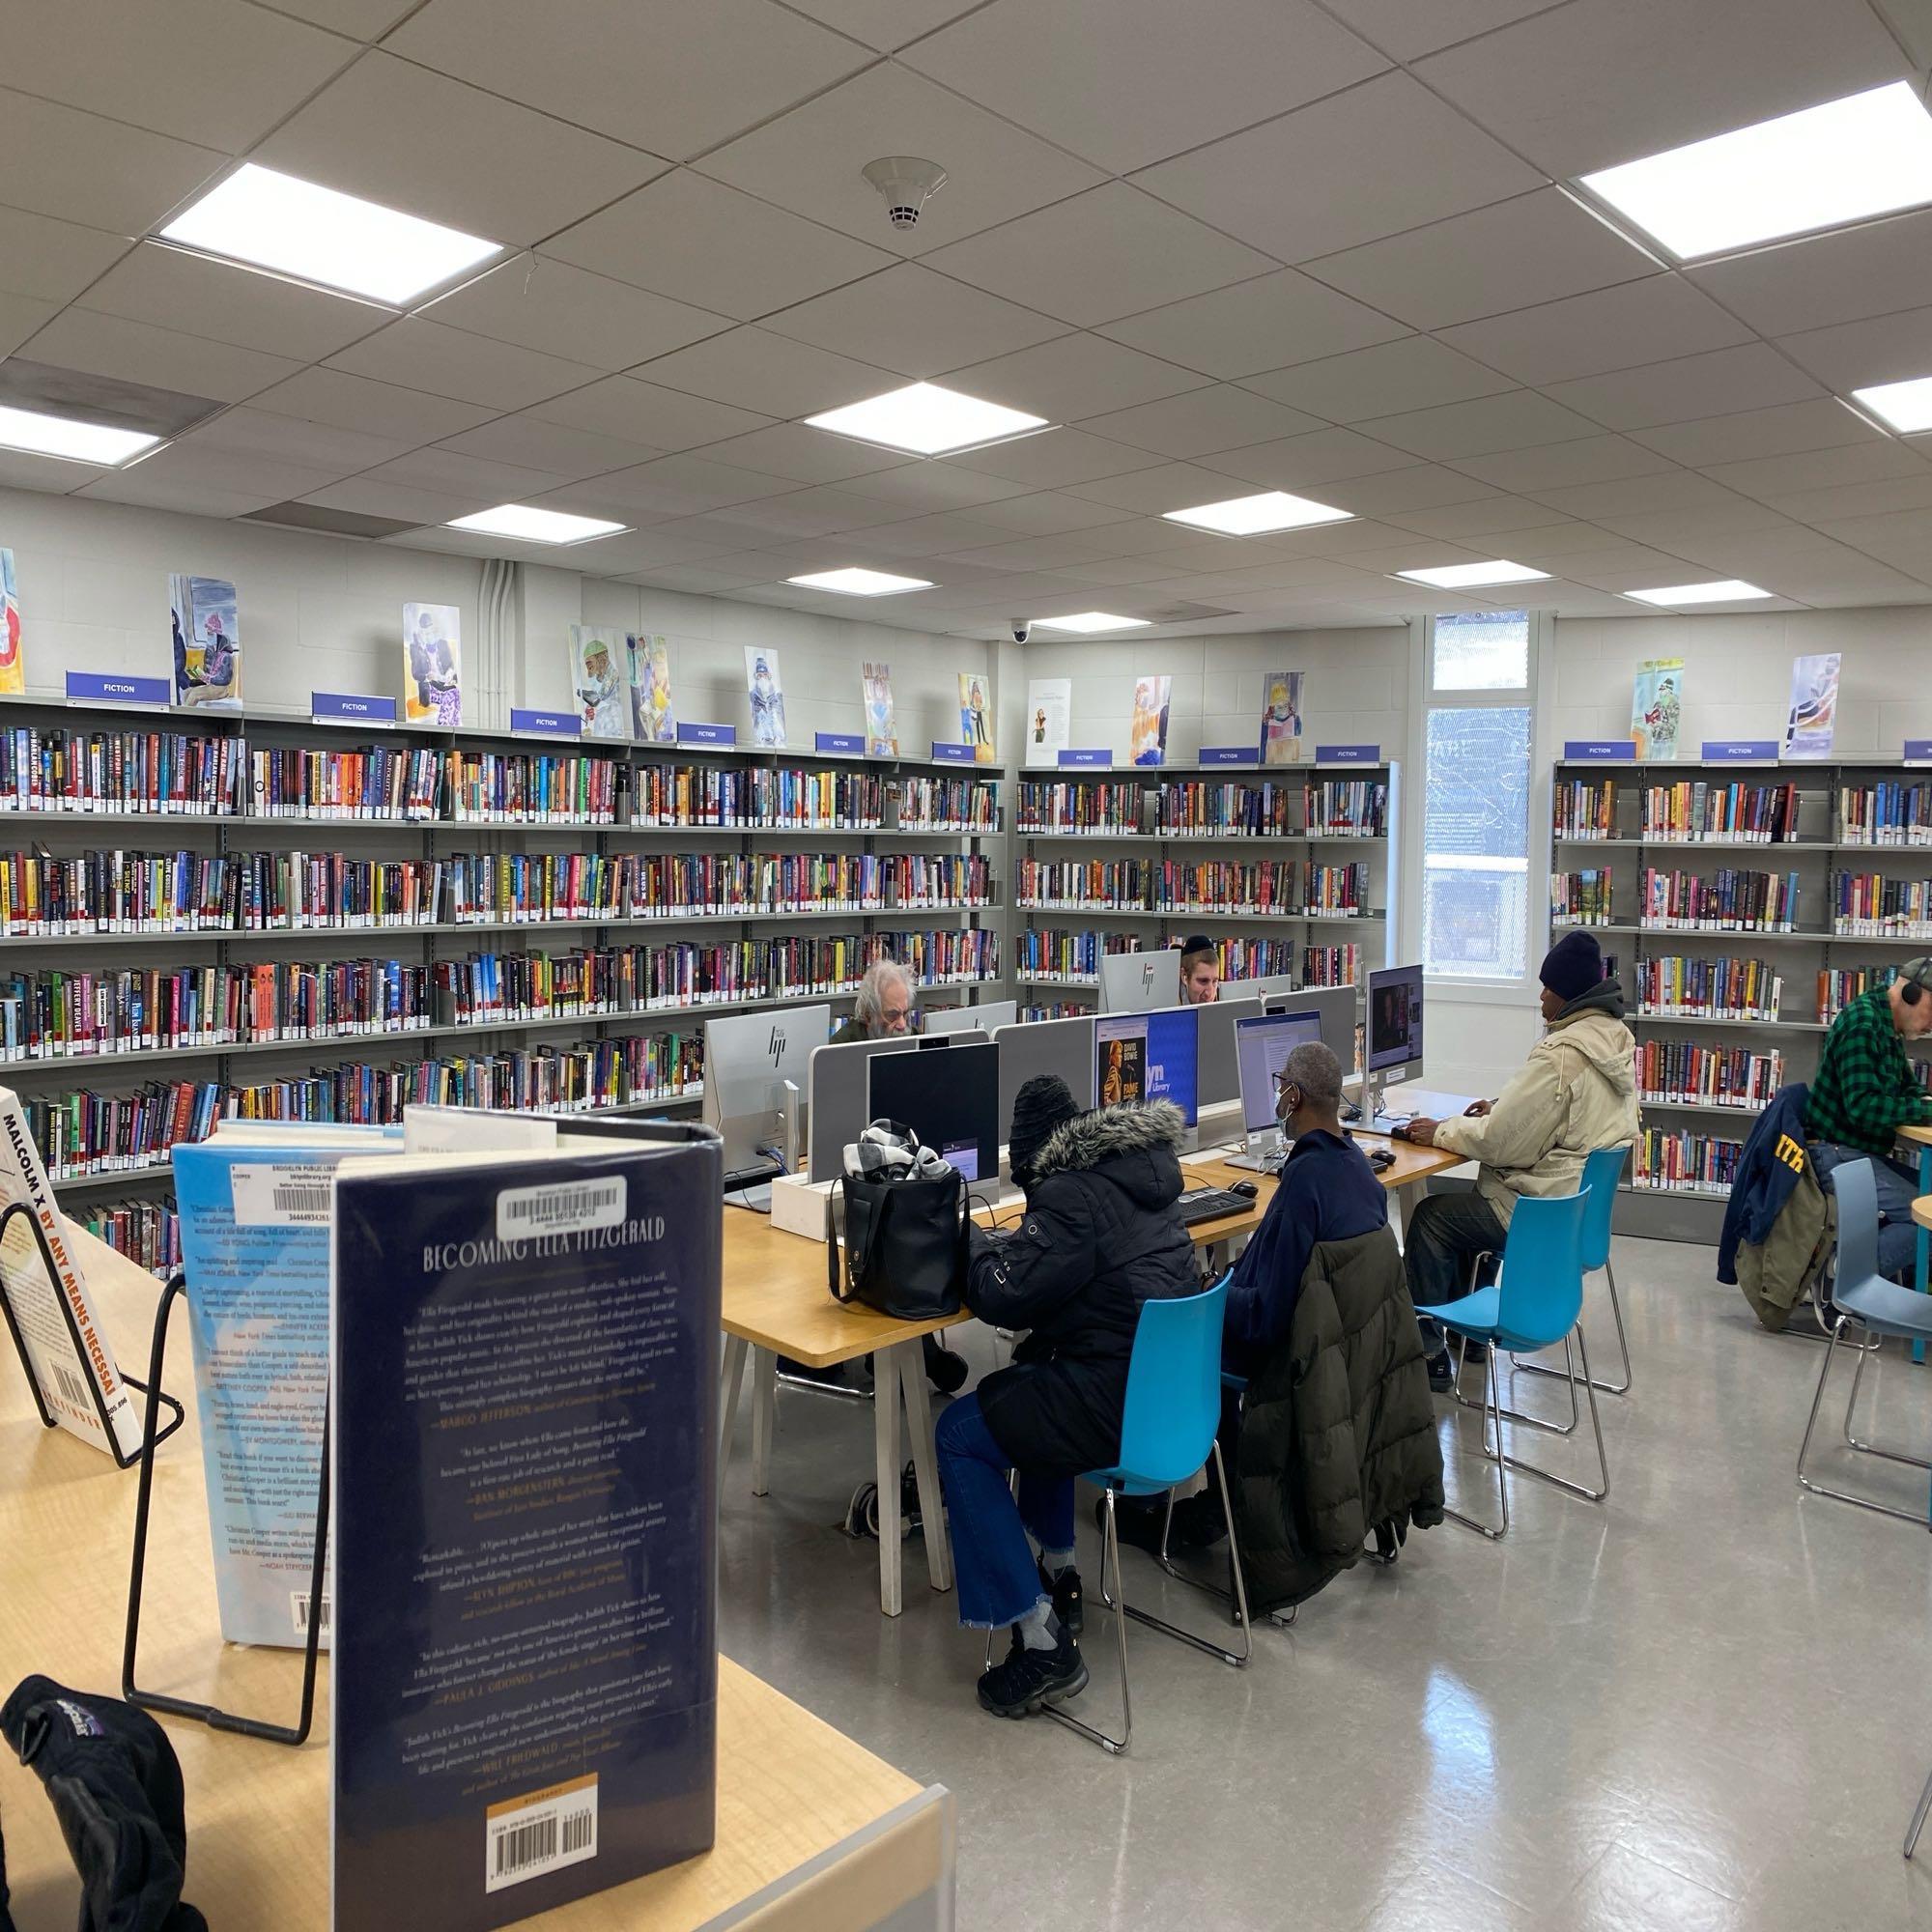
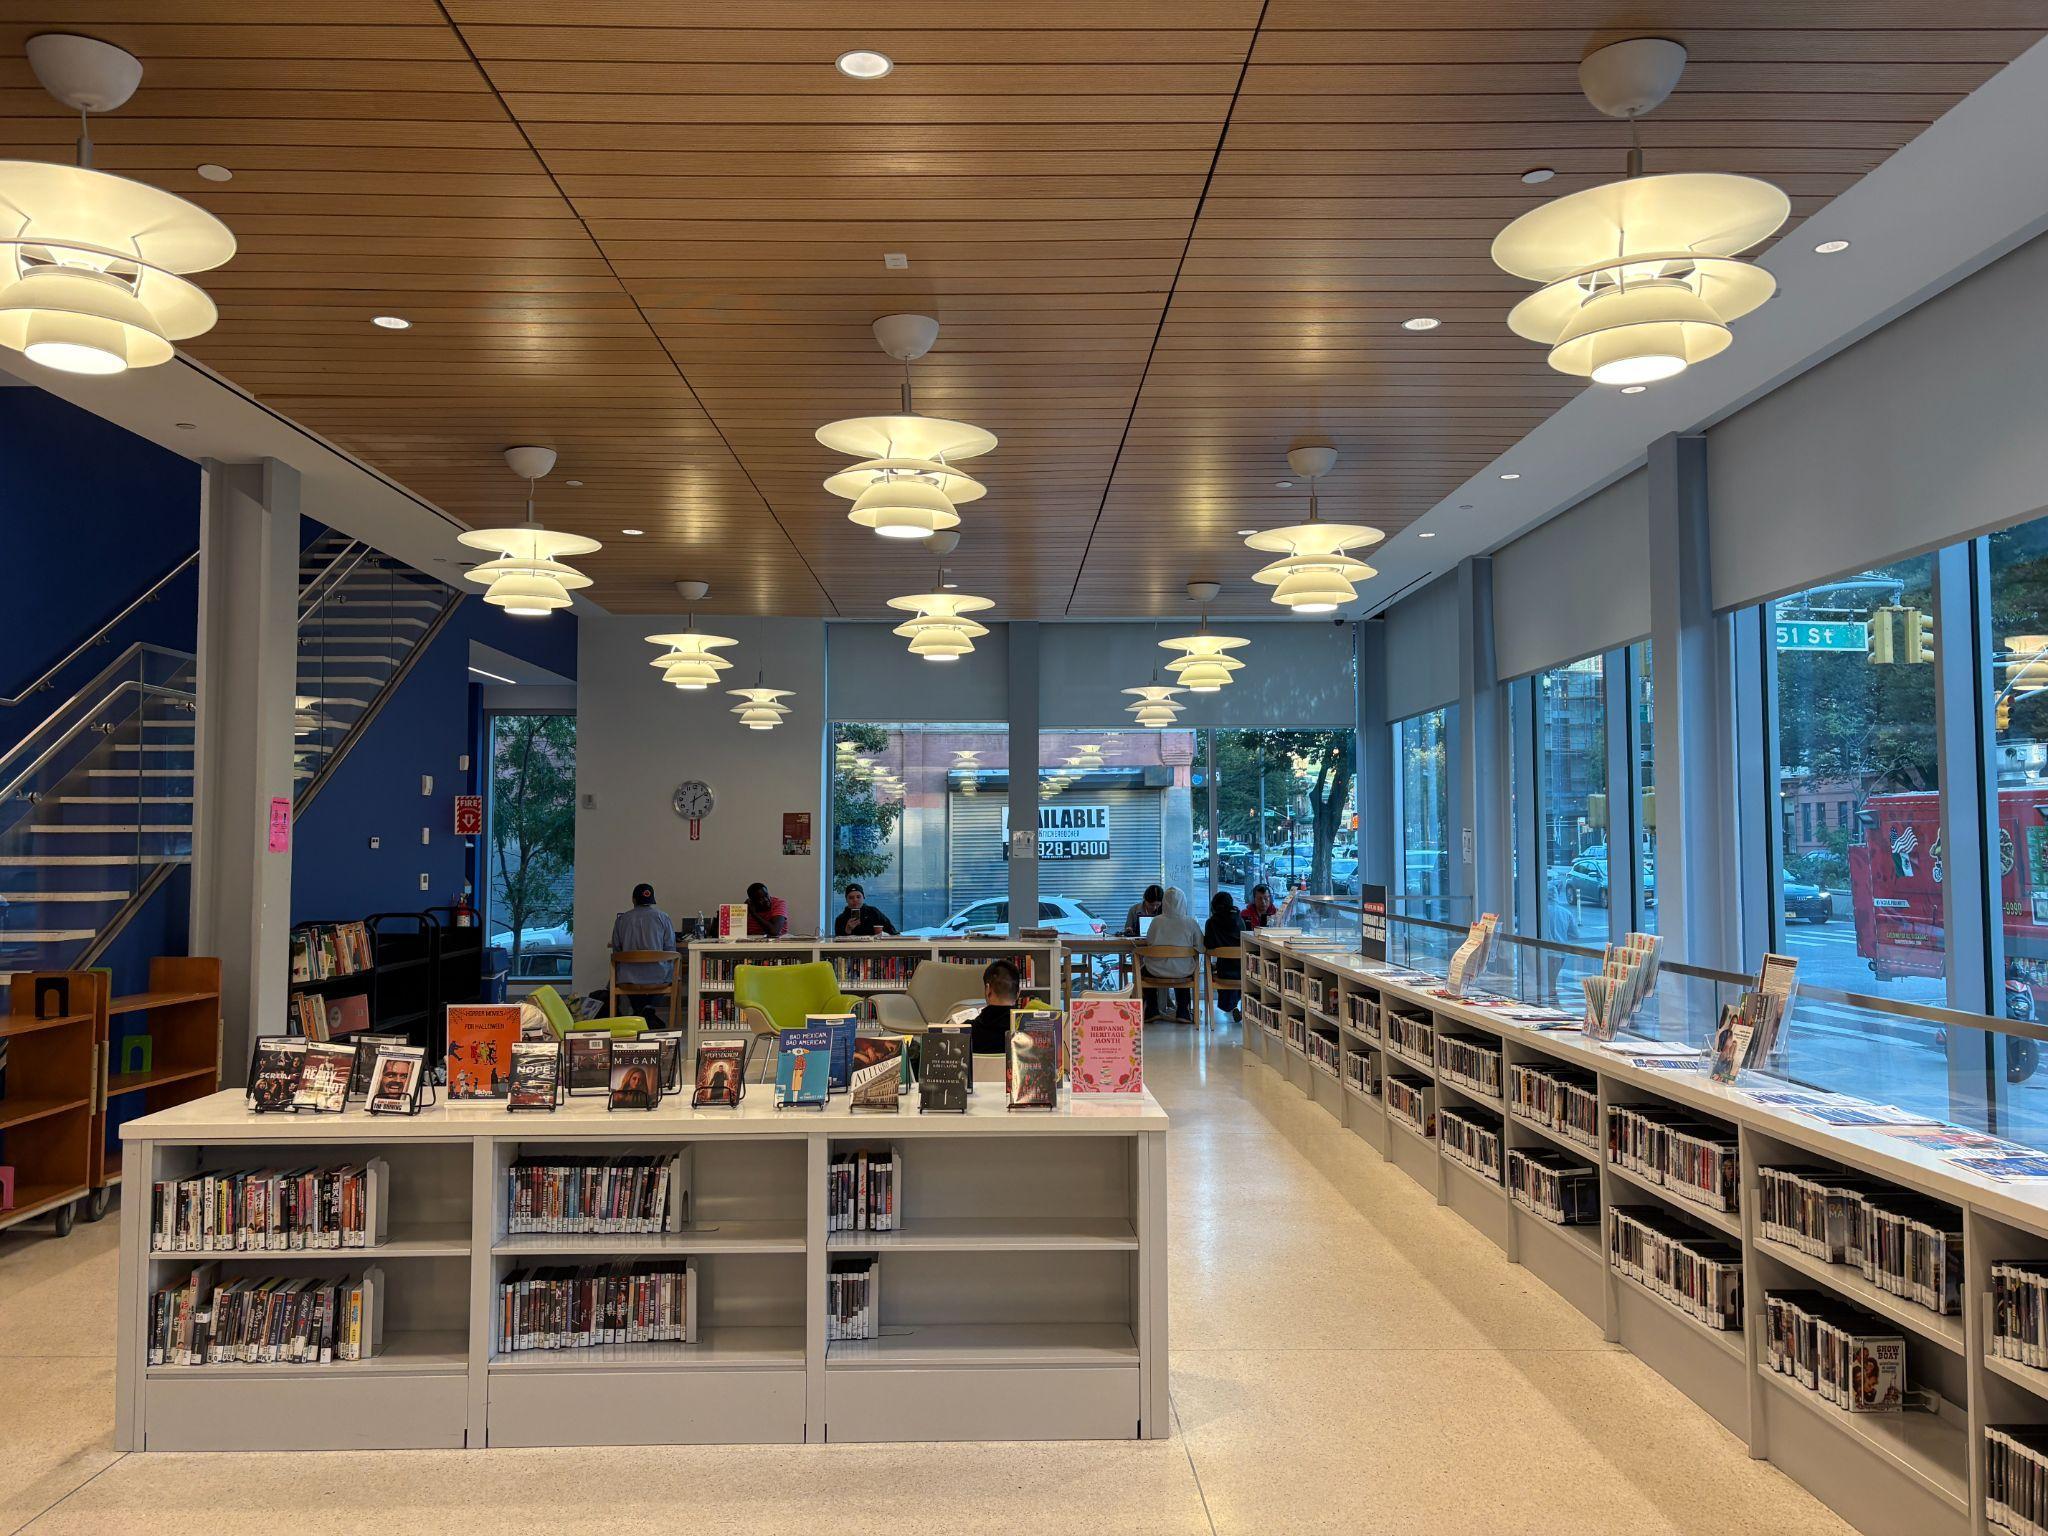
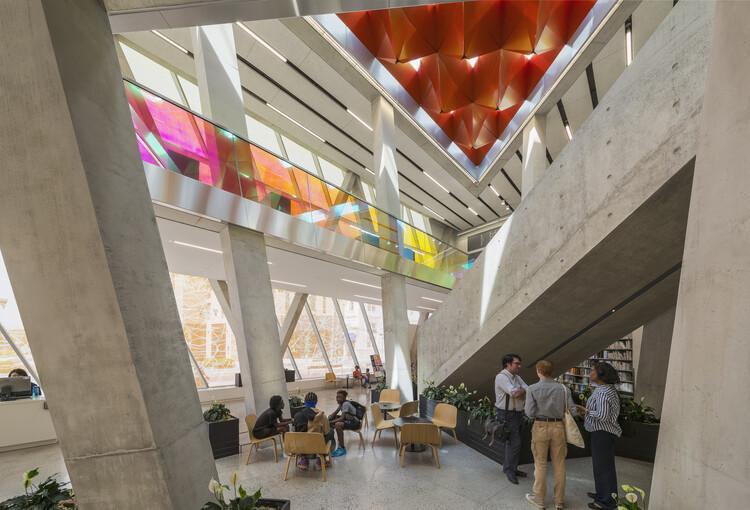
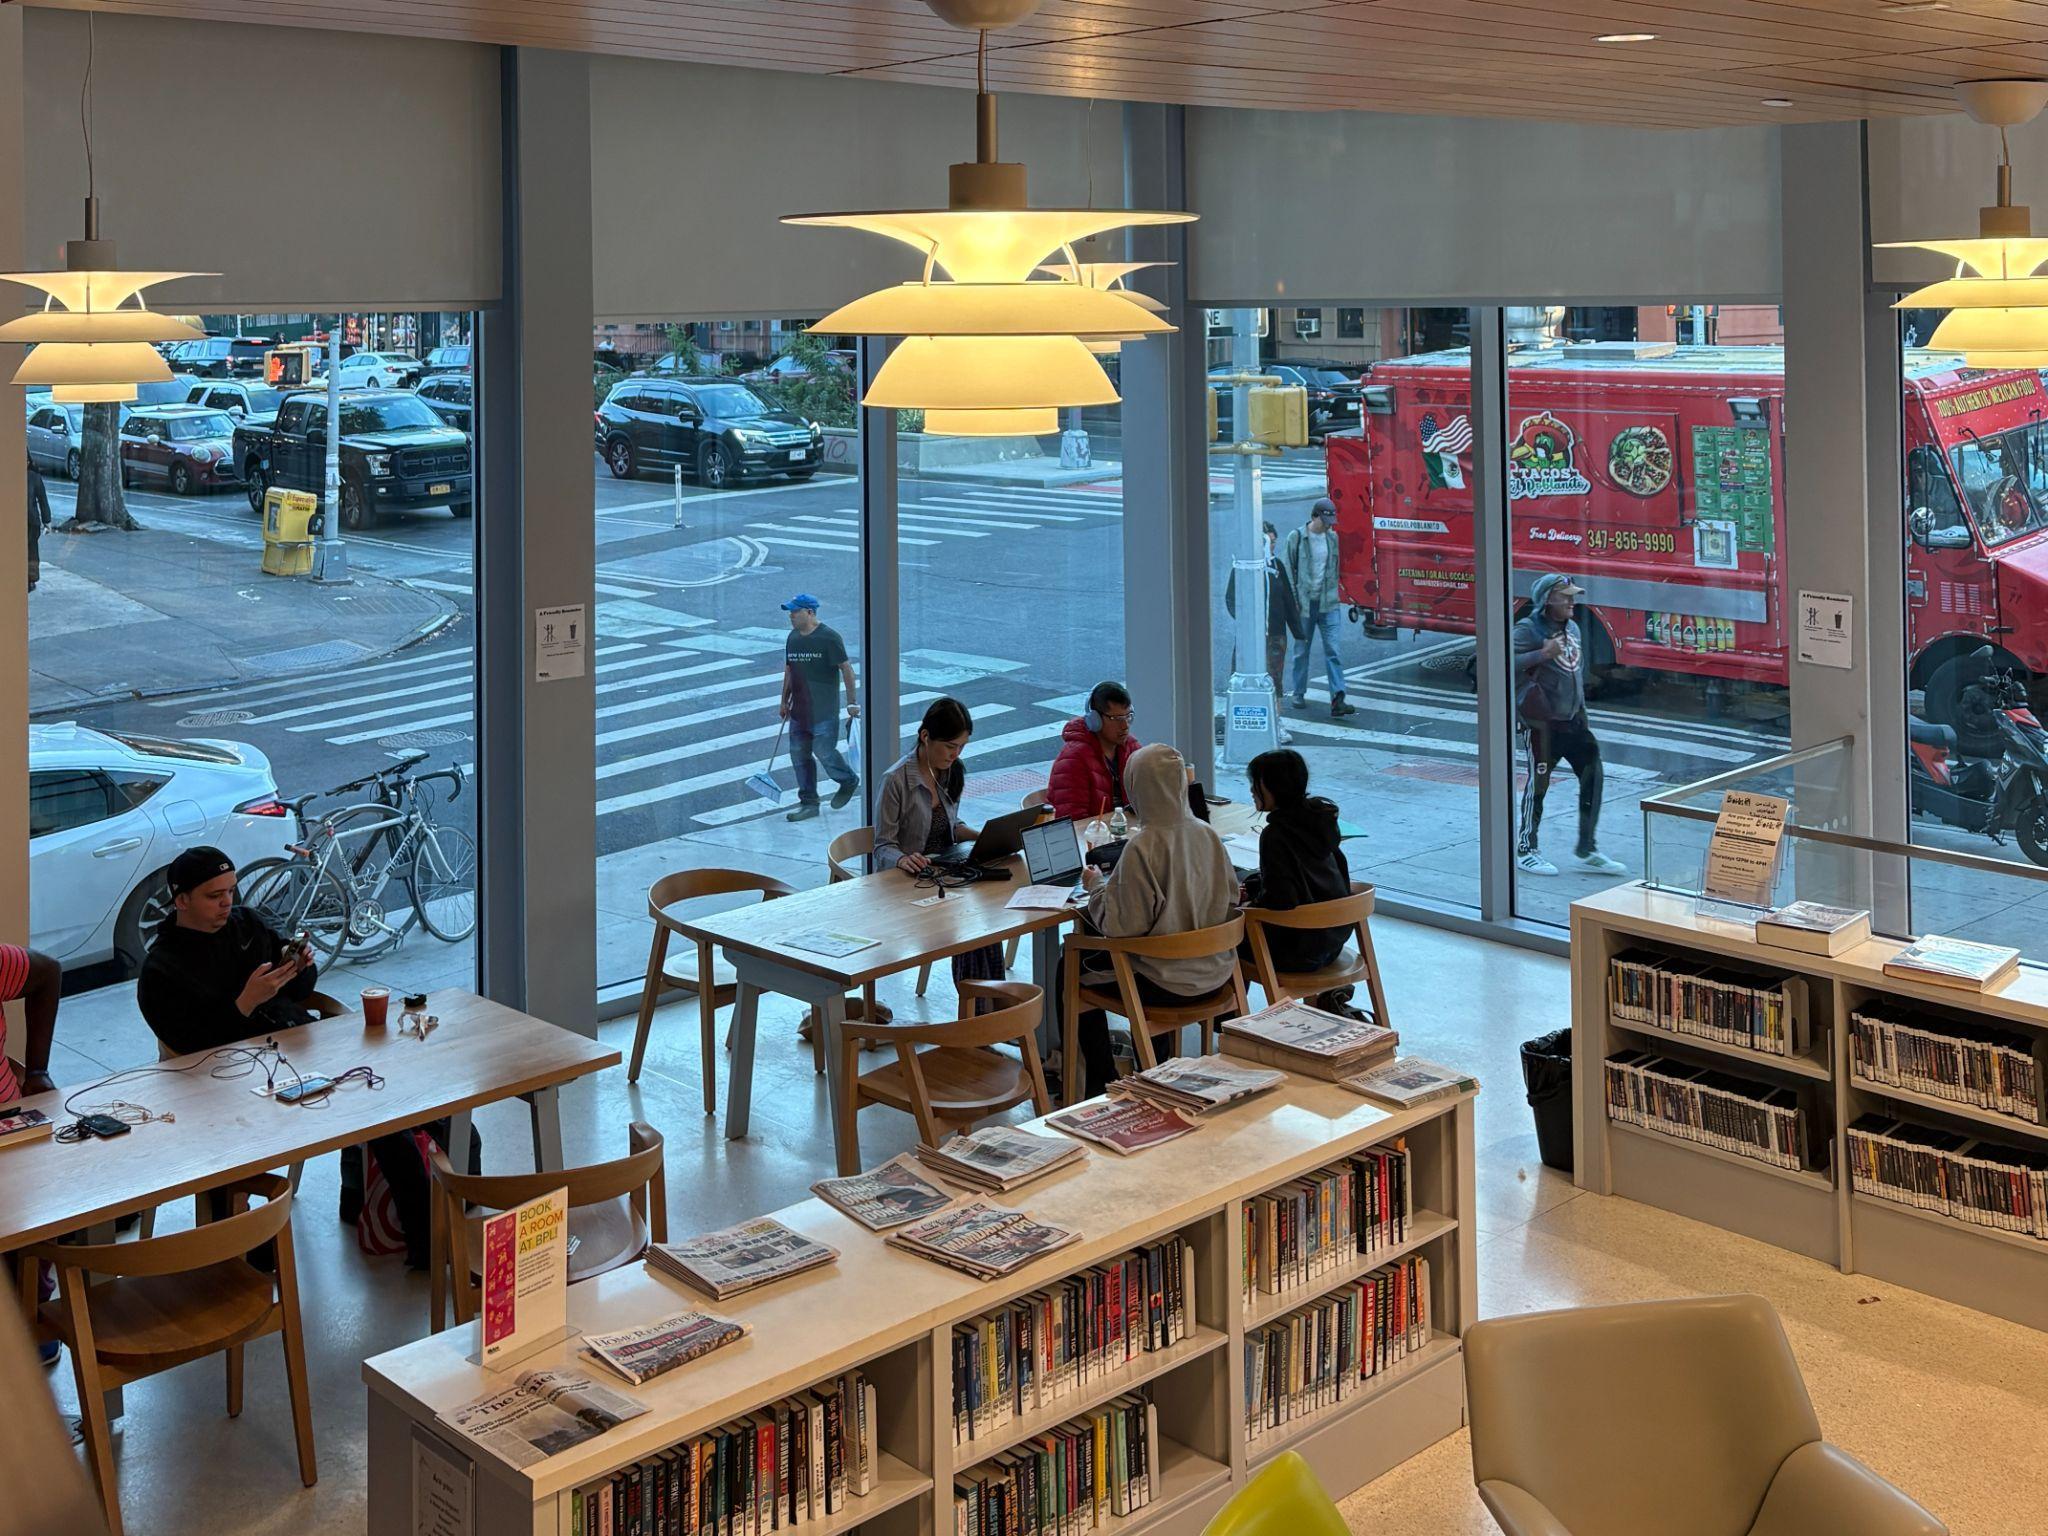
In places like NewYork City, libraries benefit from an expansive footprint of over 200 branches — each of which offers services and spaces for residents despite lackluster resources. Raising the bar for library quality will require dramatic expansions in hours, staffing, and programming to better serve local residents.
Baseline physical improvements might include upgraded bathrooms, improved HVAC systems for warming and cooling, and mesh network Wi-Fi. Additional improvements may include more bookable meeting rooms,
expanded seating areas, outdoor plazas or terraces attached to branches, shared and specialized services (e.g., equipment rentals like sewing machines, recording studios), and co-location with other amenities like recreation centers or community gardens or investments, such as affordable housing. Together, these improvements can help libraries amplify their role as critical hubs for everyday resources, essential knowledge, and community connection.
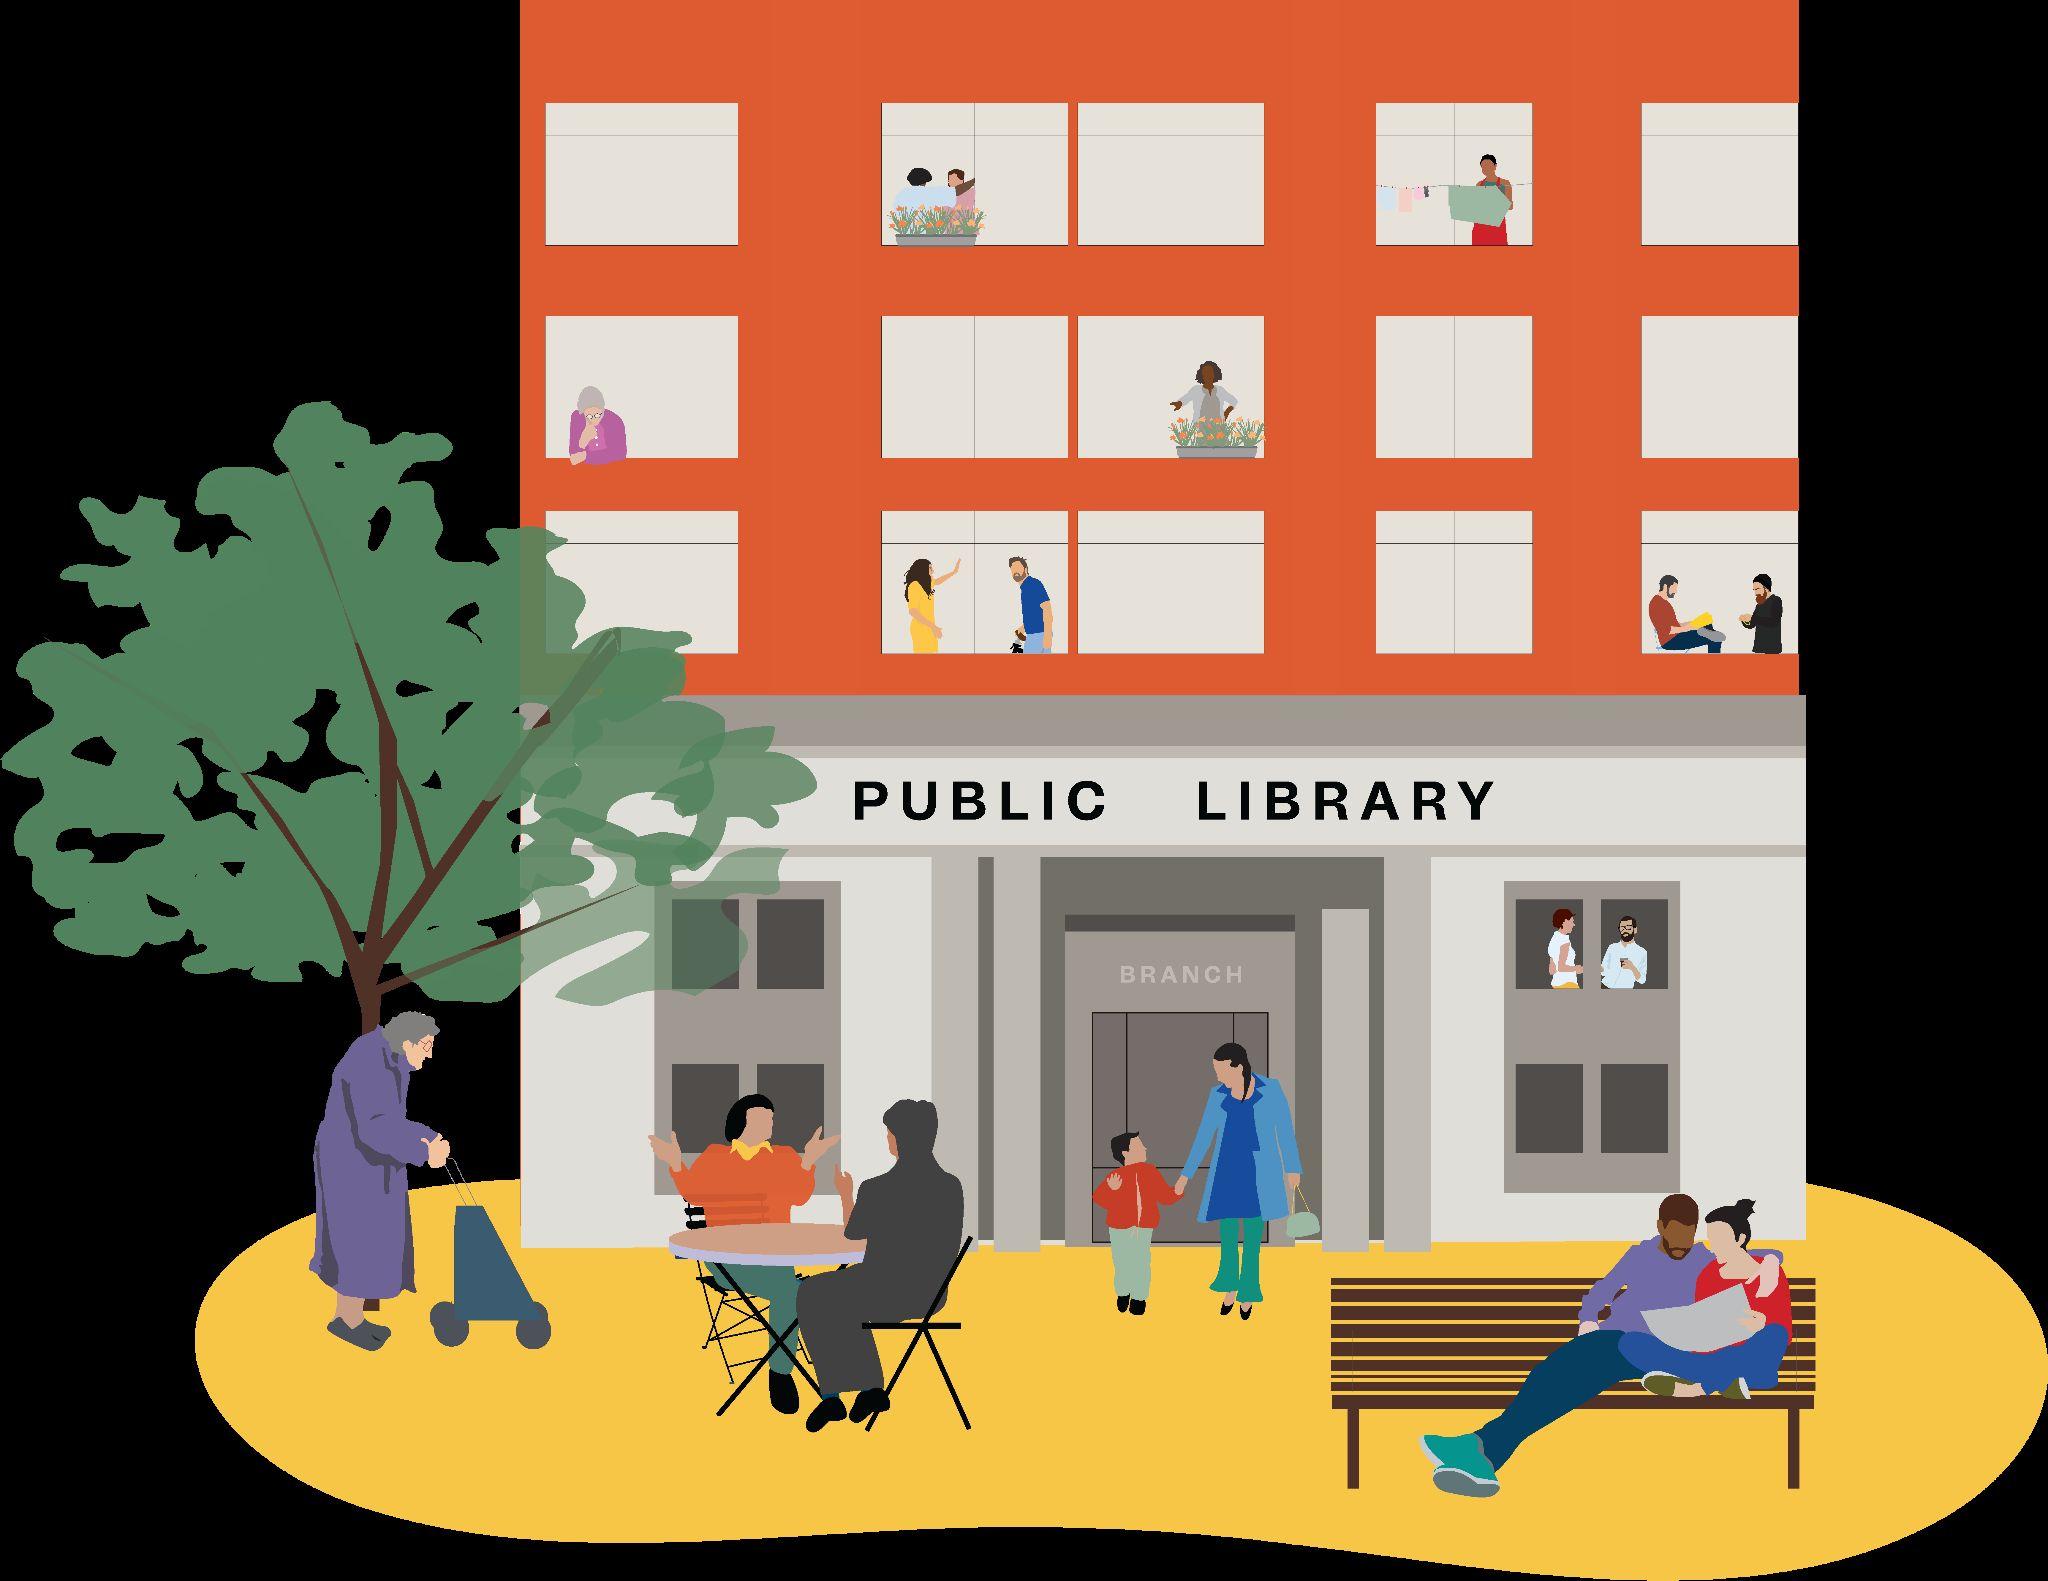
A redeveloped Sunset ParkLibrary opened in 2023, paired with 49 units of 100% affordable housing built above the space.
Revamp recreation and play spaces forall ages
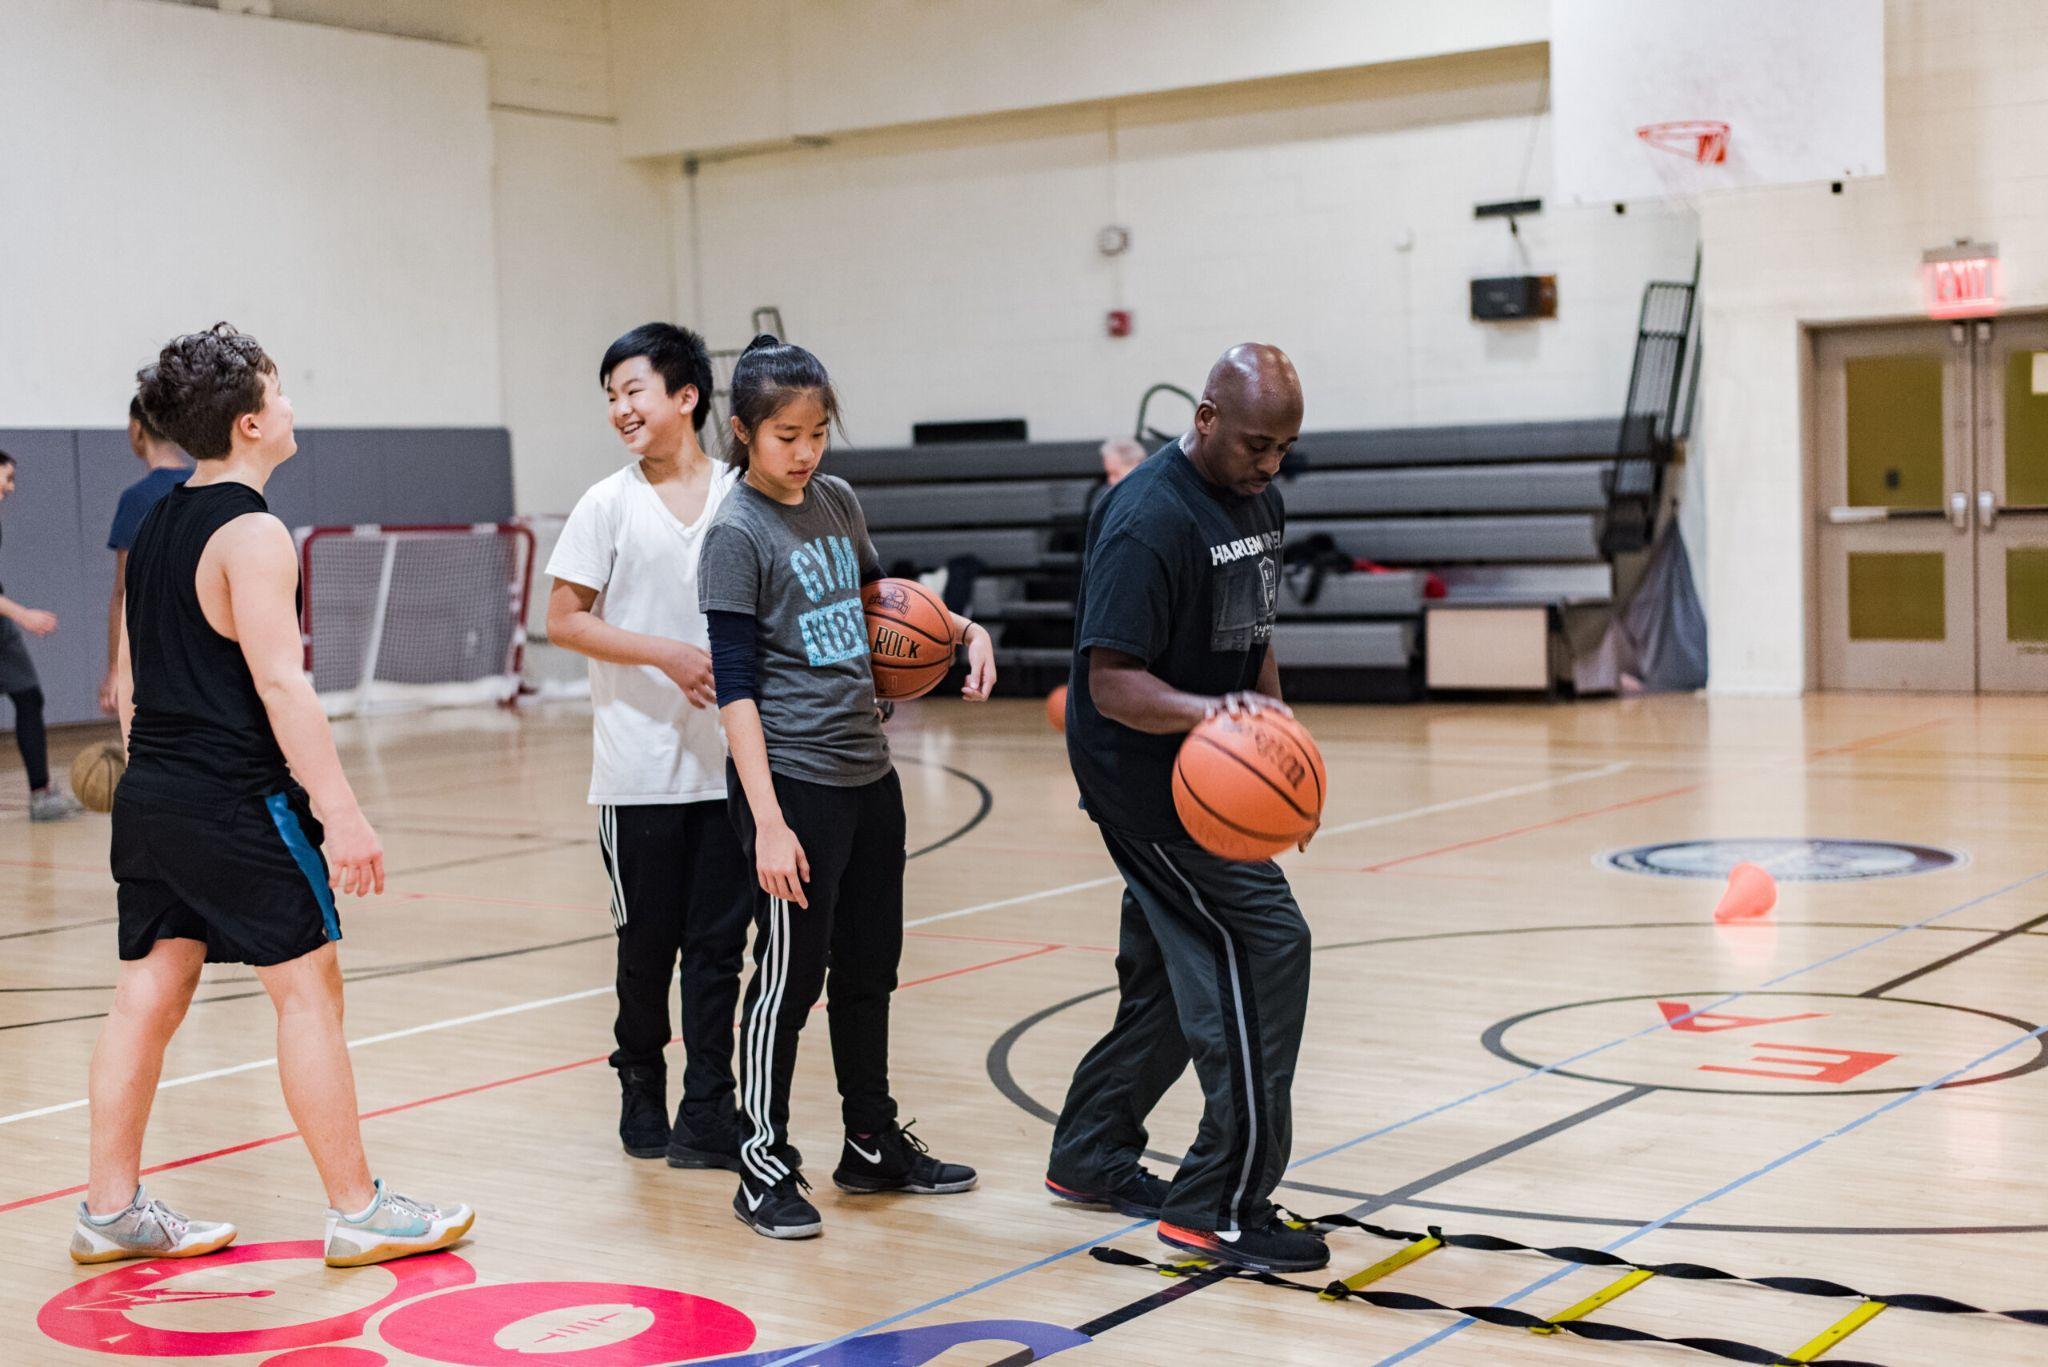
Areas to play and stay active are the fulcrum of community life. NewYork City must design and build a new generation of safe, adventurous, enriching recreational spaces for all ages — from kids climbing playgrounds, to teens playing pick-up basketball, to seniors practicing tai chi. For example, more public indoor and outdoor swimming pools, comparable to Robert Moses’ bold additions in the 1930s, could help residents cool off in the summer and serve the many young people who lack swimming know-how. NewYork City’s network of skate parks, a vital source of solidarity and support among young people, could be built out significantly.
Indoor recreation centers — long overdue for modernization and an expanded footprint — can house dedicated spaces for athletics, the arts, and informal socializing. They can relieve residents of costly gym or ceramics studio memberships. All of these spaces could be operated through the public sector, and/or through partnerships with established organizations like the Educational Alliance, which has a successful track record operating community centers, and informal civic and neighborhood groups.
Educational Alliance’s Manny Cantor Center reopened in 2014 after a $55 million gut renovation of its flagship building. The multi-purpose community center offers programs, essential services, and exciting events for people of all ages and backgrounds on the Lower East Side.
Make ourgathering spaces comfortable and resilient forextreme weather
As the weather changes, the ability to comfortably gather in public spaces is not a guarantee. Warming and cooling centers have historically been an emergency response effort to keep people safe from heat stroke, dehydration, and hypothermia. As extreme temperatures become more common, however, public gathering spaces must be built to keep people safe and comfortable on an everyday basis — transforming climate comfort from a crisis management effort to an essential part of city infrastructure.
Indoor public spaces like libraries and community centers can provide an air-conditioned alternative to the home and reduce households’ high summertime electricity bills.
Communities lacking tree cover will need more sources of shade — both high-stem canopy trees and human-made shade structures — to cool corridors and gathering spaces. Planting native vegetation throughout gathering places and streets will contribute to cooler ambient temperatures, improve biodiversity and absorb stormwater. Additionally, water fountains and misters can double as both a refreshing and playful feature in the public realm — and keep residents from improvising by illegally opening fire hydrants. Together, these efforts can amplify and sustain resiliency action by city and state governments.
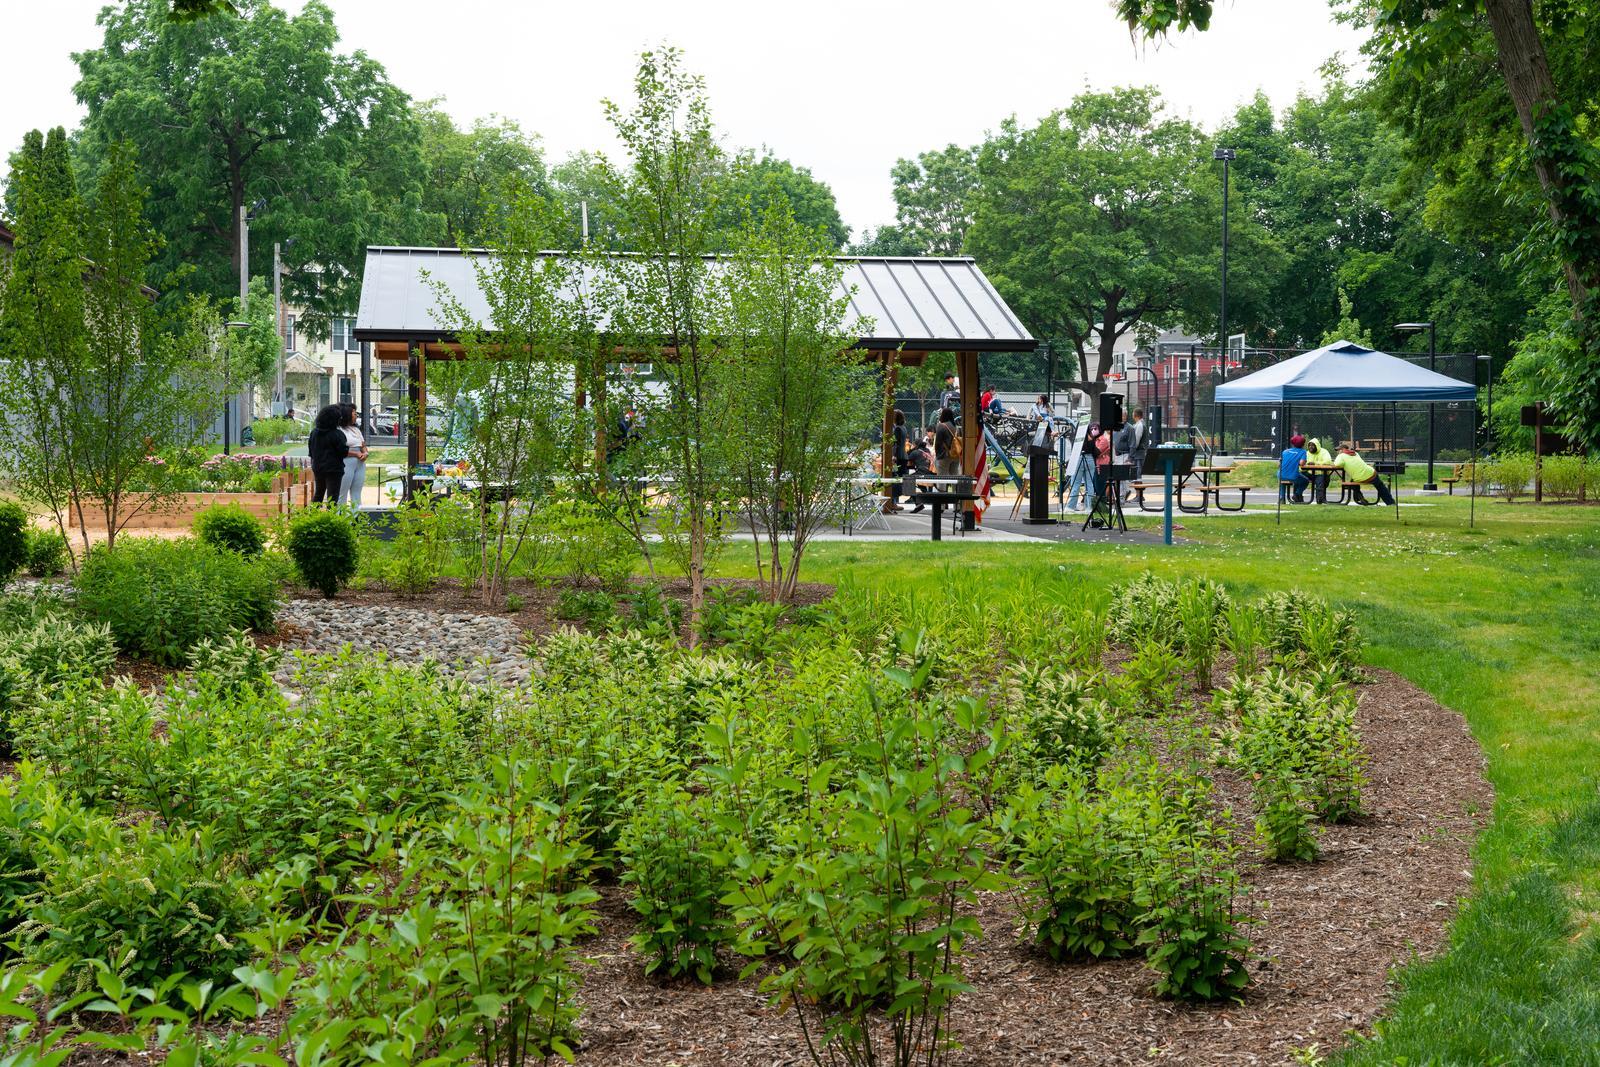
Beyond being a place for play and relaxation, Malcolm X Parkin Poughkeepsie is designed to help alleviate future impacts of the climate crisis. Rain gardens and bioswales built to mitigate flood events and improve water quality in the Fall Kill are planted with native shrubs and perennials that provide essential habitat to boost creekside biodiversity.
Transform streets into safe, social neighborhood connectors 4
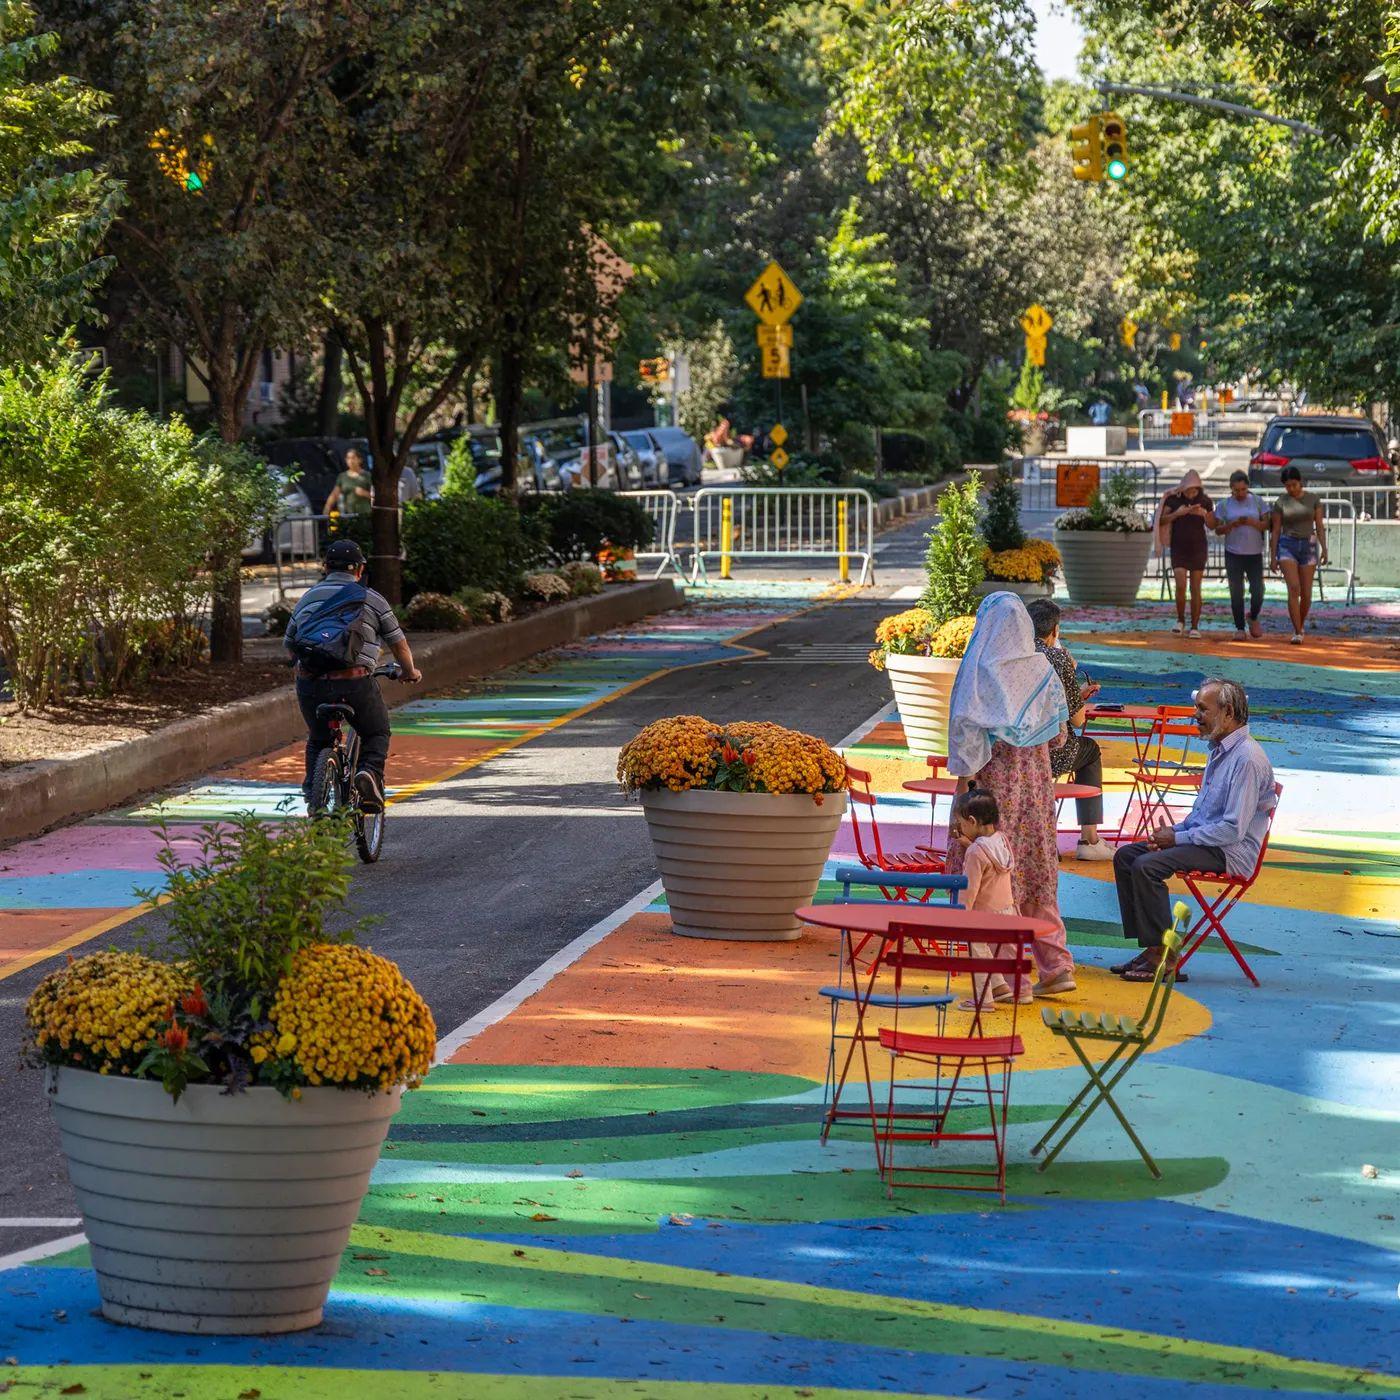
Given that social infrastructure is only useful if it can be accessed, paths leading to social infrastructure sites need to be safe, convenient, and delightful. Equipping streets to fulfill their potential as connectors to social infrastructure — and a form of social infrastructure in their own right — will take more than incremental sidewalk improvements, signage, or occasional closures for farmers’ markets and open streets. It will take significant changes to plantings, furnishings, and design to re-center the street as a comfortable, social place that’s built for people all year-round.
This means more seating for people to take a rest by the bus stop or between errands. Improved lighting in the streetscape — at a human-scale height and wattage — will make it feel safer
for all people to move through these spaces after dark. Repurposing the curb space or parking lane for community uses or greenery — not just outdoor dining — will expand opportunities for more everyday, non-commercial gathering. Activating the streetscape and ground floor at the edges of indoor social infrastructure — whether book fairs by libraries, play plazas by schools, or dance classes by community centers — is a way to strengthen their visibility and vibrancy.
All of these improvements should be focused on key routes and corridors that connect social infrastructure sites with residential areas, transit, schools, and job centers. They can also be tied to other initiatives, such as school streets or low-emission zones.
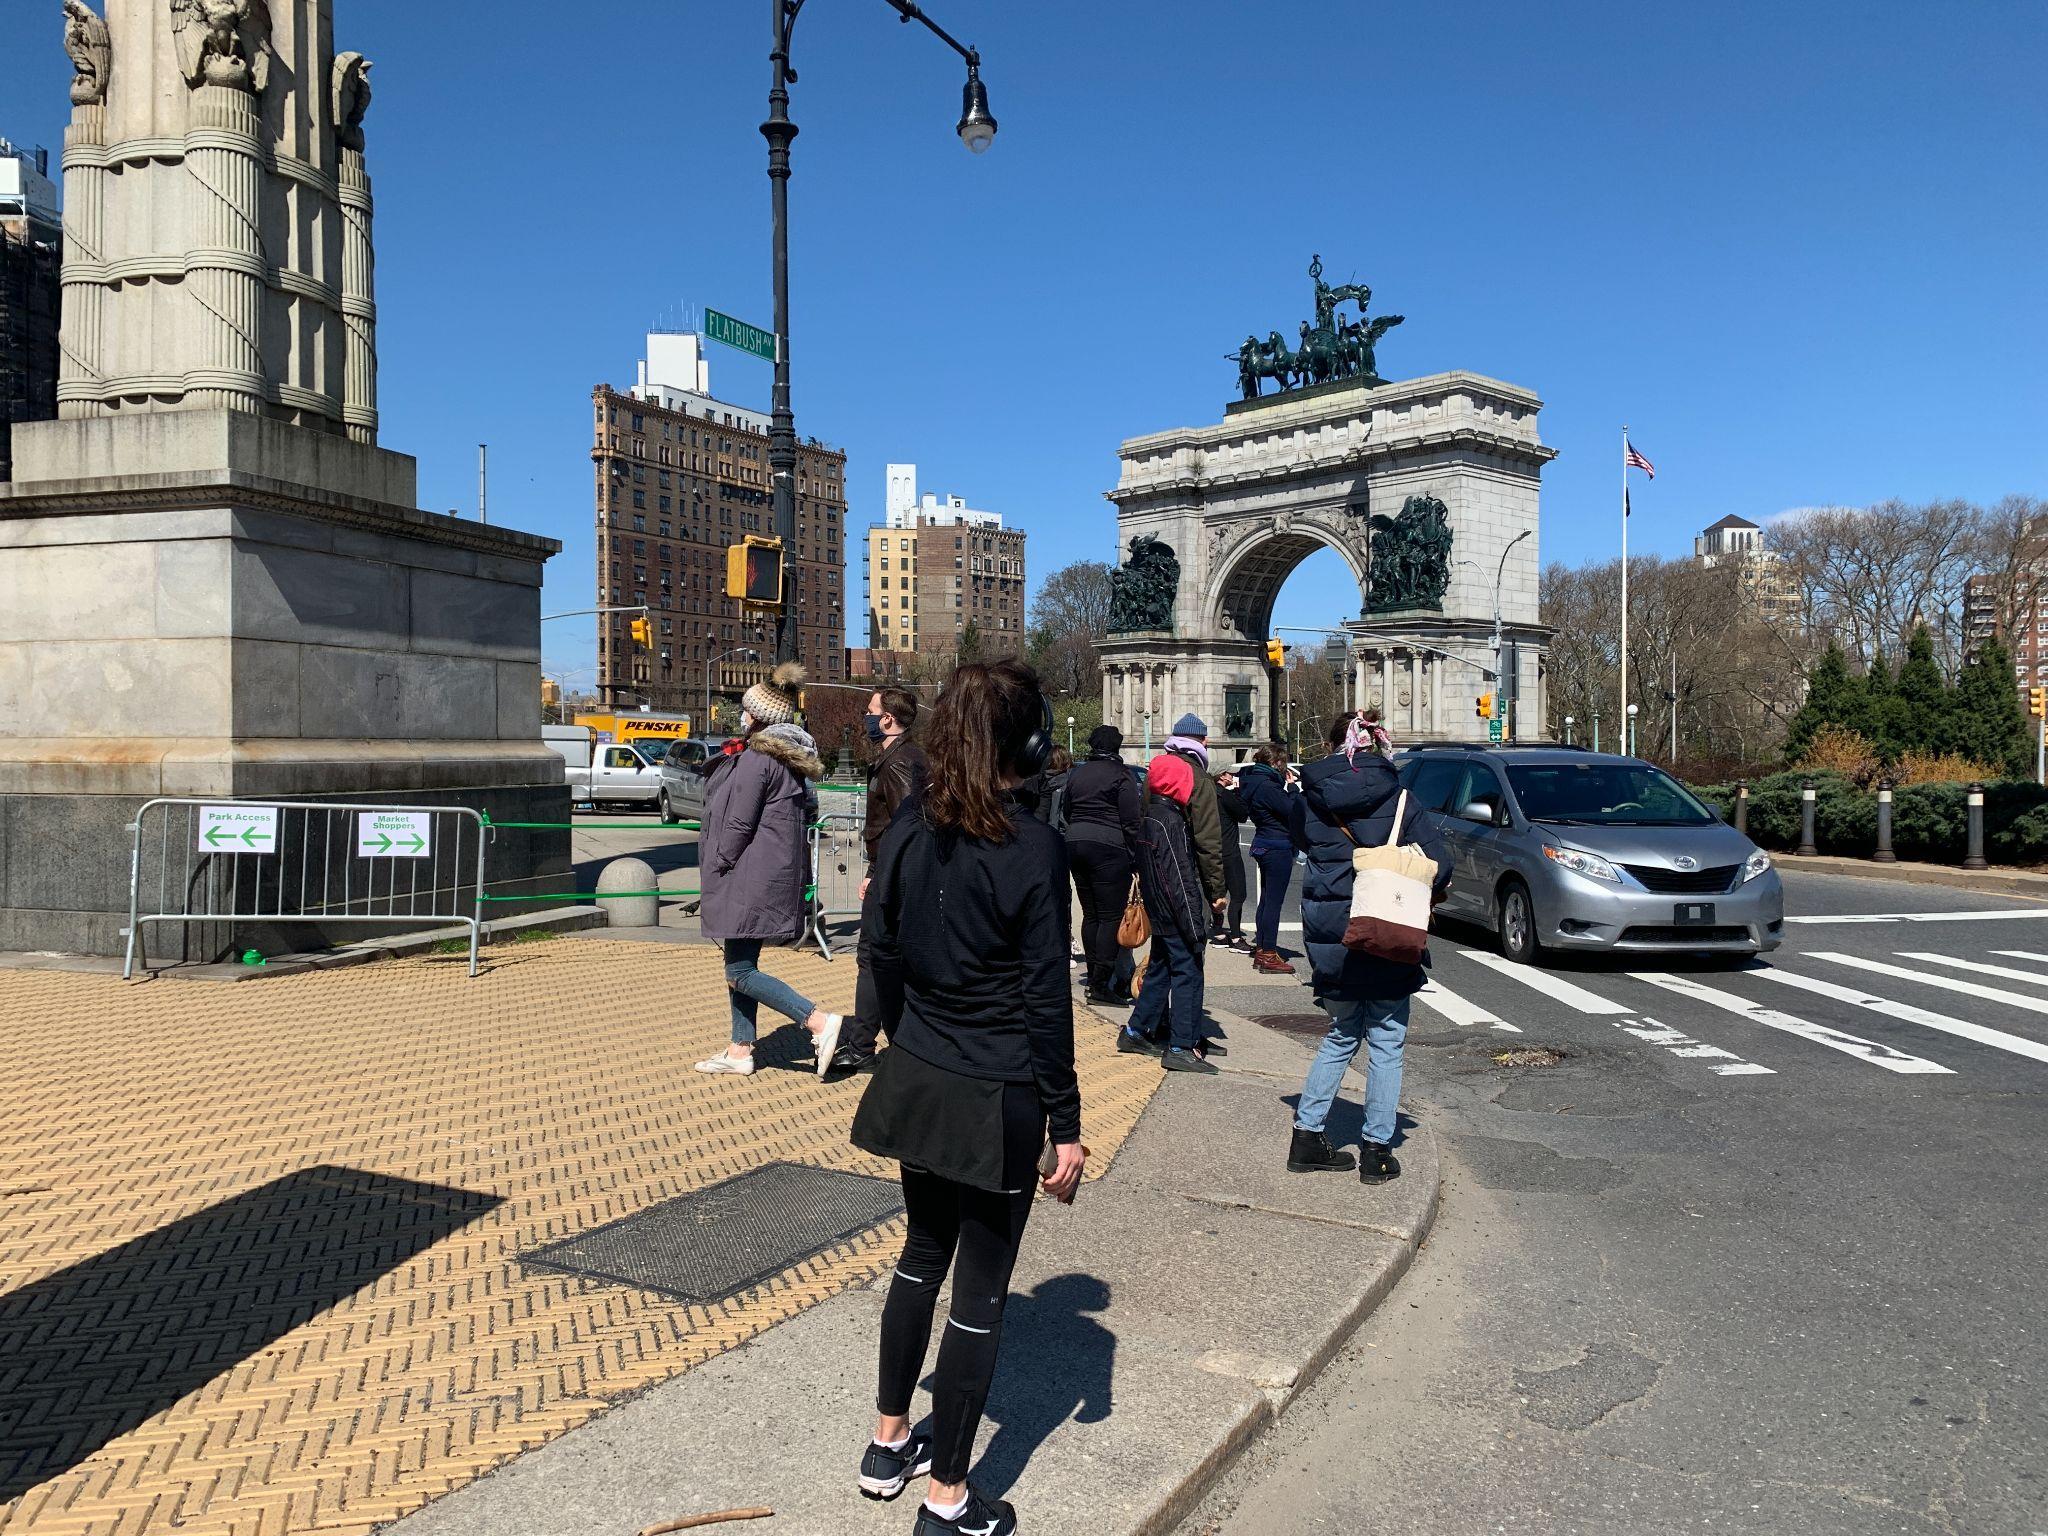
After decades of community advocacy and speculative design proposals, the NewYorkCity Department of Transportation is planning to improve the pedestrian crossing from Grand Army Plaza into Prospect Parkby eliminating the southern section of the road encircling the plaza. “Grand Army Plaza is the gateway to Brooklyn’s backyard, Prospect Park— and it should welcome NewYorkers with a street design that puts safety first,” Mayor Zohran Mamdani said in an April 2026 statement.32
Hire
and partnerwith
communities to run and activate spaces
Social infrastructure requires dedicated staffing to run programming, maintain spaces, and welcome people in. While volunteerism and informal stewardship is an asset for any neighborhood, sustainable operations rely on paid staff with wages comparable to private-sector opportunities. These can ensure spaces are open year round, and especially during summer months when public programming for children is in highest demand. This could occur through an expansion of the NewYork SummerYouth Employment Program. Other workforce development opportunities may include more funding to staff up organizations like HortNYC that maintain green spaces, hiring of social cohesion ambassadors in green spaces (as is happening in two Poughkeepsie parks), or
career-building opportunities in pathways tied to social infrastructure sites, such as recreation or library sciences.
Beyond workforce development, local volunteers may also need additional resources — whether funding for programming or stipends for some participants — for informal events.
In order to increase headcount and job opportunities, reducing administrative friction is a priority. This means simplifying permitting, licensing, and compliance processes for operations and programming, and providing shared services and/or technical assistance to help organizations and volunteers navigate remaining requirements.
Harvey, helps smaller cities and their underserved communities to create and maintain parks. It provides funding and support while working with local leaders to develop practical, long-term parkmanagement plans with clear goals, maintenance strategies, and implementation steps.
Assess neighborhood social infrastructure needs and fill gaps
Every neighborhood in NewYork has assets to amplify and gaps to fill in their local social infrastructure networks. A social infrastructure inventory or ‘health check’ done with community partnerships and at the neighborhood scale can help city departments and local partners prioritize and coordinate investment. Understanding where the gaps are — as this study has done in its focus communities — is an important first step.
First, public sector, in partnership with local leaders and organizations, should map all public social infrastructure assets (e.g., parks, libraries, recreation centers) and their informal and formal stewards (e.g., city departments, conservancies, non-profits, volunteers) in a neighborhood and assess the
diversity, quality, and accessibility of these spaces. Then, the gaps should be filled accordingly, which may include: targeting capital improvements where quality is lacking; creating new sites in underserved areas; expanding budgets for programming or maintenance; and tying new social infrastructure investments to incoming development in the area. Community partners should be involved from the beginning and can help determine local needs and best ways to meet them. The assessment framework at the end of this report can serve as a guide.
To draw on two examples, in Flatbush, Brooklyn, residents, while having a significant number of churches and a thriving set of community-involved non-profits, regularly cite a dire absence of places for young people to
safely congregate, seating for those gathering on Flatbush Avenue, and shaded spaces during especially hot days. Conversely, upstate, in Poughkeepsie, locals have different needs, noting that, despite an abundance of program-ready physical space, they suffer from a consistent lack of funding for programs, safe pathways between social infrastructural sites, and transportation to more distant locations. The needs of these two communities, informed by local leadership and network-wide analysis, point the way toward priority investments to improve neighborhood social infrastructure networks.
Raising the bar by raising funds from multiple sectors for social infrastructure
Social infrastructure depends on capital funding for new and improved sites and sustained funding for the everyday maintenance, programming, and stewards and staff that make spaces work. However, public funding for these systems has declined over time, even as demand and public support remain high. As cities across the country reckon with crises of affordability, isolation, and civic decline, they are also exploring new models for funding social infrastructure.
In NewYork, government leaders can build on recent creative public-private funding models — such as to create affordable housing, libraries, and community or educational spaces together — as well as on commitments to fund everyday systems, such as bus service, childcare, and grocery stores under NewYork City Mayor Zohran Mamdani, with support from New York Governor Kathy Hochul.27 Indeed, just as commuting, eating, and child-rearing are essential to everyday life, so is social infrastructure. Incidentally, social infrastructure sites are often home to many of these very activities.
Amid a widening budget deficit in NewYork City, increasing public funding for social infrastructure will continue to require more than changes to department budgets on an annual basis, as advocates have been pushing for for years with parks and libraries.
New mechanisms may include the creation of public-private partnerships that support endowed programs, paired with new capital investments, revenue generation from new sources, like curbside parking, tax levies, or funding ballot measures that have gained ground in many U.S. and global cities.
Recent commitments from three major foundations to the Mayor’s Fund to Advance NewYork City, to support the Mayor’s free childcare initiative, demonstrate the vital role philanthropy and the private sector can have in funding specific programs.28 Moving forward, these could be tailored to social infrastructure investments and operations — such as capital upgrades, or community ambassador programs that assist in planning, activating, and stewarding places.
Today, the “open space ratio” is used as a zoning standard to determine whether and how much open space real estate developers should provide at or near new residential buildings. A “social infrastructure ratio” could be a similar measure to inform developers’ contributions to on-site or nearby social infrastructure sites.
Institutional investors could contribute to a dedicated fund that harnesses social infrastructure’s varied returns on investment — such as property value, health, and climate resilience. Such a fund could be tied to a specific area (as with a Business Improvement District)
or sit in a citywide pool distributed equitably based on greatest need.
While social infrastructure needs more fiscally secure, less politically volatile funding than municipal budgets typically provide, the public sector must nevertheless set the foundation and direction. Guiding principles for funding could be:
➔ Public funding provides the foundation and direction for departmental allocations and new revenue-generating policies
➔ Philanthropic and impact investors support targeted investments, innovation, and expansion
➔ Real estate developers and institutional investors contribute through place-based investments that meet neighborhood needs and support development projects
➔ Community leaders and stewards can help raise funds in formal and informal ways and be involved as decision-makers in how sites are designed, programmed, and activated
We live in unprecedented times and to fund these important spaces, we’ll need an all-hands-on-deck approach that both builds trust and empowers communities and establishes public and private partnerships that capture the full value of social infrastructure.
Acknowledgements
The Institute for Public Knowledge (IPK) brings theoretically serious scholarship to bear on major public issues. Located at NewYork University, it nurtures collaboration among social researchers in NewYork and around the world. It builds bridges between university-based researchers and organizations pursuing practical action. It supports communication between researchers and broader publics. And it examines transformations in the public sphere, social science, and the university as a social institution as these change the conditions for public knowledge.
Eric Klinenberg Project Lead
Michael Koncewicz Associate Director
Nan Feng Postdoctoral Researcher, Cities, Communities, and Social Infrastructure
Matthew Wolfe Postdoctoral Researcher, Cities, Communities, and Social Infrastructure
Mylene Oyarzabal Researcher
Grace Sternberger Student Researcher
Gehl is a global urban design and strategy consultancy that shapes places where people and planet can thrive. We believe that by applying a people-first approach to planning, design, and research, we are able to solve some of our communities’ most pressing challenges. Founded in Copenhagen and active globally—with studios in NewYork and San Francisco—Gehl has worked in over 250 cities across six continents.
Julia Day Partner & Director
Eamon O’Connor Senior Project Manager
Candice Ji Designer & Researcher
Precious Ndukuba Designer & Researcher
Helena Wolf Emeritus: Designer & Researcher
Community Partners & Contributors
LowerEast Side
12th Street BlockAssociation
14th StreetY
9th Street A-1 BlockAssociation
Bowery Alliance of Neighbors
Educational Alliance
Eldridge St BlockAssociation
Henry Street Settlement
Manny Cantor Center
NewYorkPublic Library
University Settlement
Flatbush
Brooklyn College
Brooklyn Level Up
Brooklyn Public Library
Flatbush Nostrand Junction BID
Volunteers
Survey
Ally Welsh
Clio Maya-Johnson
Graciella Suman
Hadiatou Barry
JackTeehan
Jeremy Deacon
John Demchak
JulianYoung
Karen Lee
Kate Cham
Malia LaVoie
Sia Qiu
Global Action forUrban Health Lab
at NewYorkUniversity
Sarah Nemetz
Sibi Chakravarthy
Poughkeepsie
Casa Comunitaria de Recursos
Celebrating The African Spirit
City of Poughkeepsie
Community Matters 2
Day One Early Learning Community
Dutchess County Pride Center
Dutchess Outreach
Family Partnership Center
Gallery 40
Hudson River Housing
MASS Design
Mid-Hudson Discovery Museum
Poughkeepsie Children’s Cabinet
Poughkeepsie Public Library District
Scenic Hudson
The Art Effect
Vassar College
Walkway Over the Hudson State Historic Park
Public Life Observation
Alex Xu
Alexandra Gonzalez
Benedetta von Palombini
Brynn Anderson
Eesha Parasnis
Gabriela Karnadi
Juliana Leite
Lina Pattayabut
Mackenzie Carney
Malcolm Toleno
Michelle Peña
Nancy Umana
Raquel Teixeira dos Santos
Ronnie Zhu
Samuel Zhang
Sara Susan Paul
V. Akhil Akash
Yuan Zhang
References
1. Klinenberg, Eric. 2018. Palaces for the People: How Social Infrastructure Can Help Fight Inequality, Polarization, and the Decline of Civic Life. Penguin Press. Link
2. Gehl. 2024. Social Infrastructure: Connecting People and Places for Healthy Communities. Link
3. Gehl, The Bentway Conservancy, University of Toronto Dalla Lana School of Public Health. Rx For Social Connection: Public space as a strategy to combat loneliness. Link.
4. Gehl. Making Cities for People. Link.
5. Gehl, Jan. 1987. Life Between Buildings: Using Public Space, translated by Jo Koch, Van Nostrand Reinhold, NewYork. Danish Architectural Press.
6. Klinenberg, Eric. 2002. Heat Wave: A Social Autopsy of Disaster in Chicago. University of Chicago Press.
7. Center for an Urban Future. 2026. Putting the “Rec” Back In NYC Parks & Recreation. Link
8. Trust for Public Land. 2021. Parks and an Equitable Recovery. Link.
9. Woloch, David. 2024. A Dysfunctional Dance: How NewYork City Budgets for Public Libraries. Link.
10. Kipcakli, Suheyla. 2023. How Making Cities More Pedestrian-Friendly Can Revitalize Local Economies. Link
11. Office of the Surgeon General. 2023. Our Epidemic of Loneliness and Isolation, social infrastructure was the top recommendation for combating loneliness. Link
12. Gehl. 2025. A Charlotte That Cares forYou. Link.
14. Center for Active Design. 2017. The Assembly Civic Engagement Survey: Key Findings and Design Implications. NewYork: Center for Active Design. Link.
15. Nichol, B., Wilson, R., Rodrigues, A., & Haighton, C. 2024. Exploring the effects of volunteering on the social, mental, and physical health and well-being of volunteers: an umbrella review. Voluntas: international journal of voluntary and nonprofit organizations, 35(1), 97-128. Link.
16. NewYorkers for Parks. 1% for Parks: Impact Report. 2023. Link
17. NewYork Public Library. 2025. Rising Costs and Growing Demand: Libraries Need Help. Link.
18. Hernandez, Estefania. Spectrum News NY1. 2024. Sunday service to resume at seven libraries this weekend. Link
19. Sandstrom GM, Dunn EW. 2014. Social Interactions and Well-Being: The Surprising Power of Weak Ties. Pers Soc Psychol Bull. 2014 Jul;40(7):910-922. doi: 10.1177/0146167214529799. Epub 2014 Apr 25. PMID: 24769739. Link.
20. EunYoung Choi, 2024,Longitudinal Associations of Neighborhood Social Cohesion With Self-Perceptions of Aging and Loneliness, The Journals of Gerontology: Series B, Volume 79, Issue 1, January 2024, gbad148. Link
21. van der Horst, M., Coffé, H. 2012. How Friendship Network Characteristics Influence Subjective Well-Being. Soc Indic Res 107, 509–529. Link.
22. Ramos, M. R., Li, D., Bennett, M. R., Mogra, U., Massey, D. S., & Hewstone, M. 2024. Variety Is the Spice of Life: Diverse Social Networks Are Associated With Social Cohesion and Well-Being. Psychological Science, 35(6), 665-680. Link
23. Bi, S., Maes, M., Stevens, G. W. J. M., de Heer, C., Li, J.-B., Sun,Y., & Finkenauer, C. 2025. Trust and subjective well-being across the lifespan: A multilevel meta-analysis of cross-sectional and longitudinal associations. Psychological Bulletin, 151(6), 737–766. Link
24. Howard, Amanda Hiles, Getrude Dadirai Gwenzi, Lindsey Newsom, Belay T. Gebru, and Nicole Gilbertson Wilke. 2023. "The Relationship between Sense of Belonging and Well-Being Outcomes in Emerging Adults with Care Experience" International Journal of Environmental Research and Public Health 20, no. 13: 6311. Link.
25. The Lower East Side survey respondents reported the highest levels of an active social life at the area’s social infrastructure sites. These strong social outcomes come from a strong social network, and may also be influenced by other factors like population density and resident tenure.
27. Robin Hood. 2024. Reimagining Affordable Homes with New Stories. Link.
28. Fitzsimmons, Emma G. 2026. Mamdani Turns to Private Donors in His Push to Expand Free Child Care. Link.
29. Living New Deal. Maps & Sites. Sites by State and City. Link.
30. Dierickx, Mary B. 1996. The Architecture of Literacy: The Carnegie Libraries of NewYork City, pp. 104-186. Cooper Union for the Advancement of Science and Art and the NewYork City Dept. of General Services, NewYork. ISBN 1-56256-717-9.
31. Kimmelman, Michael. 2026. How Readers Voted on 17 Ways to Improve NewYork City. Link
32. Chen, Stefanos. 2026. Can This Chaotic Brooklyn Plaza Be Car-Free? Mamdani SaysYes. Link
Appendix
Notes on Methodology
Methods Snapshot
Public Life
Observation
3,080 people observed
Stationary visitor activities — including perceived age and gender, posture, group setting, and activity — were recorded anonymously using the Gehl Public Life App to understand who is present at social infrastructure sites and how they spend time there.
Survey 1,100+ individuals surveyed
A 23-question survey was administered to visitors of 21 social infrastructure sites to examine the types and depth of social connections formed at each site.
Public Space Assessment
28 sites
Spatial quality indicators related to the site’s design, programming, and maintenance were assessed to understand the physical conditions of social infrastructure sites.
Interviews
98 interviewees
Interviews with residents, site operators, and community leaders were conducted to understand the level of social connection, operating model, the quality and needs of social infrastructure sites.
Mapping 12 space types
Distinct social infrastructure space types, ranging from parks and playgrounds to streets and plazas, were mapped based on publicly available datasets and on-site research.
Eye Level City 3 walkshops
Focus Groups
3 focus groups
Focus groups with 2-6 residents were conducted in each study location to understand how key stakeholder groups experience and perceive social infrastructure within their communities.
Groups of 5-14 residents participated in photo-journaling walks, followed by post-walk workshops, to share their lived experiences and perceptions of local social infrastructure sites.
Interviews Survey In-person Observations
Interviews were conducted with 98 residents and community leaders in Flatbush, the Lower East Side, and Poughkeepsie. Individuals were selected according to several logics, but with a bias towards those who were or had been engaged in some form of community development or planning -- whose work, in effect, required them to think about the challenge of local social infrastructure. Such stakeholders were identified through public sources, such as media reports or directories, or, in many cases, through snowball sampling, wherein one interviewee would recommend another who they expected would have something apropos to contribute to the study. In other instances, the opinions of unspecialized residents were solicited as a means of understanding the state of a community's social infrastructure from the perspective of those who would putatively use it. In this sense, we sought the perspectives of both "experts" and non-experts, seeing where they overlapped and diverged. Our goal in these interviews was to both offer data that differed from that gathered through quantitative research and secondary source analysis, while also seeking to verify those findings.
Surveys were conducted with over 1,100 patrons in the Lower East Side, Flatbush, and Poughkeepsie during July-November 2025. The types of public social infrastructure included in the study were parks, sports facilities, libraries, community centers, skate parks, track-and-field facilities, and dog parks. The survey sampling framework was developed using multiple sources of information, including field observations, SafeGraph data, administrative records, and our team’s local knowledge. All surveys were administered using paper questionnaires. Surveyors typically administered the survey, unless patrons requested to complete it themselves. Each survey took approximately three minutes to complete. In general seating areas within parks, we employed random sampling. Surveyors used the last digit of the second at the moment of selection and counted from right to left to identify the patron to approach. In sports facilities and other sub-facility spaces within parks, surveyors approached individuals who were not actively engaged in activities in order to minimize disruption. Across all three sites, only adults aged 18 and older were surveyed. The design of the survey is grounded in theories of social connectedness in public spaces and aims to examine these processes using empirical data.
In-person observations, with notes, were carried out at 76 field sites in Flatbush, the Lower East Side, and Poughkeepsie. Our selection of these sites was guided both by interviews and secondary sources, particularly media reports, in which we sought to answer the question of which social infrastructural sites were most important to community members. We also relied heavily on SafeGraph data, which leverage geolocation data from cell phones to rank which areas of a community were most heavily trafficked. In addition, we sought, for all three communities, to comprehensively canvas their geographic areas, either by walking, in the case of the Lower East Side or Flatbush, or by driving, in the Poughkeepsie. This enabled us to verify, through direct observation, findings from other sources, as well as discover new sites. This in-person exploration allowed us to identify which infrastructure, in practice, the community did or did not use. In Flatbush, for example, while Flatbush Avenue is not generally described, in public sources, as a form of social infrastructure or community engagement, direct observation allowed us to identify it as a key node of social connection.
Public Life Observations Public Space Assessment Eye Level City
Visitor stationary activities were observed and recorded anonymously by 23 trained volunteers (including IPK staff and Gehl staff) using the Gehl Public Life App. Stationary counts recorded visitors’ locations, perceived age, gender, posture, group setting, and activities.
Data collection took place at key social infrastructure sites within each study area.
Lower East Side:
Seward Park, Seward Park Library, Canal Street (Open Street), Jefferson Street (Open Street)
Flatbush:
Flatbush Avenue along three key stretches Parkside Avenue, Church Ave, Cortelyou Road, and Foster Avenue as the dividing lines
Poughkeepsie:
Malcolm X Park, Mansion Square Park, Family Partnership Center, Community Matters 2
Gehl staff conducted an assessment of the physical quality indicators related to the site’s design, programming, and maintenance using a digital form in Maptionnaire. Each indicator was rated on a three-point scale: poor, average, or good.
Data collection took place at key social infrastructure sites within each study area.
Lower East Side: Seward Park, Seward Park Library, Canal Street (Open Street), Jefferson Street (Open Street), Captain Jacob Joseph Playground, Sol Lain Playground, Luther Guilick Playground, 14th StreetY, La Plaza Cultural
Malcolm X Park, Mansion Square Park, Family Partnership Center, Community Matters 2, Pershing Ave Park, Waryas Park
Groups of 5-16 trained participants (ages 16-78) from Henry Street Settlement’s SummerYouth program, Manny Cantor Center and Brooklyn Level Up took part in a photovoice walk exercise using the Gehl Eye Level City App. During a 60-minute walk through the Lower East Side, participants were asked to photograph places that either encouraged or discouraged social interaction within the community.
For each photo, the app prompted them to:
● Rate the photo on a scale from 1 to 5, with 1 being negative and 5 being positive.
● Tag the emotion the photo evoked, choosing from a range of feelings – from positive emotions such as happy, comfortable, and connected, to negative ones like stressed, unsafe, or isolated.
● Identify what triggered that feeling, selecting from categories such as design elements (e.g., art, architecture), programming (e.g., events), or maintenance (e.g., cleanliness).
One week after the walk, a co-analysis focus group was conducted to further explore and contextualize the participants’ perspectives on these social infrastructure sites.
Study Sites
Working closely with local partners and community leaders, the team examined 35 sites across three communities — the Lower East Side, Flatbush, and Poughkeepsie, with a focus on Downtown and the North Side, using a mixed-methods approach.
Drawing on a review of existing social infrastructure indicators, the study developed an assessment framework to evaluate how design, programming, maintenance, and funding shape social connection. By combining multimethod research designed by IPK’s sociologists and Gehl’s urban planners — including quantitative analysis with field research and observation — the research documents patterns and on-the-ground realities related to how people use social infrastructure and how the quality of social infrastructure impacts a range of social connection outcomes.
LowerEast Side
Canal Street (Open Street)
East River Park
Hamilton Fish Park
Jefferson Street (Open Street)
Junior High 56 school yard
La Plaza Cultural Community Garden
LES Coleman Skatepark
Luther Gulick Park
Manny Cantor Center
Ottendorfer Library
Pier 35
Pier 42
Sara D Roosevelt Park
Seward Park
Seward Park Library
The 14th StreetY
Tompkins Square Library
Tompkins Square Park
Flatbush
Caribbean Marketplace
Cortelyou Library
Flatbush Avenue
Flatbush Library
Newkirk Plaza
Parade Ground
The Junction
Tot Lot
Poughkeepsie
Adriance Memorial Library
College Hill Park
Eastman Park
Family Partnership Center
Kaal Rock Park
Main Street
Malcolm X Park
Mansion Square Park
Pershing Ave Park
Pulaski Park
Walkway over the Hudson
Waryas Park
Assessment Framework
Design and measure forsocial outcomes
A guide forsite operators
Drawing from existing literature and the findings from this study, the enclosed framework functions as an assessment guide for site operators. The framework is organized around the different design, program, maintenance, and funding factors that contribute to a site facilitating the full spectrum of social connection — from familiarity to relationships to community.
Familiarity
Community
Social Infrastructure Assessment Framework
Social infrastructure refers to the networkof physical spaces that shape our capacity to interact. But what does it take to bring interactions to life?
The way a site is designed, programmed, funded, and maintained influences the depth of social connection that can take place there. For example, weekly art classes at your local community center might make it easier to meet new neighbors, or good lighting in your neighborhood parkmight make it easier to hang out there with your friends at night.
Dimensions
Design
1 The space is designed for public access.
2 The space is comfortable, welcoming, and flexible to people's needs.
3 The space reflects community identities, history, and culture.
I can easily get into the library from the outside at a time that is convenient for me.
I can comfortably stay a while thanks to the mix of cozy, quiet spaces and informal gathering spaces.
The artworkon the walls is reflective of my community — so much that my neighbor’s artworkmade it on to the community wall.
1 The space is clean and well-maintained by dedicated staff.
2 Dedicated staff actively respond to community needs through regular monitoring.
3 Visitors feel a sense of responsibility to take care of the place.
This frameworkis a tool for understanding these connections between operations and outcomes. It codifies different approaches to design, program, funding, and maintenance associated with different levels of interaction: from familiarity, to relationships, to community. We use the example of a library to illustrate what each criteria may looklike in practice.
How does your site fare? Refer to the signals on the backpage to understand how to measure the quality of social infrastructure and its impact on outcomes.
The library staff is welcoming and keeps the place clean.
The library staff recommends books and upcoming events based on my interests.
I volunteer my time teaching digital literacy skills in the computer lab.
level of social connection *
0 People cannot connect socially.
1 Familiarity: People are sharing space and coexisting
2 Relationships: People are interacting and getting to know others.
3 Community: People are deepening ties to feel bound to the collective.
Cuts across dimensions of design, program, funding, and maintenance
Program
1 The space offers free and consistent programs and services with broad appeal. I can checkout a book.
2 The space offers group-based programs and services that are responsive to community needs and interests. I can attend a bookclub.
3 The space enables community members to create and sustain their own initiatives. I can propose and host a Spanish language book club for my community.
Funding
1 The space is consistently and sufficiently funded.
2 Budget expands as needed based on demonstrated community needs.
3 Budget priorities are determined by community members.
The library has consistent funding that is not vulnerable to local budget cuts.
Library systems assess each site’s budget needs quarterly, adjusting allocations based on operational needs.
Library systems consult a community advisory committee when setting budget.
Design
Baseline Criteria
The space is NOT designed for public access.
Familiarity
The space is designed for public access.
Presence of defensive architecture 1
Presence of barriers
Severely restricted open hours
Microclimate challenges
Visibility
Legibility
Definition
Refers to the location and physical design of the space, including layout, accessibility, lighting, and furnishing, all of which shape how welcoming, usable, and conducive the environment is to fostering social connection.
Key Assessment Methods
Public Space Assessment
Survey
Site / Operator Interview
Public Life Observation
Focus Group
Photo Journaling
Desktop Research
Design that intentionally restricts or discourages certain behaviors in public spaces, particularly those seen as undesirable
Such as fences or road infrastructure that challenge site access
Open hours challenge easy and convenient site access, especially on weekday evenings and weekends
Lackof protection from the sun, wind, or other elements
Presence of transparent facades and clear sightlines
Legible signage that clearly indicates public access and hours of operation
Ample open hours # of hours open per week, especially evenings & weekends
Ease of access & movement
Physical accessibility
Relationships
The space is comfortable, welcoming, and flexible to people's needs.
Clear entrances and ease of movement for people with disabilities, elders, and families with children, etc.
% of visitors within a 10–15 minute walkor transit ride Community
The space reflects
Social accessibility
Flexible seating
Nature
Mix of scales
Cultural / artistic elements
Feeling of representation
Participatory design
Share of respondents who say they feel safe, welcome, & respected at the site
Ample comfortable and movable seating options that allow for a variety of social and solitary arrangements
Design that enables interaction with nature
Presence of sub-areas of different sizes for flexible use
Visible reflections of local culture and identity in physical design of the space, such as art, furniture, and decor
Share of respondents who feel the site reflects their community and is “for them”
Number or proportion of displays or spaces designed, or curated by patrons (e.g., community art walls, zine racks, themed bookdisplays, DIYrepair cafes, etc.)
Baseline Criteria
The space is NOT freely and consistently programmed.
Familiarity
The space offers free and consistent programs and services with broad appeal.
Barriers to participation
Time-bound or one-off programming
Refers to organized activities, events, or services that educate, engage, and bring people together in a shared space.
The space offers programs and services that are group-based and responsive to community needs and interests.
Inclusivity
Program regularity
Visitorship
Ticketed or pay-to-play programming
Limited availability or frequency of programming
Key Assessment Methods
Public Space Assessment
Survey
Site / Operator Interview
Public Life Observation
Focus Group
Photo Journaling
Desktop Research
Share of free / low-cost programming
Average number of hours of weekly programming
Average hourly visitorship; % of respondents who say they visit the sites at least weekly; % of site visitors who say they spend at least 30 mins at the site when they visit
User impact
The space enables community members to create and sustain their own initiatives.
% of users who report the site helped them achieve a goal (e.g. finding a job, gaining skills, connecting with others)
Participatory programming # or % of programs that are co-developed with community members, organizations, or patrons
Voluntary contributions to stewardship
Presence of opportunities to volunteer and number of volunteers or community members contributing time, materials, or ideas
Baseline Criteria
The space is inconsistently and insufficiently funded.
Familiarity
The space is consistently and sufficiently funded.
Staffing shortage
Restricted hours of operation
Refers to financial resources— primarily from local, state, and federal governments, supplemented by grants and donations—that support operations, staffing, programs, and facilities, ensuring sustained access and services over time.
Key Assessment Methods
Public Space Assessment
Survey
Site / Operator Interview
Public Life Observation
Focus Group
Photo Journaling
Desktop Research
The budget for the space can expand as needed based on demonstrated need.
Adequate resourcing
Program longevity
Continuity
Predictability
members.
Fundraising capacity
Program / service expansion
Community consultation
The site receives an adequate allocation of public funding
% of programs that have been operating for more than one year or budget cycle
The site has not had to scale backprogramming, staff, open hours, etc. in response to resource cuts
Community members are informed about the budget updates and decisions that impact them
Evidence of successful fundraising initiatives
Instance of successful program or service budgets changes based on demonstrated community need
Community members are consulted about budget decisions
Community decision-making
Community members are involved in prioritization and decision-making about the budget
Baseline Criteria
The space is NOT adequately maintained.
Familiarity
The space is clean and wellmaintained by dedicated staff.
Uncleanliness
Physical markers of neglect
Refers to ongoing management and care of facilities and services by dedicated staff to ensure the space remains safe, functional, and welcoming, thereby supporting consistent community access and engagement.
Key Assessment Methods
Public Space Assessment
Survey
Site / Operator Interview
Public Life Observation
Focus Group
Photo Journaling
Desktop Research
Dedicated staff actively respond to community needs through regular monitoring.
Perception of cleanliness
Physical markers of care
Adequate staffing
Share of respondents who feel the space is clean and cared for
Absence of litter and vandalism; perception of public space quality
The site is not understaffed; Staff have adequate resources to fulfill their duties; Greeters / staff are visible and available
Visitors feel a sense of responsibility to take care of the place.
Perception of service quality
Responsive service
Share of respondents who feel that their needs are met at the site
Updates to the programs are services are based on community feedbackand needs assessments
Acts of stewardship
Support for public spending
Community problem- solving
Importance & identification
% of respondents participating in stewardship or advocacy relating to the site
% of respondents who support increased public spending for the site
Number of community-led initiatives (e.g., cleanups, resource-sharing networks, local planning) facilitated by or hosted at the site
% of respondents who say the site is important to them, their community or the city