Identification of Wetting Agents for Water Conservation on Golf Course Fairways and Other Large Turf

Page 1

Identification of Wetting Agents for Water Conservation on Golf Course Fairways and Other Large Turf Areas in California

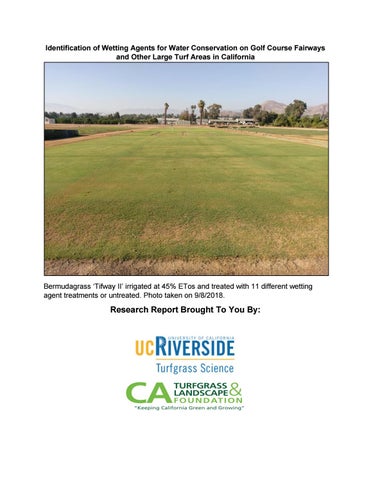
Bermudagrass ‘Tifway II’ irrigated at 45% ETos and treated with 11 different wetting agent treatments or untreated. Photo taken on 9/8/2018.

Research Report Brought To You By:


2

Identification of Wetting Agents for Water Conservation on Golf Course Fairways and Other Large Turf Areas in California Marco Schiavon, Chiara Toniatti, Pawel Orlinski, Alessio Forconi and Jim Baird Department of Botany and Plant Sciences University of California, Riverside 575-932-9644; marcos@ucr.edu The Bottom Line: Eleven wetting agent treatments were tested against an untreated control to determine their ability to reduce water use and enhance quality on ‘Tifway II’ hybrid bermudagrass irrigated at either 65%, 55% or 45% ETos in Riverside, CA under fairway conditions from May thru October 2018. All treatments had a positive effect in comparison to control during the hot summer months. Results show that bermudagrass could sustain sufficient quality throughout the summer when irrigated as low as 55% ETos when a wetting agent was applied. Data on whether there was a ‘best’ treatment were inconclusive, and too close to call, as 8 wetting agent treatments were ranked in the top-performing group in August. Higher soil volumetric water content (VWC) or infiltration rate did not seem to result in better turf quality among wetting agent treatments. The study will be repeated in 2019 to further investigate differences among wetting agent treatments and their effects on soil water distribution uniformity. Justification: Previous research by UCR has identified three effective strategies that result in sustained or improved turf quality under deficit irrigation or water use restrictions: 1) wetting agents; 2) Primo Maxx (trinexapac-ethyl); and 3) sufficient N fertilization. Of these, wetting agents are most important. However, not all wetting agents are effective. Revolution (Aquatrols) was among the top performing wetting agents in California based on our previous research. However, its higher cost hinders widespread use on golf course fairways and other large turf areas. Objectives: Evaluate a select number of viable commercial products for fairways and other large areas of turf to achieve significant water savings on bermudagrass turf subjected to 45, 55, and 65% ETos irrigation replacement. Materials and Methods: The study was conducted at the UC Riverside turfgrass research facility in Riverside, CA on mature hybrid bermudagrass ‘Tifway II’ established in 2017. Environmental data are provided in Table 1. Soil is a Hanford fine sandy loam. The 60’ x 90’ field was divided into twelve 20’ x 20’ plots. From May thru October 2018, the plots were hand watered to maximize distribution uniformity and received 45, 55, or 65% of previous week ETos as determined by an on-site CIMIS station.


3

Treatments were arranged in a split-plot design with twelve wetting agent treatments including an untreated control (plot size 24 ft2) randomized within 4 replicates of ETos replacement plots. Treatments were applied according to company recommendations beginning on May 19, 2018 (Table 2). Revolution served as a “UCR standard.” The study received 5 lb N/M/year and was mowed three times weekly at ½ in. Treatments were applied using a CO2-powered hand boom sprayer equipped with TeeJet 8004VS nozzles and output of 2 gal/M. All treatments were irrigated with ca. 1/3-in of water following application. Every two weeks, plots were evaluated for turf quality on a scale from 1 = worst to 9 = best, Normalized Difference Vegetation Index (NDVI) using a GreenSeeker instrument, volumetric soil water content (VWC) using time domain reflectometry (TDR), and dark green color index (DGCI) as well as percent cover using Digital Image Analysis (DIA). For clarity of presentation, data collected in the same month were averaged and will be presented as monthly data. Leaf samples were collected monthly from May until October to determine proline content in the tissues. Double ring infiltrometer test was also run monthly from May until October to assess differences in speed of water infiltration among treatments. Visual turf quality and % green cover using DIA were also taken to measure the effect of products on bermudagrass dormancy and green-up in late fall and early spring. Data were subjected to analysis of variance (ANOVA). When necessary, multiple comparisons of means were assessed using Fisher’s protected least significant difference test at the 0.05 probability level. Each graphical output is presented and discussed only if treatment effect, or its interaction with ETos replacement or rating date was found to be significant (α=0.05).

Results •

The interaction of treatment and month affected turf quality, cover, NDVI and VWC. Starting in July, all treatments performed better than control with the exception of Forte + CounterAct Retain in September. Differences among treatments were visible only in August when Forte + CounterAct Retain, MPX-5, and Aquimax Turf Lateral showed lower quality compared to the top performing group (Fig. 1). Percent green cover showed results comparable to those of visual quality, with Forte + CounterAct Retain being the only treatment with cover as low as that of control (Fig. 1). Lower NDVIs were collected on untreated plots compared to treated plots only at the beginning and at the end of the study, with no differences detected during the hot summer months. Similar to NDVI, untreated plots had lower VWC in comparison to top performing treatments only in June and October (Fig. 1). Our data suggest that higher VWC may not be the main factor responsible for higher turfgrass quality in plots treated with wetting agents. Nine TDR readings per plot will be taken in 2019 to check for better water distribution uniformity in plots treated with wetting agents.


4

ETos replacement also affected turf quality, cover, NDVI and VWC. Although as expected 65% ETos plots performed the best, our data suggest that 55% ETos could be used to sustain acceptable turf quality through the summer, especially if a wetting agent is applied to bermudagrass (Fig 2). The interaction of ETos and month had an effect in infiltration rate (Fig. 3). During the first three months of the trial infiltration rate did not change regardless of the ETos replacement. However, after August water penetrated faster in plots watered at 45% ETos, followed by 55% ETos and finally 65% ETos. No differences among treatments were detected for proline content or fall color retention (data not shown).

Acknowledgments: Thanks to the California Turfgrass & Landscape Foundation (CTLF) for financial support of this research and to companies for donating products.


5

Table 1. Environmental data collected and reported by the California Irrigation Management System (CIMIS) for Station 44 (Riverside) during the study. Riverside, CA. Weather station located ≈ 100 ft away from study area. Total Month ETos Total Avg Sol Rad Avg Max Air Avg Min Air Avg Air Avg Rel Avg Wind Avg Soil Year (in) Precip (in) (Ly/day) Temp (F) Temp (F) Temp (F) Hum (%) Speed (mph) Temp (F) May-18 5.57 0.27 553 75.4 54.7 63.7 64 4.3 68.6 Jun-18 7.61 0 729 86.3 58.9 71 58 4.4 73.9 Jul-18 8.04 0.04 651 95.8 67.7 80.8 50 4.1 78.8 Aug-18 7.35 0 601 92.8 66.3 78.2 54 3.9 77.8 Sep-18 5.86 0 518 90.1 60.8 73.5 56 3.7 73.8 Oct-18 4.3 0.96 406 80.3 56.7 67.5 55 4 68.2


6

Table 2. Treatment list for the wetting agent trial (2018-2019). Riverside, CA. Treatment

Rate

Company

Untreated control Revolution ACA001 TriCure AD MPX-5 Forte + CounterAct Retain Forte + Brilliance Aquimax Turf Lateral

-6 oz/M 4 oz/M 6 oz/M 3 oz/M 0.37 oz/M + 3 oz/M 0.37 oz/M + 3 oz/M 8 oz/M (initial)/ 4 oz/M (subsequent) 6 oz/M 5 oz/M 8 oz/M (initial)/ 4 oz/M (subsequent) 3 oz/M + 3 oz/M

-Aquatrols Aquatrols Mitchell Products Mitchell Products Simplot Simplot Exacto

4 4 4 4 4 4 4

Numerator Tech Precision Laboratories Precision Laboratories

4 4 4

Harrell’s

4

Passage Vivax Cascade Plus Hydro90+Symphony

Frequency (weeks)


7

Figure 1. Turf quality, cover, NDVI and VWC of plots treated with wetting agents or untreated from May until October 2018. Riverside, CA. Aquimax Turf Lateral 8oz/M first app+4oz/M subsequently Cascade Plus 8oz/M first app+4oz/M subsequently Forte 0.37 oz/M+Brilliance 3oz/M

Quality 7.5

Forte 0.37 oz/M+CounterAct Retain 3oz/M Hydro 90 2.5 oz/M + Symphony 2.5 oz/M MPX-5 3 oz/M

7 6.5

Passage 6 oz/M

6

Revolution 6 oz/M 5.5

Tricure 6 oz/M Untreated control

5

Vivax 5 oz/M 4.5 May

June

July

August

September

October

Cover (%) 95

Zipline 4 oz/M Aquimax Turf Lateral 8oz/M first app+4oz/M subsequently Cascade Plus 8oz/M first app+4oz/M subsequently Forte 0.37 oz/M+Brilliance 3oz/M

85

Forte 0.37 oz/M+CounterAct Retain 3oz/M Hydro 90 2.5 oz/M + Symphony 2.5 oz/M MPX-5 3 oz/M

75

Passage 6 oz/M Revolution 6 oz/M

65 Tricure 6 oz/M Untreated control

55

Vivax 5 oz/M 45

Zipline 4 oz/M May

June

July

August

September October


8

NDVI 0.75

Aquimax Turf Lateral 8oz/M first app+4oz/M subsequently Cascade Plus 8oz/M first app+4oz/M subsequently Forte 0.37 oz/M+Brilliance 3oz/M Forte 0.37 oz/M+CounterAct Retain 3oz/M Hydro 90 2.5 oz/M + Symphony 2.5 oz/M MPX-5 3 oz/M

0.7

0.65

Passage 6 oz/M Revolution 6 oz/M

0.6

Tricure 6 oz/M Untreated control

0.55

Vivax 5 oz/M Zipline 4 oz/M

0.5 May

June

July

August

September October

VWC (%) 40 35

Aquimax Turf Lateral 8oz/M first app+4oz/M subsequently Cascade Plus 8oz/M first app+4oz/M subsequently Forte 0.37 oz/M+Brilliance 3oz/M Forte 0.37 oz/M+CounterAct Retain 3oz/M Hydro 90 2.5 oz/M + Symphony 2.5 oz/M MPX-5 3 oz/M

30 25

Passage 6 oz/M 20

Revolution 6 oz/M Tricure 6 oz/M

15

Untreated control 10 Vivax 5 oz/M 5

Zipline 4 oz/M May

June

July

August

September October


9

Figure 2. Turf quality, cover, NDVI and VWC of plots irrigated at 45%, 55% or 65% ETos from May until October 2018. Riverside, CA.

Quality 6.6 6.4 6.2 6 5.8 5.6 5.4 5.2 45% Etos

55% Etos

65% Etos

Cover (%) 90 85 80

75 70 45% ETos

55% Etos

65% Etos


10

NDVI 0.7 0.65 0.6 0.55 0.5 45% ETos

55% Etos

65% Etos

VWC (%) 30 25 20 15 10 5 0 45% ETos

55% Etos

65% Etos


11

Figure 3. Infiltration rate of plots irrigated at 45%, 55% or 65% ETos from May until October 2018. Riverside, CA.

Infiltration rate (mm/hr) 200 180 160 140 120

45% ETos

100

55% ETos

80

65% ETos

60 40

20 0 May

June

July

August

September

October


Issuu converts static files into: digital portfolios, online yearbooks, online catalogs, digital photo albums and more. Sign up and create your flipbook.