ELECTIONS PROFESSIONNELLES DANS LA FONCTION PUBLIQUE
Marylise LEBRANCHU présente les résultats pour les trois fonctions publiques Mardi 9 décembre 2014
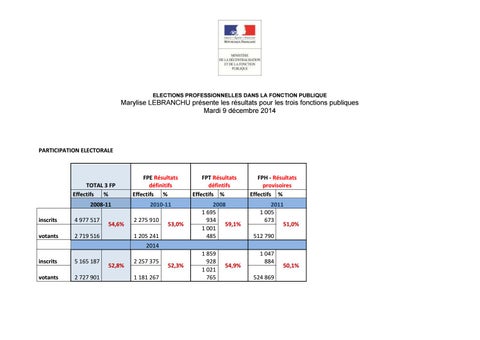
PARTICIPATION ELECTORALE
TOTAL 3 FP Effectifs % 2008-11 inscrits
4 977 517
votants
2 719 516
54,6%
FPE Résultats définitifs Effectifs % 2010-11 2 275 910
53,0%
1 205 241
FPT Résultats défintifs Effectifs % 2008 1 695 934 59,1% 1 001 485
FPH - Résultats provisoires Effectifs % 2011 1 005 673 51,0% 512 790
2014 inscrits
5 165 187
votants
2 727 901
52,8%
2 257 375 1 181 267
52,3%
1 859 928 1 021 765
54,9%
1 047 884 524 869
50,1%