Q1 26 market overview
Average Asking Rate (NNN) $2.08 PSF

Quarters)
(March 2026) (Jan 2026)
*Typically, state and local unemployment data lags federal data by one month. However, the 2025 federal government shutdown (October/November 12, 2025) resulted in a disruption of normally scheduled data releases. This reflects the most current data available as of the time of this report.
POSITIVE NUMBERS TO START 2026 DESPITE GROWING ECONOMIC UNCERTAINTY
After finishing the final half of 2025 with two consecutive quarters of modestly declining occupancy levels, the Sacramento region returned to positive territory in Q1 2026, with 92,000 square feet (SF) of positive net absorption. This drove overall vacancy in the region downward from last quarter’s reading of 16.2% to the current rate of 16.0%.
All told, eight of the region’s 12 distinct submarkets recorded occupancy gains and declining vacancy rates in Q1. Despite this good news for landlords, this was not enough to prevent a modest annual decrease in the region’s average asking rent, following a lackluster 2025 (more on that in a moment). Not surprisingly, the Roseville/Rocklin submarket led the way in terms of occupancy gains in Q1 with 94,000 SF of positive net absorption driving vacancy there down from 12.6% to 11.6%. Yolo County followed, with 54,000 SF of occupancy growth sending vacancy from 11.6% to 10.1%. This was followed by the Arden/Howe/Watt (+45,000 SF of gains), Elk Grove/South Sacramento (+33,000 SF) and Downtown (+30,000 SF).
On the other end of the equation, the market experienced some major space givebacks in Q1 with the Highway 50 market taking the biggest hits. Maximus vacated 11050 Olson Drive, while Gurnick Academy moved out of 8810 Cal Center Drive. All told, the Highway 50 market recorded 122,000 SF of negative net absorption, sending its vacancy rate from 23.8% to 24.8%. This trade area was once the preferred location for large block users, particularly for insurance companies and call centers, but suburban lowrise, large floorplate buildings have struggled nationally

Sacramento Office Market
All Classes of Product Q1 2026
Sacramento Office Market: Vacancy/Average Asking Rents
Source:GallelliRealEstate;CostarGroup
in the post-pandemic era as demand has increasingly been driven by smaller users. Not surprisingly, Highway 50 now offers the most affordable lease rates in the region, with Class A space being marketed at an average rate of $1.93 per square foot (PSF) on a monthly full service basis—or more than 20% below the market norm.
The Folsom submarket also posted occupancy declines (to the tune of -61,000 SF), thanks largely to Verizon vacating a building they occupied at 295 Parkshore Drive. Despite this, Folsom’s current vacancy rate of 11.5% keeps it among the three local trade areas with the lowest vacancy rates. The others include Elk Grove/South Sacramento (5.4%) and the Auburn/Lincoln submarket (8.2%), neither of which are home to a significant Class A inventory.
OVERALL ASKING RENTS DECREASE SLIGHTLY DESPITE IMPROVED NET ABSORPTION & DEAL ACTIVITY
The current average asking rate for office space is $2.08 per square foot (PSF) on a monthly full service basis. That metric is down -1.4% from where it stood a year ago, driven entirely by a decrease in the asking rate for Class A space.

Sacramento Office Market All Classes of Product Q1 2026
Sacramento Office Market: Supply/Demand/Vacancy

The average rent for Class A office space now stands at $2.48 PSF, down from $2.54 at the close of 2025. The Downtown submarket, home to the region’s largest cluster of Class A properties with just under 5.7 million square feet (MSF) of space, held its own with flat rents over the past year. But declines in just a couple of suburban submarkets (Folsom, Natomas, and Yolo County) were enough to counteract gains in the Arden/Howe/Watt, Midtown/East Sacramento and Roseville/Rocklin trade areas. Thanks to the impact of the recently delivered Aggie Square project in the Midtown/ East Sacramento submarket, that trade area is now the market leader with a current average Class A asking rate of $3.60 PSF. Exclude that project and Downtown still commands the highest rents overall with a current Class A average of $3.26 PSF, followed by Yolo County ($2.82 PSF), El Dorado Hills ($2.60 PSF), Roseville/Rocklin ($2.35 PSF), Folsom ($2.34 PSF) and Natomas ($2.33 PSF).
Class B office rents have held their own over the past year; increasing a modest 0.5% to the current rate of $1.96 across the region. Class C rents recorded the opposite trend over the past year, decreasing -0.6% to the current rate of $1.63 PSF.
DEAL ACTIVITY PICKS UP IN Q1
Leasing activity picked up substantially over Q4’s tepid performance; we tracked just over 571,000 SF of deal activity (gross absorption) last quarter. That number jumped significantly to 879,000 SF over the first three months of 2026. The largest deal of the quarter came from the public sector with the Sacramento County District Attorney’s Office inking a long-term deal at 980 9th Street in Downtown Sacramento for 121,000 SF that will see them relocating and expanding from three separate spaces across the region. Another major Downtown deal was Sutter Health’s lease of 120,000 SF of space Downtown at 660 J Street (SixSixty at DoCo). However, deal activity in the region remains overwhelmingly focused on smaller users.
Last year deals of 5,000 SF or less accounted for nearly 60% of all leasing volume and that trend appears to be playing out again through the first three months of 2026. Some of this is due to the State of California’s recent push towards occupying owned buildings at their new Downtown campus over the past couple of years. Public sector leasing has not disappeared completely, but historically government users (Federal, State and Local) accounted for nearly 30% of office occupancy in California’s capitol city and were a leading source of large space requirements (followed by insurance companies and healthcare systems, which remain active). Meanwhile, deal activity remains strong from smaller, professional firms as well as medical office users (in addition to larger healthcare systems).
Sacramento Office Market
All Product Types Q1 2026
Sacramento Office Market: Median Price PSF/Average Cap Rate

Source:GallelliRealEstate;CostarGroup
In-office worker attendance continues to improve. In its monthly Nationwide Office Building Index for February 2026, cellular tracking firm Placer AI reported that in-office attendance was at its highest levels since before the pandemic. That said, their data suggests that office visits remain 31.9% below 2019 pre-COVID levels.
But amid a tightening job market, the list of employers requiring workers to show up in person—with an increasing number of them now mandating five days a week, as opposed to hybrid work—continues to grow. Unfortunately, slower employment growth may be mitigating some of the positive impact of that trend.
According to the Bureau of Labor Statistics (BLS), there were roughly 1.1 million nonfarm workers across the Sacramento region as of January 2026 (the latest local data available). The categories of employment that account for the most (though certainly not all) private sector office-using employers include Financial Activities, Professional and Business Services and Information. The Financial Activities sector accounted for 45,300 local workers, the same amount as one year ago. The Professional and Business Services sector accounted for 133,300 workers, up just 300 jobs over the past year. Meanwhile, the Information sector had 8,400 actively employed workers, down 600 jobs over the last 12 months. In other words, officeusing employment in the region has been flat to slightly negative over the past year.
On the plus side, the development pipeline has not been much of a factor in this cycle. There are currently just two office projects under construction in the region and they are both build-to-suit projects that will be completely occupied on completion. In Folsom, Dignity Health is building a 92,000 SF build-to-suit, while Buzz Oates is building a 38,000 SF build-to-suit for California American Water (one of the top deals of the past year) at
700 Riverpoint Drive at the Riverpoint North Corporate Campus in West Sacramento. Both buildings are scheduled for completion in 2027. A speculative third building at the Aggie Square project in the Midtown/East Sacramento market has been pushed back for now as its owners look to shore up occupancy in the first two buildings of that project.
LOOKING AHEAD
While Q1’s strong uptick in deal activity and return to positive net absorption comes as good news for local landlords, the Sacramento office market continues to face some challenges. Vacancy over the past year has seemingly stabilized near the current 16.0% rate (it has hovered within 20 basis points either way for the last four quarters). While that may be an underwhelming number, it is an improvement following five consecutive years of steadily climbing vacancy.
We continue to work through an overhang of space that came back to market in the aftermath of the pandemic and shifting office work trends. Data indicates that the reversion towards more traditional in-office work patterns continues to occur, though clearly hybrid work is a substantial and permanent part of the landscape now. The state of California’s return-towork mandate (requiring in-office work at least four days a week), which had been delayed by labor unions, is set to finally take place on July 1,2026. This will certainly give the Downtown submarket a shot in the arm, as well as a boost to retail, restaurant and service businesses that were dependent upon the daytime office population.
Another positive is that developers have remained restrained, with speculative development (outside of medical office—where demand levels permit) relatively rare. All these factors suggest that the market has finally
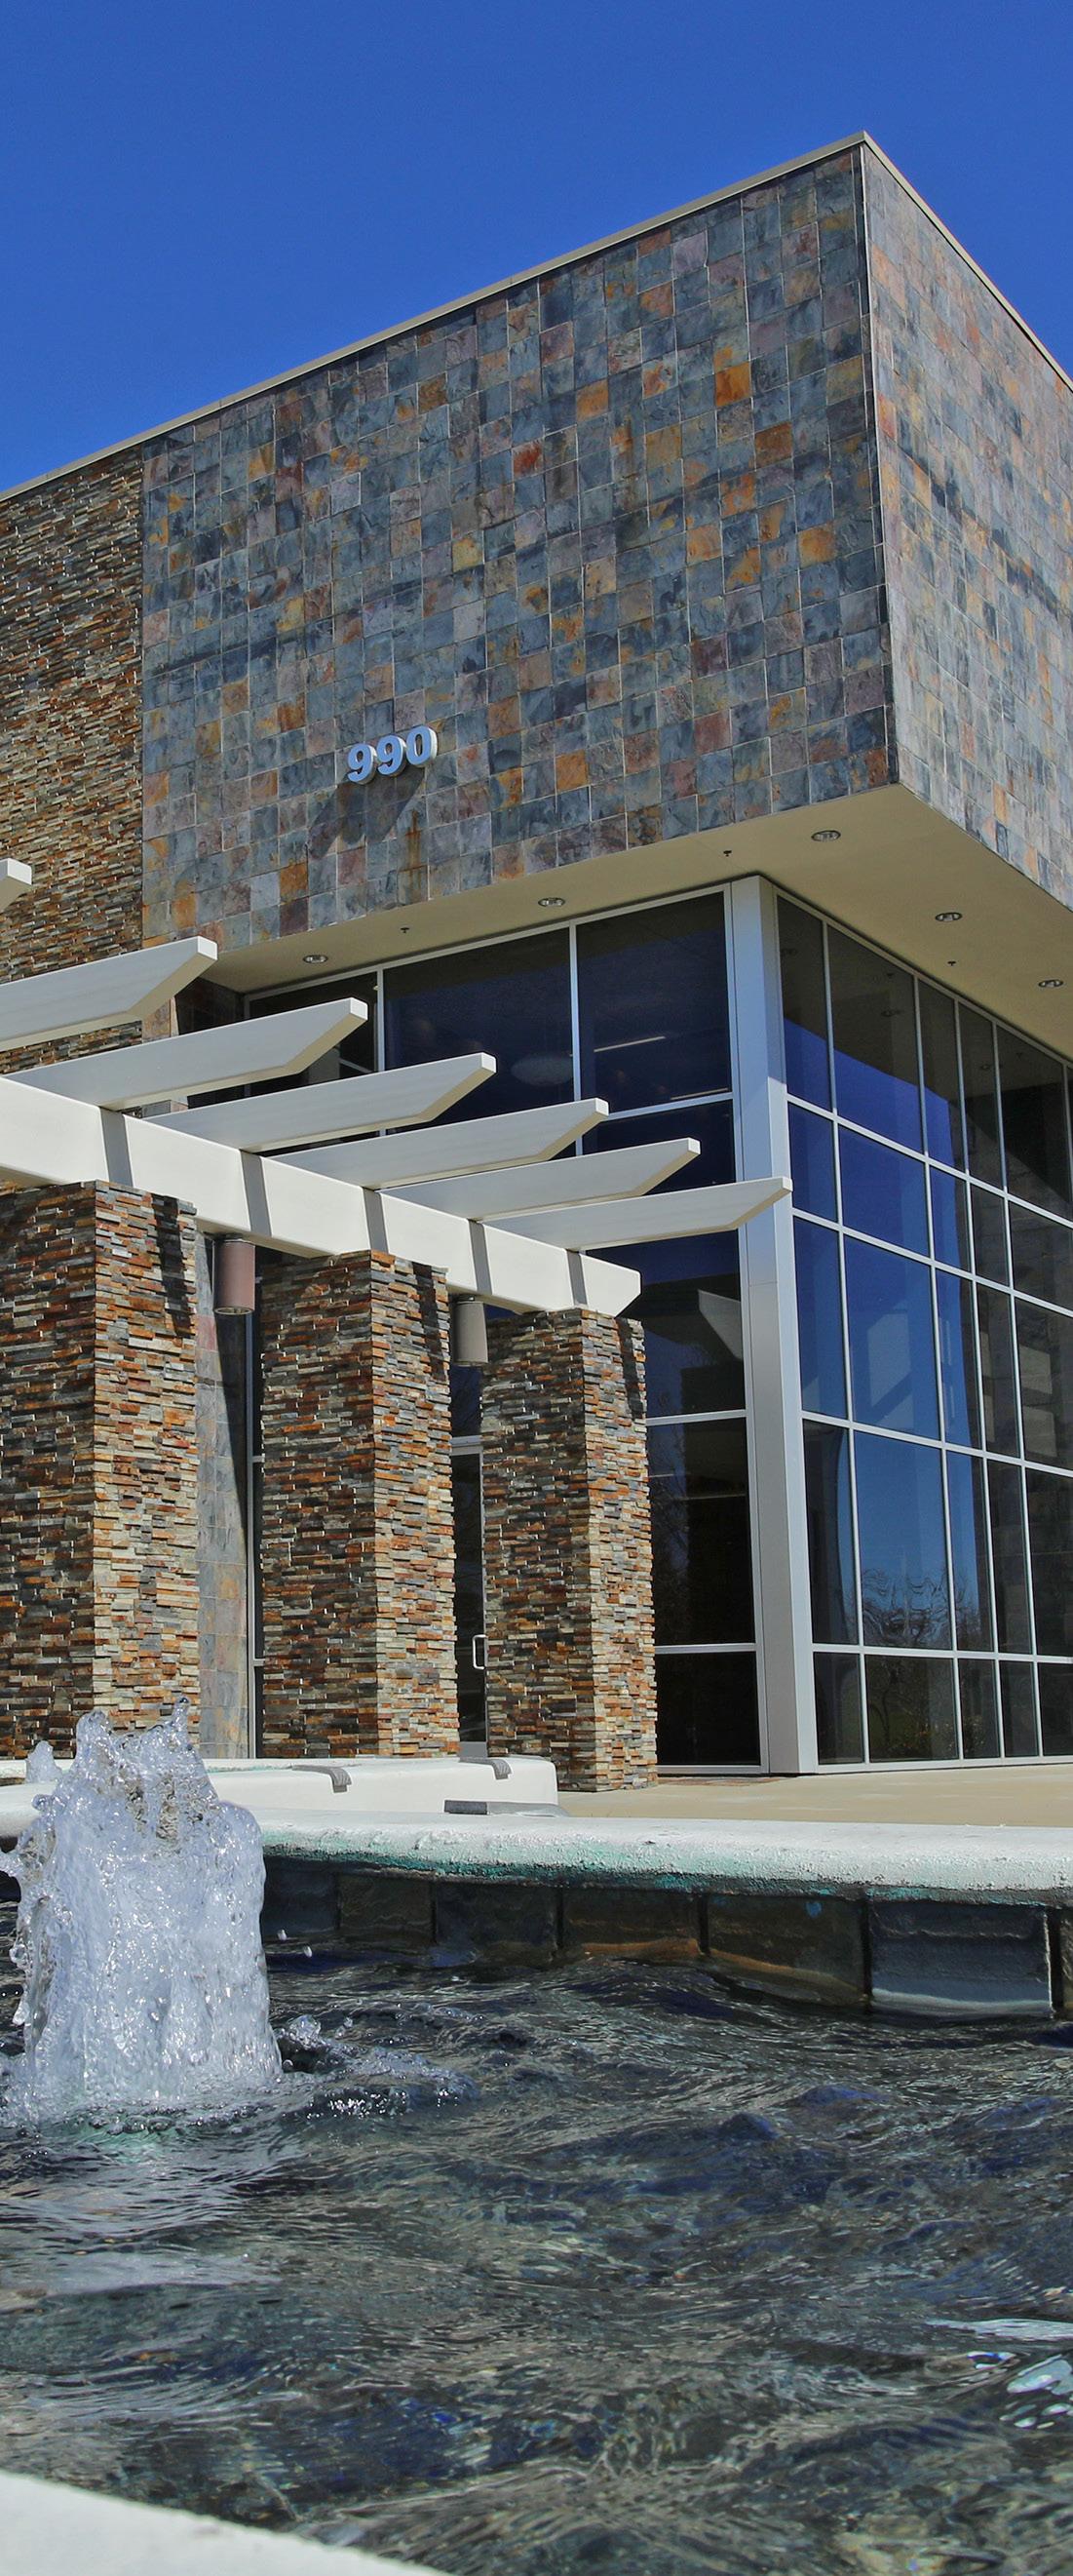
For Sale: 990 Reserve Drive, Roseville, CA 95678 stabilized from the structural issues it has been struggling with since the pandemic. But this stability may prove fragile. It remains to be seen how much the growing adoption of artificial intelligence (AI) tools will disrupt office-using employment or how that may play out locally (so far, most job losses attributed to AI have been in tech-heavy markets).
Meanwhile, the economic outlook has only gotten cloudier over the past three months. Though unemployment remains near historic lows, job growth has flatlined over the past year.
US stock indices remain at or near historic highs, but those have been driven by AI investment as opposed to more broad-based economic growth. This has sparked growing concerns of a potential AI investment bubble akin to what we saw with internet businesses in the tech wreck of 2000 with good reason. The Shiller PE Ratio, or CAPE ratio (Cyclically Adjusted Price-to-Earnings) is a valuation measure that divides a company’s or market index’s current price by the average of its previous ten years of earnings, adjusted for inflation. Created by Nobel Prize winning economist Robert Shiller, it has emerged over the last 30 years as premier measurement for evaluating possible market bubbles. The highest level ever recorded by this index was 44.19 in December 1999. The next month is when the 2000 tech crash occurred. As of April 2026, this index stood at 40.36, the highest level ever recorded outside of the dot.com bubble run-up.
And, as this report went to press, the ongoing war in Iran and the blockade of the Strait of Hormuz has created a global oil shock that has sent energy prices skyward. The average national price of gasoline in the United States is now above the $4.00 mark while diesel fuel, the lifeblood of the nation’s supply chain, has climbed by more than 50% with the national price topping $5.50 per gallon. Ultimately, higher fuel prices function as a regressive tax with those higher costs not stopping at the pump. While consumers might be able to pull back on non-essential trips, carpool or work remotely in the face of high gas prices, higher diesel prices cascade into higher freight rates, food prices, manufacturing outputs, and overall inflation (which climbed to 3.3% in March and will get worse before it gets better).
No one knows how the crisis will play out, but the longer pricing remains elevated, the greater the economic damage will be. But even assuming a best-case scenario of an immediate reopening of the Strait, most energy analysts say it would be at least four months before we could see a return to pre-war levels of oil production and a full recovery of the supply chain. So, even in the most optimistic outlook, significantly elevated gas prices through Summer 2026 are likely. A longer-term disruption will substantially increase the chances of an economic downturn ahead.
At the conclusion of our last report, we said that the only thing certain with any economic forecast for the year ahead is uncertainty Unfortunately, the last three months have only made things more uncertain, not less. Against this backdrop we anticipate a continued subdued office leasing environment in 2026.
OFFICE MARKET STATISTICS: Criteria based on: 10,000 SF and above, does not include owner occupied, Existing, Under Construction, Proposed, Final Planning
Yolo County

GALLELLI BROKER TEAMS