*Typically, state, and local unemployment data lags federal data by one month. However, the 2025 federal government shutdown (October/November 12, 2025) resulted in a disruption of normally scheduled data releases. This reflects the most current data available as of the time of this report.
VACANCY HITS
10-YEAR HIGH
As of the close of Q1 2026, industrial vacancy in the Sacramento region stood at 8.1%, the highest rate that the market has recorded since Q3 2016 when it last stood above the 8.0% mark (8.5%). This was the fourth consecutive quarter of climbing vacancy rates, despite the fact development levels have fallen significantly since 2024.
We track 179.3 million square feet (MSF) of space across the Sacramento region that we break down into two basic classifications; flex product accounts for 10.8% of the local inventory with 19.4 MSF of product. Warehouse properties (and their subtypes) account for the rest; just under 159.892 MSF of space.
The current vacancy rate for warehouse product in the region is 7.9%, up from last quarter’s reading of 7.5% and the 6.6% rate of exactly one year ago. This metric has increased in nine of the past ten quarters.
Flex vacancy across the Sacramento valley is now 9.2%, up from 8.7% three months ago and 7.9% one year ago. Flex vacancy has increased for seven consecutive quarters.
SPACE GIVEBACKS OUTPACE
MOVE-INS
The market recorded -599,000 square feet (SF) of negative net absorption over the first three months
of 2026. Nine of the region’s 16 distinct submarkets posted occupancy declines in Q1. West Sacramento recorded -580,000 SF of negative net absorption as its vacancy rate climbed from 9.8% to 12.2%.
Among the other local submarkets to record more than -50,000 SF of occupancy declines were the Power Inn trade area where space givebacks resulted in -139,000 SF of negative net absorption driving vacancy up from 4.7% to 5.3%. This was followed by -85,000 SF of negative net absorption in the Davis/Woodland market (it drove vacancy up to 6.7% from last quarter’s reading of 6.2%). Meanwhile, the Mather market posted -55,000 SF of occupancy growth as vacancy in this market moved from 8.0% to 9.0%.
The McClellan submarket led all others in terms of occupancy gains in Q1. New tenants took down nearly 190,000 SF of previously vacant space driving vacancy down from 7.0% to 5.9%. The Northeast submarket also recorded positive net absorption to the tune of 68,000 SF as vacancy fell from 6.5% to 5.4%. Lastly, the Sunrise market recorded 53,000 SF of gains driving vacancy down to just 4.8% from the 5.2% rate of just a few months ago.
For most of the region’s industrial submarkets, the past three months have been most notable for tepid deal activity. Though nine of 16 markets recorded occupancy declines, only three saw movement (in either direction) of more than 100,000 SF.
Sacramento Industrial Market All Classes of Product Q1 2026
While vacancy has been on the rise for four consecutive quarters, it has been on an upswing for most of the past five years since hitting a historic low of just 3.6% in Q1 2022. Since then, it has increased in 14 of 16 quarters, but this was primarily a reflection of aggressive new development levels (supply) outpacing net absorption (demand) initially. That wave of new development, fueled by demand for eCommerce fulfillment and large distribution centers, would prove to be the largest the market has recorded in at least 40 years, adding more than 18.1 million square feet (MSF) of product to the local inventory, but even through the end of 2024 vacancy levels were healthy.
Industrial vacancy levels in the 5% - 7% range are generally considered healthy by real estate economists. At these rates it leaves enough available space in the market to support immediate economic growth, while keeping options tight enough that it allows for sustainable rental rate growth. Vacancy below the 4% threshold may be great news for landlords looking to push their rents, but when availability is that tight it can force users to look for growth opportunities elsewhere or pay rents that prove too high to sustain their businesses. When vacancy starts to creep above the 7% rate, competition creates headwinds for rental rate growth.
The challenge for the Sacramento market is that tenant growth requirements began to diminish in both size and number heading deeper into 2025. Deal activity remained strong in 2025, averaging more than 2.1 MSF per quarter, but this was increasingly driven by renewals, relocations, and space consolidations.
By the end of 2025, though development levels were coming back to earth, a combination of speculative deliveries with an uptick in space givebacks drove vacancy up to 7.7% by the end of the year.
Though deliveries have been minimal so far in 2026, space givebacks have intensified and deal flow has slowed significantly with the market recording just 449,000 SF of total activity (gross absorption) through the first three months of the year.
DEVELOPMENT ROUNDUP
There was just one new building delivered in Q1: Schnitzer Properties’ 110,000 square foot (SF) warehouse building at 2251 Freedom Way at the Blue Oaks Commerce Center in the Roseville/Rocklin submarket.
The region’s development pipeline has shrunk considerably over the past 18 months. We are currently tracking just five projects under construction across the region, accounting for 944,000 SF of space that will be added to the region’s inventory over the next 18 months.
The largest of these projects is Buzz Oates’ 663,000 SF build-to-suit for Costco at the Metro Air Park in the Natomas/Northgate submarket that is slated for delivery in Q4 2027. Oates is also building a 181,000 SF speculative building at 10050 Waterman Road in Elk Grove that will come online in August 2026 and is currently fully available. Also scheduled for an August delivery is Swinerton’s 55,000 SF speculative project in Davis (also currently being marketed for lease).
Scheduled for Q2 2026 delivery is 24,000 SF project at 3730 Happy Lane in the Mather submarket (of which 20,000 SF remains available) and a 20,000 SF building in Davis.
A significantly reduced development pipeline should help give the market time to absorb excess vacancy in the months ahead. What remains to be seen is whether the economy and tenant demand will cooperate in this equation. The good news for local landlords is that so far rents have held, but rental rate growth is going to become increasingly unlikely should the current trend of rising availability accelerate.
RENTS HOLD OWN DESPITE WEAK QUARTER
The current average asking rent for industrial space across the Sacramento region is $0.82 per square foot (PSF), on a monthly triple net basis. This metric is up 1.2% year-over-year. The average asking rate for warehouse properties in the region remained flat over the past 12 months at $0.77 PSF. Flex product is now average $1.11 PSF, up 4.7% over the past year. Since the explosive rental rate growth of a few years ago, rents have stabilized at roughly the current rate over the past three years.
This metric has essentially hit a wall. Slowing levels of demand certainly play into this, but there is another factor at play here worth mentioning. Most industrial (and retail) deals are transacted regionally on a triple net basis, meaning that in addition to rent tenants are responsible for the cost of property taxes, insurance, and maintenance. While the average asking rent for industrial space has doubled since 2015, net expenses have effectively done so over roughly the past five years. Ultimately, this puts a limit on how much rental rate growth a property can command.
This challenge is likely to get worse before it gets better. While both property taxes and insurance have been on the upswing, the major culprit has been utilities. Or, more specifically, power. Rising demand for power driven by AI data centers are impacting electrical rates nationally. According to the Federal Reserve Bank, the average price of electricity per kilowatt hour in the U.S. climbed from $0.17 to $0.19 through the first six months of 2025 alone. The U.S. Energy Information Administration forecasts utility prices to increase between 12% and 18% in 2026.
LOOKING AHEAD
The economic outlook remains cloudy. As this report went to press, the ongoing war in Iran and the blockade of the Strait of Hormuz has created a global oil shock that has sent energy prices skyward. The average national price of gasoline in the United States is now above the $4.00 mark while diesel fuel, the lifeblood of the nation’s supply chain, has climbed by more than 50% with the national price topping $5.50 per gallon. Ultimately, higher fuel prices function as a regressive tax with those higher costs not stopping at the pump. While consumers might be able to pull back on non-essential trips, carpool or work remotely in the face of high gas prices, higher diesel prices cascade into higher freight rates, food prices, manufacturing outputs, and overall inflation (which climbed to 3.3% in March and will get worse before it gets better).
This could significantly impact logistics, transport and trucking firms though they will likely just pass their expenses on to the customers they serve. Ultimately this will prove to be about the length of disruption. The 2022 inflation spike saw a similar trend. Gas prices had already been climbing due to pandemic supply chain disruptions when the Russian invasion of Ukraine (and resulting sanctions) sent gas prices to their all-time high in the U.S. (the average national price hit $5.02 per gallon by June 2022). Within six months those prices came back to earth and had no impact we could see on local real estate demand. Indeed, 2022 was a year in which space users absorbed over 3.0 MSF of industrial space in Sacramento.
The real risk is likely to be how the crisis will play out in the macro-economy with the risk of deep economic damage escalating depending on the length of the oil disruption. That said, even assuming a best-case scenario of an immediate reopening of the Strait, most energy analysts say it would be at least four months before we could see a return to pre-war levels of oil production and a full recovery of the supply chain. Which means that even in the most optimistic outlook, significantly elevated gas prices through Summer 2026 are likely.
An expansion of the war, especially if large amounts of critical energy infrastructure across the Gulf were to be destroyed or damaged, or if the conflict were to drag on for months, would substantially increase the chances of global recession by the end of the year.
At the conclusion of our last report, we said that the only thing certain with any economic forecast for the year ahead is uncertainty. Unfortunately, the last three months have only made things more uncertain, not less. Against this backdrop we anticipate a continued subdued industrial leasing environment in 2026.
Sacramento Industrial Market
Select Sacramento Region Industrial Leases
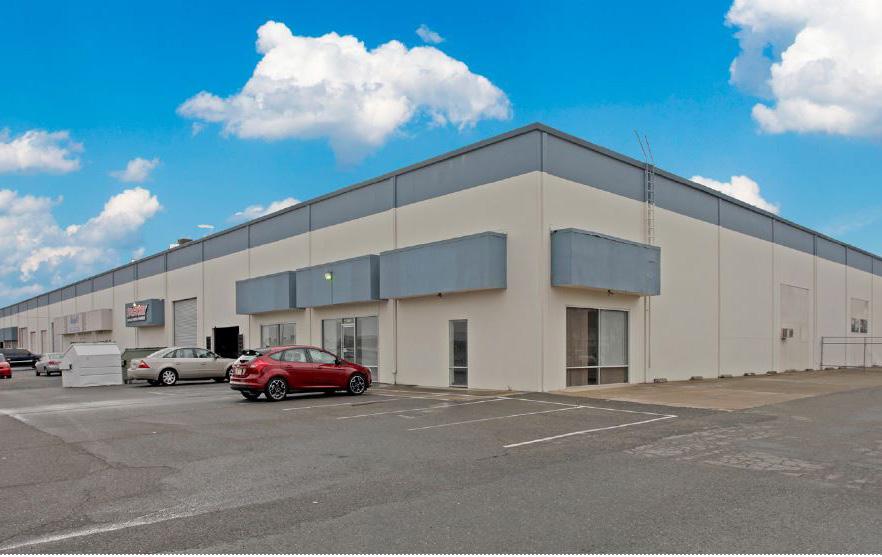
3150 Orange Grove Avenue, North Highlands, CA 95660
about gallelli real estate
Gallelli Real Estate is a private firm that specializes in commercial real estate services and property management. We believe that as a boutique firm whose understanding of the business runs as deep as our core values, our advantage is large. We take pride in our unique approach to offer more individual solutions that address the ever changing needs of our clients and the industry. After all, our success is measured by the success of our clients and the strength and longevity of our relationships.