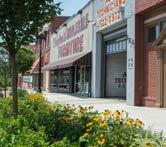
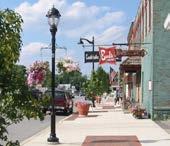
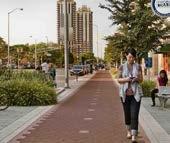
5335 8th Street, Second Floor Zephyrhills, FL 33542
Gail K. Hamilton
CRA Director
ghamilton@ci.zephyrhills.fl.us
T 813-780-0202
Prepared by:
GAI Consultants, Inc.
618 E. South Street, Suite 700 Orlando, Florida 32801
T 407.423.8398
Claudia Ray
Senior Project Planner
c.ray@gaiconsultants.com
T 321-445-8040
Tom Kohler
Senior Director of Urban Analytics
t.kohler@gaiconsultants.com
T 321-319-3133
Acknowledgment
The preparation of this 2026 Zephyrhills Community Redevelopment Area (CRA) Master Plan update reflects the dedication and collaborative efforts of many individuals committed to the continued revitalization and prosperity of the Zephyrhills community.
We extend our sincere appreciation to the Zephyrhills CRA Board for their leadership and vision:
• Steve F. Spina, PhD (CRA Board Chairperson)
• Jodi Wilkeson (CRA Board Vice Chairperson)
• Kenneth M. Burgess
• Charlie Proctor
• Lance Smith
• Mayor Melonie Bahr Monson
Special thanks for their guidance and coordination throughout the CRA Master Plan update process goes to:
• William C. Poe Jr., City Manager
• Gail Hamilton, Community Redevelopment Agency Director.
We also acknowledge the contributions of key City leadership and staff whose expertise and support were instrumental in shaping this Master Plan:
• Todd Vande Berg, Director of Planning
• Shane LeBlanc, Public Works Director
Their collective efforts have helped ensure this Master Plan reflects the community’s aspirations and provides a clear, actionable path forward for the Zephyrhills CRA through 2045.
Summary
The 2026 Zephyrhills Community Redevelopment Plan update (CRA Master Plan) builds upon the progress made by the Zephyrhills Community Redevelopment Agency (Agency) and the foundation established in the 2016 Community Redevelopment Area (CRA) Plan. This updated Master Plan introduces a new set of capital projects and programs designed to address remaining conditions of slum and blight within the CRA through the 2045 planning horizon.
The Zephyrhills CRA Master Plan is structured around eight key Focus Areas that guide redevelopment efforts:
• Economic Development
• Parks and Open Spaces
• Placemaking
• Housing and Neighborhoods
• Historic Preservation
• Transportation
• Stormwater Infrastructure
• Resilience and Environmental Sustainability
In support of these initiatives, the Master Plan estimates the expanded CRA will generate between $1.61 million and $4.05 million in Tax Increment Revenue from 2026 through 2045. These funds may be allocated toward projects, development planning and preparation, policy and plan development, incentive programs, and other strategic initiatives.
Formal adoption of this Plan is required under Florida Statutes Chapter 163, Part III, and follows the statutory process for CRA Plan updates. This 2026 Plan reflects the most current data and is focused on achieving targeted outcomes in capital investment and economic development—cornerstones of the City’s long-term revitalization strategy.
To ensure alignment with the broader mission and responsibilities of the Zephyrhills Community Redevelopment Agency—and to produce a legally sufficient and implementable Master Plan—this 2026 CRA Master Plan has been prepared in accordance with the requirements of the Community Redevelopment Act, as outlined in Chapter 163, Florida Statutes. The Act provides both the framework for adoption and the required contents of a compliant Master Plan. This update reflects the specific provisions of the statute and outlines the formal process through which the Master Plan will be adopted.
Introduction
This chapter establishes the foundation for the Zephyrhills CRA Master Plan by outlining its purpose, legal framework, and organizational structure. It begins with an overview of the plan’s intent and the role of the Community Redevelopment Agency (Agency) in guiding revitalization efforts. Key elements include the legal description and boundaries of the CRA the redevelopment powers granted under Florida law, and the composition and governance of the CRA Board, plan’s duration, procedures for modification, and the financial mechanisms supporting redevelopment. A brief overview of the Community Redevelopment Act provides context for the statutory authority under which the CRA operates.
Following this, the chapter identifies the area’s key assets, challenges, and opportunities that shape the redevelopment strategy. It concludes with a summary of the plan’s organization, offering a roadmap for how the document is structured and how each section contributes to the overall vision for community revitalization.
IN THIS CHAPTER
1.1 Plan Purpose and Overview................................................. 8
+ CRA and Plan Purpose
+ Defining the Area
+ CRA Legal Description
+ Redevelopment Powers
+ Governing Body
+ CRA Board Composition
+ Plan Duration
+ Plan Modification
+ Trust Fund
+ TIF Background and Revenue Projections
1.2 Assets, Challenges, Opportunities, and Accomplishments..... 12
1.3 Plan Organization.............................................................. 18
1.1 CRA Master Plan Purpose and Overview
Agency and Master Plan Purpose
The Zephyrhills Community Redevelopment Agency (Agency) was established with the aim of revitalizing and rejuvenating Zephyrhills through collaborative publicprivate partnerships. Operating as a dependent special district, the Agency allocates any future increases in property values to a Trust Fund dedicated to supporting economic development and redevelopment initiatives within the designated area.
The CRA will strive to achieve the following:
• Promote Responsible Development and Redevelopment: Foster economically vibrant downtowns, sustainable neighborhoods, and healthy communities by ensuring access to quality housing, employment, education, recreation, and public services—while prioritizing safety and social stability.
• Advance Economic Development: Develop and implement strategies to attract businesses, industries, and services that generate jobs and meet community needs, positioning the CRA to thrive in evolving economic conditions.
• Enhance Quality of Life: Invest in programs, services, and amenities—especially within parks and public spaces—that create a strong sense of place and make the community a desirable destination to live, work, and play.
• Support Sound Community Development: I dentify and remove barriers to growth, modernize outdated processes, and streamline development efforts to encourage high-quality, efficient progress.
• Leverage Resources Effectively: Maximize the impact of financial, human, and technological resources through strategic allocation, collaboration, and innovation to support successful implementation.
• Strengthen Public-Private Collaboration : Build strong partnerships with local governments, organizations, and private stakeholders to align goals, share knowledge, and foster inclusive, sustainable development.
• Ensure Transparent Communication: Maintain open, consistent communication with the community and stakeholders to build trust, encourage participation, and highlight the positive impacts of redevelopment initiatives.
• Preserve Historic Character and Identity: Promote the protection, restoration, and adaptive reuse of historic buildings and sites to celebrate Zephyrhills’ unique heritage, strengthen community pride, and enhance cultural tourism opportunities.
Defining the Area
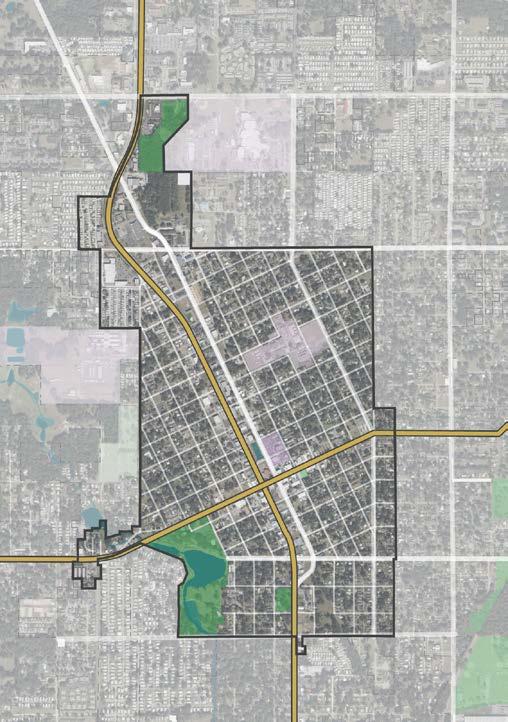
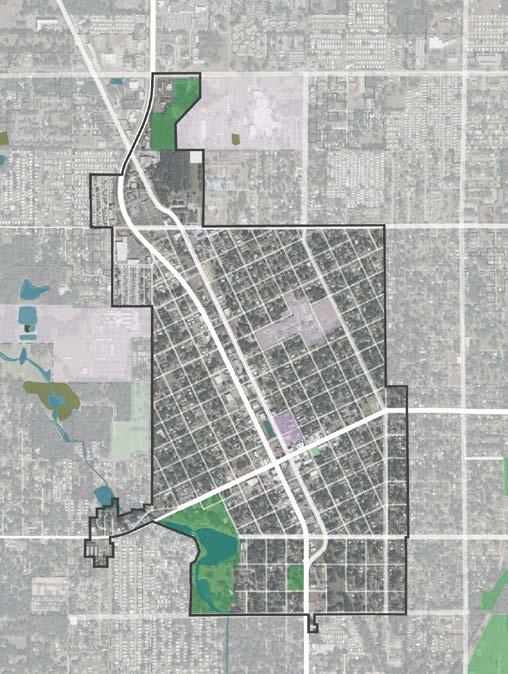
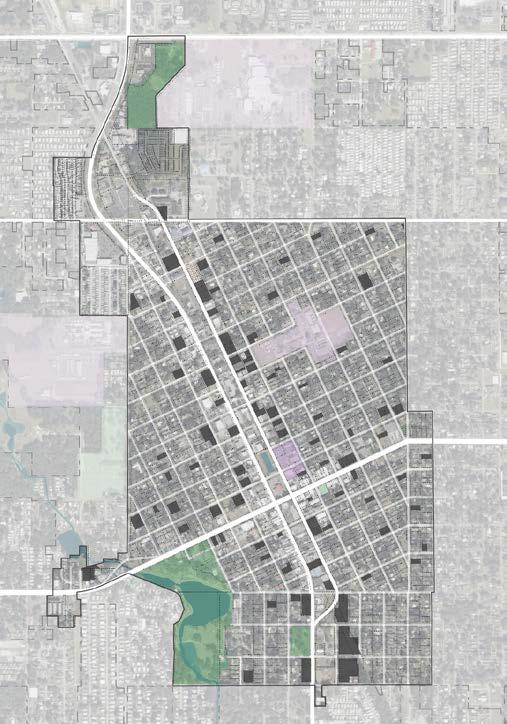
The Zephyrhills CRA encompasses the city’s most historic and traditional features, including its Main Street, Jeffries, and Abbott neighborhoods, as well as Zephyr Lake and Park. The CRA spans 1.3 sq. miles, roughly 12% of the city’s total incorporated area.
The CRA encompasses two primary commercial corridors—Gall Boulevard and 5th Avenue—along with a series of distinct neighborhoods and districts, including Hercules, Historic Jeffries, Historic Abbot, Moores Estates, Zephyr Lake, Oakside, and the Plaza District. Together with parks, schools, churches, and the City Hall complex, these areas form a traditional, historic community connected by a traditional, historic street grid.
Demographics
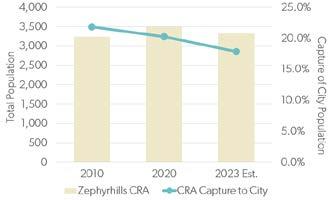
As of 2023, the CRA is home to approximately 3,322 residents; hosts 306 businesses, and employs 1,741 people. The leading industry sectors in the CRA include Health Care & Social Assistance, Accommodation and Food Services, and Educational Services.
For a comprehensive overview of demographics, job trends, and employment, please refer to Appendix: Market Analysis
Redevelopment Powers
The Zephyrhills Community Redevelopment Agency (Agency) was established by City Council Resolution #435 on March 9, 1998, in accordance with Section 163.356, Florida Statutes. This resolution granted the Agency the authority to exercise all powers outlined in Chapter 163, Part III, necessary to implement and advance the goals of the Zephyrhills CRA Master Plan.
In October 2015, City Council Resolution #710-16 expanded the boundaries of the CRA and extended its operational timeline, setting a new sunset date of 2045. This expansion allowed the CRA to broaden its impact and continue its mission of revitalization and community enhancement.
Governing Body
The Zephyrhills CRA is governed by the Zephyrhills City Council, which serves as the CRA Board in accordance with Florida Statutes Chapter 163, Part III. This dual role ensures alignment between city-wide policies and redevelopment goals within the CRA.
CRA Board Composition
The CRA Board consists of five members of the Zephyrhills City Council, including the Mayor.
As the governing body of the CRA, the Board is responsible for:
• Approving and amending the CRA Plan.
• Authorizing redevelopment projects and programs.
• Overseeing the use of Tax Increment Financing (TIF) revenues.
• Ensuring compliance with state statutes and local redevelopment goals.
The CRA operates with support from city staff and may also engage consultants, advisory committees, or community stakeholders to guide planning, implementation, and public engagement efforts.
Plan Duration
The projects, initiatives, and programs outlined in the Zephyrhills CRA Master Plan are funded through Tax Increment Financing (TIF) and must be implemented within 30 years of the CRA’s expansion in Fiscal Year 2015. This establishes a definitive timeframe for completing all redevelopment activities financed by TIF revenues. While the CRA was originally created in 1998, the 2015 expansion marks the start of the current 30-year planning and implementation window, concluding in 2045.
Plan Modification
The Zephyrhills CRA Master Plan may be amended in accordance with Section 163.361, Florida Statutes, which governs modifications to master plans. Acting in its dual role as both the CRA Board and the City Council, the governing board may determine that amendments are necessary and approve such modifications directly. Amendments may include changes to the CRA boundaries—such as the addition or removal of land—or the adoption of new initiatives, including community policing strategies.
Since its creation in 1998, the CRA Master Plan has been updated in 2012, 2016, and most recently in 2026. These updates reflect the Agency’s ongoing commitment to adapt to evolving community needs, development opportunities, and strategic priorities.
Trust Fund
In accordance with Section 163.387, Florida Statutes, a Redevelopment Trust Fund may be established following the approval of a master plan. This fund is created by ordinance, and is essential for the CRA to receive and spend TIF revenues. These funds are used exclusively to finance or refinance redevelopment activities outlined in the approved master plan.
The annual contribution to the Trust Fund is based on the incremental increase in ad valorem tax revenues generated within the CRA.
TIF Background and Revenue Projections
The Zephyrhills CRA has been established and expanded in three phases:
• CRA I (1998) – Base Year Value: $15,924,352
• CRA II (2012) – Base Year Value: $26,432,345
• CRA III (2016) – Base Year Value: $35,515,198
From 2014 to 2023, the combined CRAs generated approximately $3.79 million in TIF revenues.
Table 4. Summary of TIF Revenue Projections, Cumulative
Looking ahead, the 2024 projection model estimates taxable value growth from improved land, vacant land, and new development across CRAs I, II, and III will generate between $55.6 million and $68.9 million in TIF revenue through the CRA’s sunset year of 2045. This equates to an average annual increment between $2.53 million and $3.13 million.
Over the full projection period (2024–2045), the model anticipates a compound annual growth rate (CAGR) in TIF revenues between 4.9% and 6.1%, reflecting steady growth and reinvestment potential. See TIF Projection Table below.
For detailed TIF projections, see Appendix.
Increment Projections (2024-2045)
So URCE : FD o R; PASC o C o UNTY PR o PERTY APPRAISER; CITY o F ZEPHYRHILLS; GAI C o NSULTANTS.
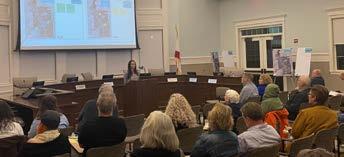
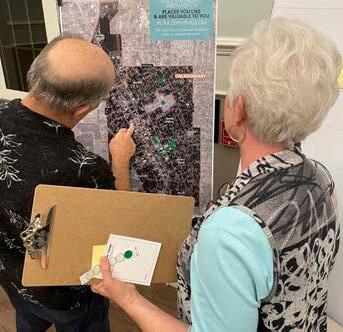
As part of the 2026 Zephyrhills CRA Master Plan update, robust community engagement efforts were conducted to better understand what residents value most about Zephyrhills, the challenges they face, and the opportunities they envision for the future. A community workshop with over 40 participants generated more than 150 comments, while an online survey engaged 150 residents and received over 250 additional responses.
This input revealed a community that deeply appreciates its parks, historic charm, and small-town character, while also recognizing the need for strategic improvements in infrastructure, economic development, and public spaces.
This summary provides the community’s principal assets, enduring challenges, and actionable opportunities that informed the development of the updated Master Plan’s vision, mission, goals, objectives, and implementation strategies.
Co MMUNITY MEETING
Assets
Residents of Zephyrhills and within the CRA expressed strong appreciation for the community’s unique character and existing amenities. Key assets include:
• Parks and Open Spaces: Zephyr Park, Hercules Park, and other green spaces are highly valued for recreation and community gatherings.
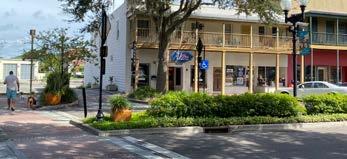
• Downtown Character: The charm of Main Street, Clock Plaza, and the utility of alleys contribute to a walkable, historic downtown.
• Local Businesses and Events: Community members support local shops, enjoy farmers markets, and participate in events that foster a small-town feel.
• Historic and Cultural Features: The Jeffries House, existing murals, churches, and the City Hall complex reflect the area’s heritage and identity.
• Neighborhood Appeal: Residents appreciate the older homes, ongoing renovations, and the overall friendliness and character of their neighborhoods.
CAPTAIN H.B JEFFRIES H o USE
MAIN STREET
CITY HALL
HERCULES PARK
Challenges
Despite its strengths, the community faces several challenges that impact quality of life and redevelopment potential:
• Flooding: Frequent flooding during heavy rains affects parks, streets, and residential areas.
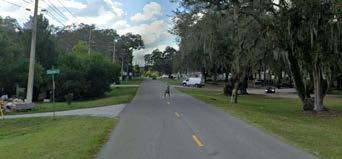
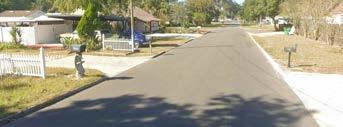
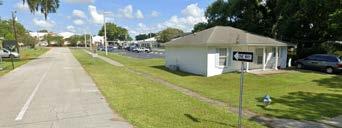
• Infrastructure Gaps: Limited sidewalks, crosswalks, street lighting, and bicycle facilities hinder safe mobility.
• Downtown Activity: While the downtown is attractive, it lacks diverse dining and entertainment options, and has visible vacancies along Main Street.
• Aesthetic Concerns: Areas like South Gall Boulevard are seen as uninviting and in need of revitalization.
• Maintenance Issues: Public buildings, alleyways, and parking lots require better upkeep, and signage is lacking to guide visitors to key destinations.
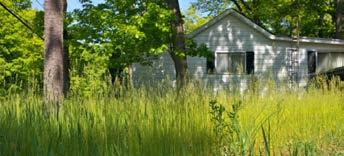
oVERGR oWN GRASS IN RESIDENTIAL AREAS
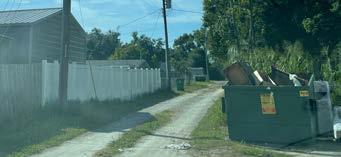
UNPR oVED ALLEY
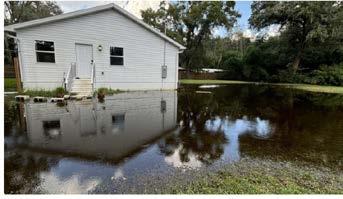
NEIGHB o RH oo D FLoo DING
LIMITED SIDEWALKS AND CR oSSINGS
Opportunities for Improvement
Community feedback highlights a range of opportunities to enhance the CRA:
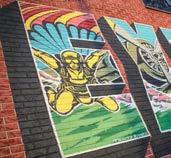
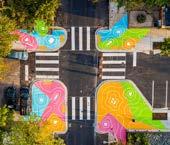
• Public Art and Beautification: Expand murals, sculptures, and streetscape improvements to enhance visual appeal and celebrate local culture.
• Business Development: Encourage more diverse, non-formula retail, such as coffee shops, bookstores, bakeries, and boutique stores—especially in walkable mixed-use buildings.
• Event Expansion: Grow community events at Clock Plaza and other venues with more music, markets, and cultural programming.
• Infrastructure Enhancements: Improve sidewalks, lighting, crosswalks, and bike lanes to support safe, active transportation.
• Stormwater Management: Invest in better flood control and drainage systems to reduce flooding impacts.
• Neighborhood Support: Expand residential incentives, support home renovations (especially for elderly residents), and promote community cleanup efforts.
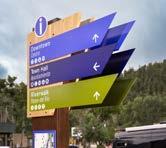
• Wayfinding and Signage: Install clear signage to direct visitors to downtown, Zephyr Park, and other key locations.
• Public Facility u pgrades: Improve maintenance of public buildings, libraries, and alleyways to ensure safety and usability.
BIKE PATH
SIDEWALK AND LIGHTING
INFILL DEVELo PMENT BUSINESS INCUBATo R
MURALS AND PUBLIC ART
GATEWAY SIGN BI oSWALE
Accomplishments
The City of Zephyrhills Community Redevelopment Agency (Agency) has made measurable progress in revitalizing its approximately 500-acre Community Redevelopment Area (CRA), which includes Downtown, the Plaza District, and several historic neighborhoods. Through strategic use of Tax Increment Financing (TIF), partnerships, and targeted grant programs, the Agency has advanced economic development, improved infrastructure and public spaces, strengthened neighborhoods, and preserved historic and cultural assets.
Economic Development and Private Investment
The Agency has successfully stimulated reinvestment in Downtown and surrounding neighborhoods by supporting small businesses and property owners through a range of incentive programs. These include Commercial Improvement Grants, Matching Façade Rehabilitation Grants, and residential ownership incentives designed to increase owner occupancy and stabilize neighborhoods. In 2023 alone, the Agency approved 15 residential and commercial grants and incentives, helping to reduce vacancies and encourage new business openings along key corridors such as Fifth Avenue.
The Agency’s efforts have contributed to new residential development within the Downtown district, including the completion of its first townhome project (Tyson Townhomes), which supports downtown living and longterm economic vitality.
Public Realm and Infrastructure Improvements
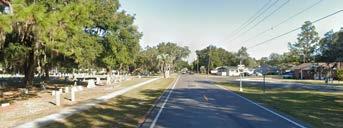
Enhancing streetscapes, sidewalks, and public amenities has been a core focus of the CRA. Projects have included streetscape planning and implementation along Fifth Avenue, sidewalk improvements in multiple neighborhoods, and targeted infrastructure upgrades near Oakside Cemetery and other historic areas. These investments improve walkability, safety, and overall district appearance while supporting local businesses.
The Agency has also played a leadership role in advancing park improvements, including Zephyr Park and Hercules Park. These projects have involved public input, design planning, and construction activities that expand recreational opportunities and serve as community gathering spaces within the CRA.
Neighborhood Revitalization and Housing
The Agency has prioritized neighborhood stabilization through residential-focused programs such as the Residential Ownership Incentive Grant and Residential Paint Grant Program. These initiatives are designed to improve housing conditions, support reinvestment in historic neighborhoods, and increase long-term owner occupancy within the CRA.
In addition, the Agency has collaborated with Pasco County and the City on code enforcement and neighborhood cleanup initiatives to address blight and improve overall neighborhood conditions.
Historic Preservation and Cultural Investment
Preserving Zephyrhills’ historic character has remained a key accomplishment of the Agency. Efforts have included planning and restoration initiatives for historic structures, such as the Carriage House and the former Home Theatre. The Home Theatre Renewal project—now being advanced in partnership with Main Street Zephyrhills— aims to transform the historic theater into a cultural and performance venue that will serve as a regional destination for arts and community events.
Planning, Partnerships, and Community Engagement
The Agency has demonstrated strong leadership in long- range planning and community engagement. It has regularly updated its Master Plan, conducted public workshops, and coordinated closely with Main Street Zephyrhills, Pasco County, and other partners to align redevelopment investments with community priorities. Recent efforts to update the CRA Master Plan reflect growing public interest in recreation, downtown businesses, and quality-of-life improvements.
Plans and Studies Conducted by the Agency
To guide strategic reinvestment and ensure redevelopment efforts align with community priorities, the Zephyrhills Community Redevelopment Agency (Agency) has prepared and implemented a range of planning and technical studies addressing downtown revitalization, neighborhood stabilization, parks, streetscapes, and urban design.
Key plans and studies undertaken by the CRA include:
• Zephyrhills CRA Market Report (September 2019)
• Zephyrhills Opportunity Zones Prospectus Report (September 2019)
• Housing Initiative Study (May 2020)
• Sidewalk Master Plan (2020)
• Zephyrhills Little But Loud Master Plan (May–December 2020)
• Oakside-Zephyr Park Neighborhood Plan (November 2022)
• Zephyr Park Master Plan (June 2020)
• Hercules Park Master Plan (November 2022)
For more details about each of these plans, see Section 2.2, The CRA Today.
NEW SIDEWALK IMPR oVEMENTS
1.3 CRA Plan Organization
The 2026 Zephyrhills CRA Master Plan establishes a strategic framework to guide redevelopment efforts over the next decade. Grounded in a clear vision—to foster an exceptional quality of life in the CRA by creating a vibrant, safe, and inclusive community that honors its heritage and celebrates its future—and a mission focused on enhancing well-being, economic vitality, and connectivity, the plan outlines a comprehensive approach to revitalization.
The Plan is structured around four core components that collectively guide the district’s revitalization strategy and long-term vision. These components were developed through a comprehensive planning process that incorporated feedback from community, Agency stakeholders, CRA Board Members, along with insights gained from an in-depth assessment of the CRA and a market analysis. This inclusive approach ensures the plan reflects both the aspirations and realities of Zephyrhills— aligning strategic priorities with local needs and opportunities.
Insights from the area assessment are presented in Chapter 2: Background, with additional detail provided in the Parcel Characteristics Analysis located in the Appendix. The Market Analysis, also included in the Appendix, offers further context on economic trends, development potential, and investment opportunities.
Plan Organization
• Vision and Mission: The vision statement articulates the CRA’s long-term aspirations, describing the desired future for the district and the transformative impact of revitalization. The mission statement defines the CRA’s present-day purpose—what it seeks to accomplish through redevelopment efforts, strategic partnerships, and community-focused programs. Together, these statements establish the strategic foundation of the CRA Master Plan, ensuring that all goals, policies, and projects are aligned with both current needs and future ambitions.
• Guiding Principles: The Guiding Principles serve as core values that shape decision-making and inspire stakeholders. They reflect what the CRA aims to achieve or become over the next decade and provide a unifying framework under which all goals, objectives, and strategies are developed.
• Goals and Objectives: The CRA’s mission is supported by five strategic goals and thirteen corresponding objectives. These elements direct the CRA’s efforts in project implementation, development planning, policy formulation, and the design of incentive programs— ensuring a focused and measurable approach to community revitalization.
• Big Moves: The Big Moves component highlights transformative initiatives designed to catalyze longterm community and economic vitality. These projects focus on improving stormwater management and climate change adaptation, enhancing walkability and connectivity, and advancing placemaking efforts. Envisioned as catalytic, these initiatives aim to spur further investment and revitalization, laying the groundwork for a resilient, sustainable, and diverse downtown.
To foster an exceptional quality of life in the Zephyrhills CRA by creating a vibrant, safe, and inclusive community honoring our heritage and celebrating our future.
Vision Mission
The Zephyrhills Community Redevelopment Agency is dedicated to enhancing the well-being, health, and economic vitality of our residents, businesses, and visitors through thoughtful investments in public spaces, diverse housing, and accessible amenities. We are committed to fostering a connected, sustainable, and resilient community through balanced development and infrastructure that enriches daily life and reflects the unique character of the area.
Guiding Principles
PROSPERITY
Foster a Thriving Local Economy
Foster a dynamic local economy by supporting existing and attracting new businesses, revitalizing commercial corridors, and creating destinations that enhance community engagement and economic opportunities.
HERITAGE
Preserve the Historic Character
Dedicate efforts to preserving the historic downtown character and rich residential heritage of Zephyrhills, ensuring this cultural identity remains a central aspect of community development.
REVAMP INVEST
Create Vibrant and Diverse Corridor and Gateway Places
A. Transform Gall Boulevard into a mixed-use, livable corridor.
B. Enhance and extend Main Street.
C. Create distinct Gateway Places.
Support and invest in the area’s economic development, character, and market positioning
A. Position the area to attract sustainable, highquality development and investment.
B. Promote the economic diversification of the area.
C. Leverage regional and local partnerships.
DIVERSITY
Promote Balanced Investment
Ensure balanced investment in neighborhoods that encourages housing diversification, providing equitable opportunities for all residents regardless of background or socioeconomic status.
RESILIENCE
Prepare for Climate Adaptation
Invest in sustainable and climate-resilient infrastructure that promotes long-term viability, enhances the environment, and improves community resilience against climate impacts, and adaptation policies.
Goals & Objectives
ENHANCE
BUILD
PLACEMAKING
Create Quality Places
Design and manage public spaces—like parks and streets—to enhance connectivity, health, and community identity, transforming them into vibrant, inclusive places that celebrate culture, support the economic vitality, and improve quality of life.
Enhance and preserve the neighborhood’s residential character while expanding housing opportunities
A. Invest in the existing housing stock.
B. Create opportunities for infill housing development.
C. Diversify housing options and identify sites for higher-density development.
Improve transportation and connectivity while upgrading infrastructure to address flooding and support infill development
A. Enhance the traditional grid to link key destinations through an integrated multi-modal network.
B. Develop resilient and sustainable infrastructure systems of streets, alleys, sidewalks, public parking, stormwater, and utilities to support the area’s connectivity and growth.
Leverage parks and open spaces to boost community vitality, conservation, and climate resilience
A. Invest in the enhancement and longterm development of parks and open spaces.
B. Integrate climate adaptation and stormwater management into parks and open spaces.
“Big Moves” highlights transformative initiatives for the CRA aimed at improving stormwater management and climate change adaptation, walkability, connectivity, and placemaking, setting the stage for the area’s long-term community and economic vitality. These projects are envisioned to be catalytic, meaning they aim to spur further investment and revitalization, creating a foundation for long-term resilient, sustainable, and diverse downtown.
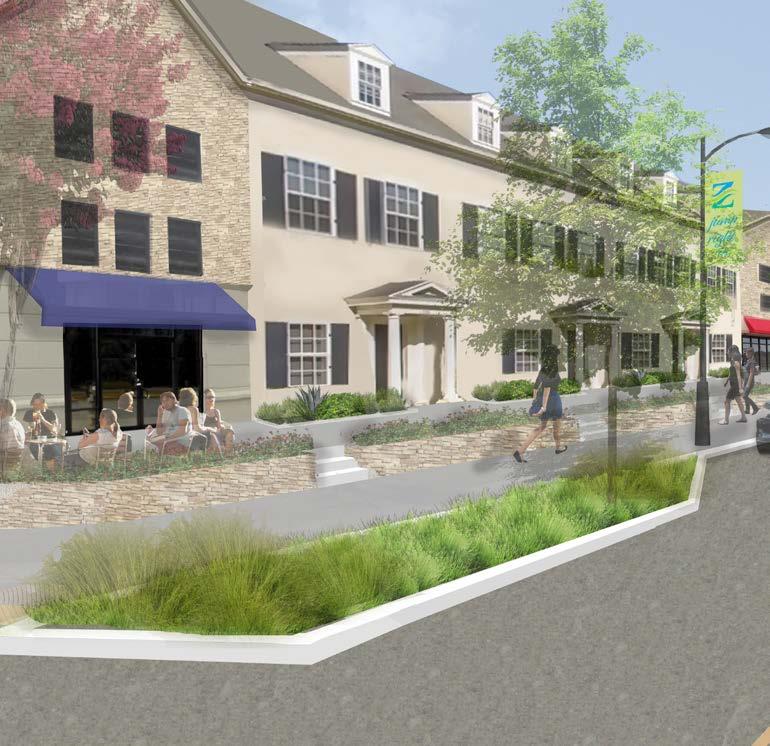
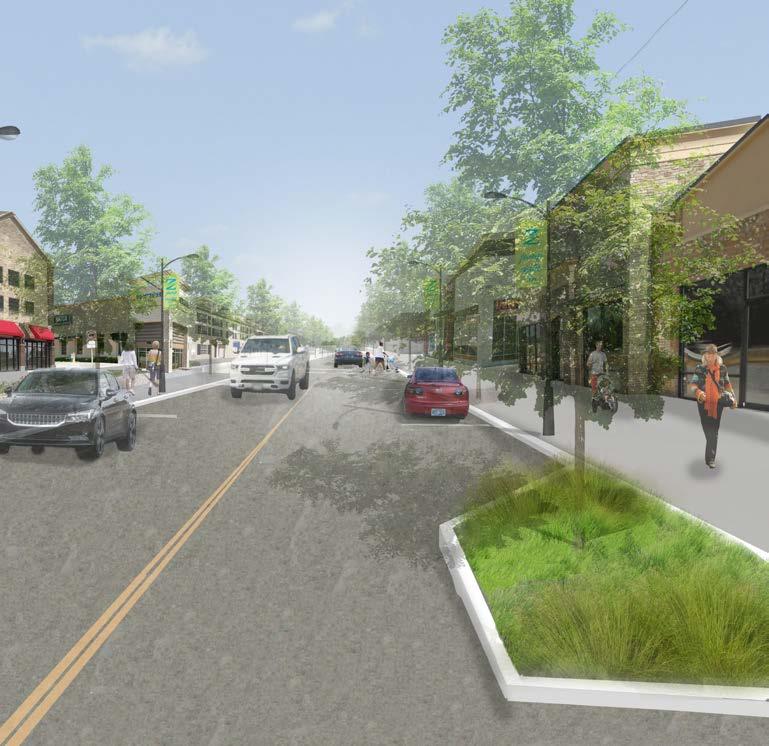
GALL BO u ELVARD MIXED AND LIVABLE CORRIDOR PLACE
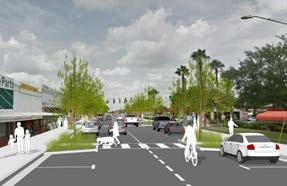
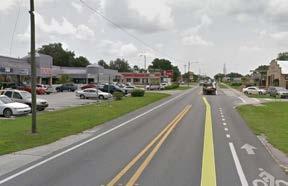
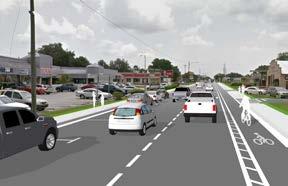
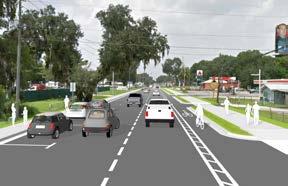
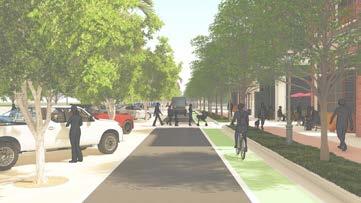
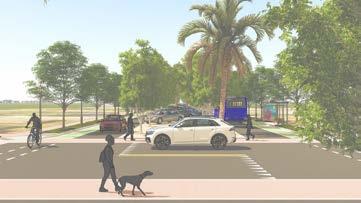
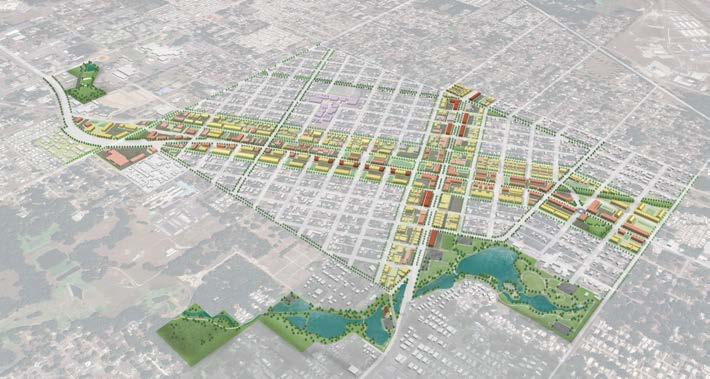
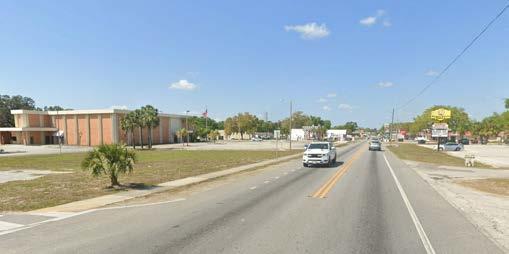
Transform and revitalize Gall Boulevard into a vibrant destination and mixed-use corridor by introducing diverse residential and commercial uses, enhancing walkability, and creating a pedestrianfocused streetscape. 1
ZEPHYR CREEK RESTORATION
Restore Zephyr Creek as a natural asset, enhancing its ecological health and biodiversity, while simultaneously increasing stormwater capacity to effectively manage runoff and reduce flooding risks during rain event and storms. 2
INVEST AND EXPAND MAIN STREET
Continue investing in business support and recruitment on Main Street, expanding its boundary to 16th Street, while promoting mixed-use development, enhancing the public realm and cultural initiatives, strengthening branding, and creating incentives to attract restaurants, offices, and cultural venues. 3
REDESIGN 5TH AVEN u E AS A “RAMBLA”-STYLE SPACE
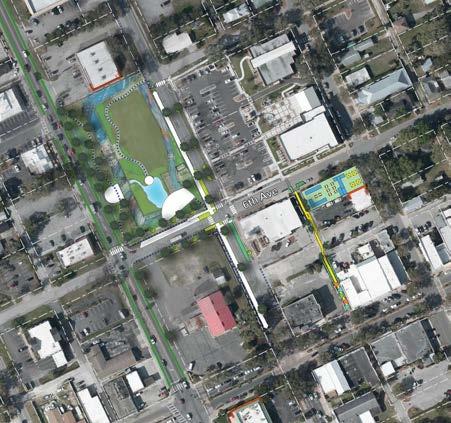
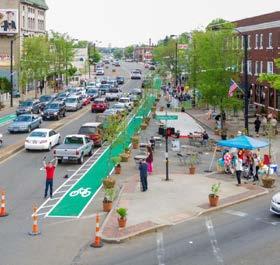
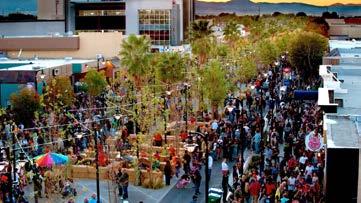
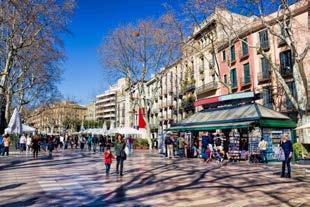
Inspired by Barcelona’s pedestrian-friendly boulevards, “Las Ramblas,” redesign sections of 5th Avenue with wider sidewalks and flexible spaces that can convert into plazas for special events in Zephyrhills.
CREATE A GREENWAY LOOP CONNECTING DOWNTOWN DESTINATIONS
Develop a dedicated greenway loop, consisting of a separate multi-purpose path for cyclists and pedestrians, that connects key destinations within downtown. This new loop will not only enhance connectivity within downtown but also promote healthy lifestyles and sustainable transportation options.
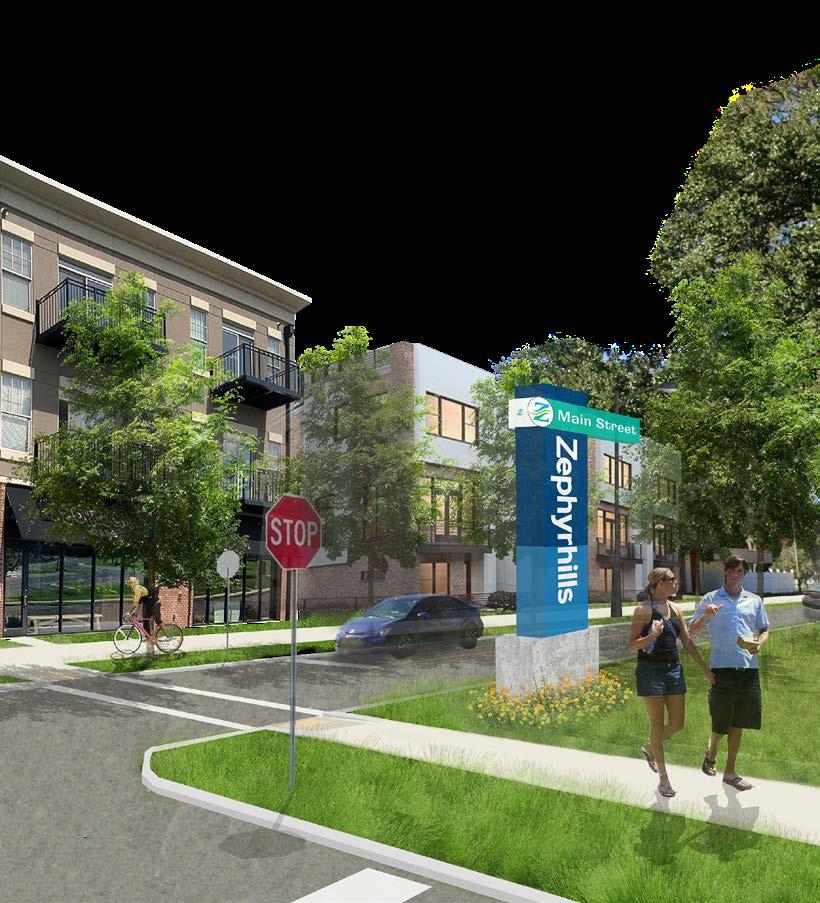
ESTABLISH DISTINCT GATEWAY PLACES AND FEAT u RES
Create five distinct gateways that serve as welcoming entry points into the CRA, enhancing the city’s identity and fostering a sense of belonging. These gateways will not only signify the entrances to key areas but also offer functional and aesthetic spaces for residents and visitors.
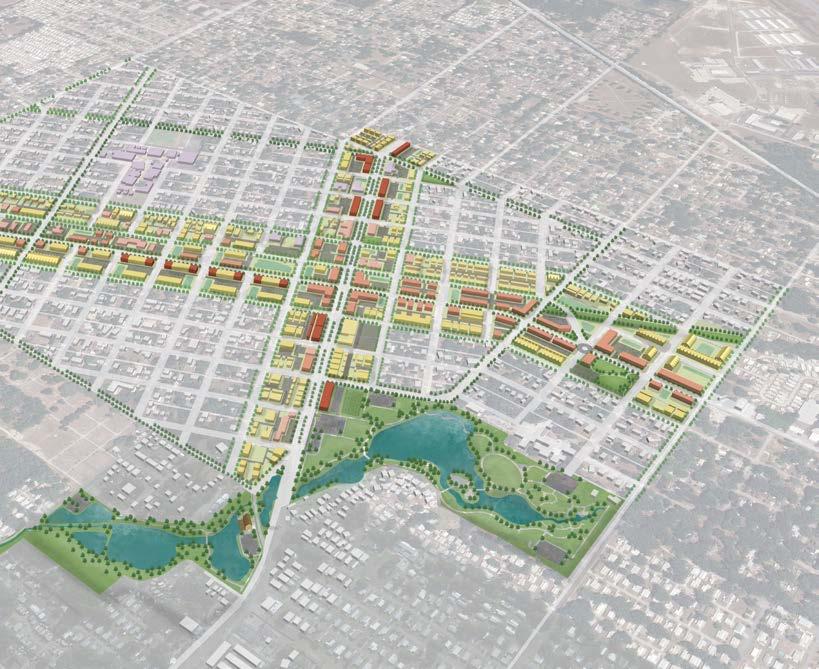
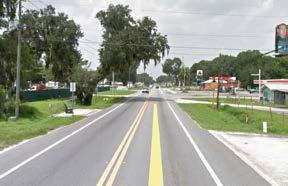
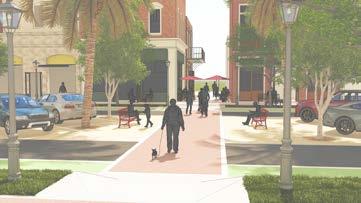
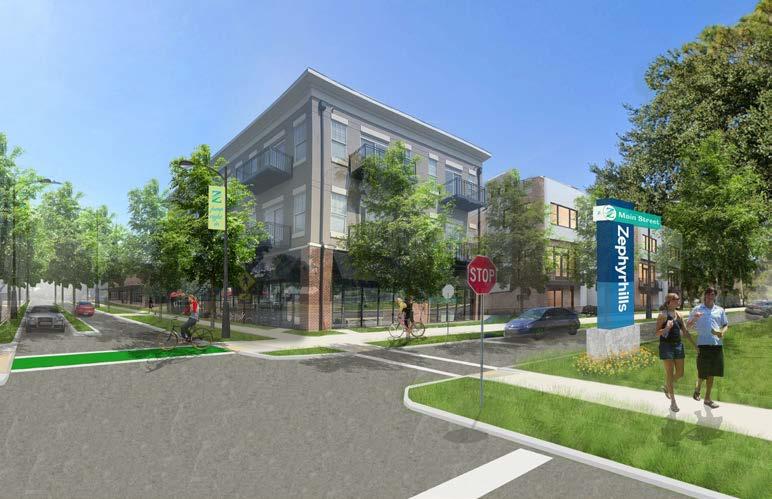
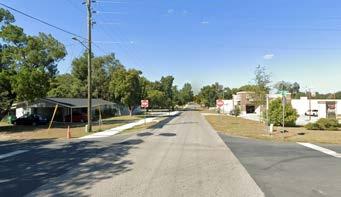
The following pages present renderings of the vision for Gall Boulevard and Main Street Gateway Place. Section 3: Vision, Goals, Objectives, and Actions will offer further details on the vision and implementation of these transformative projects.
Background & Existing Conditions
This chapter provides background on the City and County, along with a comprehensive summary of existing conditions within the Community Redevelopment Area (CRA). The chapter begins with a regional and county overview, highlighting migration trends and growth opportunities. It then introduces the city’s history, population dynamics, workforce migration, and the existing conditions of the CRA’s housing, neighborhoods, connectivity, parks and open space system, and infrastructure. It also outlines both current and past planning efforts and projects. Following this, the chapter presents an overview of CRA zoning and land use regulations.
Pasco County is among the fastest growing counties in Florida
2.1
About the Region and Zephyrhills
The Region and Pasco County
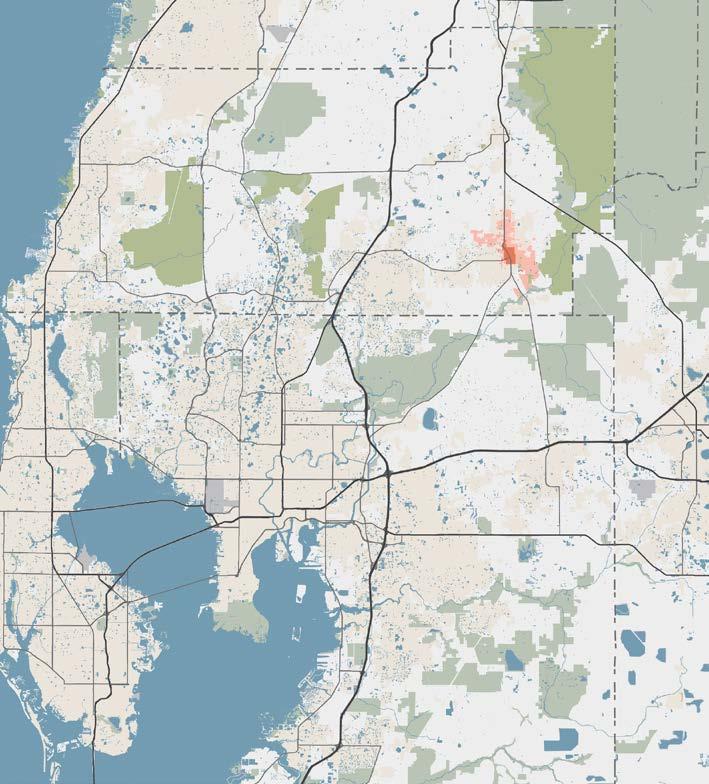
Zephyrhills, Florida, stands as Pasco County’s most populous city, boasting a population of 19,337 residents. Settled about 30 miles northeast of Tampa, it enjoys convenient accessibility via major highways. Pasco County is part of the Tampa Bay Metropolitan Statistical Area (MSA), along with Hillsborough, Pinellas, and Hernando Counties.
The MSA is connected nationally and internationally by ample highway and rail lines around the state, as well as the Port of Tampa. Zephyrhills is directly in the middle of the region, with quick access to major highways, local and international airports, rail lines, and sea lanes.
The county is renowned for its diverse topography, encompassing coastal regions along the Gulf, inland woodlands, and an abundance of lakes and rivers. It provides a harmonious blend of suburban and rural living, striking a balance between urban conveniences and the allure of natural landscapes.
Pasco County’s economy exhibits diversity, boasting a range of industries such as healthcare, education, retail, manufacturing, and tourism. In recent years, the county has seen substantial growth, attracting both businesses and residents, attributed to its proximity to the Tampa Bay region and the availability of affordable real estate options.
According to information provided by the Zephyrhills Chamber of Commerce, the Tampa Bay MSA boasts approximately 2.7 million residents, establishing it as the second-largest metropolitan statistical area in Florida and the fourth-largest in the Southeastern U.S., only trailing behind Miami, Washington, D.C., and Atlanta.
The attraction of Pasco County is further heightened by its adjacency to the Tampa Bay area, offering an enticing mix of suburban and rural living, which has contributed to its status as one of the fastest-growing counties in Florida (Refer to Figure 4: Florida and Pasco County Population Growth Comparison).
F IG u RE 4. FLORIDA AND PASCO CO u NTY POP u LATION GROW COMPARISON
So URCE : U.S CENSUS BUREAU - 2020 CENSUS DATA
+ Pasco County + Florida
F IG u RE 5. REGIONAL MAP
Florida, in a broader context, has witnessed remarkable population expansion due to factors such as favorable weather, employment opportunities, and a comparatively lower cost of living when juxtaposed with some other states. The latest data from the U.S. Census Bureau indicates that Florida holds the top rank in the country for total net migration. Florida’s population has now surpassed 22.2 million, having overtaken New York to secure the third position nationally, trailing only California and Texas.
CRYSTAL SPRINGS
BRANDON
BLOOMINGDALE
GIBSONTON
APOLLO BEACH
TAMPA
TAMPA
ST. PETERSBURG
PINELLAS PARK
LARGO
SAFETY HARBOR
CITRUS PARK
LAKELAND
WESTLY CHAPEL
LAND O LAKES
HUDSON
BAYONET POINT
PORT RICHEY
NEW PORT RICHEY
DADE CITY
ODESSA
CITY OF ZEPHYRHILLS
PASCO COUNTY
HILLSBOROUGH COUNTY
PINELLAS COUNTY
County Migration Flows
Data from the American Community Survey (2015–2019), specifically regarding County-to-County Migration flows, reveals that a significant portion, 38%, of newcomers to Pasco County originate from Hillsborough County (25%) and Pinellas County (13%). It’s worth noting that both Hillsborough and Pinellas Counties are part of the same MSA, but are associated with a higher cost of living compared to Pasco County.
This migration flow suggests that one possible reason for the migration pattern may be the desire of individuals to seek a more affordable living environment in Pasco County.
This graph shows the 20 counties with the highest “net migration flow” (in-flow minus out-flow) relationship with Pasco County.
F IG u RE 6. CO u NTY MIGRATION FLOW (2015–2019)
Growth Opportunities
Pasco County, Florida, presents a range of economic growth opportunities that can enhance its prosperity and attract businesses and residents. The following several factors have driven Pasco County’s growth:
• Economic Opportunities: Pasco County’s diverse economy, including sectors like healthcare, education, and manufacturing, has attracted businesses and job seekers. Its location near major cities like Tampa and St. Petersburg provides residents with a range of employment options.
• Affordable Housing: Pasco County offered more affordable housing options compared to some of the nearby urban areas, making it attractive to families and individuals looking for reasonably priced homes.
• Quality of Life: The county’s natural beauty, with its lakes, rivers, and outdoor recreational opportunities, adds to its appeal. The warm climate and various parks and green spaces make it an ideal place for those who enjoy outdoor activities.
• Transportation Infrastructure: The county’s transportation infrastructure, including highways and proximity to major airports, have contributed to its growth by making it accessible to residents and businesses.
Co NSTRUCTI o N Co MP o NENT FACILITY
CRYSTAL SPRINGS RESERVE INFRASTRUCTURE INVESTMENT
About Zephyrhills
Zephyrhills, Florida, stands as Pasco County’s most populous city, boasting a population of 19,337 residents. Settled about 30 miles northeast of Tampa, it enjoys convenient accessibility via major highways.
Zephyrhills Population has grown 64% over the past decade
Zephyrhills boasts a fascinating history, initially conceived as a retirement haven in the early 1900s. Today, it is home to 19,337 residents and is Pasco County’s most populous city.
Zephyrhills History
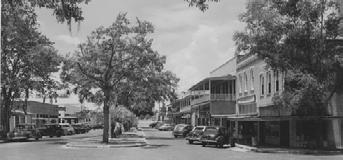
Zephyrhills boasts a fascinating history, initially conceived as a retirement haven in the early 1900s. The land was acquired from the Florida Railway and Navigation Corporation; later in 1909-10, it was purchased by the Zephyr Hills Colony Company with the intention of establishing a “colony” for Civil War veterans. The formal incorporation of the City of Zephyrhills took place in 1914, a pivotal moment in the city’s history, marking the genesis of local governance and civic organization.
ZEPHYR LAKE
RESIDENTIAL H o ME
FITH AVENUE
Co Lo NY Co MPANY
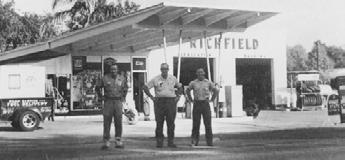
RICHFIELDS 1965
Zephyrhills People, and Business
As the population flourished and the city expanded, Zephyrhills underwent significant growth and development during the mid-20th century. This expansion was partly attributed to the construction of the Zephyrhills Municipal Airport, drawing aviators and aviation enthusiasts to the area.
Zephyrhills is home to a population of 19,337 residents (2023 est.). The city is presently experiencing a growth rate of approximately 5% annually, resulting in a remarkable 64% increase in population over the past decade.
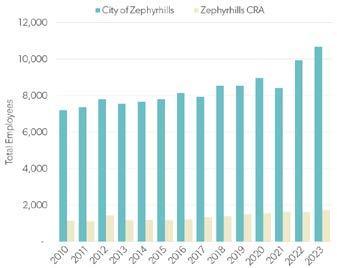
Zephyrhills hosts 888 businesses, employing 9,810 individuals (2023 est.). Between 2010 and 2023, the city witnessed a notable expansion in total employment, with compound annual growth rates (CAGRs) of 2.2% and 2.3%, respectively, leading to an increase of nearly 2,622 employees since 2010.
The city’s primary industries as of 2023, encompass Health Care and Social Assistance, Retail Trade, Accommodation and Food Services, and Educational Services. However, it’s worth noting that a substantial majority (91%) of employees in these industries reside outside the city limits. Conversely, roughly 6,141 city residents are employed
elsewhere, beyond the city’s boundaries.
Main places where people work listed on the Opportunity Zones Prospectus Report are;
• Nestle Waters North America
• Advent Health Zephryhills
• Florida Medical Clinic
• Morrow Steel
In a recent development in October 2023, Bauducco Foods, a prominent Brazilian Food Manufacturer renowned for its panettones and biscuits, acquired a 72-acre parcel within the Zephyrhills Municipal Airport Industrial Park. Their ambitious plans include a $200 million investment to construct a 400,000-sq. ft. facility, which is expected to generate 600 job opportunities. (Source: Fox 13 Tampa Bay News)
For more comprehensive information regarding population, employment, and industries, please refer to the Market Analysis in the Appendix.
PLACES TO WORK
+ Nestle Water North America
While a modest number of Zephyrhills residents work within the city itself, a substantial number of people commute to neighboring cities
Zephyrhills Work Migration
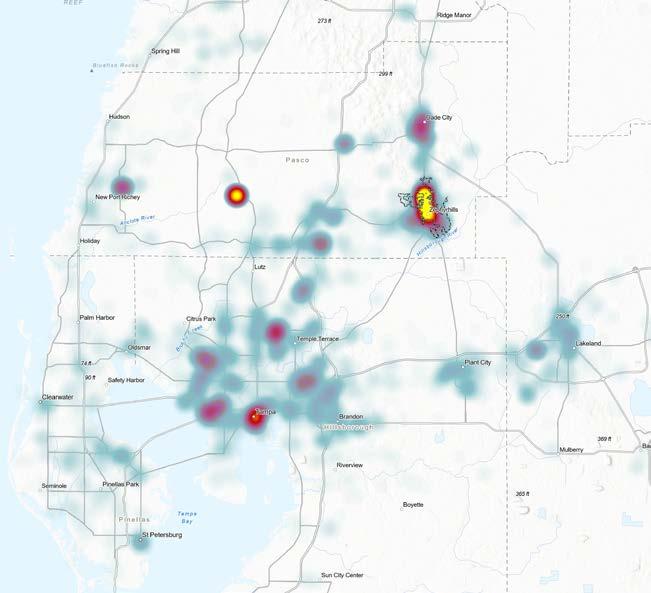
While a modest number of Zephyrhills residents, specifically 789 people, opt to work within the city itself, a significantly larger contingent of 6,037 individuals commute to neighboring areas such as Land O’ Lakes, Tampa, Lakeland, Dade City, and New Port Richey for their employment. In contrast, a substantial 8,184 individuals choose to work in Zephyrhills (see figure below).
F IG u RE 8. ZEPHYRHILLS WORK MIGRATION HEAT MAP
CITY OF ZEPHYRHILLS
DADE CITY
TAMPA
TEMPLE TERRACE
LAKELAND
PLANT CITY
NEW PORT RICHEY
BRANDON
PASCO COUNTY
HILLSBOROUGH COUNTY
Zephyrhills is classified as an economically challenged community by the Distressed Communities Index from the
Economic Innovation Group
Distressed Community Index
The Economic Innovation Group (EIG) reports that over 50 million people reside in economically distressed communities, and struggle to reap the benefits of the longest sustained economic growth period in U.S. history.
To assess and compare the overall well-being of communities nationwide, the EIG has developed a Distressed Community Index (DCI). This index is derived from the U.S. Census Bureau’s Business Patterns and American Community Survey 5-Year Estimates for 20162020, classifying ZIP Codes into five categories of wellbeing:
• Prosperous
• Comfortable
• Mid-Tier
• At Risk
• Distressed
The DCI takes into account various components, including the proportion of individuals without a high school diploma, the housing vacancy rate, the number of adults not employed, the poverty rate, the median income ratio, changes in employment, and changes in establishments.
Within the City of Zephyrhills, Florida, which encompasses three ZIP Codes (33540, 33541, and 33542), the DCI map designates all three Zephyrhills ZIP Codes as “At Risk”areas. (please refer to Figure 9 and Table 1). On the other hand, Pasco County’s DCI score stands at 16.6, placing it in the “Prosperous” category.
For more information about the Distressed Index, visit: https://eig.org/distressed-communities/2022-dci-
F IG u RE 9. DISTRESSED MAP BY ZIP CODES
TABLE 2. DISTRESSED MAP BY ZIP CODES
LAKELAND
WESLEY CHAPEL
DADECITY
TEMPLE TERRACE
Initiatives and Organizations Contributing to the City Economic Prosperity
The City of Zephyrhills is actively engaged in a number of initiatives that encompass a two-fold economic development strategy. The first part of that vision includes a strong manufacturing/airport corridor where highpaying jobs are created. The second part of the vision is a strong vibrant downtown where “community” can be enjoyed, and the uniqueness of Zephyrhills can be showcased to locals and tourists alike. In addition to the Zephyrhills Community Redevelopment Agency (Agency) working toward these goals are the Zephyrhills Economic Development Coalition (ZEDC), The Greater Zephyrhills Chamber of Commerce, Zephyrhills Municipal Airport (ZMA), and Main Street Zephyrhills.
Zephyrhills Economic Development Coalition (ZEDC)
The Greater Zephyrhills Chamber of Commerce administers the Zephyrhills Economic Development Coalition (ZEDC), a strategic partnership of the Chamber of Commerce, the City of Zephyrhills, Main Street Zephyrhills, and Pasco Economic Development Council. ZEDC seeks to align strategies and streamline the resources of local and county-wide partners in economic development. The City of Zephyrhills supports this effort with grants to the chamber, which provides partner expertise, knowledge, professional staff, and volunteer resources to carry out programs specific to the mission of the ZEDC.
The Greater Zephyrhills Chamber of Commerce
The Greater Zephyrhills Chamber of Commerce is a vital organization that supports and promotes local businesses, encourages economic development, and fosters community engagement throughout Zephyrhills. Serving as a key resource for networking, advocacy, and professional development, the Chamber offers its members tools and opportunities to thrive in a competitive marketplace. Through events, partnerships, and community-focused initiatives, it works to create a robust business environment and a vibrant, connected community that benefits both residents and businesses alike
Zephyrhills Main Street
Main Street Zephyrhills is dedicated to providing economic vitality through historic preservation, pride in our quality of life, and a strong sense of community. Main Street Zephyrhills will continue to grow and develop as a result of continued support from volunteers, downtown merchants, partnering organizations, and members—all of whom share the belief that a strong, historic downtown is an essential component of Zephyhills’ hometown identity.
2.2 The CRA Today
Overview
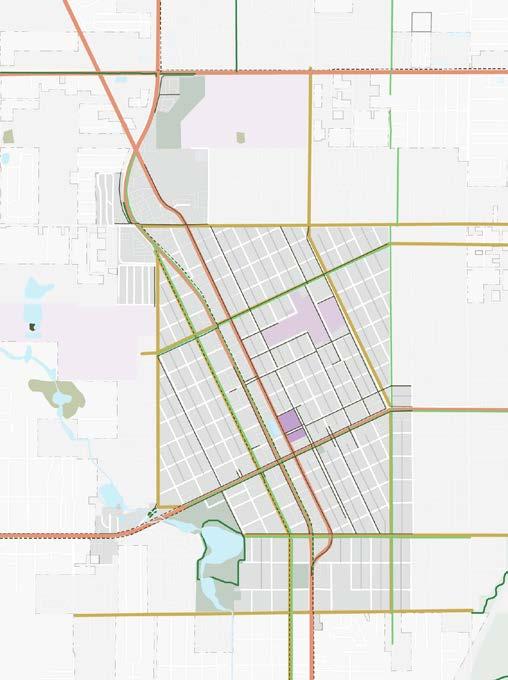
The Zephyrhills Community Redevelopment Area (CRA) encompasses the city’s most historic and traditional features, including Main Street, the Jeffries and Abbott neighborhoods, and Zephyr Lake and Park. Covering 1.3 square miles—roughly 12% of the city’s total area— the CRA includes two main commercial corridors, Gall Boulevard and 5th Avenue, as well as distinct neighborhoods and districts: Hercules, Historic Jeffries, Historic Abbot, Moores Estates, Zephyr Lake, Oakside, and Plaza District. It also contains parks, schools, churches, and the City Hall complex, all connected by a traditional street grid that reinforces walkability and community cohesion.
Population & Employment
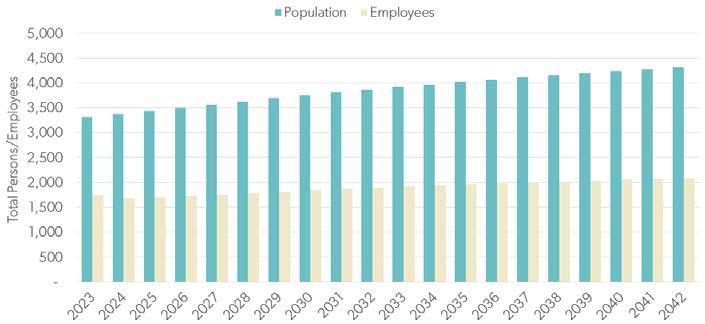
As of 2023, the CRA has a population of 3,320, projected to grow by 30% to 4,315 by 2042. Employment is expected to increase from 1,740 to between 1,700 and 2,130 jobs—a 42% rise.
Commercial & Housing Projections
To support future growth, the CRA will need to accommodate approximately 260,000 sq. ft. of new commercial space and 462 new housing units by 2042 under a moderate development scenario.
Historic Character
The CRA showcases architectural styles such as Florida Cracker, Craftsman, and Mid-Century Modern. It is home to the Zephyrhills Historic District, listed on the National Register of Historic Places. A key landmark is the Captain H.B. Jeffries House, now the headquarters of Main Street Zephyrhills, Inc., a nonprofit focused on downtown revitalization.
Transportation & Connectivity
The CRA’s transportation network centers around Gall Boulevard (north-south) and 5th Avenue (east-west). Plans are underway to improve bike lanes, sidewalks, and alleyways to support walkability and reduce congestion. These efforts are guided by the Sidewalk Master Plan, which outlines long-term strategies for safer, more connected streets.
Parks & Open Spaces
The Zephyrhills CRA is home to the city’s two largest parks—Hercules Park, a 12-acre site formerly an aquatic center now transformed into a new city park, and Zephyr Park, a 34-acre space featuring a scenic lake connected to Zephyr Creek. Also within the area is Shepard Park, a smaller 2-acre neighborhood park located along Gall Boulevard. In addition to these green spaces, the district includes Clock Plaza, a 0.3-acre plaza on Main Street surrounded by local businesses, offering a charming “Town Square” atmosphere for tourists and local shoppers alike, complete with shade trees and picnic tables.
Stormwater & Flooding
Flooding is a major concern, especially following Hurricanes Milton and Helene in 2024. In response, the city adopted a Stormwater Master Plan in 2023, proposing upgrades such as new retention ponds, culvert improvements, and reinforced drainage systems. These projects aim to reduce flooding, improve water quality, and protect public spaces.
The following pages provide detailed background on housing, connectivity, parks and open spaces, and stormwater infrastructure within the CRA.
CAPTAIN H.B JEFFRIES H o USE
MAIN STREET
CITY HALL
HERCULES PARK
UNPR oVED ALLEY
NEIGHB o RH oo D FLoo DING
LIMITED SIDEWALKS AND CR oSSINGS
oVERGR oWN GRASS IN RESIDENTIAL AREAS
CRA PROGRAMS & INCENTIVES TODAY
To support revitalization and community pride within the Zephyrhills Community Redevelopment Area (CRA), a series of incentive programs have been established to encourage homeownership, property improvements, and neighborhood beautification. These initiatives are designed to enhance the CRA’s visual appeal, promote economic vitality, and foster a stronger sense of place. Whether you’re a resident looking to invest in your home or a business owner seeking to improve your storefront, the CRA offers targeted grants and recognition programs to help make meaningful improvements across the community.
• Residential Ownership Incentive
+ This program provides a $10,000 grant to incentivize home purchases within the CRA.
+ The grant aims to improve owner-occupancy rates and create a walkable, neighborhoodfriendly environment.
+ To be eligible, applicants must apply for the grant and be approved by the CRA Board before closing on the property, which must be located within the CRA.
+ This is not down-payment assistance, but a grant to encourage homeownership within the CRA.
• Residential Paint Grant:
+ This grant offers up to $500 in matching funds for exterior residential paint, aimed at improving property appearance within the CRA.
+ It’s awarded on a first-come, first-served basis, with one grant per property.
• Neighborhood Beautification Award
+ This award recognizes outstanding residential and commercial landscaping within the CRA.
+ It aims to enhance the visual appeal of neighborhoods, promote community spirit, and improve the overall livability of Zephyrhills.
+ More than one award may be given per quarter.
• Matching Façade Rehabilitation Gran t
+ This program offers up to $5,000 in matching funds for commercial building facade renovations.
+ It also includes limited technical assistance to encourage broader investment in building rehabilitation and downtown revitalization.
+ The program focuses on preserving historic properties and enhancing the overall aesthetic of the business district.
+ Examples of eligible improvements include awnings, signage, and other facade enhancements.
• Commercial Improvement Grant
+ Encourage reinvestment in vacant, underutilized, and aging commercial and mixed - use properties within the CRA.
+ Provide financial assistance of up to $50,000 per eligible property.
+ Support rehabilitation and preservation of historic and non - historic buildings.
+ Improve building aesthetics and strengthen a pedestrian - oriented commercial environment Incentivize small business growth and attraction, including specialty retail and food - based businesses.
Housing and Neighborhoods
The City’s earlier plans identified a series of neighborhoods built using grid-style streets, walkable blocks, and parks. There are seven distinct neighborhoods in the Zephyhills CRA: three neighborhoods west of Gall Avenue are Plaza District, Oakside, and Zephyr Lake; and four neighborhoods east of Gall Avenue are Hercules, Historic Jeffries, Historic Abbot, and Moore’s State. See Figure 37: CRA Neighborhood Map.
The majority of the structures in the CRA, including residential homes, were built in 1960 and earlier; as such, the overall architecture is vernacular. However different styles, such as mid-century modern, Florida Cracker, and, Craftsman, can be found.
In 1999, the City of Zephyrhills conducted a city-wide historic resources survey, finding over 440 resources. Through information obtained in the survey, a historic district was created. In 2001, the Zephyrhills Historic District was nominated for and listed on the National Register of Historic Places.
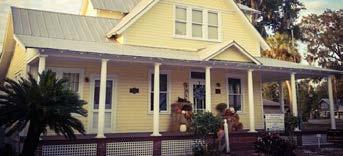
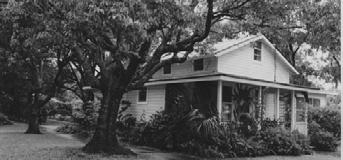
One of key historic structures is the Captain H.B Jeffries House located on 5th Avenue. This frame vernacular structure was built in 1911 as the home of Captain Harold B. Jeffries, referred to as the founder of Zephyrhills. Today, the structure is owned by the City of Zephyrhills, and is home to Tina and Joe’s Cafe, a favorite local lunch spot in downtown. It is a local landmark and is individually listed on the National Register of Historic Places.
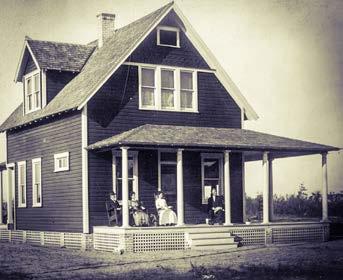
HISTo RIC CAPTAIN H.B JEFFRIES H o USE PH oTo
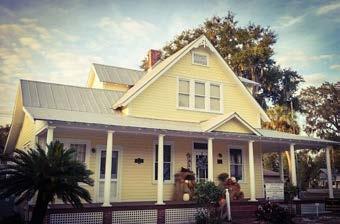
CAPTIAN H.B JEFFRIES H o USE To DAY
So URCE : CITY o F ZEPHYRHILLS WEBSITE
Strong neighborhoods play a crucial role in fostering vibrant, resilient, and thriving communities.
ZEPHYR
LAKE
The average just/market value for a single-family home in Zephyrhills stands at $250,000
(2022)
Housing Composition and Value
Zephyrhills’ housing market mirrors the prevailing trends at the county, state, and national levels. In 2023, home prices have been steadily climbing, primarily influenced by factors such as diminished inventory, increased demand, escalating construction expenses, and elevated mortgage rates.
Housing Units and Composition
As of 2023, the CRA included approximately 1,383 households and 1,707 housing units.
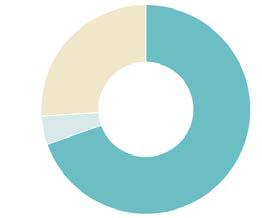
Single-family homes—including detached houses and attached townhomes—make up the majority, accounting for 70% of all housing units. Multi-family residences represent about 26%, while mobile and manufactured homes comprise roughly 4%. Notably, there are no condominium units within the CRA. These proportions are illustrated in the adjacent figure.
F IG u RE 12. CRA HO u SING COMPOSITION
So URCE : PASC o C o UNTY FINAL 2022 TAX R o LL; ESRI 2023 ESTIMATES; GAI C o NSULTANTS.
Housing Value
Per the 2023 Pasco County Tax Roll, the average just/ market value for a Single-Family Home in the city stands at $250,000.
The Existing Conditions Report from the Oakridge and Zephyr Park Neighborhood Plan in 2022 reports the median purchase price for housing in Zephyrhills is on an upward trajectory, aligning with the prevailing trends at the county, state, and national levels. Furthermore, it’s noteworthy that median sales prices in Zephyrhills are 37% lower compared to the Tampa Metro Area.
For more in-depth information regarding the current housing market within the city and the CRA, please refer to Chapter 04: Market Assessment.
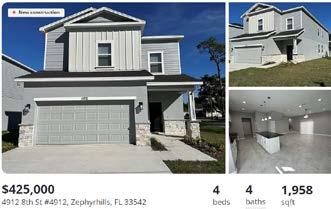
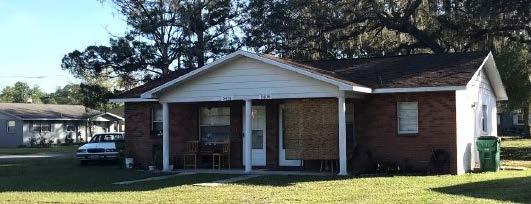
NEW Co NSTRUCTI o N RESIDENTIAL H o ME F o R SALE AT Moo RES NEIGHB o RH oo D
So URCE : ZILL o W - N o VEMBER 2023
HOUSING & NEIGHBORHOOD PLANS
Housing Initiative Study (May 2020)
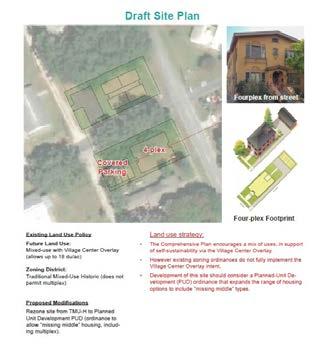
In May 2020, the Zephyrhills CRA conducted a Housing Initiative Study to evaluate redevelopment potential across three key sites within the CRA. The study aimed to generate interest from the development community by exploring innovative housing options tailored to the local workforce, individuals, and families seeking a small-town lifestyle with convenient access to regional employment hubs such as Tampa, Lakeland, and the Four Corners area. The analysis served as a strategic step toward attracting investment and diversifying the area’s housing stock to support long-term community growth.
Oakside-Zephyr Park Neighborhood Plan (2022)
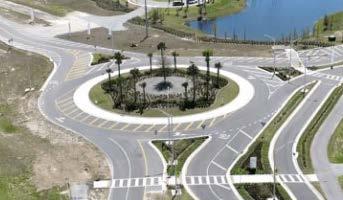
The Zephyrhills CRA developed a neighborhood-focused initiative titled Zephyr Park Next to guide the next phase of revitalization and implementation strategies for Zephyr Park and the surrounding Oakside neighborhood. The plan outlines a series of transformative “next moves,” including improvements to Zephyr Park, the development of two catalytic land assembly sites, a Complete Street redesign for 5th Avenue, a gateway roundabout at US 301, and alleyway placemaking strategies. These efforts are aimed at enhancing the public realm, improving connectivity, and fostering a more vibrant, resilient, and inclusive community environment.
Importantly, the projects and strategies identified in the Zephyr Park Next plan will be incorporated into the CRA Master Plan update, ensuring alignment with broader redevelopment goals and securing a framework for phased implementation and funding.
Connectivity
The transportation network within the CRA plays a vital role in shaping connectivity, mobility, and the overall character of the district. Designed to support local access and regional movement, the network integrates a hierarchy of corridors, neighborhood streets, alleys, and emerging multimodal infrastructure. While key corridors like Gall Boulevard and 5th Avenue serve as the system’s backbone, the CRA also includes underutilized alleys and a fragmented pedestrian and bicycle network that present opportunities for reinvestment and enhancement. Together, these elements form the foundation for a more connected, accessible, and vibrant community, aligned with the CRA’s broader goals for revitalization and sustainable growth.
Corridors and Neighborhood Streets
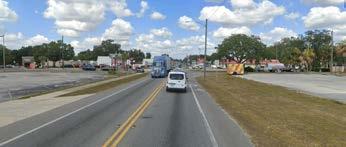
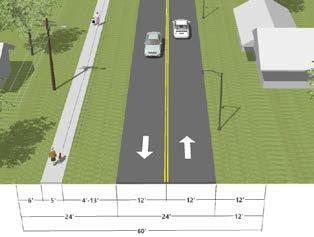
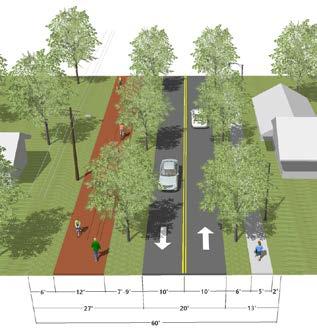
The Zephyrhills CRA transportation network is structured around two primary corridors—Gall Boulevard and 5th Avenue—supported by neighborhood streets, alleys, and limited bicycle facilities. Gall Boulevard is the main northsouth commercial thoroughfare, featuring a two-lane configuration with a center left-turn lane at intersections and dedicated bike lanes. However, the corridor lacks curbs, gutters, and street trees, with sidewalks on only one side. Recognizing the need for improvement, the City and Pasco County MPO have developed a design concept plan for Gall Boulevard (US 301) to enhance the corridor’s functionality and appearance. The project is currently listed in the Pasco MPO Multimodal Transportation List of Project Priorities, and it is aimed to be funded by the Year 2027.
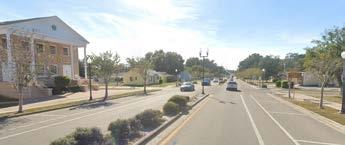
5th Avenue, the primary east-west corridor, exemplifies the complete street concept. Its western segment includes a two-lane road with a landscaped median, on-street parking, and dedicated bike lanes. The corridor is further enhanced by pedestrian-friendly features such as streetlights, trees, and sidewalks, creating a welcoming environment for pedestrians and cyclists. As the corridor transitions into Main Street in the eastern segment, additional streetscape enhancements emerge, including bricked intersections and expanded landscaped areas, elevating the space’s visual character and usability.
Beyond these main corridors, the CRA includes a secondary neighborhood street network that connects residential areas to key destinations like parks, schools, and civic facilities. These streets support traditional neighborhood development patterns and reinforce walkability.
GALL BLVD
5TH AVENUE - WEST
+ Neighborhood Streets + Alleys
+ Existing and Proposed Bike Lanes
+ Existing Multi-Purpose Path
+ Existing Sidewalks
+ Proposed Sidewalks
+ City Hall + RB Stewart Middle School + Zephyrhills High School + West Zephyrhills Elementary School
ZEPHYR CREEK
ZEPHYR PARK
PARK
SHEPPARD PARK
Alleys
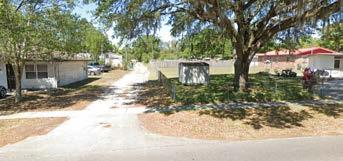
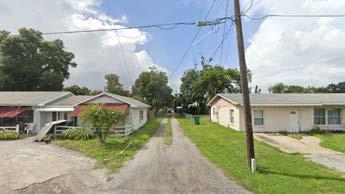
The CRA also features a system of alleys that provide essential local access and service functions, particularly for properties fronting the main commercial and residential corridors. These alleys, while offering potential for improved circulation, deliveries, and utility access, are currently underutilized and largely unimproved. Despite their current condition, these alleys represent a valuable opportunity for strategic reinvestment. With targeted enhancements, they could support rear access to businesses, reduce congestion on primary streets, and even serve as alternative pedestrian or bicycle routes.
Bicycle and Pedestrian
Today, only Gall Boulevard and 5th Avenue have on-street bike lanes within the CRA. The existing sidewalk network is fragmented, limiting safe and continuous pedestrian access. Recognizing these gaps, the City has identified potential new bikeway corridors on streets such as 6th Street, 12th Avenue, and 16th Avenue. These improvements aim to expand the multimodal network and enhance connectivity throughout the CRA. To guide these efforts, the City developed a Sidewalk Master Plan in 2020 outlining recommendations and implementation strategies for completing the sidewalk and trail network within the CRA. The plan serves as a long-term planning tool to improve walkability and accessibility, supporting the CRA’s broader connectivity and inclusive mobility goals.
Streetscape
Streetscape elements play a vital role in shaping the visual character, comfort, and walkability of the CRA. Existing features such as sidewalks and street lighting contribute to the area’s charm and enhance the pedestrian experience. However, there are clear opportunities for improvement, including better sidewalk maintenance, expanded street lighting coverage, and enhanced streetscape aesthetics.
SUB-STANDARD SIDEWALK @ 10TH ST AND SCH oo L
ALLEYS To DAY
GALL B o ULEVARD BIKE LANES
5TH AVENUE BIKE LANES
Intersections and Crosswalks
Intersections and crosswalks within the CRA play a critical role in ensuring safe and efficient movement for all users, particularly pedestrians and cyclists. While some areas—such as the eastern segment of 5th Avenue—feature enhanced intersections with decorative paving and landscaping, many others lack consistent pedestrian infrastructure. Marked crosswalks are limited, and several intersections do not include curb ramps, pedestrian signals, or adequate signage. These gaps create barriers to walkability and reduce safety, especially near schools, parks, and commercial areas. Improving intersection design and expanding the network of clearly marked, ADA-compliant crosswalks will be essential to creating a safer, more connected environment that supports the CRA’s goals for multimodal accessibility and neighborhood revitalization.
Streets Flooding
Street flooding is recurring after a heavy rain event or a hurricane. Flooding remains a concern in the CRA, especially following Hurricanes Milton and Helene in September and October of 2024, which exposed weaknesses in the stormwater infrastructure. Several streets experienced prolonged flooding, disrupting access and damaging roadways. Low-lying areas and older neighborhoods were particularly affected. Addressing these issues through improved drainage and resilient design is essential to support safe, reliable connectivity and long-term community sustainability.
N o SIDEWALKS o N STREETS
INTERSECTI o N @ 10TH ST AND 9TH AVE
TRANSPORTATION PROJECT
uS 331 (Gall Boulevard) Design Concept Plans (2019)
The City of Zephyrhills created a series of proposed one-way pair street redesign concepts for Gall Boulevard. The new street design embraces a complete street approach. According to the U.S. Department of Transportation, Complete Streets are streets designed and operated to enable safe use and support mobility for all users. Those include people of all ages and abilities, regardless of whether they are traveling drivers, pedestrians, bicyclists, or public transportation riders.
PILOT PROJECT
Little-but-Load Master Plan (December 2020)
This master plan outlines a series of small-scale, low-cost, and low-risk interventions designed to enhance the downtown public realm. The goal is to create a central gathering space where people of all ages can come together to celebrate the community through music, art, and food. The plan identifies four catalyst sites, each featuring targeted projects: Lake Necessity, The Bakery, The Alleyway, and the 7th Street Road Diet. These interventions aim to activate underutilized spaces and strengthen the cultural and social fabric of downtown Zephyrhills.
Small area plan for key sites in Downtown Zephyrhills
• Draft plan published in June 2020;
• Seeks to build-off recent investments in the downtown (new City Hall, Library, and Fire Station);
• Offers “little” (inexpensive) but “loud” (creative) ideas for development.
Little but loud principles
1. Small is a big first step
2. Focus on walkable connections
3. Layer over and fill-in gaps
4. It takes a village (partnerships!)
Little but Loud Project Concepts
1
2
Backyard (the backyard to Main Street)
Alleyway (a walkable midblock connection)
3 Lake Necessity (an “eye sore” into an icon)
4 7th Street Diet (calming traffic at 6th Ave & 7th St)
SIDEWALK PROJECT
2020 Sidewalk Plan
In 2020, the City of Zephyrhills completed a Sidewalk Master Plan to serve as a long-term planning tool to increase the walkability and accessibility of properties within the CRA.
There is a need within the CRA to provide safe routes for pedestrians in the community, especially to key destinations such as schools and parks. Sidewalk connectivity to key destinations was one of the most important factors taken into consideration in the analysis.
Goals and Objectives
The Sidewalk Master Plan outlined recommendations and implementation strategies for completing the sidewalk and trail network within the CRA. The goals and objectives that guided the development of the plan included:
• Create an environment that is safe and comfortable for residents and visitors
• Increase walkability and pedestrian networks to provide alternatives to driving
• Incorporate public health elements including physical activity and educational access
• Increase economic opportunity, employment, and foot traffic for businesses
• Create safe pedestrain routes to schools, parks, and key destinations
Grant and Funding Sources
In order to implement this plan, grants and funding sources should be considered to aid in the construction of new sidewalks and trails. Various available grant and funding opportunities are listed below, yet, this list is not intended to be exhaustive.
• Safe Routes to Schools Programs (SRTS)
• Local Agency Program (LAP)
• The Recreational Trails Program (RTP)
• Community Development Block Grant (CDBG)
Prioritization Rating System
Utilizing City GIS data, an inventory was taken recording the street name and length for each of the missing sidewalk and trail segments. A prioritization rating system was then designed that took the following items into consideration for missing segments:
• Connectivity to key destinations
• Number of existing sidewalks that connect/intersect
• Missing sidewalks on both sides of the street
• Roadway classification
A vital part of this plan was the design of the prioritization rating system. The creation of the prioritization rating system involved input from City staff and professionals in the field. The prioritization rating system measured missing sidewalk and trail segments on a Low (1) to High (3) scale. The prioritization rating system included the following criteria:
Low Priority
• 0.25-mile radius connecting to the City Hall/library
• Connects to 1–2 existing sidewalks
• Secondary roadway
Medium Priority
• 0.25-mile radius connecting to Zephyr or Hercules Park
• Connects to 3 or more existing sidewalks
• Primary roadway
• Street segments that have no sidewalk on either side
High Priority
• 0.25-mile radius connecting to schools
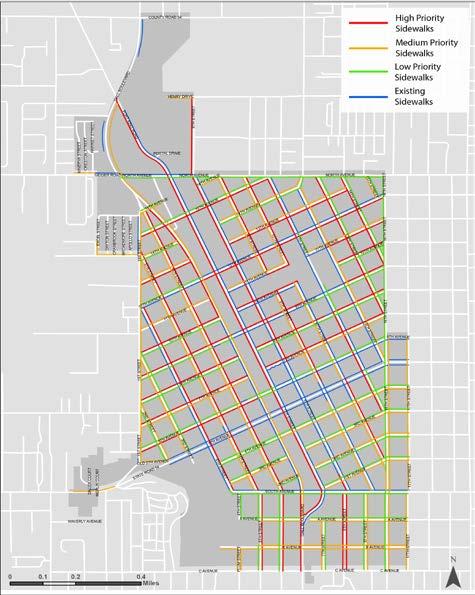
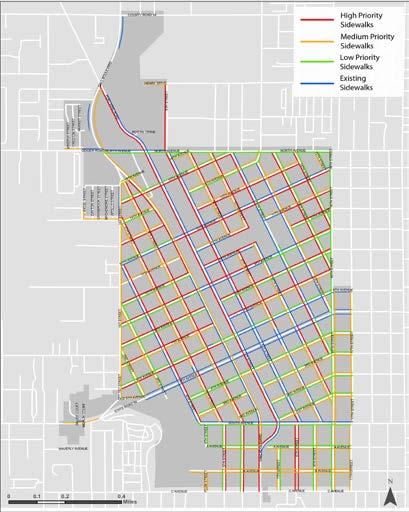
F IG u RE 14. SIDEWALK PRIORITIZATION MAP
The prioritization for completing the missing sidewalk network will ensure that the most vital streets and locations have sidewalk first. The map below illustrates all the existing sidewalks and new proposed sidewalks color coded by level of priority. The circles on the map represents 0.25mile radio from schools, parks and City complex.
Overall, the prioritization for completing the missing sidewalk network will ensure that the most vital streets and locations have sidewalks first and that eventually every street in the CRA is walkable. A composite map, Map 11, is provided for reference.
Project Status:
As of 2025, the City invested nearly $1.8 million in sidewalk construction within the CRA. All high- and medium-priority segments identified in the 2020 Master Sidewalk Plan are now completed.
The Comprehensive Plan of the City underscores the significance of Recreation and Open Space, recognizing their pivotal roles in our daily lives.
Parks and Open Spaces
Zephyrhills proudly provides a diverse array of parks and green spaces tailored to both residents and visitors. These parks serve as ideal settings for recreational activities, sports, and moments of relaxation. Notable among the city’s offerings are Zephyr Park, Alice Hall Community Center Park, Hercules Park, Forrest Lake Park, Sam Pasco Park, Krysta M. Hankee Memorial Park, and Veterans Memorial Park.
Parks in the CRA
The Zephyrhills Community Redevelopment Agency (Agency) area is home to the city’s two largest parks— Hercules Park, a 12-acre site formerly an aquatic center now transformed into a new city park, and Zephyr Park, a 34-acre space featuring a scenic lake connected to Zephyr Creek. Also within the area is Shepard Park, a smaller 2-acre neighborhood park located along Gall Boulevard. In addition to these green spaces, the district includes Clock Plaza, a 0.3-acre plaza on Main Street surrounded by local businesses, offering a charming “Town Square” atmosphere for tourists and local shoppers alike, complete with shade trees and picnic tables.
In recent years, the City and CRA have committed to redesigning and improving Zephyr and Hercules Park, recognizing the transformative impact of park investments on the revitalization of the CRA.
The following pages include a map showing the locations of CRA parks and open spaces, along with detailed descriptions of each park.
ZEPHYR PARK
HERCULES PARK
SHEPARD PARK
CLOCK PLAZA
Zephyr Park
Zephyr Park, spanning 34 acres, is home to the Alice Hall Community Center, offering a space for both visitors and residents to engage in exercise and recreation. As one of the city’s iconic and historically significant locations, the park boasts a remarkable oak tree, the serene Zephyr Lake, various walkways, fishing spots, picnic and barbecue areas, tennis courts, and playgrounds. In 2015, the City initiated a master planning process to revamp the park, focusing on enhancing connections to downtown and neighboring areas, addressing stormwater considerations, and providing topnotch facilities.
Hercules Park
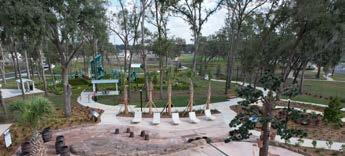
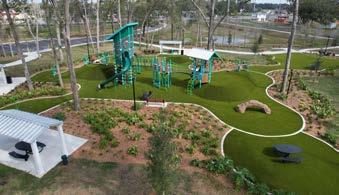
Encompassing 12 acres adjacent to Zephyrhills High School and Woodland Elementary School, Hercules Park was acquired by the City of Zephyrhills from Pasco County in 2018. Originally developed as a County aquatics center that closed in 2009, the site also has historic roots dating back to the 1940s as housing for Hercules Power Company employees. Following the City’s acquisition, a park master plan was completed, and the new park officially opened on February 2025. Today, the park features a playground, splash pad, walking trails, picnic shelters, and open green space, serving as a vibrant recreational asset for the community.
Shepard Park
Located in the southern portion of the CRA at Gall Boulevard and A Avenue, Shepard Park is a 2-acre passive neighborhood park with a scout activity building, picnic shelters, playground equipment, a basketball court, and open play space. While Shepard Park continues to serve the surrounding community, several facilities—particularly the buildings and site amenities—are aging and in need of repair or replacement. Future improvements to park should be considered to better meet community needs, consistent with recommendations identified in the City’s Parks Master Plan.
Henry Dr
ZEPHYR PARK AERIAL (NTS)
HERCULES PARK AERIAL (NTS)
SHEPARD PARK AERIAL (NTS)
C Ave
ZEPHYR PARK
ZEPHYR CREEK 5thAve South Ave
Clock Plaza
Clock Plaza is a half-acre urban park located on Main Street in Zephyrhills’ historic downtown. Designed to resemble an old-fashioned town square, it features a gazebo-style bandstand, a decorative clock, landscaped areas, and convenient downtown parking. Shaded by oak trees, the plaza offers picnic tables—perfect for a lunch break or a rest while exploring local shops. The bandstand hosts live entertainment throughout the year during Main Street events, parades, and community gatherings.
Strong Storm Events Affecting the Parks and Open Spaces
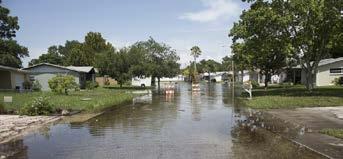
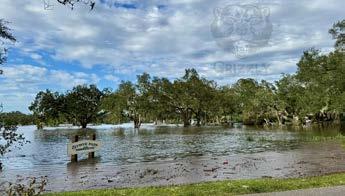
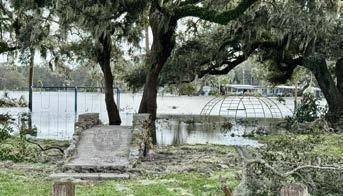
In October 2024, the City of Zephyrhills faced substantial damage to its parks and surrounding areas due to Hurricanes Milton and Helene. Among the hardest hit was Zephyr Park, which experienced extensive flooding. Low-lying sections of the park—including walking trails, picnic areas, and parts of the lakefront—were submerged, rendering much of the park inaccessible. Benches, playground equipment, and restrooms were partially underwater, and the park’s iconic fountain was surrounded by standing water.
The repeated flooding sparked frustration among residents, many of whom called for long-term infrastructure improvements to better protect public spaces from future storm impacts.
Looking ahead, the design of parks within the CRA must prioritize resilience to extreme weather. Future planning should incorporate flood-resistant landscaping, permeable surfaces, elevated structures, and improved stormwater management systems. These measures will help ensure that parks remain safe, accessible, and functional even during periods of heavy rainfall and severe storms— protecting both public investment and community wellbeing.
ZEPHYR PARK FLoo DING (o CTo BER, 2024)
ZEPHYR PARK FLoo DING (o CTo BER, 2024)
CLo CK PLAZA
ZEPHYR PARK PLAN
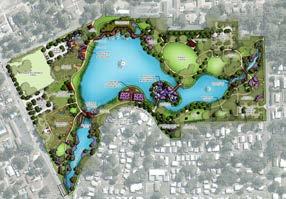
Since 2015, the City has explored various ideas to enhance the 34-acre Zephyr Park at 38116 Fifth Avenue. The CRA envisions transforming the community park into something more—a place within walking distance of the city’s downtown core, blending recreation, fun, and art. The Master Plan shows features such as an event lawn, family fun zone, wedding lawn, dog park, history garden, splash pad, fitness zone, bandshell, and pedestrian bridges. Additionally, there are plans for boardwalks and terraces surrounding Lake Zephyr, among other enhancements.
Project Status: As of 2025, the City has committed $16 million toward improvements at Zephyr Park and also secured an additional $2.65 million, plus $600,000, through State appropriations to support the project.
Stormwater & Flooding
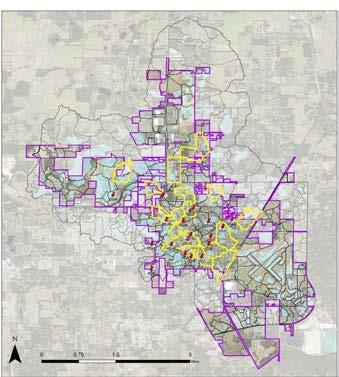
The City of Zephyrhills has long recognized the need to address persistent flooding and water quality challenges through a comprehensive stormwater management strategy. In February 2023, the City adopted a Stormwater Master Plan that assessed existing conditions and established a four-tier level of service framework for both flooding and water quality. The plan identified 20 stormwater basins city-wide, ranking the top 10 based on severity—many of which are located within the Community Redevelopment Area (CRA) boundaries. To mitigate these issues, nine Best Management Practices (BMP) projects were proposed, including major infrastructure upgrades such as reinforced concrete piping, new retention ponds, and culvert upsizing. Notable CRA-focused projects include a diversion system from Lake Zephyr to new retention areas, with estimated costs ranging from $9 million to $14.5 million. Additional target localized improvements to reduce flooding and improve pollutant control, with funding opportunities identified through agencies such as SWFWMD, ARPA, and BRIC.
The urgency of implementing these improvements was underscored in October 2025, when Hurricanes Helene and Milton struck in rapid succession. The storms overwhelmed the city’s aging stormwater infrastructure, particularly in the CRA, where several basins reached or exceeded capacity. Zephyr Park and surrounding neighborhoods experienced severe flooding, with prolonged standing water and damage to public amenities. These events highlighted the vulnerabilities in the current system and reinforced the need for resilient, forward-looking stormwater solutions to protect public spaces and infrastructure from increasingly frequent and intense storm events.
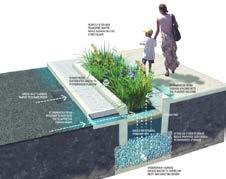
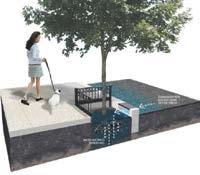
For basin-based communities like Zephyrhills, proactive stormwater planning is essential. These areas are naturally prone to water accumulation, making them especially vulnerable during high-intensity rain events. Future planning must prioritize adaptive infrastructure that can accommodate both current and projected climate conditions. This includes expanding retention and detention capacity, integrating green infrastructure such as bioswales and rain gardens, and designing overflow pathways that minimize damage to public and private property. By aligning capital improvements with basin-specific data and risk assessments, cities like Zephyrhills can build a more resilient stormwater system that protects residents, preserves public spaces, and supports long-term sustainability.
STORMWATER PLAN
Stormwater Master Plan (February 2023)
The city-wide plan, created by Kimley-Horn, aimed to determine flood risk, evaluate the level of service, and develop Best Management Practices (BMPs) to reduce flooding and improve water quality for both the built and natural environment. The plan provided data for criteria for a four-tier system establishing a level of service relating to flooding and water quality. Twenty basins within the city were identified that met a threshold indicating a certain level of stormwater impact. The top ten basins were further ranked as to the relative extent of flooding and water quality; the highest-ranked ones appeared to be within the CRA boundaries. There were nine specific BMPs projects to consider for implementation.
FLoo DING (SEPTEMBER 2024)
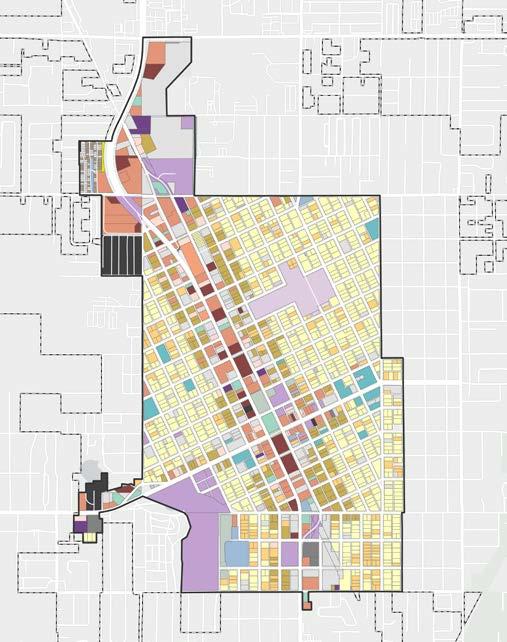
2.3 Land u se, Zoning and Standards
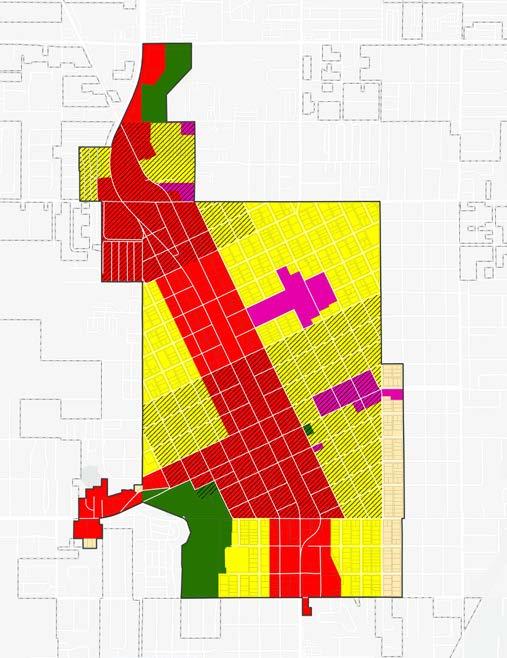
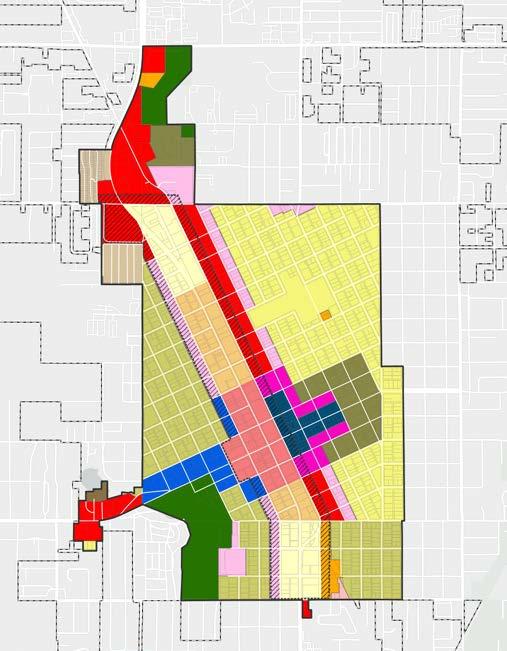
This section provides an overview of the existing land uses, zoning, future land use, and standards regulations affecting the Zephyrhills Community Redevelopment Agency’s (Agency) development.
The current zoning in the CRA is a blend of Euclidean zoning, Form-Based Code, and Traditional Downtown overlays. The Future Land Use revolves around Mixed-use and Residential Urban designations, with additional categories for Public/Semi-Public, Residential Suburban, Recreation, and Open Space. The Zephyrhills Main Street area falls under the Public/Semi-Public category, and a Village Center Overlay covers half of the CRA.
To guide development in accordance with the 2016 CRA Master Plan, a Design Standards document was created and adopted. These standards provide a framework for enhancing the built environment, achieving quality design, protecting property values, and creating a high-quality atmosphere.
Concentration of Existing uses
The map on this page illustrates the areas of concentration for commercial, office, and industrial; as well as residential uses, including multi-family and single family (e.g., detached single family and attached townhomes) within the CRA as of YTD 2023 estimates.
A breakdown of additional uses are shown in the Existing Land Use Map on the following page.
LEGEND
+ Single-Family Residential
+ Multi-Family Residential
+ Commercial
+ Office
+ Industrial
Existing Land use
As of 2023, the prevailing land uses within CRA contained residential (single family, multi-family, and mobile homes [38.45%]); general retail and office, including parking (18.6%); properties owned by the County or State, including roads (14.6%); vacant land (14.5%); mixed-use (8%); schools and churches (5.4%); open space (2%); and warehouses (1%).
Figure 17 graphically presents the percentage distribution across these general categories, while Figure 18, Existing Land Use Map, visually represents the locations of these uses.
+ Single Family Residential (30%) + Vacant (14.5%)
+ County/State/Fed Land (9.8%) + Shopping/Retail (9.3%)
+ Mixed Use (8%) + Multi-Family Residential (7.5%)
The Comprehensive Plan Future Land Use Element aims to establish the geographic framework for growth in Zephyrhills. Future Land Use designations guide City decision-making by defining the appropriate location, scale, and character of development. These designations ensure that new development is compatible with surrounding land uses, natural environments, and the availability of public facilities and services.
+ Village Center Overlay
+ Residential Urban
+ Residential Suburban
+ Mixed Use
+ Public/Semi-Public
+ Recreation and Open Space
F IG u RE 19. CRA F u T u RE LAND u SE MAP
Zephyrhills’ Community Redevelopment Agency (Agency) consists of six Future Land Use Categories, with Mixeduse and Residential Urban being the predominant ones. Other categories include Public/Semi-Public, Residential Suburban, and Recreation and Open Space. See Figure 19: CRA Future Land Use Map.
Mixed-use designations are assigned to parcels along Gall Boulevard and its vicinity, covering the Plaza District area and the western section of 5th Avenue. Residential Urban applies to all neighborhoods within the CRA. The Zephyrhills Main Street area falls under the Public/ Semi-Public category, while a Village Center Overlay encompasses half of the overall CRA.
Village Center Overlay
The Village Center Overly is designated in areas, like the CRA, that are intended to be well-identified and largely self-contained residential and commercial neighborhoods. These centers would encourage a wide variety of retail, services, employment, governmental services, restaurants and entertainment, and cultural/recreational opportunities. The mixing of uses can add variety and vitality to an area, making it a more attractive and interesting place to live. Residential densities in Village Centers would be high enough to encourage walking, support efficient transit service, and provide adequate markets for neighborhood stores. Convenient commercial and personal services, accessible work sites and residential units, and convenient cultural or recreational amenities would enhance the attractiveness of infill development. Infill development would add density and a balanced mix of uses to Village Centers.
The underlying land use category would dictate the range of uses in designated Village Centers. The underlying land use category comprising most areas within the Village Centers shown on the Future Land Use Map is the Mixed Use category. Like the Village Center Overlay, the Mixed Use category aims to achieve a more balanced mix of uses to increase convenience and provide greater transportation choices.
The Planning Department is proposing to eliminate this Village Center Overlay category and replace its function with an illustrative Place Type (nonregulatory) in the Comprehensive Plan update; this proposal is anticipated to be approved.
Zoning
The CRA combines Euclidean zoning, a Form-Based Code within the US 301/Gall Boulevard corridor, and a Traditional Downtown overlay. Euclidean zoning entails singular land use per area, while the Form-Based Code is a land development regulation centered on physical form, prioritizing it over the separation of uses. The Traditional Downtown overlay was created later to provide incentives to help promote downtown redevelopment opportunities. The following pages provide an overview of all Euclidian zoning Categories and Gall Boulevard Form-Base Code.
F IG u RE 20. CRA ZONING MAP
Euclidean Zoning Categories
There are 10 zoning categories within the CRA, including two commercial categories (C-2 and C-3), one office category (OP), three residential categories (R-1, R-2, and R-3), three traditional downtown overlays (TMU, TMU-H, and TCBD-H), and one recreation category.
• SINGLE-FAMILY RESIDENTIAL (R-2): This category is established to identify areas of the city appropriate for medium-density single-family development. The maximum density of development shall be five dwelling units per gross acre, with a maximum of 60% impervious area.
• MEDIUM DENSITY RESIDENTIAL (R-3): This category is established to identify areas of the city appropriate for medium-density mixed single-family and duplex development. The maximum density shall be seven singlefamily detached or 10.5 duplex dwelling units per gross acre, with a maximum of 60% impervious area.
• MULTI-FAMILY RESIDENTIAL (R-4): This category is established to identify areas of the city appropriate for higher density mixed duplex and multi-family residential development. The maximum density of development shall be 20 units per gross acre, with a maximum of 75% impervious area.
• COMMUNITY COMMERCIAL (C-2): This category is established to identify areas of the city appropriate for location of commercial activities which serve the entire community and surrounding trade area, thereby generating volumes of vehicular traffic requiring direct access to arterial roadways. Uses in the C-2 district are primarily retail sales of goods and services directly to the ultimate consumer. The gross floor area of building(s) shall not exceed 50% of the land area of the site upon which the building(s) is/are
• GENERAL COMMERCIAL (C-3): This category is established to identify areas of the city appropriate for location of commercial activities with potential land use conflicts resulting from truck traffic, materials storage, emission of noise, odor or air pollutants, or other environmental and public safety considerations. The total gross floor area of building(s) shall not exceed 50% of the land area of the site upon which the building(s) is/are erected.
• OFFICE/PROFESSIONAL (OP): This category is established to identify areas of the city appropriate for professional services and related commercial activities, which produce minimal conflict with a residential environment. The gross floor area of a nonresidential building(s) shall not exceed 50% of the land area of the site upon which the building(s) is/are erected. Multi-family residential development in an OP district permitted as a conditional use shall comply with all requirements of the R-4 district.
• TRADITIONAL MIXED USE (TMU): This district includes those areas adjoining the city’s traditional central business district and provides transition of intensity and uses to the surrounding residential areas. Uses and use intensity within the district are intended to complement the traditional downtown.
• TRADITIONAL MIXED USE-HISTORIC (TMU-H): This district includes those areas adjoining the city’s traditional downtown that are also within the boundaries of the historic district. This district places emphasis on and the preservation of historic resources and the character of the historic district as a part of a healthy city center.
• TRADITIONAL CENTRAL BUSINESS DISTRICTHISTORIC (TCBD-H): This district includes those areas within the city’s traditional downtown that are also within the boundaries of the historic district. The district places emphasis on and the preservation of historic resources and the character of the historic district as a part of a vibrant central business district.
• RECREATION/CONSERVATION (RC): This category is established to identify areas of the city that have been legally committed to be retained for open space, whether by public ownership, lease hold interest or as a condition of the City’s approval of a site-specific development.
Form Based Code
The Gall Boulevard Form-Based Code was officially adopted by the City in January 2016, following a recommendation outlined in the 2016 CRA Master Plan.
The intent of the form-based code is to contribute to the orderly and controlled growth and development of the city in accordance with the comprehensive plan and smart growth principles.
The primary objective of the form-based code is to implement the regulating plan for the US 301/Gall Boulevard corridor through the establishment of certain regulations, procedures, and standards for reviewing and approving all development orders, permits, and use of land within the area depicted in regulating plan district map.
Regulating Plan
The regulating plan comprises a series of maps outlining the different district types or areas, the street system hierarchy, building placement and frontages, and entrances. Here are the three different regulation plans included in the Gall Boulevard form-based code.
• District Types (Figure 21)
• Street Types (Figure 22)
• Frontange Types (Figure 23)
There are three regulating district areas, which are:
• T-3 SUBURBAN: Zone consisting of low-density residential areas adjacent to higher zones that some mixed-use. Home occupations and outbuildings are allowed. Planting is naturalistic and setbacks are relatively deep. Blocks may be large, and the roads may be irregular to accommodate natural conditions.
• T-4 GENERAL URBAN: Zone consisting of a mixed-use but primarily residential urban fabric. It may have a wide range of building types: single, sideyard, and rowhouses. Setbacks and landscaping are variable. Streets with curbs and sidewalks are defined medium size blocks
• T-5 URBAN CENTER: Zone consisting of a higherdensity mixed-use building that accommodates retail, offices, townhomes, and apartments. It has a tight network of streets, with wide sidewalks, steady street tree planting, and buildings set close to the sidewalks.
F IG u RE 21. DISTRICT TYPES REG u LATING PLAN
The Street Types map illustrates the locations of the three different street categories and intersections.
• Type A Street: These are the primary streets, Gall Boulevard and 5th Avenue—where the primary frontage and entrance of the buildings should be placed.
• Type B Street: These are secondary streets, with less traffic that bisects the primary corridors—where the secondary frontage and entrance of the buildings should be placed. In the plan, these streets are spaced every two blocks.
• Type C Street: These are tertiary streets intended to provide access to parking and service areas of the buildings.
The Frontage Type map illustrates four different frontage types.
• Retail
• Commercial Mixed-Use
• Residential Mixed-Use
• Residential
F IG u RE 22. STREETS TYPES REG u LATING PLAN
F IG u RE 23. FRONTAGE TYPES REG u LATING PLAN
CRA Design Standards
The Design Standards were created to ensure that public and private development projects implement the Goals, Objectives, Policies, and Vision of the 2016 CRA Master Plan.
Goals
The Standards aim to provide a framework for:
• Enhancing the quality of the built environment.
• Achieving quality design.
• Protecting and improving property values.
• Providing investor and property owner confidence through design continuity.
• Creating high standards for designing and constructing an aesthetically pleasing atmosphere secure for pedestrian activity, resulting in an energetic social environment and profitable business setting.
Standards Organization
The Design Standards are categorized into General, Commercial, and Residential. Under each category, different elements are regulated, such as access, circulation, parking, lighting, signage, building form, architecture, landscape, and screening; as well as other miscellaneous elements, such as pools, accessory dwelling units, and drive-throughs, among others. See Figure 24 for a complete Standards Organization Diagram, and below for the general descriptions of each standards category.
• General Standards: Standards of General Applicability encompass the CRA as a whole and are not specific to either commercial or residential development and redevelopment. These Standards are more general and or broad in nature.
• Commercial Standards: Commercial Standards are those that apply to Commercial (i.e., non-residential: commercial, retail, office or similar) and Multifamily (more than two residential dwelling units within a single building) development within the CRA boundary. Commercial Standards also apply to vertically integrated mixed-use development.
• Residential Standards: Residential Standards are those that apply to more traditional forms of residential development, including single family and two-family development.
WALL SIGNAGE REGULATI o N
o M F o RM-BASED
GENERAL
SITE ACCESS, CIRCULATION, AND PARKING
• Vehicular Access & Driveway
• Alleys
• Transit Shelters
COMMERCIAL
SITE DESIGN
• Block Configuration
• Building Placement
• Pedestrian Access
• Parking
• Bicycles
LIGHTING (INCLUDING SIGNALS)
• General
• Street Lighting
• Pedestrian Level Lighting
BUILDING FORM
• Mass
• Scale
• Height
• Orientation
• Articulation
ARCHITECTURE
• Styles
• Facade Design
• Features (Gutters, Awnings & Shutters and Windows & Doors)
• Entrances
• Building Materials
• Building Colors
• Roof Design
RESIDENTIAL
SITE DESIGN
• Building Placement
• Fencing
• Parking
• Sidewalks
BUILDING FORM
• Mass
• Scale
• Height
• Orientation
• Articulation
ARCHITECTURE
• Styles
• Facade Design
• Features (Gutters, Awnings & Shutters and Windows & Doors)
• Porches
• Lighting
• Utilities
• Grand Trees
• Canopy Roads TREE PRESERVATION
LANDSCAPE
• General
• Frontage Landscape
• Parking Lot Landscape
• Screening
• Streetwalls
• Landscape Materials
LANDSCAPE
• General
• Screening
• Landscape Materials
SIGNS
• General Standards
• Type of Signage
• Size and Location
• Prohibited Signs
• Typical Wayfindig and Gateway Signage
SITE LIGHTING
• Pedestrian
• Parking Lot
• Canopy and Awning
Vision, Goals, Objectives & Actions 03.
This chapter introduces the strategic framework that will guide the Zephyrhills Community Development Agency (Agency) revitalization efforts in the years ahead. Grounded in a clear vision and a mission, the plan outlines a comprehensive and actionable approach to redevelopment. At the foundation of this framework are the Guiding Principles, which serve as core values to shape decision-making and inspire collaboration among stakeholders. These principles reflect the Agency’s long-term aspirations and provide a unifying structure for all strategic elements.
Building upon this foundation, the plan defines five strategic goals and 13 supporting objectives that direct efforts in project implementation, development planning, policy formulation, and incentive design. To bring these goals to life, the plan identifies Actions— specific, measurable steps that translate vision into results. Projects are further categorized into Basic, Progressive, and Transformational tiers to reflect their scale, complexity, and potential impact.
Finally, the plan highlights Big Moves—bold, catalytic initiatives designed to drive long-term community and economic transformation, reinforcing the Agency’s commitment to meaningful and lasting change.
3.1
Plan Organization
The 2026 Zephyrhills CRA Master Plan establishes a strategic framework to guide redevelopment efforts over the next decades. Grounded in a clear vision—to foster an exceptional quality of life in the Zephyrhills CRA by creating a vibrant, safe, and inclusive community that honors its heritage and celebrates its future—and a mission focused on enhancing well-being, economic vitality, and connectivity, the plan outlines a comprehensive approach to revitalization.
The CRA Master Plan update is structured around five core components that collectively guide the Agency’s revitalization strategy and long-term vision.
Plan Organization
• Vision and Mission: The vision statement articulates the CRA’s long-term aspirations, describing the desired future for the district and the transformative impact of revitalization. The mission statement defines the CRA’s present-day purpose—what it seeks to accomplish through redevelopment efforts, strategic partnerships, and community-focused programs. Together, these statements establish the strategic foundation of the CRA Master Plan update, ensuring that all goals, policies, and projects are aligned with both current needs and future ambitions.
• Guiding Principles: The Guiding Principles serve as core values that shape decision-making and inspire stakeholders. They reflect what the CRA aims to achieve or become over the next decade and provide a unifying framework under which all goals, objectives, and strategies are developed.
• Goals and Objectives: The CRA’s mission is supported by five strategic goals and 13 corresponding objectives. These elements direct the CRA’s efforts in project implementation, development planning, policy formulation, and the design of incentive programs—ensuring a focused and measurable approach to community revitalization.
• Actions : Actions are the specific steps, initiatives, or tasks undertaken to achieve the broader goals and objectives of the CRA Plan. They represent the tangible efforts that move the plan from vision to implementation. These actions guide the CRA’s work across project execution, development planning, policy formulation, and the creation of incentive programs—ensuring a focused, measurable, and results-driven approach to community revitalization. To reflect the varying scale, complexity, and potential impact of proposed initiatives, projects are organized into three tiers:
+ Basic – Foundational improvements that deliver immediate, visible benefits.
+ Progressive – Intermediate projects that build momentum and enhance community visibility.
+ Transformational – Ambitious, high-impact efforts with the potential to redefine the district’s character and future.
• Big Moves: The Big Moves component highlights transformative initiatives designed to catalyze longterm community and economic vitality.
3.2 Vision, Mission and Guiding Principles
The table below outlines the Zephyrhills Community Redevelopment Agency’s Vision, Mission, and Guiding Principles.
Vision Mission
To foster an exceptional quality of life in the Zephyrhills Community Redevelopment Agency by creating a vibrant, safe, and inclusive community honoring our heritage and celebrating our future.
The Zephyrhills Community Redevelopment Agency is dedicated to enhancing the well-being, health, and economic vitality of our residents, businesses, and visitors through thoughtful investments in public spaces, diverse housing, and accessible amenities. We are committed to fostering a connected, sustainable, and resilient community through balanced development and infrastructure that enriches daily life and reflects the unique character of the CRA.
Guiding Principles
PROSPERITY
Foster a Thriving Local Economy
Foster a dynamic local economy by supporting existing and attracting new businesses, revitalizing commercial corridors, and creating destinations that enhance community engagement and economic opportunities.
HERITAGE
Preserve the Historic Character
Dedicate efforts to preserving the historic downtown character and rich residential heritage of Zephyrhills, ensuring this cultural identity remains a central aspect of community development.
DIVERSITY
Promote Balanced Investment
Ensure balanced investment in neighborhoods that encourages housing diversification, providing equitable opportunities for all residents regardless of background or socioeconomic status.
RESILIENCE
Prepare for Climate Adaptation
Invest in sustainable and climate-resilient infrastructure that promotes long-term viability, enhances the environment, and improves community resilience against climate impacts, and adaptation policies.
PLACEMAKING
Create Quality Places
Design and manage public spaces—like parks and streets—to enhance connectivity, health, and community identity, transforming them into vibrant, inclusive places that celebrate culture, support the economic vitality, and improve quality of life.
3.3 Big Moves
This rendering illustrates the Agency’s proposed Big Moves— transformative initiatives designed to drive progress toward the Agency’s strategic objectives
1
GALL BO u LEVARD MIXED AND LIVABLE CORRIDOR PLACE
Transform and revitalize Gall Boulevard into a vibrant destination and mixed-use corridor by introducing diverse residential and commercial uses, enhancing walkability, and creating a pedestrianfocused streetscape.
ZEPHYR CREEK RESTORATION
Restore Zephyr Creek as a natural asset, enhancing its ecological health and biodiversity, while simultaneously increasing stormwater capacity to effectively manage runoff and reduce flooding risks during rain event and storms. 2
INVEST AND EXPAND MAIN STREET
Continue investing in business support and recruitment on Main Street, expanding its boundary to 16th Street, while promoting mixed-use development, enhancing the public realm and cultural initiatives, strengthening branding, and creating incentives to attract restaurants, offices, and cultural venues. 3
REDESIGN 5TH AVEN u E AS A “RAMBLA”-STYLE SPACE
Inspired by Barcelona’s pedestrian-friendly boulevards, “Las Ramblas,” redesign sections of 5th Avenue with wider sidewalks and flexible spaces that can convert into plazas for special events in Zephyrhills. 4
5
CREATE A GREENWAY LOOP CONNECTING
Develop a dedicated greenway loop, consisting of a separate multi-purpose path for cyclists and pedestrians, that connects key destinations within downtown. This new loop will not only enhance connectivity within downtown but also promote healthy lifestyles and sustainable transportation options.
ESTABLISH DISTINCT GATEWAY PLACES AND FEAT u RES
Create five distinct gateways that serve as welcoming entry points into the CRA, enhancing the city’s identity and fostering a sense of belonging. These gateways will not only signify the entrances to key areas, but they will also offer functional and aesthetic spaces for residents and visitors.
ZEPHYR CREEK AS A NATURAL ASSET AND TO INCREASE THE CITY’S STORMWATER CAPACITY
3.4 Goals, Objectives, and Actions
Goals
Objectives
Actions
PROJECTS
DEVELOPMENT PLANNING & PREPARATION
POLICY AND PLANS
INCENTIVES AND PROGRAMS
1 REVAMP
2 INVEST Corridors & Gateways Places Economic Development
Create Vibrant and Diverse Corridor and Gateway Places
A. Transform Gall Boulevard into a mixeduse, livable corridor
B. Make 5th Avenue and its surrounding blocks the Central Spine of downtown ding blocks the Central Spine of downtown
C. Create distinct Gateway Places
TRANSFORMATIONAL
1.1 Transform 5th Avenue as a “RamblaStyle” Space.
1.2 Create Distinct Gateway Places & Features.
PROGRESSIVE
1.3 Redesign Main Street Clock Plaza. BASIC
1.4 Create a Mural/Public Art Project.
1.5 Implement the Little-but-Loud Project.
1.6 Facilitate and support the development, acquisition, and assembly of potential redevelopment sites.
1.7 Establish a process to create, promote, and distribute RFPs to attract developer interest in City-owned sites.
1.8 Create and manage a publicly accessible redevelopment site inventory.
1.9 Create a combined zoning and design guidelines document for the area.
1.10 Promote sustainable development practices to minimize stormwater runoff.
1.11 Expand the Main Street Boundary to 16th Street.
1.12 Provide design and planning assistance to landowner and prospective developers.
1.13 Provide incentives to preserve landmark and iconic buildings.
Support and invest in the area’s economic development, character, and market positioning
A. Position the area to attract sustainable, high-quality development and investment
B. Promote the economic diversification of the area
C. Leverage regional and local partnerships
2.1 Create a distinct brand for Gall Blvd, Main Street, and Ramblas.
2.2 Create a public arts master plan.
2.3 Create a wayfinding and signage plan.
2.4 Broaden the non-residential incentives policies for exterior and interior building, site improvements, and restoration.
2.5 Provide separate incentive programs for targeted businesses and entrepreneurs.
2.6 Establish an incentive policy for tenant improvements for commercial uses.
2.7 Develop a business recruitment and retention program.
2.8 Connect existing and future business owners with resources and information.
2.9 Create targeted industry hubs or business incubators to support startups.
2.10 Partner with state, regional and local agencies to market the unique advantages of the area to attract new business and industries.
3 ENHANCE 5 LEVERAGE
Housing & Neighborhoods
Enhance and preserve the neighborhood’s residential character while expanding housing opportunities
A. Invest in the existing housing stock
B. Create opportunities for infill housing development
C. Diversify housing options and identify sites for higher-density development
3.3 Facilitate and support the development, land acquisition for infill housing sites.
3.4 Maintain an inventory of infill sites and contributing historic homes.
3.5 Promote adaptive reuse of existing nonresidential sites and structures to provide additional housing opportunities.
3.6 Develop pre-approved residential building plans set.
3.7 Modify zoning to allow missing middle housing.
3.8 Promote and incentive the development of accessory dwelling units (ADU) and missing middle housing typologies.
3.9 Continue investing in the residential ownership program and paying grant programs.
3.10 Broaden the incentives to stabilize the quality of the existing housing stock.
4 BUILD
Connectivity & Infrastructure
Improve transportation and connectivity while upgrading infrastructure to address flooding and support infill development
A. Build on the traditional grid system to purposefully connect the parks, schools, churches, City Hall, businesses, and other destinations with an integrated multimodal system
B. Develop resilient and sustainable infrastructure systems of streets, alleys, sidewalks, public parking, stormwater, and utilities to support the area’s connectivity and growth
TRANSFORMATIONAL
4.1 Create a Comprehensive Bicycle Network and Greenway Loop.
4.2 Redesign Gall Blvd ( US 301) as a Complete Street.
4.3 Redesign of 6th and 7th Street. PROGRESSIVE
4.4 Redesign Lake Necessity.
4.5 Make Stormwater and green infrastructure improvements.
4.6 Extend Avenue “A” to Gall Blvd.
4.7 Improve the Alley System. BASIC
4.8 Continue improving the sidewalk system.
4.9 Make Streetscape Improvements.
4.10 Support implementing and expanding impact fees to fund critical infrastructure improvements.
4.11 Support developing and implementing zcomprehensive mobility and infrastructure plans, policies, and projects.
4.12 Create programs and incentives for mobility and infrastructure improvements.
Parks & Open Space
Leverage parks and open spaces to boost community vitality, conservation, and climate resilience
A. Invest in the enhancement and long-term development of parks and open spaces
B. Integrate climate adaptation and stormwater management into parks and open spaces
TRANSFORMATIONAL
5.1 Leverage Zephyr Creek as both open space and stormwater infrastructure. PROGRESSIVE
5.2 Redesign and improve Shepard’s Park.
5.3 Identify strategic locations within parks to establish resilience hubs.
5.4 Support the recommendations of the Zephyrhills Parks Assessment and Master Plan.
5.5 Support the creation of a Parks and Recreation Department.
5.6 Create a branding, signage, and wayfinding for the parks and open space system.
5.7 Support CRA and city-wide stormwater, conservation, and adaptation plans, fees, and projects.
5.8 Continue the allocation of funding for parks and other projects.
5.9 Apply to State and Federal Grants to fund parks and climate adaptation projects.
Projects Summary
The following pages present a comprehensive summary of all proposed infrastructure improvements and select development projects within the CRA. These initiatives are illustrated on a detailed map, providing a visual representation of their locations and relationships within the broader redevelopment context.
Projects are organized into three tiers:
• Basic – Foundational improvements that deliver immediate, visible benefits
• Progressive – Intermediate projects that build momentum and enhance community visibility
• Transformational – Ambitious, high-impact efforts with the potential to redefine the district’s character and future
Project List
1.1
Each project is categorized under one of the following focus areas:
• Placemaking
• Infrastructure
• Parks and Open Spaces
• Transportation
• Redevelopment
This classification helps clarify the intent and impact of each project, aligning them with the broader goals of the CRA Master Plan.
Each proposed project will be described in detail in the following section, including its purpose, scope, location, and expected benefits to the community.
4.7
5.2
5.3 Identify strategic locations within parks to establish resilience hubs | INFRASTRUCTURE
1.4 Create a mural/public art project | PLACEMAKING
1.5 Implement the Little-but-Loud Project | PLACEMAKING & INFRASTRUCTURE
4.8 Continue improving the sidewalk system | PLACEMAKING & INFRASTRUCTURE
5.3
ALLEY SYSTEMS IMPRoVEMENTS
1. REVAMP
Corridor and Gateway Places
Create Vibrant and Diverse Corridors and Gateway Places
OBJECTIVES
A. Transform Gall Boulevard into a mixed-use & livable corridor
As the primary commercial corridors in the CRA, Gall Boulevard and its surrounding blocks will be transformed into a vibrant, mixeduse, and livable space, establishing it as a prosperous and walkable destination for both the city and the region.
ACTIONS
The Zephyrhills CRA encompasses two key commercial corridors—Gall Boulevard and 5th Avenue—each defined by a notable concentration of commercial and business activities. As of 2025, these thoroughfares feature a diverse blend of retail stores, offices, restaurants, and other businesses. The CRA aims to enhance the vibrancy and diversity of these corridors, transforming them into thriving economic and social hubs with a mix of retail, office, and residential spaces. The goal of fostering new infill redevelopment is to support existing and new businesses, attract visitors and residents, and create dynamic environments. These corridors also present a unique opportunity to establish gateway areas that enhance the identity and visibility of the CRA.
B. Make 5th Avenue and its surrounding blocks the Central Spine of downtown
Transform 5th Avenue and its adjacent blocks into the primary corridor of downtown Zephyrhills—connecting civic, commercial, cultural, and mixed-use activity. The goal is to create a vibrant, walkable district with active storefronts, inviting public spaces, and strong multimodal access.
TRANSFORMATIONAL
1.1 Transform 5th Avenue as a “Rambla-Style” Space
1.2 Create Distinct Gateway Places & Features PROGRESSIVE
PROJECTS
C. Create distinct gateway places & features
Establish five distinct gateways that serve as welcoming entry points creating a sense of arrival into the CRA along Gall Boulevard and 5th Avenue. The gateways will enhance the city’s identity and foster a sense of place.
DEVELOPMENT PLANNING & PREPARATION
POLICY AND PLANS
INCENTIVES AND PROGRAMS
1.3 Redesign Main Street Clock Plaza BASIC
1.4 Create a Mural/Public Art Project
1.5 Implement the Little-but-Loud Project
1.6 Facilitate and support the development, acquisition, and assembly of potential redevelopment sites
1.7 Establish a process to create, promote, and distribute RFPs to attract developer interest in City-owned sites
1.8 Create and manage a publicly accessible redevelopment site inventory
1.9 Create a combined zoning and design guidelines document for the area
1.10 Promote sustainable development practices to minimize stormwater runoff
1.11 Expand the Main Street Boundary to 16th Street
1.12 Provide design and planning assistance to landowner and prospective developers
1.13 Provide incentives to preserve landmark and iconic buildings
PROJECTS
TRANSFORMATIONAL
1.1 Transform 5th Avenue as a “Rambla” Space.
Advance the vision set forth in the 2022 Zephyr Park and Oakside Neighborhood Plan by reimagining 5th Avenue as a vibrant, inclusive, and multifunctional corridor. The plan proposes a “Rambla”-style street design featuring multistage intersections, median parking, midblock crosswalks, dedicated bicycle lanes, and flexible spaces for festivals and community gatherings. This transformation prioritizes pedestrian safety, aesthetic appeal, and cultural expression while enhancing connectivity between neighborhoods.
NOTE: As the project moves forward, further due diligence in traffic analysis, planning, and design will be essential. The original concept plans were intended as a starting point—to spark ideas and guide intent—not as final designs.
C. 5th Avenue Rambla NEXT
WHAT IS A RAMBLA?
A Rambla is a type of street design inspired by the famous La Rambla in Barcelona, Spain. It typically refers to a wide, tree-lined promenade that prioritizes pedestrians while accommodating other modes of transportation. Here are the key characteristics. Key Features of a Rambla:
• Central pedestrian promenade: Often flanked by traffic lanes or bike paths.
• Multi-use flexibility: Can host markets, festivals, or community events.
• Green infrastructure: Includes trees, landscaping, and seating areas.
• Traffic calming: Designed to slow down vehicles and enhance safety.
• Cultural and social space: Encourages gathering, walking, and public life.
1.2 Create Distinct Gateway Places & Features.
Establish five distinct gateways that serve as welcoming entry points and will create a sense of arrival into the CRA along Gall Boulevard and 5th Avenue. The gateways will enhance the city’s identity and foster a sense of place. The plan includes two types of gateways: gateway places and gateway features:
• Gateway Places: As part of this vision, four gateway places will be developed along key points on 5th Avenue and Gall Boulevard. These areas are comprised of infill redevelopment blocks strategically positioned along both corridors. They will promote compact, mixed-use development, placing new buildings closer to the road to create a sense of arrival alongside green spaces; these areas will also include various streetscape elements, including trees, lighting, signage, art, improved intersections, and vertical gateway signs.
• Gateway Feature : Gateway features will include vertical markers that highlight key intersections and serve as recognizable symbols of entry within the community, as well as wayfinding signs. As part of this vision, two gateway features will be developed along key points on 5th Avenue and Gall Boulevard. These features will enhance landscaped areas and incorporate art elements such as sculptures and murals, along with improved and safer crosswalks and intersections.
The locations of the gateway places and features are illustrated in the following pages.
GATEWAY PLACES
DOWNTOWN GATEWAY PLACE 1
The Main Street Gateway Place will center around the intersection of 5th Avenue and 16th Street, serving as a welcoming arrival point for visitors approaching Main Street from the east, south, and north. This area will include a small pocket park with a gateway sign, a proposed mixed-use infill development, and a segment of the planned Greenway loop.
SOUTH GATEWAY PLACE 2
South Gateway Place includes Sheppard Park and nearby blocks. Key improvements include extending “A” Avenue to Gall Boulevard and adding a roundabout. Buildings will frame the park and roundabout with streetfacing fronts and rear parking, creating a welcoming arrival. Art elements and a prominent vertical gateway sign are encouraged to enhance the streetscape.
CENTRAL GATEWAY PLACE 3
Central Gateway Place includes the City Hall Complex, Lake Necessity, and the surrounding parcels near the intersection of Gall Boulevard and 5th Avenue. Through strategic redevelopment and enhancements to the public realm, this area will be transformed into a vibrant focal point— serving as the primary gateway to both Main Street and the City Hall Complex.
ZEPHYR PARK GATEWAY PLACE 4
Zephyr Park Gateway Place is designed as a welcoming entrance to the park, incorporating a proposed stormwater park and Ramblas with a new restaurant. This gateway will combine recreation with scenic views, offering a vibrant space for dining, relaxation, and enjoying the view of the restored creek.
GATEWAY FEAT u RES
The following outlines the vision and redevelopment goals for each gateway feature.
The 54 Gateway will be thoughtfully designed within the existing right-of-way of State Road 54 and Gall Boulevard, transforming this key intersection into a welcoming entrance. The gateway will feature a prominent monument sign that marks the district, landscaped areas to soften the roadway, and custom lighting. Additionally, a creatively painted intersection will serve as a focal point.
GATEWAY ELEMENTS
Gateway Elements for the rzight-of-way and buildings may include a variety of enhancements that create a strong sense of arrival and reinforce the area’s identity. These include:
• Right-of-Way Elements:
+ Distinctive signage, such as monument signs and vertical markers, to clearly identify the gateway.
+ Landscaping with signature trees, seasonal plantings, bioswales, and decorative planters to enhance visual appeal and soften the streetscape.
+ Public art, including sculptures, murals, or mosaics, to add cultural and aesthetic value.
+ Streetscape enhancements like low walls, custom lighting, painted crossewalks, and street furniture to improve the pedestrian experience.
+ Branding elements like banners, district logos, and interpretive signage to unify the space and reflect local identity.
• Building Elements:
+ Murals or artistic facades.
+ Architectural lighting that highlights building features and contributes to nighttime identity.
+ Integrated signage that aligns with the gateway’s branding and design language.
+ Canopies, awnings, or balconies with distinctive designs that contribute to the visual rhythm of the streetscape.
+ Green walls or vertical gardens that add natural texture and sustainability.
+ Corner or rooftop towers on buildings to serve as vertical markers.
The North Avenue Gateway will be designed within the existing right-of-way of North Avenue and Gall Boulevard, with opportunities for added open space through future redevelopment of nearby properties. Potential features include a signature art piece or sculpture, landscaped areas to soften the streetscape, and custom lighting to enhance the gateway’s visual appeal.
54 GATEWAY FEATURE 5
NORTH AV. GATEWAY FEATURE 6
GATEWAY SIGN
BRANDED LIGHT P o LE BANNERS
MURALS
PAINTED CR oSSWALKS
PUBLIC ART
LoW WALL + PUBLIC ART
DECo RATIVE + BRANDED PLANTERS
oSWALE
DOWNTOWN GATEWAY PLACE
The Downtown Gateway Place will be a prominent and inviting entry point centered around the intersection of 5th Avenue and 16th Street, welcoming visitors approaching from the east, south, and north. This gateway is envisioned as a vibrant, multi-functional space that blends public amenities with thoughtful development. A small pocket park will serve as a green anchor for the area, featuring a distinctive gateway sign that marks the transition into the Main Street area.
Adjacent to the park, a proposed mixed-use infill development will introduce new opportunities for retail, residential, and community activity, helping to activate the space throughout the day. Additionally, a segment of the planned Greenway loop will pass through this area, enhancing connectivity for pedestrians and cyclists while reinforcing the gateway’s role as a key node in the broader urban network. Together, these elements will create a dynamic and welcoming environment that reflects the character and aspirations of the Main Street district.
MIXED-USE INFILL DEVELOPMENT
NOTE: This rendering is conceptual and is intended to illustrate the redevelopment potential of the site; it does not reflect proposed street improvements.
GATEWAY SIGN
WIDE SIDEWALKS
Co RNER o F 5TH AVE AND 16TH ST To Mo RR oW
INFILL RESIDENTIAL
Co RNER o F 5TH AVE AND 16TH ST To DAY
GREENWAY LOOP
PROGRESSIVE
1.3 Redesign Main Street Clock Plaza.
Main Street Plaza, also known as Clock Tower Plaza, is a half-acre public space located in the heart of the City’s Main Street. It is surrounded by a mix of one- and two-story commercial buildings, creating a charming and accessible urban setting. The plaza features traditional elements such as a gazebo, a clock tower, mature street trees, a restroom facility, planters, and benches. Currently, the plaza functions as a passive open space, primarily used for sightseeing, sitting, and hosting small-scale events. However, the existing layout limits its flexibility for more dynamic programming such as concerts, markets, and ceremonies.
Given its central location and strong community presence, this project has the potential to be part of the Little-butLoud Project, aligning with its goals of creating highimpact, small-scale urban improvements. Its proximity and significance to the community make it an ideal candidate for this initiative.
To unlock the full potential of this open space, it is recommended that the CRA invest in a comprehensive redesign and reprogramming of the plaza.
BASIC
1.4 Create a Mural Project.
Create a Public Art and Mural Project to celebrate the city’s heritage, identity, and the vibrancy of both public and private spaces through dynamic artwork. This initiative aims to beautify and revitalize the CRA, support local artists, attract visitors, stimulate economic growth, and create lasting cultural landmarks. This project of festival will transform the visual landscape into a source of inspiration, storytelling, and shared community pride. A successful example of this type of initiative is the SHINE Mural Festival in St. Petersburg, Florida, which has become a nationally recognized event that brings art, tourism, and community engagement together.
EXISTING PLAZA VIEW FR o M 8TH STREET
PLAZA DESIGN SAMPLE
ST. PETERSBURG, FL SHINE MURAL FESTIVAL
Little-but-Loud Project (2020)
The Little-but-Loud Project comprises a series of small, low-cost, low-risk interventions in a few blocks in close proximity to the City Hall Complex.
The plan illustrated four intervention/catalyst sites, each with small projects. This graphics illustrates the four proposed projects.
1.5 Implement the Little-but-Loud Project.
Continue the implementation of the projects proposed in the 2020 Little-but-Loud Project. The plan proposed a series of small, low-cost, low-risk interventions within the downtown public realm. These interventions aimed to provide opportunities to create a centrally located place where individuals of all ages and families could gather and celebrate the community’s offerings of music, art, and food.
It is recommended that the CRA continue investing in projects of this nature and consider expanding them to additional locations within the district.
“THE ALLEYWAY” PR o JECT
DEVELOPMENT PLANNING AND PREPARATION
1.6 Facilitate and support the development, acquisition, and assembly of potential redevelopment sites.
To advance the Agency’s revitalization goals, eight targeted areas and site-specific parcels for potential redevelopment have been identified. (See Figure 28: Catalyst Areas and Sites in the following page.)
These sites—selected based on criteria such as vacancy, underutilization, aging infrastructure, and redevelopment potential—represent key opportunities for transformative projects that align with long-term community objectives.
Targeted projects, acquisition, and land consolidation can significantly enhance the feasibility and impact of future redevelopment efforts. By assembling adjacent parcels, the City and developers can:
• Enable larger-scale, cohesive development projects.
• Facilitate the inclusion of essential infrastructure such as parking and stormwater management.
• Attract private investment by reducing development complexity and increasing site readiness.
• Support mixed-use redevelopment and adaptive reuse opportunities, such as converting former churches or outdated commercial buildings into housing or community-serving spaces.
It is recommended that the Agnecy and City staff work collaboratively to:
• Monitor and evaluate properties within the eight identified priority areas.
• Engage with property owners to explore acquisition opportunities.
• Prioritize parcels that are contiguous or located in high-impact zones.
• Leverage public-private partnerships to maximize redevelopment outcomes.
It is recommended that Agency staff continue to monitor these targeted areas closely and proactively identify additional properties that may become available. This includes evaluating underutilized parcels, aging commercial centers, and other strategic locations that align with the Agency’s goals.
To further support future development on these catalyst sites, the City can offer incentives such as expedited permitting, infrastructure improvements, demolition grants, and financial tools like tax increment financing or grants. Providing technical assistance, facilitating public-private partnerships, and aligning zoning and land use policies with redevelopment goals will also help ensure these sites reach their full potential as drivers of revitalization.
This strategic approach will position the City to guide growth, enhance livability, and ensure that redevelopment aligns with the community’s vision for a vibrant, inclusive future.
1.7 Establish a process to create, promote, and distribute RFPs to attract developer interest in City-owned sites.
As the CRA begins acquiring land, it should also prepare to attract qualified developers through a well-structured Request for Proposal (RFP) process. This includes internal planning, forming a steering committee of City staff, CRA members, and community stakeholders, and conducting a site feasibility study to assess zoning, infrastructure, and market potential. Community input should help shape the RFP to reflect local priorities.
The RFP should clearly outline development goals, evaluation criteria (e.g., financial capacity, experience, community benefits), and available CRA incentives. Once finalized, it should be published on a dedicated webpage and promoted through digital outreach and procurement platforms like BidNet and DemandStar.
+ Vacant Parcels
+ Schools
+ City Hall Complex
+ Recreation and Open Space
+ Historic District
+ Targeted Areas
+ Redevelopment Sites/Parcels
SITES INFORMATION
COMMERCIAL PLAZA
PARCEL ACREAGE: 5.8 Ac.
PRIMARY USE: Commercial
OWNER: Zephyr LLC
ROADSTAR HOTEL
PARCEL ACREAGE: 2.6 Ac.
PRIMARY USE: Hotel / Vacant
OWNER: Sofar Inc
S u NTR u ST
PARCEL ACREAGE: 2.6 Ac.
PRIMARY USE: Vacant Building |
Former Bank Site
OWNER: Tech Vault LLC
RESTAu RANT + COMMERCIAL
PARCELS ACREAGE: 2.7 Ac. Combined
PRIMARY USE: Commercial
OWNERS: J and G Restaurant
Properties Stone Family Trust, Nirav Corporation, Old Florida LLC
CH u RCH & CRA LOTS (FIRST BAPTIST)
PARCEL ACREAGE: 4 Ac. Combined
PRIMARY USE: Church, Parking & Vacant
OWNER: First Baptist Church of Zephyrhills, and City of Zephyrhills CRA
COMMERCIAL (TIRE STORE)
PARCEL ACREAGE: 1.4 Ac.
PRIMARY USE: Commercial
OWNER: Roberts Yvonne
CH u RCH
PARCEL ACREAGE: 2.0 Ac.
PRIMARY USE: Church Parking
OWNER: Diocese of St Petersburg
VACANT PARCELS
PARCELS ACREAGE: 5+ Ac. Combined
PRIMARY USE: Commercial
OWNERS: Roger Brad, Z-Hills Property, Lair Ralph, Hood Family Trust, City of Zephyrhills
1.8 Create and manage a publicly accessible redevelopment site inventory.
The CRA should develop a dynamic, web-based inventory of potential redevelopment sites within the CRA using ArcGIS Online. This interactive platform will map both public and private parcels with redevelopment potential, incorporating key data such as zoning, land use, parcel size, ownership, environmental constraints, and proximity to infrastructure and amenities.
To ensure ongoing relevance, the inventory must be regularly updated and include features for submitting new site suggestions, tracking redevelopment progress, and collecting community feedback.
This effort aligns and can be implemented concurrently with Action 3.4: Maintain an inventory of infill sites and contributing historic homes.
1.9 Create a CRA combined zoning and design guidelines document for the area.
Based on 2024 data, the Zephyrhills Community Redevelopment Agency (Agency) area encompassed a total of 3,322 residents and 306 businesses and spans a land area of 1.3 square miles. Development within the CRA is governed by a combination of regulatory frameworks, including six future land use designations, 10 Euclidean zoning districts, three form-based code districts, and various design standard categories.
According to recent building permit data provided by the City, only 81 permits have been issued in the CRA over the past 3 years (2020–2023), averaging 2.5 permits a month in contrast to 46 permits per month issued city-wide. (Refer to Appendix: New Permits and Code Violations Data and Maps.)
REFERENCE
ArcGIS Online Dashboard
ArcGIS Online Dashboard is a powerful, interactive data visualization tool provided by Esri as part of the ArcGIS Online platform. It allows users to create dynamic dashboards that display real-time or static geographic and non-geographic data through a variety of visual elements.
ArcGIS Online Dashboard is a web-based application that enables users to monitor, analyze, and present spatial data using intuitive visual components like: maps; charts (bar, pie, line, etc.); indicators and gauges; lists and tables; and selectors (dropdowns, sliders, etc.)
POLICY AND PLANS
City staff and leadership have heard feedback from residents and property owners indicating that the current regulatory framework can be difficult to navigate and, in some cases, unclear or inconsistent across the Community Redevelopment Area (CRA). While the City’s formbased regulations provide flexibility when the intended form and character are achieved, the overall layering of zoning districts, overlays, and design standards may create uncertainty for prospective development and reinvestment, and current property owners seeking upgrades without obtaining permits, potentially resulting in code violations. Over the past 3 years (2020–2023), 596 residential and commercial code violations occurred in the CRA, averaging 50 monthly violation. (Refer to Appendix: New Permits and Code Violations Data and Maps.)
In response to these challenges, the City should evaluate opportunities to streamline and better coordinate zoning and design standards within the CRA. This may include establishing a unified CRA zoning framework that consolidates applicable Euclidean zoning districts, formbased code provisions, and design standards into a single, user-friendly structure.
Rather than applying a single zoning district uniformly across the CRA, the framework should allow for multiple context-sensitive districts or place-based subareas that reflect the differing character, scale, and development patterns of established residential neighborhoods, mixeduse corridors, downtown areas, and gateway locations. The goal is to improve clarity, predictability, and ease of use while maintaining appropriate neighborhood transitions and the community’s desired form.
The appropriate level of regulation and district structure should be informed by, and refined through, the CRA Master Plan update.
REFERENCE
Downtown Tampa Central Business District
In 2014, the City of Tampa established the Downtown Tampa Central Business District Zoning, commonly called "Center City" or "Downtown." The primary purpose of this special district is to implement the Center City Plan and Tampa Comprehensive Plan. It aims to shape a high-quality public realm by regulating the physical form of buildings, streets, and open spaces. This involves governing the form and mass of buildings in relation to each other and establishing a pedestrian-friendly interaction between building facades and the public realm.
Two sub-districts were created and governed by Euclidean parcel rezoning procedures, along with a series of regulating plans.
For more detailed information about the Central Business District (CBD), please visit Municode.
TAMPA Zo NING MAP
CENTRAL BUSINESS DISTRICT
1.10 Promote sustainable development practices to minimize stormwater runoff.
Integrate sustainable development practices to help minimize stormwater runoff and protect the City’s natural resources. As the CRA grows, impervious surfaces like roads, rooftops, and parking lots increase, leading to higher volumes of runoff that can overwhelm drainage systems, contribute to flooding, and carry pollutants into local waterways.
To address these challenges, the Agency should support the implementation of green infrastructure solutions, such as:
• Permeable pavements.
• Rain gardens and bioswales.
• Green roofs.
• Tree planting and urban forestry.
• Rainwater harvesting systems.
• Low-impact development (LID) design principles.
These practices not only manage stormwater more effectively but also enhance the aesthetic and ecological value of public and private spaces. Importantly, they also help the community recover more quickly from heavy rain events by reducing the volume and speed of runoff, easing pressure on drainage systems, and allowing water to infiltrate into the ground naturally.
The Agency will encourage developers, property owners, and community partners to incorporate these strategies into new projects and retrofits within the CRA.
To reduce the cost of stormwater and green infrastructure cost, developers can collaborate with Agency and apply for state and federal infrastructure improvement grants. Some grants allow or encourage public-private partnerships, where a developer may contribute matching funds or in-kind services to strengthen a grant application. A list of grants are listed on the following page.
RUN o FF DIAGRAM
STo RMWATERS PLANTERS
STo RMWATERS PLANTERS
GRANTS
To support local resilience, infrastructure improvements, and long-term recovery efforts, a variety of State and Federal grant programs are available to municipalities and Community Redevelopment Agencies. These funding sources provide critical support for projects that address flooding, stormwater management, environmental sustainability, and disaster recovery. Below is a summary of key programs that can help advance resilience and infrastructure goals within the community:
1) Resilient Florida Grants
• Administered by the Florida Department of Environmental Protection (FDEP).
2) EPA Green Infrastructure Funding & Technical Assistance
• Administered by U.S. Environmental Protection Agency.
3) CDBG-Disaster Recovery (CDBG-DR)
• Administered by the Office of Long-Term Resiliency, this program supports long-term recovery from federally declared disasters.
4) Water Quality Improvement Grant Programs
• Administered by FDEP via Water Quality Dashboard.
1.11 Expand the Main Street Boundary to 17th Street.
The Agency has made significant progress in revitalizing its historic Main Street corridor, fostering economic development, enhancing walkability, and supporting small businesses. To build on the momentum of downtown revitalization, it is recommended to expand the Main Street boundary eastward to 17th Street enabling businesses and property owners in the CRA to participate in the Main Street Program benefits.
INCENTIVES AND PROGRAMS
1.12 Provide design and planning assistance to landowner and prospective developers.
To encourage high-quality redevelopment and ensure alignment with the Agency’s vision, the City and Agency should offer design and planning assistance to landowners and prospective developers within the CRA. This support can include guidance on site planning, zoning compliance, architectural design, and integration of green infrastructure or public realm improvements.
Purpose:
• Help property owners and developers navigate regulatory requirements.
• Encourage investment by reducing early-stage planning barriers.
• Improve project outcomes through professional design input.
• Align private development with CRA goals for walkability, aesthetics, and sustainability Assistance may be provided through in-house planning staff, design consultants, or partnerships with professional organizations. This initiative can also include predevelopment meetings, design charrettes, and access to design guidelines or templates.
1.13 Provide incentives to preserve landmark and iconic buildings.
Zephyrhills is home to several historic and architecturally significant structures that contribute to the city’s unique identity and charm. Among these are the historic theater and a collection of early 20th-century commercial buildings along Main Street, which serve as visual anchors and cultural touchstones within the CRA. Many of these buildings face challenges such as aging infrastructure, deferred maintenance, and redevelopment pressure, placing them at risk of deterioration or demolition.
To protect and enhance the character of the CRA, the City should establish a program of targeted incentives to support the preservation, rehabilitation, and adaptive reuse of landmark and iconic buildings. These incentives may include:
• Building façade, safety and ADA improvement grants or matching funds.
• Property tax abatements or exemptions.
• Permit fee reductions or expedited review.
• Technical assistance for historic preservation.
• Transfer of development rights (TDR) or zoning flexibility.
• Inclusion in promotional materials or heritage tourism initiatives.
Purpose:
• Preserve the architectural and cultural heritage of Zephyrhills.
• Encourage reinvestment in historic properties.
• Support adaptive reuse that aligns with CRA revitalization goals.
• Strengthen community identity and pride.
• Attract visitors and enhance the downtown experience.
• Prevent demolition of irreplaceable structures.
Begin with landmarks and iconic buildings along Main Street.
FUNDING
To maximize the impact of this initiative, the CRA should pursue funding and technical assistance from a variety of sources, including:
• County Programs: Pasco County historic preservation or economic development grants
• State Programs:
+ Florida Division of Historical Resources grants.
+ Florida Main Street Program support.
+ Florida Department of State – Special Category Grants.
• Federal Programs:
+ National Park Service’s Historic Preservation Fund.
+ Community Development Block Grant (CDBG) funds.
+ Federal Historic Tax Credits (HTC).
+ National Trust for Historic Preservation grants.
2. INVEST
Economic Development
Support and invest in the area’s economic development, character and market positioning
Through strategic support and targeted initiatives, the Zephyrhills CRA is dedicated to driving meaningful economic growth, preserving the area’s distinctive charm, and positioning Zephyrhills as a dynamic destination. By supporting local businesses, celebrating arts and culture, and attracting new enterprises, the CRA is laying the foundation for sustained investment and growth. Key to this mission is leveraging partnerships with economic development organizations, the Chamber of Commerce, and the Zephyrhills Economic Development Coalition to amplify impact and accelerate revitalization The CRA also recognizes the vital role of arts and cultural programming in placemaking, community identity, and economic vitality, and actively supports initiatives that integrate creative expression into public spaces and redevelopment projects.
OBJECTIVES ACTIONS
A. Position the area to attract sustainable, high-quality development and investment. Implement updated policies, green incentives, and strategic partnerships to attract sustainable development and investment. Support mixed-use projects, business incubators, and marketing efforts while connecting entrepreneurs to resources to establish the area as a resilient, investment-ready community.
B. Promote the economic diversification of the area
Broaden the area’s economic base by encouraging a diverse mix of industries, reducing reliance on any single sector, and increasing resilience to economic fluctuations. This involves attracting new business types while supporting the growth of existing local enterprises. The area can create a more dynamic and inclusive economy by fostering a business-friendly environment, investing in workforce development, and leveraging regional assets.
C. Leverage regional and local partnerships.
Collaborate with regional and local partners to amplify resources, align strategic initiatives, and accelerate community revitalization. Strengthen relationships with economic development organizations, chambers of commerce, educational institutions, and government agencies to enhance the CRA’s ability to attract investment, support businesses, and deliver impactful programs.
POLICY AND PLANS
INCENTIVES AND PROGRAMS
2.1 Create a distinct brand for Gall Boulevard, Main Street, and Ramblas.
2.2 Create a public arts master plan.
2.3 Create a wayfinding and signage plan.
2.4 Broaden the non-residential incentives policies for exterior and interior building, site improvements, and restoration.
2.5 Provide separate incentive programs for targeted businesses and entrepreneurs.
2.6 Establish an incentive policy for tenant improvements for commercial uses.
2.7 Develop a business recruitment and retention program.
2.8 Connect existing and future business owners with resources and information.
2.9 Create targeted industry hubs or business incubators to support startups.
2.10 Partner with state, regional and local agencies to market the unique advantages of the area to attract new business and industries.
POLICY AND PLANS
2.1 Create a distinct brand for Gall Boulevard, Main Street, and Ramblas.
Develop a cohesive and visually compelling brand identity for Gall Boulevard, Main Street, and the Ramblas that reflects their unique character while uniting them under a shared vision for revitalization and economic growth. The branding should include logo concepts, color palettes, typography, and visual themes that can be applied across signage, marketing materials, and digital platforms. Each corridor should maintain its individual identity—Gall Boulevard as a commercial gateway, Main Street as a historic and cultural hub, and the Ramblas as a vibrant, walkable mixed-use destination—while contributing to a unified sense of place.
2.2 Create a Public Arts Master Plan.
Support the creation of a city-wide public art master plan that celebrates the city’s heritage, enhances its downtown identity, and fosters community pride. The plan should outline strategies for integrating public art into redevelopment efforts, activating public spaces, and supporting local artists through inclusive and sustainable initiatives. The plan should:
• Reflect Zephyrhills’ history and culture through public art.
• Use art to beautify and activate parks, streets, and civic areas.
• Create opportunities for artists through commissions and partnerships.
• Involve residents in art projects and events to build pride and inclusion.
• Attract visitors and support downtown businesses through creative placemaking.
• Establish long-term strategies for funding, maintenance, and growth
• Dedicate an Art Fund to ensure the long-term support for maintenance and new projects.
BRAND SAMPLE
Mild District Branding
The Milk District Main Street Area in Orlando, Florida, demonstrates how a strong brand can reflect local culture, history, and community spirit. Known as a cultural hub, it features a vibrant arts and music scene, diverse food options, and inclusive public spaces. Its branding draws from the area’s dairy heritage, creatively expressed through signage, murals, and merchandise. By collaborating with local artists and launching unique products, the district celebrates its diversity while generating new revenue and visibility through events and partnerships.
So URCE : MILK DISTRICT MAIN STREET WEBSITE
2.3 Create Wayfinding and Signage Plan.
Develop a comprehensive Wayfinding and Signage Plan that enhances the visual identity, navigability, and overall user experience within the Zephyrhills CRA. This plan will serve to guide residents and visitors efficiently to key destinations, support local businesses, and reinforce the community’s unique character. It will include cohesive design standards, strategic sign placement, and an implementation roadmap that aligns with the CRA’s revitalization and branding efforts. Below are the typical steps involved in creating a wayfinding and signage plan.
• Define the purpose, scope, and objectives of the plan.
• Conduct a field survey to document existing signage and wayfinding elements.
• Map key destinations, pedestrian and vehicular routes, and decision points.
• Create a signage hierarchy (primary, secondary, tertiary).
• Outline a phased approach for installation.
• Provide cost estimates, fabrication details, and maintenance guidelines.
• Identify potential funding sources or partnerships.
Below are initial ideas for gateway signs for the CRA.
INCENTIVES AND PROGRAMS
2.4 Broaden the non-residential incentives policies for exterior and interior building, site improvements, and restoration.
As part of this mission, the CRA has historically offered incentive programs to support non-residential property owners in making exterior improvements. However, to further stimulate investment, attract new businesses, and preserve the district’s unique identity, these policies need to be broadened to include a wider range of eligible improvements. Below is a proposed list of the new improvement items to be added to the incentives program:
• Code Compliance & Safety u pgrades
+ Electrical rewiring and panel upgrades.
+ Plumbing system improvements.
+ Fire suppression systems (sprinklers, alarms).
+ ADA-compliant restrooms and accessibility features.
+ HVAC system installation or modernization.
• Restoration & Finishes
+ Façade Restorations.
+ Restoration of historic interior elements (e.g., tin ceilings, woodwork, original flooring).
+ New flooring (tile, hardwood, polished concrete).
+ Wall treatments (drywall, paint, paneling).
+ Ceiling repairs or enhancements.
• Energy Efficiency Improvements
+ LED lighting systems.
+ Insulation upgrades.
+ Energy-efficient windows and doors (interior partitions or storefronts).
+ Smart thermostats and building automation systems.
• Adaptive Reuse Improvements
+ Modifying interior layouts to accommodate modern uses (e.g., converting a historic bank into a café or gallery) while preserving defining features.
2.5 Provide separate incentive programs for targeted businesses and entrepreneurs.
Two of the CRA’s most vital commercial corridors—5th Avenue and Gall Boulevard—face unique challenges and opportunities. In recent years, some businesses in these areas have experienced significant hardships, including economic downturns, natural disasters such as flooding, and rising operational costs.
To address these challenges and promote equitable revitalization, the CRA seeks to establish separate, targeted incentive programs for businesses. This program will not only attract new businesses and entrepreneurs but also provide critical support to existing businesses that are struggling or recovering from hardship. Below is a list of suggested incentives for the targeted business.
• Hardship Recovery Grants for businesses affected by flooding or other disasters.
• Stabilization Incentives for struggling legacy businesses.
• Startup Support for new entrepreneurs in targeted sectors.
• Façade, Interior, and Site Improvement Grants.
• u tility Assistance for qualifying businesses.
• Business Recovery Grant: Up to $15,000 for businesses impacted by recent flooding or economic hardship.
• Commercial Façade & Site Enhancement Grant: Support for exterior upgrades, signage, and stormwater improvements.
• Targeted Business Attraction Incentive: Grants for new restaurants, healthcare providers, or servicebased businesses.
2.6 Establish an incentive policy for tenant improvements for commercial uses.
Historically, the Zephyrhills CRA’s incentive programs have primarily focused on property and landowners, offering support for exterior improvements, façade upgrades, and site enhancements. Howevvery, the CRA has a $5,000 commercial grant that can be utilized by tenants with the property and landowners approval.
To foster a more inclusive and dynamic business environment, the CRA recognizes the need to establish a dedicated Tenant Improvement Incentive Policy. This policy will help reduce barriers to entry for new businesses, support the growth of existing tenants, and encourage the adaptive reuse of underutilized commercial spaces.
Recommended tenant improvement incentives may include:
• Tenant Build-Out Grant Program: Assist new or expanding tenants with the cost of interior improvements necessary to occupy and operate in a commercial space.
• First-Time Tenant Assistance Program: Support first-time business owners or entrepreneurs with startup costs related to tenant improvements.
• Pop- u p to Permanent Incentive: Encourage shortterm or pop-up tenants to transition into long-term leases by supporting interior improvements.
2.7 Develop a business recruitment and retention program.
The CRA has identified a need to directly support the business community through strategic recruitment and retention initiatives. The CRA will develop a comprehensive Business Recruitment and Retention Program that attracts new, desirable businesses to the district while also supporting the sustainability and growth of existing businesses—particularly small, locally owned, historically underrepresented enterprises, and those facing economic challenges.
This initiative could be developed in partnership with Main Street Zephyrhills, the Greater Zephyrhills Chamber of Commerce, and the Zephyrhills Economic Development Coalition, ensuring alignment with broader economic development goals and leveraging local expertise and networks.
Retention assistance may include:
• Rent subsidies for new businesses in priority CRAs.
• Technical assistance and funding for business planning, marketing, and leasehold improvements.
• Business expansion
• Grants and low-interest loans for tenant improvements, equipment purchases, and working capital.
• Business support network to help with permitting, marketing, and operations
Recruitment efforts may include:
• Creation of a Business Recruitment Toolkit to attract targeted industries.
• Partnering with local chambers and business incubators to provide mentorship and training.
BUSINESS RECRUITMENT TOOLKIT
A Business Recruitment Toolkit should outline a comprehensive framework for creating a business-friendly environment, showcasing the city’s unique assets, engaging with the business community, and investing in workforce development. To ensure a truly coordinated effort, the Toolkit should also encourage collaboration with Pasco County, educational institutions, and other key organizations that support economic growth and talent development.
Here’s a breakdown of common elements to be included in the toolkit, some of which have been mentioned in this section.
• Building a Supportive Business Environment:
+ Designate a single point of contact for businesses to ensure streamlined communication and support.
+ Create Business-Friendly Policies
+ Invest in a well-maintained transportation network, reliable utilities, high-speed Internet, and efficient waste management systems.
+ Develop Attractive Public Spaces
• Showcasing the City’s Potential:
+ Promote the city’s unique features, such as downtown, parks, the airport, housing, and assets.
+ Share examples of businesses that have thrived in the city demonstrates its potential for growth and success.
+ Utilize social media and digital marketing tools allows cities to share their story and reach a wider audience of potential businesses.
• Engaging with Businesses:
+ Collaborate with existing businesses can strengthen marketing efforts and encourage further growth.
+ Organize events where businesses can connect with potential clients, investors, and industry peers fosters a supportive business community.
+ Hold annual meetings with business owners demonstrates a commitment to their success and proactively addresses concerns.
+ Collaborate with local organizations to support entrepreneurship provides valuable guidance and resources for new businesses.
• Talent and Workforce Development:
+ Showcase the city’s skilled workforce, potentially through partnerships with local and regional organizations, is a major draw for businesses.
+ Invest in Education and Workforce Development: Offering training programs, mentorship opportunities, and leadership development initiatives attracts and retains a qualified workforce.
• Financial Incentives:
+ Offer tax breaks, grants, or subsidies to businesses that create jobs or align with the City’s strategic goals.
+ Support startups and entrepreneurs through funding programs can encourage innovation and job creation.
• Data and Branding:
+ Provide businesses with concise information about relevant factors, such as economic performance and demographics, can support investment decisions.
+ Engage on social media platforms, showcasing workplace culture, and highlighting employee testimonials can attract top talent.
2.8 Connect existing and future business owners with resources and information.
It is essential to ensure that both existing business owners and prospective entrepreneurs have access to the tools, resources, and information they need to succeed. Many small businesses face challenges navigating permitting, financing, marketing, and workforce development— especially those new to the area or unfamiliar with available support systems.
The CRA will create a comprehensive and user-friendly system that connects current and future business owners with technical assistance and mentorship, financial resources and grant opportunities, permitting and regulatory guidance, marketing and branding support, and workforce development and training programs.
This system will provide a:
• Business Resource Directory (print and digital)
• Interactive webpage or portal
• Monthly business support newsletter
• Workshop calendar and promotional materials
2.9 Create targeted industry hubs or business incubators to support startups.
The CRA will create targeted industry hubs and business incubators that support startups and early-stage businesses to foster innovation, entrepreneurship, and long-term economic growth. These spaces will serve as catalysts for economic development by providing affordable workspaces, shared resources, mentorship, and access to capital, particularly for industries aligned with the City’s strategic goals, such as technology, creative services, light manufacturing, and health and wellness.
The CRA will partner with local educational institutions, economic development organizations, and private sector stakeholders; these hubs will help position the CRA and City as a destination for innovation and small business growth. Here are the recommended steps to kick off an incubator space.
• Identify potential locations for hubs/incubators within the CRA
• Conduct a market analysis to determine demand and industry focus areas
• Define the operational model (e.g., City-run, nonprofit-led, public-private partnership)
• Outline services offered (e.g., co-working space, maker space, kitchen, business coaching, access to funding)
• Collaborate with local colleges, chambers, economic development coalitions, and private sector partners
REFERENCE
Catapult | Lakeland, FL
Established in 2014 by the Lakeland Economic Development Council, Catapult was created to foster the growth of startups as a incubator and maker space.
Inspired by visits to entrepreneur centers around the United States, the LEDC launched Catapult in the basement of the Bank of America building to see if entrepreneurs in the community desired a place to collaborate.
Since then, Catapult has grown into a vibrant hub in downtown Lakeland, featuring three distinct incubators—Workspace, Makerspace, and Kitchen— each designed to support and accelerate the growth of businesses.
So URCE : CATAPULTLAKELAND.C o M
2.10 Partner with state, regional, and local agencies to market the unique advantages of the area to attract new business and industries.
The CRA is uniquely positioned to attract new businesses and industries due to its strategic location, historic charm, growing population, and access to regional transportation networks. The City has been working to attract businesses, particularly in the healthcare and aviation sectors.
However, to fully leverage these advantages, a coordinated marketing effort is needed—one that extends beyond local boundaries and taps into the resources and reach of state, regional, and local economic development agencies.
This initiative aims to build strong partnerships with organizations such as Enterprise Florida, Pasco EDC, Visit Florida, and local chambers and tourism boards to promote Zephyrhills as a prime destination for investment, entrepreneurship, and innovation.
Develop and implement a collaborative marketing strategy that:
• Showcases the unique assets of the CRA
• Aligns with regional and state economic development goals
• Attracts targeted industries and business sectors
• Enhances visibility through coordinated branding, outreach, and promotional campaigns
3. ENHANCE
Housing & Neighborhoods
Enhance and preserve the neighborhood’s residential character while expanding housing opportunities
OBJECTIVES
A. Invest in the existing housing stock and neighborhood infrastructure
Invest in home restorations, repairs, and upgrades to stabilize the housing stock and maintain the traditional and historic character of the neighborhoods. Complement these efforts with targeted alley and streetscape improvements.
ACTIONS
PROJECTS
PROGRESSIVE
DEVELOPMENT PLANNING & PREPARATION
POLICY AND PLANS
The CRA encompasses seven distinct neighborhoods, many of which were developed with traditional grid-style streets, walkable blocks, and access to parks—hallmarks of classic neighborhood design. These areas, including Plaza District, Oakside, Zephyr Lake, Hercules, Historic Jeffries, Historic Abbot, and Moore’s State, are rich in architectural heritage, with the majority of structures built before 1960. The CRA aims to preserve the unique character of its historic neighborhoods while expanding housing options and upgrading neighborhood infrastructure to meet evolving community needs. This effort will focus on protecting architectural integrity, supporting contextsensitive infill development, and identifying opportunities for diverse, affordable housing—all while maintaining the charm and walkability that define these neighborhoods.
B. Create opportunities for infill housing development
Encourage new housing construction to support smart growth and increase availability through targeted infill development.
C. Diversify housing options and identify sites for higherdensity development
Promote missing middle housing types to accommodate diverse household needs and support smart, higher-density development that fosters walkable and diverse neighborhoods.
3.3 Facilitate and support the development, land acquisition for infill housing sites.
3.4 Maintain an inventory of infill sites and contributing historic homes.
3.5 Promote adaptive reuse of existing nonresidential sites and structures to provide additional housing opportunities.
3.6 Develop pre-approved residential building plans set.
3.7 Modify zoning to allow missing middle housing.
3.8 Promote and incentive the development of accessory dwelling units (ADU) and missing middle housing typologies.
3.9 Continue investing in the residential ownership program and paying grant programs.
3.10 Broaden the incentives to stabilize the quality of the existing housing stock.
PROJECTS
PROGRESSIVE
3.1 Create neighborhood identification signage and gateways.
The CRA is composed of seven neighborhoods, each with its unique character, history, and development pattern. Most homes in the CRA were built in 1960 or earlier, resulting in a predominance of vernacular architecture. However, various styles—such as Mid-Century Modern, Florida Cracker, and Craftsman—can also be found throughout the area, contributing to its rich architectural diversity.
To celebrate these distinctions and support revitalization efforts, neighborhood-specific branding and signage are recommended. This approach will help strengthen community identity, improve wayfinding, and enhance the overall sense of place.
Branding should be:
• Visually cohesive with the overall CRA identity while reflecting each neighborhood’s unique character.
• Inspired by local architectural styles, natural features, and historic elements.
• Designed for walkability and visibility, suitable for both pedestrians and drivers.
• Constructed with durable materials appropriate for Florida’s climate.
• Optionally integrated with landscaping, lighting, or public art.
Neighborhood Highlights for Branding Consideration:
• Plaza District: A mixed-use area featuring a commercial strip plaza, mobile home communities, and singlefamily homes. As a gateway into the CRA, it has strong potential to become a vibrant, walkable commercial corridor.
• Oakside: A quiet, residential neighborhood defined by single-family detached homes. Its identity is rooted in stability, simplicity, and family-oriented living.
• Zephyr Lake : Located near Zephyr Park, this neighborhood features a diverse and evolving housing mix—including mobile homes, duplexes, tiny homes, and accessory dwelling units—blending historic charm with modern trends.
• Hercules: Hercules is also located near Hercules Park and the elementary and high school, making it ideal for family-friendly and recreational branding. It presents opportunities for adaptive reuse and creative redevelopment.
• Historic Jeffries : Known for its preserved architecture and cultural significance, this neighborhood reflects the early history of Zephyrhills. It is home to the Captain H.B. Jeffries House, a 1911 vernacular structure built by the city’s founder.
• Historic Abbot: Rich in architectural heritage, Historic Abbot offers a strong sense of place and continuity with the city’s early development, making it ideal for heritage-focused branding.
• Moore’s State: Named after a prominent local family, Moore’s State has a distinct identity tied to Zephyrhills’ roots and offers opportunities for cultural storytelling and legacy-based branding.
NEIGHB o RH oo D SIGN EXAMPLES
District Boundary
Zones
ZEPHYR
ABBOT
DEVELOPMENT PLANNING AND PREPARATION
3.2 Develop Agency-owned properties.
Develop a strategic plan to transform underutilized or vacant residential parcels owned by the Agency into high-quality, context-sensitive housing that supports neighborhood revitalization and expands housing options. The goal is not for the Agency to retain long-term ownership of these homes, but rather to develop and sell them to promote private investment and sustainable community growth. It is recommended that the Agency collaborate with experienced builders in the design and construction process to ensure quality, efficiency, and market alignment. Additionally, the Agency will contribute to funding construction plans to facilitate timely and wellcoordinated redevelopment efforts.
The development strategy should:
• Reflect the architectural character of surrounding neighborhoods, including vernacular, Florida Cracker, Craftsman, and Mid-Century Modern styles.
• Prioritize a mix of housing types (e.g., single-family homes, duplexes, townhomes, or cottage courts) to meet diverse community needs.
• Incorporate sustainable and resilient design principles suitable for Florida’s climate.
• Include options for public-private partnerships, phased development, or infill strategies.
• Consider affordability, accessibility, and long-term maintenance.
3.3 Facilitate and Support the Development and Land Acquisition for Residential Infill Sites.
Develop a strategy to facilitate and support the acquisition and development of infill housing sites within the CRA. The goal is to activate underutilized parcels, reduce blight, and increase the availability of diverse housing options that align with the character of existing neighborhoods.
The strategy should:
• Identify criteria for prioritizing infill sites based on location, infrastructure access, and neighborhood needs.
• Outline a process for land acquisition, including partnerships with private developers or nonprofit housing organizations.
• Include tools for community engagement and resident input in the planning process.
• Partner the effort with other funding sources and incentives to support acquisition and development.
• Promote long-term affordability, sustainability, and resilience in housing design.
3.4 Maintain an inventory of infill sites and contributing historic homes.
To support strategic redevelopment and historic preservation, the Zephyrhills Community Redevelopment Agency will maintain a comprehensive and regularly updated inventory of:
• Vacant or underutilized parcels suitable for infill housing development within the CRA.
• Contribute historic homes that offer cultural and architectural value to the community.
This inventory will serve as a planning tool to guide public and private investment, encourage adaptive reuse, and promote balanced growth that honors the city’s heritage while addressing housing needs.
This effort aligns with and can be implemented concurrently with Action 3.1.8: Create and manage a publicly accessible redevelopment site inventory, which calls for the development of a dynamic, web-based platform using ArcGIS Online.
3.5 Promote adaptive reuse of existing nonresidential sites and structures to provide additional housing opportunities.
Promote the adaptive reuse of existing nonresidential sites and structures to expand housing options within the CRA. This action encourages the transformation of underutilized buildings—such as hotels and churches, into vibrant residential spaces that contribute to neighborhood revitalization and housing diversity. This approach not only addresses housing needs, but also preserves architectural heritage and reduces environmental impact through sustainable redevelopment. Initial target sites include: First Baptist Church on 5th Avenue and Roadstar Hotel on Gall Boulevard.
ADAPTIVE REUSE
Columbia City Abbey Apartments | Seattle, WA
Columbia City Abbey Apartments is a striking adaptive reuse project in Seattle, Washington, designed by Allied8. The project transformed a historic 1920’s church into a mixed-use development featuring 14 unique residential units and 2 retail spaces while preserving key architectural features such as stained glass windows, vaulted ceilings, and original woodwork. The design blends historic character with contemporary living, offering a unique housing experience that honors the building’s spiritual and cultural legacy.
LEGEND
+ Vacant Parcels
+ Schools
+ City Hall Complex
+ Recreation and Open Space
+ Historic District
ROADSTAR HOTEL
PARCEL ACREAGE: 2.6 Ac.
PRIMARY USE: Hotel / Vacant
OWNER: Sofar Inc
FIRST BAPTIST CH u RCH
PARCEL ACREAGE: 4 Ac. Combined
PRIMARY USE: Church & Parking
OWNER: First Baptist Church of Zephyrhills
ROADSTAR HOTEL
CHURCH
POLICY AND PLANS
3.6 Develop pre-approved residential building plans set.
To streamline the development process and encourage high-quality, context-sensitive infill housing, the CRA will develop a series of pre-approved residential building plan sets, also known as turn-key development plans.
The goal is to reduce permitting time and design costs for builders and homeowners while ensuring consistency with community goals, neighborhood compatibility, and flood prevention.
The CRA will collaborate with architects, planners, and building officials to ensure the plans are code-compliant, adaptable to various lot sizes, and ready for expedited approval.
These plans will be designed to:
• Align with local zoning and design standards.
• Reflect the architectural character of Zephyrhills’ historic neighborhoods.
• Support a range of housing types, including ADUs, duplexes, and small-scale multifamily homes.
This is a new trend that many municipalities are implementing, including Orange County, Florida, and the City of South Bend, Indiana.
• Orange County, Florida, has implemented a preapproved ADU plan program, called Ready Set Orange.
• South Bend, Indiana, launched a “House Plans Catalog”, featuring pre-approved residential designs tailored to local zoning and lot sizes.
These examples demonstrate how turn-key plans can be a powerful tool for local governments to promote housing development, reduce costs, and maintain design standards.
TURN-KEY PLANS
Ready Set Orange
As part of Orange County’s initiative to expand the supply of affordable and attainable housing, the Ready Set Orange program offers pre-designed floorplans to streamline the construction of small residential units. Through a simplified process, property owners can build an Accessory Dwelling Unit (ADU)—ideal for housing family members or generating rental income—or construct a compact home suitable for a growing household.
The program is designed to make the permitting process more accessible by providing ready-to-use architectural plans and step-by-step guidance. Those who select one of the pre-approved designs may benefit from reduced permitting time and lower upfront costs, helping to accelerate the development of much-needed housing options across the county.
ACCESS o RY DWELLING UNIT (ADU) H o ME DESIGN
3.7 Modify zoning to allow missing middle housing typologies.
The Agency will work with the Planning Department to modify zoning to include missing middle housing typologies in the CRA.
“Missing middle housing” refers to a range of multi-unit or clustered housing types—such as duplexes, triplexes, fourplexes, townhomes, and cottage courts—that are compatible in scale with single-family neighborhoods. These housing types have historically provided affordable, walkable, and diverse living options, but have become increasingly rare due to restrictive zoning codes that favor single-family development.
Communities across the country are revising their zoning regulations to reintroduce these housing forms and address growing demand for affordable and workforce housing; walkable, mixed-income neighborhoods; and housing options for seniors, young professionals, and small families.
CRA Action Steps May Include:
• Identifying opportunity areas within the CRA for pilot projects or overlays.
• Engaging the public to build support and gather input on design and location preferences.
• Coordinating with planning and building departments to streamline approvals and provide guidance to developers.
The CRA can collaborate with the Planning Department on the following initiatives:
• Reviewing and updating zoning regulations to allow missing middle housing types by right in appropriate areas.
• Developing form-based or hybrid codes to ensure that new development is compatible with existing neighborhood character.
Below are several missing middle housing typologies that are compatible with the CRA’s typical residential lot size.
So URCE : MISSINGMIDDLEH o USING.C o M
DUPLEX: STACKED FOURPLEX: STACKED
LIVE WORK
COTTAGE COURT
3.8 Promote and incentivize the development of accessory dwelling units (ADu) and missing middle housing.
ADUs such as garage apartments, backyard cottages, and in-law suites—and missing middle housing types offer affordable, flexible, and context-sensitive housing solutions within the CRA. These housing forms support a range of household types, including seniors, young adults, and small families, while maintaining the scale and character of the neighborhoods.
A unique asset in the CRA is that every residential block has alley access. This feature provides a significant opportunity for infill housing by allowing rear access to parking and utilities, preserving the streetscape and walkability of the front yard; supporting discreet placement of ADUs behind primary homes; facilitating construction and service access without disrupting the main frontage, and improving site layout flexibility for duplexes, triplexes, and other small-scale housing types.
To support implementation of the City’s ongoing code updates related to ADUs and missing middle housing, the CRA will focus on targeted incentives, technical assistance, and demonstration efforts to encourage adoption within the district.
CRA Strategies May Include:
• Implement targeted strategies and incentives across the district.
• Financial assistance programs, such as grants or lowinterest loans for ADU and missing middle housing construction.
• Public education and outreach to inform property owners, builders, and developers about regulatory allowances, design options, and development benefits.
• Demonstration projects on Agency-owned sites to showcase context-sensitive ADUs and missing middle housing types and build community support (see Action 3.2).
• Design and construction incentives, such as preapproved plan sets and expedited review processes (see Action3.6).
• Coordination with City-led zoning and land development code updates to support by-right ADUs and missing middle housing in targeted CRAs (see Action 3.7).
3.9 Continue investing in the residential ownership program and paying grant programs.
The CRA currently offers a $5,000 home purchase incentive, distinct from traditional down-payment assistance, along with $2,500 in grants for exterior improvements and $500 to help residents enhance the appearance and value of their homes. However, to better address diverse community needs and housing goals, the CRA should continue investing in homeownership grant programs tailored to support a broader range of residents and revitalization efforts, such as:
• Rehabilitation and Renovation Grants: Providing funds to new homeowners for essential repairs or upgrades, especially in older or distressed properties, to improve housing quality and neighborhood aesthetics.
• Workforce Housing Incentives: Targeting grants toward essential workers—such as teachers, healthcare workers, and first responders—to encourage them to live within the community they serve.
• Employer-Assisted Housing Programs: Partnering with local employers to co-fund homeownership grants for employees, helping to attract and retain a stable workforce.
By diversifying its grant offerings, the CRA can further its mission to increase owner-occupancy, and promote equitable access to homeownership opportunities.
3.10 Broaden the incentives to stabilize the quality of the existing housing stock.
To further its mission of revitalizing neighborhoods and supporting long-term homeownership, the CRA will expand its residential incentives to include a broader range of housing stabilization efforts. Building on the success of the Residential Paint Grant Program, which provides up to $500 in matching funds for exterior painting of owner-occupied homes within the CRA Overlay District, the CRA aims to introduce additional support for:
• Essential home repairs (e.g., roofing, plumbing, electrical).
• Energy efficiency upgrades (e.g., insulation, windows, HVAC).
These enhancements will help preserve the existing housing stock, improve neighborhood aesthetics, and promote safe, healthy, and sustainable living environments. The expanded program will continue to prioritize owneroccupied residences and encourage reinvestment in the community.
OUTREACH
ADu Outreach Eduction Campaign | City of Orlando, FL
With support from the AARP Community Challenge Grant, the City of Orlando launched an ADU education and outreach campaign in multilingual and multicultural neighborhoods. The effort included community meetings, educational sessions, and consultations to gather feedback and develop accessible materials in multiple languages. The campaign resulted in a brochure outlining ADU requirements and best practices, as well as a dedicated webpage. AARP also provided additional informational resources to support the initiative.
4. BUILD
Connectivity & Infrastructure
Improve transportation and connectivity while upgrading infrastructure to address flooding and support infill development
OBJECTIVES
A. Enhance streets to link key destinations through a connected, multi-modal transportation network.
The plan will create a safe, accessible multi-modal system with walkable sidewalks, bike lanes, and enhanced streetscapes—encouraging active transportation, and fostering a vibrant, pedestrian-friendly environment.
ACTIONS
TRANSFORMATIONAL
PROJECTS
POLICY AND PLANS
INCENTIVES AND PROGRAMS
Zephyrhills faces ongoing challenges from aging infrastructure, frequent flooding, and limited connectivity. While the CRA benefits from a traditional street grid that supports walkability, many streets and alleys need to be improved. Several corridors lack safe pedestrian and bike access, and the alley system requires upgrades for drainage, access, and services. Recent storms have exposed drainage issues, causing repeated flooding in streets, parks, and buildings. In response, the CRA will partner with local, regional, and federal agencies to improve mobility, modernize stormwater systems, support infill development, and implement complete streets for better downtown connectivity
B. Develop resilient and sustainable infrastructure systems to enhance the area’s connectivity and support its growth.
Focus on modernizing infrastructure to withstand environmental challenges, improve mobility, and support walkability—enhancing streets, alleys, sidewalks, and parking for long-term resilience and accessibility.
4.1 Create a Comprehensive Bicycle Network and Greenway Loop.
4.2 Redesign Gall Boulevard ( US 301) as a Complete Street.
4.3 Redesign of 6th and 7th Street. PROGRESSIVE
4.4 Redesign Lake Necessity.
4.5 Make Stormwater and green infrastructure improvements.
4.6 Extend Avenue “A” to Gall Boulevard.
4.7 Improve the Alley System. BASIC
4.8 Continue improving the sidewalk system.
4.9 Make Streetscape Improvements.
4.10 Support implementing and expanding impact fees to fund critical infrastructure improvements
4.11 Support developing and implementing comprehensive mobility and infrastructure plans, policies, and projects.
4.12 Create programs and incentives for mobility and infrastructure improvements.
ELEMENTARY SCHooL
SIDEWALK IMPROVEMENTS
PROJECTS
TRANSFORMATIONAL
4.1 Create a Comprehensive Bicycle Network and Greenway Loop.
Zephyrhills currently has a developing bicycle network, but it lacks the comprehensive infrastructure seen in larger cities. The city’s layout includes some bike lanes, especially along major roadways, but they can be fragmented and don’t always offer continuous, safe routes. The network’s integration with local parks and schools is minimal, and connections between key destinations, such as Zephyr Park and Main Street, could be improved.
Most cycling in Zephyrhills is done on shared streets with vehicular traffic, which may discourage some cyclists. There is a growing focus on improving connectivity and safety for cyclists, with plans to create more protected bike lanes and multi-use paths.
The CRA’s comprehensive bicycle network focuses on a greenway loop connecting key community destinations. This loop links Main Street’s bustling businesses to Zephyr Park and the proposed Zephyr Creek Stormwater Park, enhancing urban environmental and stormwater management. The loop also extends to Oakside Cemetery and local schools, providing a safe, sustainable bike route for students. (See Figure 31: Connectivity Projects Maps.)
Supporting this core greenway loop is an extended bicycle network that reaches deeper into the surrounding neighborhoods, providing easy access for residents from all corners of the community. This broader network will include bike lanes, shared streets, and connections to residential areas, promoting a culture of active transportation and reinforcing the overall safety and efficiency of the system. Together, the loop and the extended network will not only foster recreation and connectivity but will provide alternative mode of transportation.
To maximize the safety and efficiency of the system, key intersections throughout the network will need to be improved. These intersections, which serve as critical junctures for both cyclists and vehicles, will be redesigned with enhanced signage, protected crossings, and trafficcalming measures, ensuring that all users can navigate the network safely and comfortably.
The proposed greenway loop will follow route along 12th Avenue, extending to 16th Street, and then weaving through South Avenue. As it passes through Zephyr Park, a key recreational area for the community, and the proposed Zephyr Creek Stormwater Park. The loop will continue onward, reaching 1st Street and then back to 12th Street. As mentioned above this loop will connect the schools, main street, and parks. (See Figure 31: Connectivity Projects Maps.)
The proposed path will be a 12-ft multi-purpose facility on one side of the street. The intent is to widen the existing side walk to accommodate this proposed facility and create an additional sidewalk on the other side of the street. Most streets have a 60-ft right-of-way (ROW), except for 1st Avenue, which has a 45-ft ROW, providing ample space to incorporate the new facility. See Figure 32: Greenway Loop illustrations, which depict both the typical existing street sections and the proposed street design.
Indianapolis Cultural Trail | Indianapolis, IN
The Indianapolis Cultural Trail is an 8-mile urban pathway that links cultural districts, neighborhoods, and points of interest throughout downtown Indianapolis. Opened in 2013, it serves as a pedestrian and bicycle route, encouraging active transportation and improving connectivity within the city. Key features include:
• Design and Art: The trail includes unique design elements and art installations that reflect the city’s culture and history.
• Cultural Connections: It connects key cultural attractions, fostering community engagement and exploration.
The Indianapolis Cultural Trail exemplifies how integrated urban planning can enhance connectivity, promote cultural engagement, and elevate the quality of life in a city.
EXISTING TYPICAL STREET SECTI o N (60’ R oW)
PR o P oSED STREET SECTI o N (12’ MULTI-USE PATH)
5’ SIDEWALK
TRANSFORMATIONAL
4.2 Redesign Gall Boulevard (uS 301) as a Complete Street.
U.S. Route 301 (US 301) is a major north-south highway in the eastern United States, running from Sarasota, Florida, to Houston, Maine. In Florida, US 301 begins in the southern city of Sarasota, where it connects to various local roads and highways. As it travels north, it passes through Zephyrhills and other cities, including Gainesville, Ocala, and Jacksonville.
US 301 runs through Zephyrhills, Florida, becoming Gall Boulevard, serving as a vital north-south commercial corridor for the city. The area around Gall Boulevard includes a mix of commercial establishments, restaurants, and service providers that cater to the community.
Overall, US 301 plays a significant role in the transportation infrastructure of Zephyrhills, supporting economic activity and enhancing connectivity within the region
Gall Boulevard serves as the primary north-south commercial corridor in Zephyrhills, featuring a two-lane configuration with a center left-turn lane at intersections and dedicated bike lanes. The road currently lacks curb, gutter, or street trees, and sidewalks are only present on one side. The City has outlined plans to enhance this corridor, developing a street redesign concept.
Since2019, the City of Zephyrhills Planning and Transportation Department has collaborated with the Pasco MPO on the redesign of Gall Boulevard (US 301). The redesign of Gall Boulevard is a significant initiative for the City of Zephyrhills and its business community. This project aims to transform the primary north-south commercial corridor into a more accessible and vibrant thoroughfare, benefiting both residents and local businesses.
The redesign of Gall Boulevard will adopt a complete streets approach, accommodating all users—drivers, pedestrians, cyclists, and public transit riders—to promote safety and accessibility. Sidewalks will be expanded and improved, encouraging pedestrian activity and enhancing the shopping experience. The redesign will also include curb, gutter, on-street parking, and street trees, creating an aesthetically pleasing environment that attracts visitors and supports local businesses.
The redesign represents a proactive step toward revitalizing the commercial corridor, fostering economic growth, and enhancing the quality of life for the entire community.
The project is currently listed in the Pasco MPO Multimodal Transportation List of Project Priorities. While specific construction dates vary, many of these projects are part of the Pasco MPO’s Long Range Transportation Plan (LRTP) and Transportation Improvement Program (TIP), which span 2025–2030 and beyond. Final design and construction timelines are typically updated annually through MPO and FDOT coordination.
The Zephyrhills Community Redevelopment Agency Staff and Board will remain actively involved in the project and collaborate with the City’s Public Works and Planning Department, as well as Pasco MPO and the Florida Department of Transportation (FDOT), to ensure that all decisions regarding the final street design reflect the community’s needs and aspirations. Their involvement will encompass various stages of the project, from initial planning and design to implementation and evaluation and budget allocation.
REFERENCE
uS 301 (Gall Boulevard) Design Concept Plans (2019)
The City of Zephyrhills created a series of proposed one-way pair street redesign concepts for Gall Boulevard. The new street design embraces a complete street approach. According to the U.S. Department of Transportation, Complete Streets are streets designed and operated to enable safe use and support mobility for all users. Those include people of all ages and abilities, regardless of whether they are traveling drivers, pedestrians, bicyclists, or public transportation riders.
Gall Boulevard Vision
Gall Boulevard is envisioned as a lively, pedestrian-friendly street that enhances community connectivity and offers residents easy access to shopping, dining, and services. It will function as a central hub for local businesses, integrating residential and commercial spaces to create a vibrant environment for living, working, and enjoying leisure activities. This corridor will drive economic growth and nurture a strong sense of community belonging.
INFILL RESIDENTIAL
OUTDOOR SEATING SPACES
SHADE TREES
WIDE SIDEWALKS
RAISED WALKWAY
ON-STREET PARKING
Gall Boulevard Today
FORMER SUNTRUST SITE
IMPROVED CROSSWALKS
LIGHTING AND BANNERS
STORMWATER PLANTERS
TRANSFORMATIONAL
4.3 Redesign 6th and 7th Street.
6th Street, a vital two-lane southbound one-way road parallel to Gall Boulevard, is a key link between commercial and residential areas running through the Oakside and Zephyr Lake neighborhoods. It marks the western boundary of the Gall Boulevard Form-based code. Unfortunately, it faces infrastructural issues, lacking essentials like curbs, gutters, street trees, and pedestrian lights. Additionally, only one side of the northern segment has a limited sidewalk, and intersections lack crosswalks and ramps, posing challenges to pedestrian safety and accessibility.
7th Street, a two-lane, northbound, one-way thoroughfare parallel to Gall Boulevard on the east, is a secondary commercial corridor. Despite partial improvements in certain segments, the street grapples with significant infrastructural deficiencies. Basic elements such as curbs, gutters, street trees, and pedestrian lights are notably absent across most of its length. Additionally, sidewalk provisions are limited. The intersections along 7th Street mirror these infrastructural gaps, lacking essential pedestrian amenities like curbs, gutters, designated crosswalks, and ramps.
Both 6th Street and 7th Street offer significant potential to become north-south alternatives to Gall Boulevard by incorporating protected bicycle lanes, while also supporting infill redevelopment projects. They are a vital link between commercial and residential areas, could see transformative benefits from a redesign. By adding protected bike lanes and addressing its current infrastructural issues.
The redesign of 6th and 7th Streets in downtown Zephyrhills is a key component of the broader FDOT-led US 301 Corridor Improvement Project. As part of this project, stormwater upgrades, roadway reconstruction, and streetscape enhancements are being implemented along 6th Avenue and surrounding blocks. These improvements
include new stormwater inlets and piping, resurfacing, sidewalk and curb upgrades, and improved signage and striping—all designed to address flooding, improve safety, and support future development.
Importantly, once construction is complete, ownership and maintenance responsibilities for 6th and 7th Streets will be transferred from FDOT to the City of Zephyrhills. This transfer will give the City greater flexibility to manage and program future improvements that align with local priorities and the Agency’s long-term vision for downtown.
6TH STREET (Loo KING N o RTH)
7TH STREET (Loo KING N o RTH)
PROGRESSIVE
4.4 Redesign Lake Necessity.
Lake Necessity is a dry-bottom stormwater pond located downtown, between Gall Boulevard and the Zephyrhills City Hall. It comprises a concrete retaining wall forming a “collar” along the site’s perimeter. The decorative fencing improves the site’s aesthetic appeal; however, the overall utilitarian design of this highly visible site detracts from a sense of place and possible gateway for City Hall.
The Little but Loud Master Plan identified Lake Necessity as one of four catalyst sites. These projects were designed as small, low-cost, low-risk interventions in the downtown public realm, focused around City Hall and Main Street.
The plan states that the development intends to capitalize on Lake Necessity’s creative, adaptive reuse as an anchor attraction. The primary goal is to repurpose this utilitarian and frankly uninspiring community entrance feature into a visually aesthetic multi-purpose amenity and gateway to City Hall.
Recognizing its potential, the proposed redesign includes a range of low-cost, incremental improvements aimed at increasing recreational value and visual appeal. Ideas include a dog-friendly walking path, landscaped mural designs , and a public art initiative to engage the community. Additional features may include native stormwater plantings, a memorial plaza, an observation deck, a dry stream bed, a trail with exercise equipment, and seating areas integrated with slides and murals. Together, these enhancements will help reimagine Lake Necessity as a welcoming, multi-use destination that reflects the character and creativity of Zephyrhills.
The Agency will continue supporting this project by working with other City departments in the implementation of the project. The Agency will support and allocate a budget for the project’s design, construction, and maintenance.
Healthy West Orange Wellness Parks | Ocoee, FL
The 5-acre Wellness Stormwater Park includes a half-mile, 10-foot-wide walking path encircling a landscaped pond that utilizes Low Impact Design (LID) techniques and stormwater planters. Originally a utilitarian stormwater pond, the site was transformed into a multifunctional public space that now features gathering areas for health-related events, four wellness stations placed around the perimeter, boardwalks, scenic overlooks, and city gateway features. This project serves as a model for integrating stormwater management with public wellness and placemaking, and can be used as a sample concept for the redesign of Lake Necessity.
PROGRESSIVE
4.5
Make Stormwater and Green Infrastructure Improvements.
The City and areas of the CRA face notable stormwater management challenges, particularly after heavy storm events. Due to the city’s flat terrain, water accumulates, leading to localized flooding in low-lying areas and along certain streets. The existing stormwater infrastructure, including drainage ditches and retention ponds, can struggle to handle the large volumes of water during and after intense rainstorms, exacerbating flooding.
To address its stormwater challenges, the Agency and the City can focus on increasing and improving stormwater capacity. Some actions may include:
• Upgrading Drainage Infrastructure
• Increasing Retention Capacity
• Implementing Green Infrastructure Tools
The Agency will lead efforts to secure funding and resources for stormwater and green infrastructure initiatives, focusing on identifying priority areas for improvement. It will collaborate with Pasco County to pursue regional, state, and federal grants that support projects addressing flooding, stormwater management, environmental sustainability, and disaster recovery.
The Agency can focus on advancing implementation of the City’s 2023 Stormwater Master Plan (see reference). The plan identifies nine specific Best Management Practices (BMP) projects for potential implementation.
REFERENCE
Stormwater Master Plan (February 2023)
The city-wide plan, created by Kimley-Horn, aimed to determine flood risk, evaluate the level of service, and develop Best Management Practices (BMPs) to reduce flooding and improve water quality for both the built and natural environment. The plan provided data for criteria for a four-tier system establishing a level of service relating to flooding and water quality. Twenty basins within the city were identified that met a threshold indicating a certain level of stormwater impact. The top ten basins were further ranked as to the relative extent of flooding and water quality; the highest-ranked ones appeared to be within the
boundaries. There were nine specific BMPs projects to consider for implementation.
REFERENCE
City of Philadelphia Green City, Clean Water | Philadelphia, PA
This program aims to manage stormwater through green infrastructure, including stormwater planters. The City has installed planters in residential and commercial areas to absorb runoff and reduce flooding. The planters are integrated into streetscapes, helping to beautify neighborhoods while providing environmental benefits.
WHAT ARE GREEN TOOLS?
Green stormwater infrastructure, also known as GSI or green tools, reduce overflows by decreasing how much runoff gets into sewers. Stormwater is soaked up by plants and soil and evaporates into the air, or is released into sewers more slowly. Trees, plants, and other natural elements provide benefits for people and the environment, while also managing stormwater.
So URCE : HTTPS://WATER.PHILA.G o V/ST o RMWATER/
GREEN TOOLS KIT
Green City, Clean Waters promotes the use of green stormwater infrastructure throughout the city. These green tools use plants, trees and stone to filter store and manage stormwater in a smart and cost-effective way. The tools include:
• Stormwater Basins
• Stormwater Bumpouts
• Downspout Planters
• Green Gutters
• Permeable Paving
• Rain Gardens
• Swales
• Stormwater Trees
• Stormwater Planters
• Cisterns & Rain Barrells
• Drainage Wells
• Green Roofs
• Blue Roofs
• Subsurface Trenches
• Tree Trenches
• Stormwater Wetland
TREE TRENCH
STo RMWATER TREE
STo RMWATER PLANTER
PROGRESSIVE
4.6 Extend Avenue “A” to Gall Boulevard.
Section 3.1.2 proposes the creation of distinct gateway places, which include the design of a South Gateway Place anchored by Sheppard Park and its surrounding blocks—as a vibrant and welcoming entrance to the city. A central element of this vision is the extension of Avenue “A” to Gall Boulevard, which would establish a seamless connection that enhances mobility, access, and urban cohesion.
Avenue “A” currently does not extend across Gall Boulevard due to the existing street layout and configuration, which limits connectivity in the area. Extending this roadway directly to Gall Boulevard—and redesigning the new intersections to accommodate all turning movements—would significantly enhance access and circulation, supporting future redevelopment efforts.
It is recommended to incorporate a roundabout at the new intersection to calm traffic and serve as a visual focal point. Additionally, the inclusion of prominent gateway signage and thoughtful roundabout design can strengthen the connection between Sheppard Park and adjacent development, encouraging pedestrian activity and fostering a more vibrant, interactive public realm.
PROGRESSIVE
4.7 Improve the Alley System.
Revitalize the existing alley network, transforming it into a valuable asset that supports infill redevelopment, enhances access, and upgrades infrastructure. Although every block currently includes alleys, they remain largely unimproved and underutilized—limiting their potential to support circulation, service access, and pedestrian connectivity. The Oakside and Zephyr Park Neighborhood Plan proposed alley improvements, for these neighborhoods. However, broader implementation requires action through the CRA.
Strategic Objectives:
• Upgrade Existing Alleys: Improve surface conditions, drainage, and lighting to make alleys functional for both vehicles and pedestrians.
• Promote Rear Access: Encourage the use of alleys for rear parking, loading, and service access. This will reduce curb cuts along primary streets and enhance the pedestrian experience.
• Enhance Safety and Aesthetics: Integrate landscaping, lighting, and wayfinding elements to make alleys safer, and more attractive.
• Require Alley Improvements for New Development: Mandate that all new development projects include alley upgrades as part of site planning and permitting. This ensures consistent investment in alley infrastructure and supports long-term urban connectivity.
Recommended Next Steps
Prioritize improvements in alleys that directly support:
• New Infill development.
• Mixed-use projects.
• Adaptive reuse of existing building.
REFERENCE
Oakside-Zephyr Park Plan Alley Improvements Recommendations
The images on this page present an overview of the proposed enhancements to alleyways in the Oakside and Zephyr Park neighborhoods.
Alleyways TODAY: Represents the current alleyway showing overgrown grass, utility poles, and adjacent residential buildings—highlighting the underutilized and unimproved state of existing alleys.
Alleyways NEXT: Illustrates a redesigned alleyway featuring green landscaping, pedestrian pathways, and infill development opportunities —demonstrating the envisioned transformation. As well as a technical drawing showing a 24-foot-wide alley cross-section, indicating space allocation for vehicles, pedestrians, and landscaping.
E. Alleyways TODAY
E. Alleyways NEXT
LID stormwater management
Combination porches, garages, fences, and yards
E. Alleyways NEXT
BASIC
4.8 Continue improving the sidewalk system.
The Zephyrhills CRA remains committed to fostering a walkable, connected, and pedestrian-friendly environment. Building on its long-standing investment in public infrastructure, the CRA will continue to prioritize sidewalk improvements as a key strategy for enhancing mobility, safety, and accessibility throughout the CRA.
The CRA will fully implement the 2020 Sidewalk Master Plan, which provides a comprehensive framework for addressing sidewalk gaps, improving connectivity, and supporting multimodal transportation options. By 2025, the City has successfully invested nearly $1.8 million in sidewalk construction within the CRA boundaries. This investment has resulted in the completion of all High and Medium Priority segments identified in the Master Plan, significantly improving pedestrian access to key destinations such as schools, parks, commercial corridors, and residential neighborhoods.
Looking ahead, the CRA will explore opportunities to:
• Address remaining Low Priority segments as funding becomes available. (See Sidewalk Prioritization Map on the following page.)
• Integrate sidewalk improvements with other streetscape improvements. (See Action 4.9: Make Streetscape Improvements.)
• Coordinate with regional partners to support broader mobility goals and ensure consistency with city-wide transportation planning efforts.
• Engage the community in identifying future sidewalk needs and priorities through inclusive outreach and participatory planning.
These efforts will help ensure that the CRA continues to evolve as a safe, vibrant, and accessible place for residents, visitors, and businesses alike.
1ST STREET SIDEWALK o N o N-SIDE
SUB-STANDARD SIDEWALK @ 10TH ST AND SCH oo L
5TH
REFERENCE
The prioritization for completing the missing sidewalk network will ensure that the most vital streets and locations have sidewalks first. The map below illustrates all the existing sidewalks and new proposed sidewalks color coded by level of priority. The Circles on the map represents 0.25 mile radius from schools, parks and City Complex. Overall, the prioritization for completing the missing sidewalk network will ensure that the most vital streets and locations have sidewalks first and that eventually every street in the CRA is walkable. A composite map, Map 11, is provided for reference.
F IG u RE 33. SIDEWALK PRIORITIZATION MAP
+ Woodland Elementary School
Hercules Park
West Zephryhills Elementary School
RB Stewart Middle School
City Complex
Zephyr Park
Low Priority
• 0.25-mile radius connecting to City Hall/library
• Connects to 1–2 existing sidewalks
• Secondary roadway
• 0.25-mile radius connecting to Zephyr or Hercules Park
• Connects to 3 or more existing sidewalks
• Primary roadway
• Street segments that have no sidewalk on either side Medium Priority
High Priority
• 0.25-mile radius connecting to schools
BASIC
4.9 Make Streetscape Improvements.
In addition to sidewalk improvements, invest in the other elements of the streetscape, such as the landscape, street furniture, lighting, stormwater features, gateways, and intersections.
The improvements should contribute to creating a vibrant, walkable environment supporting local businesses and community event; improve safety and accessibility for all users, including pedestrians, cyclists, and those with mobility challenges; strengthen the visual identity and sense of place within the CRA; and support environmental resilience, infill development and mixed-use projects through enhanced public realm design.
Proposed improvements include:
• Landscaping: Street trees, planters, bioswales, and green buffers to improve aesthetics and environmental performance.
• Street Furniture: Benches, trash receptacles, bike racks, and wayfinding signage to support comfort and usability.
• Traffic Calming: Curb extensions, raised crosswalks, and narrowed lanes to enhance pedestrian safety.
• Public Art & Identity: Murals, gateway features, and branded elements that reflect the character of City.
• Stormwater Management: Integration of green infrastructure to manage runoff and improve resilience and sustainability.
INTERSECTI o NS
BIKE PATH
LIGHTING
WAYFINING
STREET FURNITURE
PLANTING AND SIDEWALK
POLICY AND PLANS
4.10 Support implementing and expanding impact fees to fund critical infrastructure improvements.
To ensure long-term, sustainable funding for critical infrastructure improvements within the CRA, it is imperative to establish a dedicated stormwater fee and continue supporting the mobility fee.
Stormwater Fee
A dedicated stormwater fee will provide essential funding for the design, construction, and maintenance of stormwater infrastructure. This fee will:
• Address flooding and drainage issues
• Improve water quality and environmental resilience
• Support green infrastructure and low-impact development strategies
Mobility Fee
The mobility fee will continue to fund transportation improvements that align with the CRA’s goals for a more connected, accessible, and vibrant community. Key investments include:
• Sidewalk and streetscape improvements.
• Creation of the Downtown Loop.
• Street redesigns to enhance safety and usability.
• Alleyway improvements to support infill development and rear access.
4.11 Support developing and implementing comprehensive mobility and infrastructure plans, policies, and projects.
Investing strategically in mobility and infrastructure is essential to guiding the CRA’s role in shaping a connected, resilient, and future-ready community. The CRA will actively support developing and implementing comprehensive plans, policies, and projects that address the full spectrum of infrastructure needs within the CRA. This may include:
• Multimodal Transportation Planning: Develop integrated networks for pedestrians, cyclists, transit users, and vehicles to improve accessibility and reduce reliance on single-occupancy vehicles.
• Infrastructure Modernization: Upgrade aging infrastructure systems—including water, sewer, stormwater, and broadband—to support current and future development.
• Climate Adaptation Planning: Identify vulnerabilities and implement strategies to mitigate climaterelated risks such as flooding, heat, and extreme weather, while promoting green infrastructure and environmental resilience.
• Policy Alignment: Collaborate with City departments and regional partners to ensure CRA initiatives align with broader transportation and infrastructure policies.
• Project Implementation: Prioritize and fund highimpact projects that enhance connectivity, safety, and economic vitality, such as:
+ Complete Streets initiatives
+ Green infrastructure and stormwater improvements
+ Mobility hubs and transit-supportive infrastructure
+ Smart city technologies and infrastructure resilience
REFERENCE
Stormwater Park | City of Ocoee, FL
The 5-acre park can store 12.6 acre-ft, or 4.1 million gallons, of stormwater from 41.7-acres of Ocoee’s downtown district. Divided into three distinct sections, the park will provide water quality enhancements for Starke Lake and help increase the City’s flood resiliency.
A stream meanders gracefully along the south side of the park, pooling at three strategically placed weirs to promote settling of large particulate matter such as dirt and dust as well as organic matter like sticks and leaves, clarifying the water before it continues its journey to Starke Lake.
An enhanced wetland in the center of the park captures floatables and treats stormwater runoff by removing nutrients from the water that promotes plant growth, including algae. The park was designed to remove 4.7-kg of nitrogen and 1.4-kg of phosphorus a year. This helps keep the City’s chain of lakes, Lake Starke, Lake Prima Vista, and Lake Olympia, clean, fighting the harmful algae blooms that have plagued the lakes. The presence of the
enhanced wetland, and the reduction in algal blooms, leads to an increase in biodiversity in the area, improving the environmental health of Ocoee’s downtown, drawing wildlife enthusiasts, residents, and business into the City’s center
.The large pond on the north side is the dominating feature of the park and provides a place for rainwater to flow and collect away from the streets and buildings of downtown. The enhanced storage capacity of the park lowers the base flood elevation of the downtown drainage area by approximately 2-ft, reducing the risk of flood, property damage, and loss of life due to flood. The increased flood resiliency lowers the cost of flood insurance for downtown residents and business owners alike. With the floodplain lowered, and excess stormwater storage accounted for, more land is available for safe development by local retailers and restaurants to help create a more inviting downtown atmosphere.
INCENTIVES AND PROGRAMS
4.12 Create programs and incentives for mobility and infrastructure improvements.
The CRA will develop and implement programs and incentive structures that support infrastructure and mobility enhancements aligned with redevelopment goals. The purpose of these programs and incentives is to accelerate infrastructure upgrades and promote multimodal transportation by establishing targeted programs and incentives that encourage public and private investment in mobility and infrastructure improvements within the CRA.
Sample programs and incentives include:
• Incentive Grants or Matching Funds: For private developments that incorporate public infrastructure improvements such as sidewalks, alley upgrades, or stormwater enhancements.
• Mobility Enhancement Incentives: For projects that include bike lanes, pedestrian connections, transitsupportive features, or reduced parking through shared mobility solutions.
• Fee Reductions or Deferrals: For developments that meet specific mobility or infrastructure criteria, such as proximity to transit, inclusion of green infrastructure, or participation in Complete Streets initiatives.
• Public-Private Partnerships (P3s): To co-fund major infrastructure projects that benefit both the community and private stakeholders.
• Technical Assistance Programs: To help property owners and developers navigate infrastructure requirements and integrate mobility improvements into their site plans.
5. LEVERAGE
Parks & Open Space
Leverage the parks and open space system to enhance the community’s vitality
OBJECTIVES
A. Invest in the enhancement and long-term development of parks and open spaces
Create vibrant community hub parks, where natural and open spaces promote wellness, connection, and environmental resilience.
Leverage CRA parks and open spaces—such as Hercules Park, Zephyr Park, Shepard Park, and the Zephyr Creek corridor—to enhance community vitality, environmental conservation, and climate resilience. Green spaces are essential infrastructure—they strengthen local economies, improve public health, and build stronger community bonds. Invest in long-term planning to transform these areas into vibrant community hubs for residents and visitors to enjoy. Foster collaboration across City departments to ensure parks serve both recreational and ecological functions, supporting a healthier, and better connected park system.
ACTIONS
TRANSFORMATIONAL
PROJECTS
POLICY AND PLANS INCENTIVES AND PROGRAMS
B. Integrate climate adaptation and stormwater management into parks and open spaces
Parks should be designed to do more than recreation; parks play a vital role in protecting our community from flooding and the impacts of climate change.
5.1 Leverage Zephyr Creek as both open space and stormwater infrastructure. PROGRESSIVE
5.2 Redesign and improve Shepard’s Park.
5.3 Identify strategic locations within parks to establish resilience hubs.
5.4 Support the recommendations of the Zephyrhills Parks Assessment and Master Plan.
5.5 Support the creation of a Parks and Recreation Department.
5.6 Create a branding, signage, and wayfinding for the parks and open space system.
5.7 Support CRA and city-wide stormwater, conservation, and adaptation plans, fees, and projects.
5.8 Continue the allocation of funding for parks and other projects.
5.9 Apply to State and Federal Grants to fund parks and climate adaptation projects.
PROJECTS
TRANSFORMATIONAL
5.1 Leverage Zephyr Creek as both open space and stormwater infrastructure.
Zephyr Creek runs through the City of Zephyrhills and Pasco County, with a drainage area of approximately two square miles. Although currently underutilized, it holds significant potential to become a vibrant natural corridor that not only reduces flooding and improves water quality but also supports recreation, enhances biodiversity, serves as a new community destination, and creates economic opportunity. Imagine it as a vital green corridor—a place for recreation, a haven for wildlife, and a smart solution for managing stormwater. By transforming Zephyr Creek and its surrounding natural areas into dual-purpose assets, the City can integrate open space with stormwater infrastructure, creating a resilient and multifunctional landscape. This project also presents an opportunity to extend the character and connectivity of Zephyr Park, creating a seamless continuation of public green space. Additionally, it can be integrated with the proposed Greenway Loop Project (see 3.4.1), linking neighborhoods, parks, and natural areas through a connected network of trails that promotes mobility, health, and environmental stewardship.
REFERENCE
Creek Restoration | Jacksonville, FL
The McCoy’s Creek Restoration in Jacksonville is transforming a once-overlooked waterway into a vibrant public space that naturally manages stormwater. The project aims to reduce flooding, improve water quality, and restore native habitats, while expanding recreational access through a greenway that connects neighborhoods and links to the regional Emerald Trail.
ZEPHYR CREEK RESTo RATI o N RENDERING
So URCE : GR o UNDW o RKS JACKS o NVILLE
PROGRESSIVE
5.2 Redesign and improve Shepard’s Park.
Shepard Park, located at the intersection of Gall Boulevard and Avenue A in the southern portion of the CRA, spans approximately 2 acres and currently functions as a passive neighborhood park. Existing amenities include a scout activity building, mini picnic shelters, a swing set, a basketball court, and an open play area. The park is a valued community asset and serves as a meeting location for the local Girl Scouts.
However, the park’s topography presents a significant challenge—it sits lower than the adjacent roadway, resulting in frequent flooding during regular storm events. This recurring issue limits the park’s usability and underscores the need for a comprehensive redesign that addresses both recreational and environmental concerns.
As part of the South Gateway and Avenue “A” Extension Project, the CRA plans to redesign Shepard Park into a multifunctional space that enhances connectivity, resilience, and community life. The park’s natural bowllike shape supports a dry stormwater park concept with bioswales, rain gardens, permeable surfaces, and nature spaces to manage runoff, improve water quality, and support native habitat. During dry seasons, the central basin will serve as a community amphitheater and seating area, providing space for performances, gatherings, and informal recreation.
The plan also recommends constructing a new community building, potentially designed as a resilience hub to support emergency response. To reinforce the park’s identity as the southern gateway to Zephyrhills, a distinctive gateway sign is proposed at the entrance, enhancing visibility from Gall Boulevard and welcoming visitors into the district.
Additionally, the CRA may consider expanding the park by acquiring adjacent land, allowing for greater flexibility in programming, enhanced green space, and future recreational amenities.
Recommended Improvements:
• Stormwater capacity
• Playground and/or nature play areas
• Sports court.
• Walking loop.
• Shade and seating areas.
• Signage and Wayfinding.
To Mo RR oW AS PART o F THE S o UTH GATEWAY IMPR oVEMENTS
SHEPARD PARK To DAY
PARK TODAY
SHEPARD PARK
PROGRESSIVE
5.3 Identify strategic locations within parks to establish resilience hubs.
Explore ways to identify strategic locations within parks to establish resilience hubs—spaces supporting the community during emergencies and serving as year-round centers for resources, education, and social connections.
These hubs could include features like:
• Backup power and water supplies
• Cooling or heating stations during extreme weather
• Emergency communication tools
• Storage for supplies and equipment
• Space for community meetings and resource distribution
As part of this vision, a resilience hub could be integrated into the redesign of Shepard Park, enhancing its role as a community anchor at the South Gateway. Additionally, new structures at Zephyr Park and Hercules Park could serve as future resilience hub sites. In addition, other civic and institutional buildings—such as City Hall, churches, fire stations, and schools—could serve as resilience hubs, expanding the City’s capacity to respond to climate events and community needs.
Partnerships will be key to making these hubs a reality. Potential collaborators may include:
• Local utility providers.
• Emergency management agencies.
• Nonprofits and foundations.
• Educational institutions.
• Healthcare providers.
• Pasco County.
• State and federal agencies.
REFERENCE
What is Resilience Hub?
A resilience hub is a community facility designed to support residents before, during, and after emergencies—while also serving everyday needs. These hubs are typically located in accessible areas and equipped to provide:
• Emergency support such as shelter, power, water, and communications during disasters.
• Community services and resource distribution.
City of Orlando Resilience Hubs | Orlando, FL
In April 2021, the City of Orlando, was awarded a $2,850,000 grant by the State of Florida’s Department of Economic Opportunity through HUD’s Community Development Block Grant (CDBG) Mitigation General Infrastructure Program to transform six existing community centers into Resilience Hubs. Since them, the City has transformed six existing neighborhood centers into resilience hubs as part of its Future-Ready Master Plan. These hubs are designed to support residents during and after disasters like hurricanes, extreme heat, and flooding.
So URCE : FRIENDS o F LINC o LN SQUARE PARK WEBSITE
So URCE : CITY o F o RLAND o WEBSITE
POLICY AND PLANS
5.4 Support the recommendations of the Zephyrhills Parks Assessment and Master Plan.
The City-wide Parks and Recreation Master Plan (2025) outlines a comprehensive action plan. Plan recommendations include:
• Establishing Site Equity Standards.
• Implementing Sustainability Guidelines.
• Applying Crime Prevention Through Environmental Design (CPTED).
• Executing Site-Specific Park Improvements.
• Developing a Land Acquisition Strategy.
• Creating a Capital Improvement Plan (CIP.)
5.5 Support the creation of a Parks and Recreation Department.
Support the establishment of a dedicated Parks and Recreation Department for the City of Zephyrhills, as recommended in the Parks and Recreation Master Plan. This department should be responsible for overseeing park operations, recreation programming, facility maintenance, and community engagement. Key considerations include defining the department’s structure, identifying staffing and resource needs, securing sustainable funding sources, and coordinating with existing partners such as the YMCA and Pasco County. The new department should align with the City’s long-term goals for expanding access to highquality recreational opportunities for all residents.
5.6 Create a branding, signage, and wayfinding for the parks and open space system.
Develop a comprehensive branding, signage, and wayfinding system for all CRA parks and open space systems. The plan should establish a unified visual identity and signage system across all parks and open spaces. It must include guidelines for park entry signage, directional and interpretive signage, trail markers, and digital wayfinding tools. The plan should prioritize ADA compliance, multilingual accessibility, and integration with the City’s broader branding strategy.
5.7 Support CRA and city-wide stormwater, conservation, and adaptation plans, fees, and projects.
Support the development and implementation of CRA projects that address climate adaptation, stormwater management, parks, and the public realm improvements, and future-ready infrastructure. Collaborate and fund the creation of plan documents to address stormwater management, improve water quality, expand access to high-quality public spaces, and prepare Zephyrhills for emerging technologies. Advocate for the strategic use of impact fees to help finance these improvements, ensuring that new development contributes to the long-term sustainability and resilience of the community.
REFERENCE
Bonnet Springs Park | Lakeland, FL
Bonnet Springs Park in Lakeland, Florida, is a privately developed public park that relies entirely on community support. Built on the site of Florida’s longest former railyard, the park offers immersive experiences in nature, the arts, education, and wellness—while honoring the heritage and natural beauty of Lakeland and Polk County. A unified branding and wayfinding system enhances the visitor experience through clear signage and a strong visual identity that reflects the park’s mission and character.
INCENTIVES AND PROGRAMS
5.8 Continue the allocation of funding for parks and other projects.
Continue prioritizing and allocating dedicated funding for park improvements across CRA. Ensure that funding supports the implementation of the Parks and Recreation Master Plan, including but not limited to enhancements to park infrastructure, amenities, accessibility, and sustainability. Emphasize the importance of consistent investment through capital improvement planning, grant opportunities, and public-private partnerships to maintain high-quality, equitable, and resilient park spaces for all residents.
5.9 Apply to State and Federal Grants to fund parks and climate adaptation projects. Pursue state and federal grant opportunities to support the planning and implementation of park improvements and climate adaptation initiatives. Focus on securing funding for projects that enhance green infrastructure, improve stormwater management, expand access to public spaces, and build community resilience. Coordinate with City departments and regional partners to identify eligible programs, prepare competitive applications, and align proposed projects with local, state, and national sustainability goals.
So URCE : B o NNET SPRINGS PARK WEBSITE / SASAKI
04. Appendix
4.1
4.4
4.1 Tax Increment Financing Projections
Overview
The Community Redevelopment Act authorizes a county or municipality to create a Community Redevelopment Agency as a means of redeveloping areas experiencing slum and blighted conditions. Community redevelopment agencies administer programs and activities which implement goals as defined within an adopted master plan. These programs and activities are primarily funded by tax increment financing (TIF) revenue, which is used to leverage public funds to promote redevelopment activities within Community Redevelopment Areas (CRAs).
TIF revenues are generated from increases in property values above their value at the time the Community Redevelopment Agency was created. TIF revenues accrue into a Redevelopment Trust Fund which is created for that express purpose. The ordinance creating the Redevelopment Trust Fund specifies the base valuation of all property located within the boundaries of the CRA. Thereafter, 95% of taxes assessed by qualified taxing authorities on increases in the value of all property contained in the CRA accrue into the Redevelopment Trust Fund.
The Zephyrhills Community Redevelopment Agency was established in 1998 (“CRA I”) with a base year value of $15,924,352, and was subsequently expanded two time since its establishment, once in 2012 with a base year value of $26,432,345 (“CRA II”) and again in 2016 with a base year value of $35,515,198 (“CRA III”). Over the 10year period from 2014 to 2023, Zephyrhills CRA I, II, and III combined realized approximately $3,786,573 as TIF revenues to the Redevelopment Trust Fund. The historical collections of TIF revenues for the Zephryhills CRA I, II, and III are illustrated in the table below.
The total taxable value within Zephyrhills CRA I, II, and III is expected to grow at a compound annual growth rate (“CAGR”) of 4.2% from 2024 to 2033, and 3.7% from 2024 to 2045. During this period, Zephyrhills CRA I, II, and III is projected to generate between $55,560,300 and $68,878,200 in TIF revenue. This anticipated growth rate aligns with the historical taxable value performance of Zephyrhills CRA I and CRA II, which have achieved CAGRs of 3.8% and 5.5%, respectively, over the past decade.
2
TABLE 3. S u MMARY OF HISTORIC TIF COLLECTIONS – EXISTING ZEPHYRHILLS CRA
Major Assumptions
This tax increment analysis reflects a projected level of property values and the manner in which these property values are taxed, evaluated, and collected throughout the Zephyrhills Community Redevelopment Agency’s existence. A reasonable and diligent effort has been made to confirm all assumptions.
In the course of estimating TIF revenues, data provided by the Florida Department of Revenue (“FDOR”), Pasco County Property Appraiser, and City of Zephyrhills was considered. The projections reflect levels of tax increment that could be achieved based on expected development and redevelopment which may occur within the existing Zephyrhills CRA I, II, and III throughout the projection period. The following major assumptions were utilized within the projections:
• The TIF revenue projections reflect estimates up to the current operational sunset date, 2024 to 2045.
• Average annual increase or appreciation of existing and new taxable value includes value from residential and commercial development and redevelopment within the CRA(s), in addition to an annual inflation rate of 1.0%.
• Assumes full build-out of new development within 15 years and redevelopment construction within 20 years. New development includes converting tax-exempt properties to taxable and development on existing undeveloped properties.
• The Zephyrhills CRA I was established in 1999 with a base year value of $15,924,352, it was expanded two time since its establishment, once in 2012 with a base year value of $26,432,345 (CRA II) and again in 2016 with a base year value of $35,515,198 (CRA III).
Table 2. Causes of Change
Causes of Change
• Ad valorem tax millage rates utilized were 7.5700 for Pasco County and 6.2500 for the City, assuming a 95% participation rate. The millage rates are reflective of the final 2023 millage rates for both the County and the City.
• The Annual TIF Revenues are provided in three scenarios, high-moderate-low (“H-M-L”). This model provides a range of potential taxable value and annual TIF collections for the existing Zephyrhills CRA I, II, and III.
• The moderate projection scenario is considered the ‘most likely’ for any given year over the projection period, whereas the low and high projection scenarios present a range of possible outcomes.
In addition, the projections take into consideration the likely components of change in total taxable value from the current taxable value given the composition of properties within the existing Zephyrhills CRA I, II, and III. Projected future taxable value is anticipated to be a function of (1) growth in market values of existing improved properties over time (e.g., inflationary growth); (2) redevelopment of some portion of existing improved properties; (3) development of available vacant land area; and (4) additional growth in market value on newly developed or redeveloped properties over time. These causes of change are reflected in the table below.
So URCE : FD o R; PASC o C o UNTY PR o PERTY APPRAISER; CITY o F ZEPHYRHILLS; GAI C o NSULTANTS. N oTE: T oTALS MAY N oT ADD DUE T o R o UNDING
Sources: GAI Consultants; FDOR; Pasco County Property Appraiser; City of Zephyrhills. Note: Totals may not add due to rounding.
TABLE 4. CA u SES OF CHANGES
Investment and Redevelopment Opportunity Index
The ROI included in this analysis has been developed using weighted values that can identify potential investment and redevelopment properties located within a specific area. For the purpose of this analysis, investment and redevelopment opportunities were examined for the entire Zephyrhills Community Redvelopment Agency.
The ROI model defines investment opportunities as current for-sale commercial properties or available vacant land, whereas the ROI model defines redevelopment opportunities as select properties—including commercial, residential, and industrial/flex—based on Department of Revenue (DOR) property use codes, with an opportunity index score greater than 80. These redevelopment opportunities generally represent developed properties that may be in active use and are, in most cases, not currently on the market for sale. While many legal, physical, and economic factors ultimately play a role in the viability of redeveloping properties, the general factors used in the ROI model include the following:
• Property Utilization in terms of Floor Area Ratio (“FAR”).
• Age of the Improvements.
• Relationship between Land and Improvement Value.
• Total Market Value, including Land and Improvements per square foot of property.
• Size of the Parcels.
Each of these factors for these properties are weighted to provide a measure between 0 and 100. Values closer to 100 reflect factors in favor of redevelopment, and values closer to 0 reflect less favorable indicators for redevelopment. For this analysis, properties scoring 80 or above are considered significant redevelopment targets. The potential taxable value of these redevelopment targets is then estimated and applied to the TIF revenue projection model(s) utilizing the taxable value per square foot of existing properties recently built within the Zephyrhills Community Redvelopment Agency delineated by property use. It is important to note, the ROI Model does not consider any other legal, physical, or economic factors that may influence development opportunity.
Review of Milage Rates
Although the millage rates within both the County and City marginally decreased in 2023, millage rates have otherwise remained consistent over the last 10-years, as illustrated in the table below. In an effort to remain conservative, the tax increment projections apply the 2023 final property millage rates for both the County and the City as a constant 7.5700 and 6.2500 per $1,000 of taxable real property value, respectively, throughout the projection period. Although it is likely the millage rates may vary marginally during the projection period, the moderate projection scenario remains the ‘most likely’ and reasonable estimate of TIF revenues anticipated to be generated by the entire Zephyrhills Community Redvelopment Agency through 2045.
Table 3. Review of Millage Rates
So URCE : PASC o C o UNTY PR o PERTY APPRAISER; CITY o F ZEPHYRHILLS.
TABLE 5. REVIEW OF MILAGE RATES
Tax Increment Projections
Based on prior rates of growth and change in market-driven opportunities throughout the entire Zephyrhills Agency, the projection model takes a conservative approach in providing an H-M-L scenario for tax increment generated through 2045. While the moderate projection is considered the “most likely” scenario for any given year, the low and high projection scenarios present a range of possible outcomes for the same period. Conditions assumed to create each path of the low and high projection scenarios are not mutually exclusive and do not indicate an either/or path of potential TIF revenue projections through 2045.
• The moderate scenario assumes a continuation of historical inflationary growth plus development of vacant land and redevelopment of existing improved properties. Any general disruption of economic activity is considered short-lived and has a minimal impact on the region or the commercial and residential development sector in general.
• The low scenario considers a high possibility of a general U.S. economic recession occurring within the initial years of the projection period as a result of the current economic disruptions followed by long-term, slower market performance as a result of relative commercial and residential development market maturity. The low scenario assumes that the entire Zephyrhills Community Redevelopment Agency will be unable to maintain historical growth rates and should be viewed as a worstcase scenario.
• The high scenario is the most synergistic of the three scenarios and incorporates the optimal general economic conditions and continued robust market performance. This scenario assumes no disruption of general economic activity in the near-term or an historically short and very shallow U.S. recession followed by relatively robust growth. The high scenario also assumes an improved capture of commercial and residential development within the entire Zephyrhills Community Redevelopment Agency compared with other areas of the City and County.
The projection model predicts that the taxable value for current improved land, existing vacant land, and new development within the existing Zephyrhills CRA I, II, and III combined will generate a tax increment between $55,560,300 and $68,878,200 through the current Agency’s sunset date—experiencing an annualized average increment roughly between $2,525,468 and $3,130,827. The table below details the summary of tax increment projections for Zephyrhills CRA I, II, and III throughout the Agency’s current sunset date.
Over the full projection period, 2024 through 2045, the projection model reflects CAGRs in TIF revenues between 4.9% and 6.1% for the existing Zephyrhills CRA I, II, and III combined. Historic TIF revenues as well as the H-M-L projected TIF revenues from 2014 to 2045 are illustrated in Figure 29: TIFF Revenues (Historic and Projected), 2014 to 2045 Zephryhills CRA I, II, and III combined.
Table 4. Summary of TIF Revenue Projections, Cumulative
TABLE 6. S u MMARY OF TIF REVEN u E PROJECTIONS, C u M u LATIVE
So URCE : FD o R; PASC o C o UNTY PR o PERTY APPRAISER; CITY o F ZEPHYRHILLS; GAI C o NSULTANTS.
F IG u RE 34. TIF REVEN u ES (HISTORIC AND PROJECTED), 2014 TO 2045 ZEPHYRHILLS CRA I, II, AND III
The following tables illustrate the H-M-L projection scenarios for total taxable value, total tax increment, the County and City’s contribution to the Redevelopment Trust Fund, and the total TIF revenues for the Zephyrhills CRA I, II, and III combined through the full projection period, extending from 2024 to 2045.
TABLE 7. S u MMARY OF TIF REVEN u E PROJECTIONS, ZEPHYRHILLS CRA I, II, AND
Table 5. Summary of TIF Revenue Projections, Zephyrhills CRA I, II, and III Combined, Low Scenario
TABLE 8. S u MMARY OF TIF REVEN u E PROJECTIONS, ZEPHYRHILLS CRA I, II, AND III COMBINED, MODERATE SCENARIO
Table 6. Summary of TIF Revenue Projections, Zephyrhills CRA I, II, and III Combined, Moderate Scenario
Table 7. Summary of TIF Revenue Projections, Zephyrhills CRA I, II, and III Combined, High Scenario
TABLE 9. S u MMARY OF TIF REVEN u E PROJECTIONS, ZEPHYRHILLS CRA I, II, AND III COMBINED, HIGH SCENARIO
So URCE : FD o R; PASC o C o UNTY PR o PERTY APPRAISER; CITY o F ZEPHYRHILLS; GAI C o NSULTANTS. N oTES: (1) REFLECTS BASE YEAR VALUE(S) o F $15,924,352 F o R CRA I (1999); $26,432,345 F o R CRA II (2012); AND $35,515,198 F o R CRA III (2016). (2) APPLIES MILLAGE RATE o F 7.5700 F o R THE C o UNTY AND 6.2500 F o R THE CITY.
4.2 Capital Improvement Plan
Corridor & Gateways
Corridor & Gateways
Housing & Neighborhoods
Housing & Neighborhoods
Lake Necessity Re-Design
Avenue “A” to Gall Blvd
3.1.6 Identify, acquire, and assemble future redevelopment sites (Land Adquisition and Building Demolition) $100,000$100,000$100,000$100,000$100,000
3.1.7 Develop a parking strategy that includes land acquisition and assembly
3.3.3 Facilitate and support the development, land acquisition for infill housing sites
3.3.4Maintain an inventory of infill sites and contributing historic homes
Housing & Neighborhoods3.3.5 Promote adaptive reuse of existing nonresidential sites and structures to provide additional housing opportunities
Corridor & Gateways
POLICY AND PLANS
3.1.8 Create a combined zoning and design guidelines document for the area
Connectivity & Infrastructure3.2.1Create a distinct brand for Gall Blvd, Main Street, and Ramblas
Connectivity & Infrastructure3.2.2 Create a public arts master plan
Connectivity & Infrastructure3.2.3 Create a wayfinding and signage plan
Housing & Neighborhoods3.3.6 Develop pre-approved residential building plans set
Housing & Neighborhoods3.3.8 Promote and incentive the development of accessory dwelling units and missing middle housing $200,000
Connectivity & Infrastructure
Parks & Open Space
Parks & Open Space
Parks & Open Space
Corridor & Gateways
Corridor & Gateways
Connectivity & Infrastructure
3.4.11Support developing and implementing comprehensive mobility and infrastructure plans, policies, and projects
3.5.4Support the recommendations of the Zephyrhills Parks Assessment and Master Plan
3.5.6Create a wayfinding master plan for parks and open space system
3.5.7 Support CRA and city-wide stormwater, conservation and adaptation plans
INCENTIVES AND PROGRAMS
3.1.11Provide design and planning assistance to landowner and prospective developers
3.1.12Provide incentives to preserve landmark and iconic buildings
3.2.4 Broaden the non-residential incentives policies for exterior and interior building, site improvements, and restoration
Economic Development3.2.5 Provide separate incentive programs for targeted businesses and entrepreneurs on 5th Avenue and Gall Blvd
Economic Development
Economic Development
Economic Development
Economic Development
3.2.6Establish an incentive policy for tenant improvements for commercial uses
3.2.7Develop a business recruitment and retention program
3.2.8 Connect existing and future business owners with resources and information
3.2.9Create targeted industry hubs or business incubators to support startups
Economic Development3.2.10 Partner with state, regional and local agencies to market the unique advantages of the area to attract new business and industries
Housing & Neighborhoods3.3.9Continue investing in the residential ownership program and paying grant programs
Housing & Neighborhoods
Connectivity & Infrastructure
3.3.10Broaden
3.4.12 Create programs and incentives for mobility and infrastructure improvements
Connectivity & Infrastructure 3.4.12Create programs and incentives for mobility and infrastructure improvements Parks & Open Space 3.5.8Continue the allocation of funding for parks and other projects
$10,000$10,000$10,000$10,000$20,000
4.3 Implementation Management
The Implementation and Management chapter establishes the legal, financial, and strategic foundation for revitalizing the Zephyrhills Community Redevelopment Area (CRA). It begins with the creation of a redevelopment trust fund, supported by tax increment financing, to fund CRA initiatives. Relocation procedures are outlined to minimize displacement, with support provided when necessary. The chapter also highlights the alignment of CRA goals and objectives with the City’s Comprehensive Plan, emphasizing coordinated efforts in capital improvements, environmental stewardship, economic development, housing diversity, and intergovernmental collaboration. Additionally, it includes a comprehensive community impact statement addressing key areas such as housing, mobility, environmental quality, public safety, and other critical components affected by redevelopment efforts. The chapter concludes with a summary of the master plan requirements outlined in Chapter 163 of the Florida Statutes
Community Redevelopment Act
The Community Redevelopment Act assists local governments in the prevention and elimination of slums and blight that contribute substantially and increasingly to the spread of disease and crime; constitute an economic and social liability imposing onerous burdens which decrease the tax base and reduce tax revenues; substantially impair growth; hinder the provision of housing accommodations; aggravate traffic problems; and substantially hamper the elimination of traffic hazards and the improvement of traffic facilities.
The following Florida Statutes (“ F.S.”) define slum and blight conditions, their specific effects, and the intentions of the community redevelopment regime as a tool for implementing policy and programs:
1 | F.S. Chapter 163.335(1) …[slum and blighted areas] constitute a serious and growing menace, injurious to the public health, safety, morals, and welfare of the residents of the state; that the existence of such areas contributes substantially and increasingly to the spread of disease and crime, constitutes an economic and social liability imposing onerous burdens which decrease the tax base and reduce tax revenues, substantially impairs or arrests sound growth, retards the provision of housing accommodations, aggravates traffic problems, and substantially hampers the elimination of traffic hazards and the improvement of traffic facilities; and that the prevention and elimination of slums and blight is a matter of state policy and state concern in order that the state and its counties and municipalities shall not continue to be endangered by areas which are focal centers of disease, promote juvenile delinquency, and consume an excessive proportion of its revenues because of the extra services required for police, fire, accident, hospitalization, and other forms of public protection, services, and facilities.
2 | F.S. Chapter 163.335(2) …certain slum or blighted areas, or portions thereof, may require acquisition, clearance, and disposition subject to use restrictions, as provided in this part, since the prevailing condition of decay may make impracticable the reclamation of the area by conservation or rehabilitation; that other areas or portions thereof may, through the means provided in this part, be susceptible of conservation or rehabilitation in such a manner that the conditions and evils enumerated may be eliminated, remedied, or prevented; and that salvageable slum and blighted areas can be conserved and rehabilitated through appropriate public action as herein authorized and the cooperation and voluntary action of the owners and tenants of the property in such areas.
3 | F.S. Chapter 163.335(3) …powers conferred by this part are for public uses and purposes for which public money may be expended and police power exercised, and the necessity in the public interest for the provisions herein enacted is declared as a matter of legislative determination.
4 | F.S. Chapter 163.335(5) …the preservation or enhancement of the tax base from which a taxing authority realizes tax revenues is essential to its existence and financial health; that the preservation and enhancement of such tax base is implicit in the purposes for which a taxing authority is established; that tax increment financing is an effective method of achieving such preservation and enhancement in areas in which such tax base is declining; that community redevelopment in such areas, when complete, will enhance such tax base and provide increased tax revenues to all affected taxing authorities, increasing their ability to accomplish their other respective purposes; and that the preservation and enhancement of the tax base in such areas through tax increment financing and the levying of taxes by such taxing authorities therefore and the appropriation of funds to a Redevelopment Trust Fund bears a substantial relation to the purposes of such taxing authorities and is for their respective purposes and concerns…
5 | F.S. Chapter 163.335(6) …there exists in counties and municipalities of the state a severe shortage of housing affordable to residents of low or moderate income, including the elderly; that the existence of such condition affects the health, safety, and welfare of the residents of such counties and municipalities and retards their growth and economic and social development; and that the elimination or improvement of such condition is a proper matter of state policy and state concern is for a valid and desirable public purpose.
The CRA possesses the authority to govern the course of action concerning the redevelopment and rehabilitation of the area, and further, in the corporate limits of the City in the case that the City’s governing body has acceded in the Master Plan set forth by the City.
CRA Legal Description
For a POINT OF BEGINNING, commence at the Southwest corner of the intersection of South Avenue and 17th Street; thence Southerly along the West right-of-way of said 17th Street, to the North rightof-way of C Avenue; thence Westerly along the North right-of-way of said C Avenue, to the Northerly prolongation of the East boundary of that parcel described in Official Records Book 8839, Page 1183, of the public records of Pasco County, Florida; thence Southerly along the Northerly prolongation and continuing along the East boundary of said parcel, to the North boundary of that parcel described in Official Records Book 8884, Page 2689, of the public records of Pasco County, Florida; thence Easterly and continuing clockwise around said parcel described in Official Records Book 8884, Page 2689, to the intersection of the South boundary of said parcel and the East right-of-way of Gall Boulevard; thence Northerly along said East right-of-way of Gall Boulevard, to the Northeast corner of the intersection of Gall Boulevard and the aforementioned C Avenue; thence Westerly along the North right-of-way of said C Avenue, to the Southeast corner of WINTERS MOBILE HOME PARK as described in Official Records Book 955, Page 76, of the public records of Pasco County, Florida; thence Northerly and continuing counterclockwise around said WINTERS MOBILE HOME PARK, to the South right-of-way of State Road 54; thence Southwesterly along the South right-of-way of said State Road 54, to the Northwest corner of that parcel described in Official Records Book 5306, Page 1128, of the public records of Pasco County, Florida; thence Southerly along the West boundary of said parcel described in Official Records Book 5306, Page 1128 and continuing along the West boundary of WINTER’S SUBDIVISION, as per the plat thereof recorded in Plat Book 8, Page 79, of the public records of Pasco County, Florida, to the Northeast corner of that parcel described in Official Records Book 288, Page 201, of the public records of Pasco County, Florida; thence Westerly along the North boundary of said parcel described in Official Records Book 288, Page 201, to the Northeast corner of that parcel described in Official Records Book 8575, Page 3625, of the public records of Pasco County, Florida; thence Southerly along the East boundary of said parcel described in Official Records Book 8575, Page 3625, to the North right-of-way of Waverly Avenue; thence Westerly along said North right-of-way of Waverly Avenue, to the Southwest corner of that parcel described in Official Records Book 8874, Page 3983, of the public records of Pasco County, Florida; thence Northerly along the West boundary of said parcel described in Official Records Book 8874, Page 3983, to the South boundary of that parcel described in Official Records Book 9200, Page 274, of the public records of Pasco County, Florida; thence Westerly and Northerly along the South and West boundaries of said parcel described in Official Records Book 9200, Page 274, and continuing along the West boundary of that parcel described in Official Records Book 5292, Page 593, of the public records of Pasco County, Florida, to the South right of‐way of the aforementioned State Road 54; thence Easterly along said South right-of-way of State Road 54, to the Southerly prolongation of the West boundary of that parcel described in Official Records Book 8954, Page 2103, of the public records of Pasco County, Florida; thence Northerly along said Southerly prolongation and continuing along the West boundary of said parcel described in Official Records Book 8954, Page 2103, and continuing Easterly along the North boundary of said parcel described in Official Records Book 8954, Page 2103, to the West boundary of that parcel described in Official Records Book 3707, Page 359, of the public records of Pasco County,
Florida; thence Northerly and continuing clockwise around said parcel described in Official Records Book 3707, Page 359, to the Southwest corner of that parcel described in Official Records Book 7834, Page 1882, of the public records of Pasco County, Florida; thence Northeasterly along the South boundary of said parcel described in Official Records Book 7834, Page 1882, to the Southwest corner of that parcel described in Official Records Book 3871, Page 608, of the public records of Pasco County, Florida; thence Northerly and Easterly along the West and North boundaries of said parcel described in Official Records Book 3871, Page 608, to the Southwest corner of that parcel described in Official Records Book 3342, Page 49, of the public records of Pasco County, Florida; thence Northerly and Easterly along the West and North boundaries of said parcel described in Official Records Book 3342, Page 49, and continuing along the Easterly prolongation thereof, of said parcel, to the east right-of-way of 1st Street; thence Northerly along said East right-of-way of 1st Street, to an intersection with the North right-of-way of 14th Avenue; thence Westerly along the North right-of-way of said 14th Avenue, to the Southwest corner of that parcel described in Official Records Book 3626, Page 537, of the public records of Pasco County, Florida; thence Northerly along the West boundary of said parcel described in Official Records Book 3626, Page 537, continuing along the East boundary of FOREST HEIGHTS, as per the plat thereof recorded in Plat Book 8, Page 10, of the public records of Pasco County, Florida, and the Northerly prolongation thereof, to the North right-of-way of Geiger Road; thence Westerly along the North right-of-way of said Geiger Road, to the East boundary of PARKVIEW ACRES, as per the plat thereof recorded in Plat Book 8, Page 52, of the public records of Pasco County, Florida; thence Northerly along the East boundary of said PARKVIEW ACRES and continuing along the East boundary of PARKVIEW ACRES 1st ADDITION, as per the plat thereof recorded in Plat Book 8, Page 80, of the public records of Pasco County, Florida, to the South boundary of PARKVIEW ACRES 2nd ADDITION, as per the plat thereof, recorded in Plat Book 8, Page 116, of the public records of Pasco County, Florida; thence Easterly along the South boundary of said PARKVIEW ACRES 2nd ADDITION and continuing along the Easterly prolongation thereof, to the East right-of-way of the aforementioned Gall Boulevard; thence along the East right-of-way of said Gall Boulevard, to the South right-of-way of County Road 54; thence Easterly along the South right-of-way of said County Road 54, to the Northeast corner of that parcel described in Official Records Book 8668, Page 2843, of the public records of Pasco County, Florida; thence Southerly along the East boundary of said parcel described in Official Records Book 8668, Page 2843 and continuing along the Southerly prolongation thereof, to the South right-of-way of Henry Drive; thence Easterly along the South right-of-way of said Henry Drive, to the West right-of-way of 8th Street; thence Southerly along the West right-of-way of said 8th Street and continuing along the Southerly prolongation thereof, to the South right-of-way of North Avenue; thence Easterly along the South right-of-way of said North Avenue, to the West right-of-way of 16th Street; thence Southerly along the West right-of-way of said 16th Street, to an intersection with the South right-of-way of 6th Avenue; thence Easterly along the South right-of-way of said 6th Avenue, to the West right-of-way of the aforementioned 17th Street; thence Southerly along the West right-of-way of said 17th Street to the POINT OF BEGINNING.
CRA Fund, Power and Procedures
Trust Fund
In accordance with Section 163.387, Florida Statutes, a Redevelopment Trust Fund may be established following the approval of a Master Plan. This fund is created by ordinance and is essential for the CRA to receive and spend Tax Increment Financing (TIF) revenues. These funds are used exclusively to finance or refinance redevelopment activities outlined in the approved CRA Plan.
The annual contribution to the Trust Fund is based on the incremental increase in ad valorem tax revenues generated within the CRA. Specifically, this increment is calculated as 95% of the difference between:
• The ad valorem taxes levied each year by the City and County (excluding debt service millage) on taxable real property within the CRA; and
• The taxes that would have been generated using the same millage rate on the base-year assessed value of that property, prior to the creation of the Trust Fund.
The governing body may choose to contribute less than 95%, but not less than 50% of this increment, as specified in the ordinance establishing the Trust Fund.
This mechanism ensures a dedicated funding stream for redevelopment efforts, supporting long-term investment in infrastructure, housing, public spaces, and economic development within the CRA.
Redevelopment Powers
The Zephyrhills Community Redevelopment Agency (Agency) was established by City Council Resolution Documentary #435 on March 9, 1998, in accordance with Section 163.356, Florida Statutes. This resolution granted the CRA the authority to exercise all powers outlined in Chapter 163, Part III, necessary to implement and advance the goals of the Zephyrhills CRA Master Plan.
In October 2015, City Council Resolution #710-16 expanded the boundaries of the CRA and extended its operational timeline, setting a new sunset date of 2045. This expansion allowed the CRA to broaden its impact and continue its mission of revitalization and community enhancement..
Relocation Procedures
The City of Zephyrhills maintains relocation policies that ensure equitable compensation for property owners and tenants in the event of displacement due to property acquisition by the CRA. As a general policy, the CRA seeks to avoid displacement of households and businesses. This Plan update emphasizes the reuse of existing structures, neighborhood revitalization, and opportunities for current residents to remain and invest in their communities.
While permanent residential use exists within the CRA, displacement is not anticipated. However, if relocation becomes necessary due to redevelopment activities, the City, County, and CRA will provide assistance to minimize hardship. This may be required to address blighting conditions or legal and physical barriers to revitalization.
Relocation efforts will comply with Section 421.55, Florida Statutes, regarding the relocation of displaced persons. The CRA will assist affected individuals in identifying suitable replacement housing and sites. When federal funding is involved, the CRA will follow the relocation policies and procedures established by the U.S. Department of Housing and Urban Development (HUD). The CRA will not be responsible for relocations resulting from County, State, or Federal programs outside its jurisdiction
Duration, Modification, and Restrictions
Plan Duration
The projects, initiatives, and programs outlined in the CRA Plan are funded through Tax Increment Financing (TIF) and must be implemented within 30 years of the CRA’s expansion in Fiscal Year 2015. This establishes a definitive timeframe for completing all redevelopment activities financed by TIF revenues. While the CRA was originally created in 1998, the 2015 expansion marks the start of the current 30-year planning and implementation window, concluding in 2045.
Plan Modification
The Zephyrhills CRA Master Plan may be modified in accordance with Section 163.361, Florida Statutes, which governs amendments to master plans. If the CRA determines that a modification is necessary, it will submit a recommendation to the City Council. Amendments may include changes to the CRA’s boundaries—either adding or removing land—or the incorporation of new initiatives, such as community policing strategies.
Since its creation in 1998, the CRA Plan has been updated in 2012, 2016, and most recently in 2026. These updates reflect the CRA’s ongoing commitment to adapt to evolving community needs, development opportunities, and strategic priorities.
Plan Severability
If any provision of the Zephyrhills CRA Master Plan is held to be unconstitutional or otherwise legally infirm, such provisions shall not affect the remaining portions of the Zephyrhills CRA Master Plan
Safeguards, Controls, Restrictions, and Covenants
All redevelopment activities undertaken in the Zephyrhills CRA must be consistent with the Zephyrhills CRA Master Plan, the City’s Comprehensive Plan, and applicable land development regulations; all master plans will undergo review by the City. Issues concerning restrictions on any property acquired for redevelopment purposes and then returned to use by the private sector will be addressed on a case-by-case basis to ensure that all activities necessary to perpetuate the redevelopment initiative are advanced in a manner consistent with this Plan and any amendment thereto. Such restrictions or controls would be expected to be in the form of covenants running with any land sold or leased for private use.
The Zephyrhills Community CRA Master Plan update aligns with the City’s Comprehensive Plan. This section highlights the compatibility, shared goals, and unified vision of both plans, organized according to the elements of the Comprehensive Plan.
REFERENCE
Section 421.55, FloridaStatutes –Relocation of displaced persons.
(1) It is the intent of the Legislature to authorize the state and its departments, agencies, political subdivisions, and legislatively established port and airport authorities to comply with the provisions and requirements of the Surface Transportation and Uniform Relocation Assistance Act of 1987, Pub. L. No. 100-17, in those public projects or programs for which federal or federal-aid funds are available and are used.
(2) As used in this section:
(a) “State” means the State of Florida, any department, agency or political subdivision thereof, or any port or airport authority established by the Legislature.
(b) “Public Law No. 100-17” means the Surface Transportation and Uniform Relocation Assistance Act of 1987 adopted by the United States Congress.
(c) “Displaced person” means any individual, partnership, corporation, or association that is required to move from any real property on or after March 20, 1972, as a result of the acquisition of such real property for public purposes, or who, as the result of the acquisition for public purposes of real property on which such person is conducting a business or farm operation as defined in Pub. L. No. 100-17, is required to move said business or farm operation.
(3) The state is authorized and empowered, in acquiring real property for use in any public project or program in which federal or federal-aid funds are used, to make all such relocation and other payments to or for displaced persons as are required under the provisions of Pub. L. No. 100-17, and to provide such displaced persons with relocation services and make available to them replacement dwellings, as required by Pub. L. No. 100-17.
(4) The state is authorized and empowered, in acquiring real property for use in any public project or program in which federal or federal-aid funds are used, to follow and conform with the land acquisition policies set forth in Pub. L. No. 100-17, and to pay or reimburse owners of property so acquired in the manner specified in Pub. L. No. 100-17. This authority shall include, as to federal-aid highways and airports, as a last resort, the use of eminent domain powers to acquire real property for replacement housing as required by Pub. L. No. 100-17.
Comp Plan Consistency
Capital Improvements
Both plans aim to:
• Ensure strategic investment in infrastructure to support revitalization.
• Maintain and enhance public facilities and services in the CRA.
• Promote fiscally responsible growth and redevelopment.
• Align capital planning with community needs and long-term vision.
Conservation
Both plans aim to:
• Promote sustainable development and environmental stewardship.
• Protect natural resources and wildlife habitats.
• Enhance quality of life through green infrastructure and open space.
• Ensure that redevelopment is resilient, equitable, and ecologically responsible.
Economic Development
Both plans aim to :
• Diversify the local economy and tax base.
• Revitalize Downtown Zephyrhills and the surrounding Community Redevelopment Area (CRA).
• Attract and retain businesses that support long-term economic sustainability
• Leverage public-private partnerships and infrastructure investments to stimulate growth.
Future Land use
Both Plans aim to:
• Promote mixed-use, walkable neighborhoods.
• Encourage infill and redevelopment over sprawl.
• Enhance economic vitality while preserving. community character.
• Improve infrastructure and connectivity.
Housing
Both Plans aim to:
• Ensure a diverse, affordable, and sustainable housing stock
• Promote neighborhood revitalization and infill development
• Support inclusive, mixed-income communities
• Encourage redevelopment of aging or substandard housing
Intergovernmental Coordination
Both plans aim to:
• Collaborative governance to support revitalization and growth.
• Efficient service delivery through partnerships.
• Coordinated infrastructure and land use planning.
• Alignment of local, regional, and state efforts to achieve community goals.
Mobility
Both Plans aim to:
• Create a safe, multimodal, and equitable transportation system.
• Support revitalization of Downtown Zephyrhills and Gall Boulevard.
• Promote walkable, connected, and vibrant neighborhoods.
• Integrate land use and transportation to support infill, redevelopment, and economic vitality.
Public Facilities
Both plans aim to:
• Ensure reliable, high-quality infrastructure to support redevelopment.
• Promote compact, infill development and discourage sprawl.
• Protect environmental resources and enhance community resilience.
• Coordinate infrastructure investments with revitalization priorities.
Recreation and Open Space
Both plans aim to:
• Enhance quality of life through accessible, inclusive, and well-maintained public spaces
• Support revitalization of Downtown Zephyrhills and surrounding neighborhoods.
• Promote walkability, connectivity, and active lifestyles.
• Leverage parks and open space as tools for placemaking, economic development, and community health.
Community Impact Statement
This section of the Master Plan update addresses the requirements of Chapter 163 Part III of the Florida Statutes, Sections 163.360 and 163.362.
The implementation of the Master Plan update will foster positive impacts to the quality of life in the CRA and surrounding communities. Neighborhoods will benefit from the redevelopment programming, through the development of new and the improvement of existing housing, improvements to public infrastructure addressing localized flooding issues and connectivity to sanitary sewer services, pedestrian safety and multi-modal transportation, and other improvements to the public realm. These activities are to address conditions of slum and blight that were found present in the community.
Successfully addressing the conditions of blight will improve the quality of life for residents, businesses and visitors. The planned redevelopment activities and public realm improvements will also improve the economic environment for business owners, employers and workers within the Zephryhills CRA.
While all impacts cannot be determined without sitespecific proposals from which to evaluate potential impacts, the following section presents the range of potential impacts that may be anticipated to occur in the categories required by Chapter 163 Part III of the Florida Statutes, Sections 163.360 and 163.362.
Residential Development
This statement outlines the anticipated impacts of residential development initiatives within the Zephyrhills CRA. These efforts aim to preserve neighborhood character, expand housing opportunities, and promote equitable, sustainable growth across the district’s seven historic neighborhoods.
Neighborhood Preservation and Identity
Residential development will reinforce the unique identity of each neighborhood—such as Historic Jeffries, Oakside, and Zephyr Lake—by:
• Preserving architectural styles like Florida Cracker, Craftsman, and Mid-Century Modern.
• Supporting context-sensitive infill that complements existing homes.
• Enhancing community pride through neighborhood signage and branding.
Housing Diversity
The CRA promotes a wide range of housing types to meet evolving community needs:
• Accessory dwelling units (ADUs) and missing middle housing.
• Affordable options for seniors, young professionals, and workforce residents.
Infill Development and Adaptive Reuse
To revitalize underutilized land and buildings, the CRA will:
• Develop Agency-owned parcels into high-quality, mixed-income housing.
• Facilitate land acquisition for infill housing through public-private partnerships.
• Promote adaptive reuse of nonresidential structures like churches and hotels.
Economic and Social Impact
Residential development will:
• Stimulate local investment and job creation.
• Increase homeownership through grants and incentives.
• Support essential workers and first-time buyers with targeted programs.
Infrastructure and Sustainability
New housing will be designed with:
• Sustainable and resilient building practices.
• Alley-accessed layouts to preserve streetscapes and walkability.
• Integration with green infrastructure and stormwater management.
Implementation and Community Engagement
The CRA will:
• Maintain a public inventory of infill and historic housing sites.
• Offer pre-approved building plans to streamline development.
• Engage residents in planning and design processes.
Affordable Housing
The CRA Plan identifies the anticipated impacts of affordable housing initiatives within the Zephyrhills CRA. These efforts are designed to address housing affordability, promote inclusive growth, and preserve the unique character of the community’s historic neighborhoods.
Expanding Affordable Housing Options
The CRA is committed to increasing the availability of affordable housing through:
• Infill development on underutilized parcels.
• Adaptive reuse of nonresidential structures (e.g., churches, hotels).
• Development of Agency-owned properties into context-sensitive, affordable homes.
• Promotion of accessory dwelling units (ADUs) and missing middle housing types.
Preserving Neighborhood Character
Affordable housing initiatives are designed to:
• Maintain walkability and streetscape aesthetics.
• Support context-sensitive design that blends with historic homes and community identity.
Economic and Social Equity
The CRA’s affordable housing efforts promote:
• Homeownership opportunities through grants and incentives.
• Workforce housing programs for teachers, healthcare workers, and first responders.
• Employer-assisted housing partnerships.
• Financial literacy and homeownership education.
Community Engagement and Transparency
The CRA will:
• Maintain a publicly accessible inventory of infill and historic housing sites.
• Engage residents in planning and design processes.
• Use pre-approved building plans to streamline development and reduce costs.
Long-Term Impact
By promoting affordable housing, the CRA will:
• Reduce displacement and support aging in place.
• Increase housing supply without compromising neighborhood character.
• Foster inclusive, walkable, and economically vibrant communities.
Environmental Quality
This statement evaluates the environmental impacts of proposed infrastructure and redevelopment projects within the Zephyrhills CRA, with a focus on enhancing environmental quality while supporting sustainable urban growth.
Drainage and Stormwater Management
Impact: Aging infrastructure and flat terrain have led to frequent flooding and inadequate stormwater retention.
Mitigation and Improvements:
• Upgrading drainage systems with larger culverts, curbs, and gutters.
• Expanding retention capacity beyond Lake Necessity, including Zephyr Creek.
• Implementing green infrastructure (e.g., bioswales, rain gardens) to naturally absorb runoff.
• Regular maintenance of storm drains and ditches to prevent blockages.
Expected Outcome: Reduced flooding, improved stormwater flow, and enhanced resilience to extreme weather events.
Vegetation and Urban Greening
Impact: Limited street trees and green buffers in key corridors reduce shade, biodiversity, and aesthetic value.
Mitigation and Improvements:
• Streetscape enhancements with native landscaping and tree planting.
• Green buffers and bioswales integrated into road and alley redesigns.
• Vegetative features in public spaces like Lake Necessity and the greenway loop.
Expected Outcome : Improved urban canopy, reduced heat island effect, enhanced biodiversity, and more attractive public spaces.
Noise Pollution
Impact: Traffic-heavy corridors like Gall Boulevard and underutilized alleys contribute to elevated noise levels.
• Promotion of non-motorized transport (biking, walking) to reduce vehicular noise.
Expected Outcome: Quieter, more livable neighborhoods with reduced traffic-related noise pollution.
Water Quality
Impact: Stormwater runoff can carry pollutants into local water bodies, affecting aquatic ecosystems.
Mitigation and Improvements:
• Green infrastructure to filter runoff before it reaches water bodies.
• Expansion of stormwater retention areas to reduce overflow.
• Public education on responsible landscaping and runoff reduction.
Expected Outcome: Cleaner waterways, improved aquatic habitats, and compliance with environmental regulations.
Air Quality
Impact: Vehicle emissions and limited green space contribute to localized air pollution.
Mitigation and Improvements:
• Promotion of active transportation through bike lanes and pedestrian networks.
• Increased vegetation and tree cover to absorb pollutants.
• Reduced vehicle idling through improved traffic flow and intersection redesigns.
Expected Outcome : Improved air quality, healthier public spaces, and reduced greenhouse gas emissions.
Transportation
This statement outlines the anticipated impacts of transportation-related initiatives within the Zephyrhills
CRA. These efforts aim to improve mobility, enhance safety, health benefits, support economic development, and create a more connected, accessible, and resilient community.
Multimodal Connectivity and Mobility
The CRA is committed to building a comprehensive, multimodal transportation network that supports walking, biking, transit, and vehicle use. Key initiatives include:
• A Greenway Loop and extended bicycle network connecting schools, parks, and downtown.
• Complete Streets redesigns for Gall Boulevard, 6th Street, and 7th Street.
• Sidewalk improvements guided by the 2020 Sidewalk Master Plan.
• Alleyway upgrades to support rear access, infill development, and pedestrian circulation.
Impact: These projects will reduce car dependency, promote active transportation, and improve safety and accessibility for all users.
Corridor Revitalization and Economic Development
Gall Boulevard and 5th Avenue will be transformed into vibrant, mixed-use corridors through:
• Enhanced streetscapes with bike lanes, sidewalks, and street trees.
• Improved intersections and traffic-calming measures.
• Integration of public art, signage, and branding to reinforce identity.
Impact: These improvements will attract investment, increase foot traffic, and support local businesses, while creating more livable and walkable environments.
Gateway Enhancements and Wayfinding
Five gateway places and features will be developed to mark key entry points into the CRA:
• Monument signs, landscaping, and public art.
• Improved crosswalks and lighting.
• Integration with the Greenway Loop and corridor improvements.
Impact: Gateways will enhance the city’s visibility, foster a sense of arrival, and strengthen community identity.
Infrastructure Resilience and Sustainability
Transportation improvements will be paired with stormwater and green infrastructure strategies, including:
• Permeable pavements, bioswales, and rain gardens
• Expanded stormwater retention capacity
• Sustainable design principles in all street and alley upgrades
Impact: These measures will reduce flooding, improve water quality, and support long-term environmental resilience.
Implementation and Partnerships
The CRA will:
• Collaborate with the City of Zephyrhills, Pasco MPO, and FDOT
• Pursue funding through mobility and stormwater impact fees, grants, and public-private partnerships
• Offer incentives for private developments that include public infrastructure improvements
Impact: These strategies will ensure coordinated, well-funded, and community-aligned transportation improvements.
Police and Fire
This CRA Master Plan update supports the implementation of Community Oriented Policing (COPs) programs and the application of Crime Prevention Through Environmental Design (CPTED) principles in neighborhood planning and private development review. The City of Zephyrhills prioritizes public health and safety through proactive code enforcement, ensuring compliance with building and safety standards. Ongoing enforcement is essential to maintaining neighborhood stability, protecting property values, and fostering safe living and working environments.
The Plan also advocates for enhanced sidewalk, lighting, alleys, in the CRA to address concerns about crimes of opportunity. Additionally, reducing the number of unsafe, deteriorating, or vacant structures helps lower fire risk, thereby supporting the CRA’s capacity to deliver effective Fire & Rescue services.
School Population
Potential housing development and population growth within the CRA are not anticipated to significantly increase the amount of school age children. The population growth of the area has been relatively flat. While significant increases in the population of school age children are not anticipated within the CRA, population trends will be monitored for potential changes in this trend.
Employment
The long-term implementation of this Master Plan update is anticipated to increase employment activities within the CRA and increase employment opportunities for its residents.
The CRA is a regional employment hub, particularly in health care, education, food services, and retail, which together account for over 63% of local jobs (2023). The CRA’s employment base is service-oriented, with strong representation in essential and community-serving sectors.
Small business development is a key factor to providing a stronger, more diverse employment base that is more resistant to fluctuating economic cycles and decisions regarding capital mobility. This CRA Master Plan update supports the establishment and revitalization of neighborhood commercial, retail, and office uses in appropriate locations throughout the CRA.
Master Plan Requirements
In a very simply described and summarized process for adopting and amending a master plan, it is necessary that a local government and its Agency evaluate the physical, social and economic attributes of a specific area and make a determination that it satisfies multiple criteria. This determination would allow the local government to adopt and implement a redevelopment strategy and utilize all the powers available to its Agency.
Toward assuring compliance with the larger mission and responsibilities of the Agency and an implementable master plan, the Redevelopment Act outlines both the contents of the legally sufficient master plan and the general framework for its adoption. The particulars of this 2026 Zephyrhills CRA Master Plan update and the means by which it will be adopted, like its predecessor, adhere to the current legal requirements.
The Redevelopment Act, according to Chapter 163.360, Florida Statues, prescribes that each adopted plan:
• Conform to the comprehensive plan for the county or municipality as prepared by the local planning agency under the Community Planning Act.
• Be sufficiently complete to indicate such land acquisition, demolition and removal of structures, redevelopment, improvements, and rehabilitation as may be proposed to be carried out in the CRA; zoning and planning changes, if any; land uses; maximum densities; and building requirements.
• Provide for the development of affordable housing in the area or state the reasons for not addressing in the plan the development of affordable housing in the area. The county, municipality, or Community Redevelopment Agency shall coordinate with each housing authority or other affordable housing entities functioning within the geographic boundaries of the CRA concerning the development of affordable housing in the area.
The Redevelopment Act, according to Chapter 163.362, Florida Statues, prescribes that each Master Plan shall:
• Contain a legal description of the boundaries of the CRA and the reasons for establishing such boundaries shown in the plan.
• Show by diagram and in general terms:
+ The approximate amount of open space to be provided and the street layout.
+ Limitations on the type, size, height, number, and proposed use of buildings.
+ The approximate number of dwelling units.
+ Such property as is intended for use as public parks, recreation areas, streets, public utilities, and public improvements of any nature.
• If the CRA contains low or moderate income housing, contain a neighborhood impact element which describes in detail the impact of the redevelopment upon the residents of the CRA and surrounding areas in terms of relocation, traffic circulation, environmental quality, availability of community facilities and services, effect on school population, and other matters affecting the physical and social quality of the neighborhood.
• Identify specifically any publicly funded capital projects to be undertaken within the CRA.
• Contain adequate safeguards that the work of redevelopment will be carried out pursuant to the plan.
• Provide for the retention of controls and the establishment of any restrictions or covenants running with land sold or leased for private use for such periods of time and under such conditions as the governing body deems necessary to effectuate the purposes of this part.
• Provide assurances that there will be replacement housing for the relocation of persons temporarily or permanently displaced from housing facilities within the CRA.
• Provide an element of residential use in the CRA if such use exists in the area prior to the adoption of the plan or if the plan is intended to remedy a shortage of housing affordable to residents of low or moderate income, including the elderly, or if the plan is not intended to remedy such shortage, the reasons therefore.
• Contain a detailed statement of the projected costs of the redevelopment, including the amount to be expended on publicly funded capital projects in the CRA and any indebtedness of the Agency, the county, or the municipality proposed to be incurred for such redevelopment if such indebtedness is to be repaid with increment revenues.
• Provide a time certain for completing all redevelopment financed by increment revenues. Such time certain shall occur no later than 30 years after the fiscal year in which the plan is approved, adopted, or amended pursuant to s. 163.361(1). However, for any agency created after July 1, 2002, the time certain for completing all redevelopment financed by increment revenues must occur within 40 years after the fiscal year in which the plan is approved or adopted.
This 2026 Zephyrhills CRA Master Plan update has been prepared in compliance with Chapter 163, Florida Statutes.
To fulfill its many responsibilities, the Agency has many powers. These enumerated powers acknowledge the status of the Agency as a functioning governmental entity, but one that stands apart in its supportive mission of the CRA. These powers tend to reaffirm the Agency’s specific duties in the pursuit of development and redevelopment while separating its financial obligations from those of the associated general government.
These enumerated powers for the Agency as outlined in Chapter 163.0370 include, but are not limited to:
• To make and execute contracts and other instruments necessary or convenient to the exercise of its powers under this part.
• To disseminate slum clearance and community redevelopment information.
• To undertake and carry out community redevelopment and related activities within the CRA.
• To provide, or to arrange or contract for, the furnishing or repair by any person or agency, public or private, of services, privileges, works, streets, roads, public utilities, or other facilities for or in connection with a community
redevelopment; to install, construct, and reconstruct streets, utilities, parks, playgrounds, and other public improvements; and to agree to any conditions that it deems reasonable and appropriate which are attached to federal financial assistance and imposed pursuant to federal law relating to the determination of prevailing salaries or wages or compliance with labor standards, in the undertaking or carrying out of a community redevelopment and related activities, and to include in any contract let in connection with such redevelopment and related activities or provisions to fulfill such of the conditions as it deems reasonable and appropriate.
Although any associated general-purpose governments and any of its property owners or citizens as tax payers are intended to benefit from the activities of the Agency or the CRA, they are insulated from its financial obligations. Further, certain operating and capital expenses of an associated general government, are not to be absorbed through funds flowing into the Zephyrhills CRA Redevelopment Trust Fund. Despite that insularity, the CRA exports many financial and community benefits well beyond its legally defined boundaries.
4.4 CRA New Permits and Code Violations
The City of Zephyrhills code enforcement’s number one objective is the health and safety of all residents, workers, and visitors. Therefore, they ensure all the properties are in code compliance.
Understanding the patterns of permits and code violations provides key insights into the community’s growth and regulatory challenges. This information looks into the trends in new permits and code violations of the CRA, spanning the years 2020 to 2023. The CRA, contributing 5% to the City’s overall new permits, demonstrates a distinct focus on townhome developments, concentrating efforts on specific infill residential sites. Furthermore, the data sheds light on commercial and residential code violations within the same timeframe, unraveling the challenges businesses and residents face. The commercial sector grapples with 251 code violations, encompassing issues ranging from non-compliance to signage discrepancies. On the residential front, 345 code violations underscore concerns related to non-compliance properties, minimum building standards, and permit/business task receipts.
As we navigate the information presented in the following pages, it becomes evident that the intricacies of development and code adherence are multifaceted and an outcome of the existing future land use, zoning, and design standards regulations.
New Permits
In the CRA, the majority of permits issued were for townhomes (62), followed by single-family homes (10), commercial developments (5), and duplexes (4), totaling 81 permits.
Commercial Code Violations
There were a total of 251 commercial code violations, with an average of 7 complaints per month, accounting for instances of repeat offenses
Residential Code Violations
There were a total of 345 residential code violations, with an average of 9.5 complaints per month, accounting for instances of repeat offenses. The top four commercial code violations are:
New Permits (2020–2023)
Between 2020 and 2023, the most prevalent permits issued in the CRA were for Townhomes (62), followed by Single-Family Homes (10), Commercial developments (5), and Duplexes (4), totaling 81 permits. This averages out to 2.5 permits per month, in stark contrast to the 1,666 permits issued city-wide. Notably, the CRA is responsible for 5% of the City’s overall new permits.
The townhome permits are concentrated on two recently developed infill residential sites, one situated south of Hercules Park and the other along 7th Street. Duplex permits are exclusively found in the Moores Estates neighborhoods, while single-family permits are dispersed across the Hercules, Historic Abbott, and Oakside Neighborhoods.
F IG u RE 35. CRA NEW PERMITS (2020–2023)
TABLE 10. CRA NEW PERMITS TABLE (2020 - 2023)
+ Single-Family Residential (10 permits)
+ Townhomes (62 permits)
+ Duplex | 2 Units (4 permits)
+ Commercial (5 permits)
+ City Hall Complex + RB Stewart Middle School 1 2
ZEPHYR CREEK
Commercial Code Violations (2020-2023)
From 2020 to 2023, there were a total of 251 commercial code violations, with an average of 7 complaints per month, accounting for instances of repeat offenses. The top four commercial code violations are:
• Non-compliance property: 115 violations
• Signs: 47 violations
• Permit/Business Task Receipts: 33 violations
• Minimum building standards: 12 violations
Refer to the comprehensive table below for details.
Instances of non-compliance in commercial buildings and structures involve properties that are in a state of disrepair and do not adhere to building codes. Common issues include the presence of trash, junk, debris on the premises, nuisance vehicles, unpaid property liens, among others. Sign violations encompass various issues such as inflatable signs, feather flags, vinyl signs located in the right-ofway, placement on balconies, poles, or fences, mobile advertising parked on the right-of-way, non-permitted signs, and any other violations outlined in the LDC Sign Ordinance Section 8.05.00.
*54 repeat offenders for a total of 140 claims + Non-Compliant Property
+ Signs
+ Permits/Business Tax Receipt
+ Minimum Building Standards
+ Other (Miscellaneous, Nuisance Vehicles, Parking, Accesory Building Structures, Fire, Abandoned Property, Alcoholic Beverages and Fences)
+ City Hall Complex
+ RB Stewart Middle School 1 2
Residential Code Violations (2020-2023)
From 2020 to 2023, there were a total of 345 residential code violations, with an average of 9.5 complaints per month, accounting for instances of repeat offenses. The top four commercial code violations are:
• Non-compliance property: 247 violations (averaging 7 complaints per month)
• Minimum Building Standards: 20 Violations
• Permit/Business Task Receipts: 17 violations
• Nuisance Vehicles: 12 violations
Instances of non-compliance in commercial buildings and structures involve properties in a state of disrepair and do not adhere to building codes. Common issues include the presence of trash, junk, debris on the premises, nuisance vehicles, and overgrown grass.
Refer to the comprehensive table below for details.
F IG u RE 37. CRA RESIDENTIAL CODE VIOLATIONS MAP (2020-2023)
+ Other (Accessory Building Structures, Fences, Miscellaneous, Abandoned Property, Parking and Fire)
+ City Hall Complex
+ RB Stewart Middle School 1 2
4.5 CRA Parcel Characteristics
This section provides a series of parcel analyses with the goal of helping identify future redevelopment and catalyst sites. The parcel characteristic analysis includes parcel size, vacancy, ownership, year built and structure size, and Assessed property value. Below is a summary of the key findings, which are explained in detail in the following maps and tables.
Parcel Size
• The CRA boasts 1,713 parcels, excluding recreational, civic, and institutional parcels.
• Notably, 73% of these parcels, totaling 1,252, occupy less than a quarter of an acre, while 21% range from a quarter to half an acre.
• Parcels exceeding 1.1 acres, strategically located along Gall Boulevard and 5th Avenue, present opportunities for transformative infill redevelopment projects. These key locations serve as potential catalyst sites for sparking community growth.
Vacant Parcels
• A total of 104 vacant parcels, covering 36.2 acres, await development, constituting a mere 6% of the total land.
• Residential and commercial plots lead in vacant parcels, with strategic locations along Gall Boulevard and 5th Avenue emerging as prime candidates for infill redevelopment and catalyst projects.
Parcel Ownership
• The primary recurring parcel owners, featuring entities like Pinecrest Mobile Home Park, the Diocese of St. Petersburg, and the PF Alliance Borrower.
• Distinct clusters owned by the PF Alliance Borrower hold the potential to evolve into catalytic residential projects.
Year Built (Structures)
• Structures within the CRA, predominantly residential, reflect a historical pattern, with 50% built before 1960 and an additional 47% constructed between 1961 and 2000.
• Recent years show a modest 7% construction rate, primarily residential, emphasizing a consistent trend.
Assessed / Taxable Value:
• Assessing the monetary value for taxation purposes reveals that 60% of parcels have values up to $100,000, totaling $43,045,544.
• Parcels with an assessed value of $300,000 constitute 28%, and 9% of parcels are designated as non-taxable, including civic and religious uses.
Existing Residential Parcels
• A detailed analysis using DOR Codes unveils that 53% of existing residential parcels are single-family units, with 3% having two units.
• Six parcels (6) with more than nine units present an intriguing opportunity, possibly including new singlefamily attached units.
Detached Single-Family Attached/Detached Assessed Value
• Assessments for existing single-family parcels indicate that 57% have values up to $100,000, followed by 36% with values of $200,000, and 6% with values exceeding $200,000.
Parcel Size
The CRA possesses 1,713 parcels, (this number doesn’t include recreational, civic and institutional parcels with 73% totaling 1,252, occupying less than a quarter of an acre (0.25 ac). Following closely are parcels ranging from a quarter to half an acre (0.26 to 0.50 Ac) at 21%. Most of these parcels are spread around all neighborhoods.
On the other hand, most parcels measuring 1.1 acres and above are located along Gall Boulevard, the main commercial corridor – with a couple of cluster areas on
F IG u RE 38. PARCEL SIZE MAP (2023)
5th Avenue – one on the western end and the other on the eastern end. This group of parcels presents infill redevelopment opportunities for new mixed-use and commercial projects. The strategic locations along major avenues make them prime candidates for sparking vibrant community growth and commercial redevelopment and have the potential to become new catalyst sites.
TABLE 13. PARCEL SIZE DATA (2023)
+ 0.25 acres or less
+ 0.26 to 0.50 acres
+ 0.51 to 1.00 acres
+ 1.1 acres to 4.00 acres
+ More than 4 acres
ZEPHYR CREEK
PLAZA DISTRICT
Vacant Parcels
Across the CRA, a total of 104 vacant parcels, encompassing a combined land area of 36.2 acres, await potential development. Remarkably, these vacant spaces constitute a mere 6% of the entire land within the area. Residential and commercial plots lead the charge in the vacant parcel category, with 52 residential parcels accounting for 10.6 acres and 49 commercial parcels stretching over 24.1 acres.
IG u RE 39. CRA VACANT PARCEL MAP (2023)
Most residential vacant parcels are sprinkled throughout the Oakside, Hercules, Historic Jeffries, and Historic Abbot Neighborhoods. Meanwhile, the vacant commercial parcels strategically line Gall Boulevard and form a cluster on 5th Avenue, west of Gall Boulevard. Like our previous analysis on parcel sizes, these vacant parcels emerge as prime candidates for infill redevelopment. Their strategic locations along major corridors, especially Gall Boulevard and 5th Avenue position them perfectly to become catalyst projects that could significantly boost development in the area.
TABLE 14. PARCEL SIZE DATA (2023)
F
Parcel Ownership (Top Ownership)
The map below illustrates the six primary recurring parcel owners within the CRA. Notably, the entirety of Pinecrest Mobile Home Park is under the ownership of a single entity. Parcels along the eastern segment of 5th Avenue are owned by the Diocese of St. Petersburg. The PF Alliance Borrower, encompassing up to 6.7 acres of land spread throughout the CRA, exhibits three distinct clusters, notably surrounding the Middle School and in regions within the Zephyr Lake and Historic Abott Neighborhoods. Those clusters can become catalysis residential projects.
The map below provides an overview of building structures constructed up to the year 2022, with a specific focus on those built in 1960 and earlier. Notably, half of the structures within the CRA, totaling 50%, were erected in 1960 or earlier, while an additional 47% were built between 1961 and 2000. Residential use predominates among these structures, comprising 70%, while the remaining 30% are designated for commercial purposes.
In contrast, over the last 22 years, a mere 7% of the total parcels witnessed the construction of new structures, averaging approximately four structures annually. Consistent with previous years, the majority of these new structures were intended for residential use.
F IG u RE 41. CRA YEAR B u ILT MAP (2023)
TABLE 15. CRA YEAR B u ILT TABLE (2023)
ZEPHYR CREEK
Assessed / Taxable Value
The assessed value is an estimate of the monetary value assigned to a property for taxation purposes. The assessed value is not always equal to the property’s market value, which is the price a willing buyer and seller would agree upon in an open and competitive market. Instead, the assessed value is a tool for calculating property taxes, and it is often a percentage of the property’s market value.
In the CRA, 60% of the parcels have an assessed value of up to $100,000 with a total of $43,045,544, followed by parcels with an assessed value of $300,000 with 28%. There are up to 9% of the parcels in the CRA that are not Taxable, which includes some civic and religious uses.
F IG u RE 42. CRA ASSESSED VAL u E MAP (2023)
TABLE 16. CRA ASSESSED VAL u E TABLE (2023)
$43,045,544
$73,699,983
$18,082,119
$21,343,921
156,171,567
ZEPHYR CREEK
Existing Residential Parcels
A residential parcel analysis using the parcels’ DOR Code was conducted to understand better the number of existing residential parcels and the number of units per parcel. The analysis below shows that 53% of the existing residential parcels, totaling 904, are single-family attached and detached homes with one residential unit, followed by 3% with two units. There are six (6) parcels with more than nine units (9+) in one parcel, but some of those parcels include new single-family attached units, probably totaling a count of 9+ units.
TABLE 17. CRA RESIDENTIAL u NITS TABLE (2023)
*746 parcels have no residential units present, regardless of zoning or FLU **145 parcels have no residential units present, but have a residential related DOR
F IG u RE 43. CRA RESIDENTIAL u NITS (2023)
ZEPHYR CREEK
Single-Family Attached/Detached Assessed Value
The assessed value estimates the monetary value assigned to a property for taxation purposes. The assessed value does not always equal the property’s market value, which is the price a willing buyer and seller would agree upon in an open and competitive market. Instead, the assessed value is a tool for calculating property taxes, and it is often a percentage of the property’s market value.
In the CRA, 7% of the existing single-family parcels have an assessed value of up to $100,00, followed by parcels with an assessed value of $200,000, with 36%, and 6% of the single-family homes with $200,000 or more.
u RE
$100,00 or less 411 57% $100,001 to $200,000 262 36% $200,001 or more 45 6%
TABLE 18. CRA SF ASSESSED VAL u E TABLE (2023)
+ City Hall Complex + RB Stewart Middle School 1 2
+ $100,000 or less + to $200,000 + $200,000 or more
F IG
44. CRA SF ASSESSED VAL u E MAP (2023)
ZEPHYR CREEK
ZEPHYR
HERCULES PARK
4.6 Market Analysis
In December, 2023 a market assessment was conducted as part of the CRA Master Plan update process. The assessment main focus was to identify the market for potential commercial and residential development opportunities within the CRA.
The analysis included: an assessment of demographic and socio-economic characteristics; an inventory analysis of the commercial and residential markets; a retail gap analysis; and a 20-year future growth projection of commercial and residential uses within the CRA.
Additionally, characteristics of Pasco County and the City of Zephyrhills were evaluated, where data was available, to provide a comparative context for potential market capture within the CRA.
4.6.1 Existing Conditions
There are many key demographic and socio-economic indicators to consider when determining the market characteristics of a specific area, these include:
• Population
• Age Distribution
• Race and Ethnicity
• Academic Achievement
• Income Levels
• Employment and Business Activity
A profile of these demographic and socio-economic characteristics was necessary to fully understand the unique marketplace and the overall market-supporting demand within the CRA.
Included in this analysis is the evaluation of current and historical growth trends within the CRA and where relevant, the assessme nt also identifies the capture of growth to Pasco County (“County”) and the City of Zephyrhills (“City”).
To note, there are limitations to data that is used to infer conclusions about a sample population. Most relevant to this is analysis is that the smallest geographic areas for which estimates are available are Census Block Groups. While the data can be used to infer conclusions about large geographic areas with great statistical certainty, the smaller the area of interest the greater the margin of error.
Demographic and Socio-Economic Characteristics
Total
Population
Based on the most recent 2023 estimates produced by the U.S. Census Bureau and the Bureau of Economic and Business Research (“BEBR”), the total population of the CRA is estimated to be approximately 3,322 persons, which represents roughly 0.5% of the County’s population of 610,743 persons, and 17.2% of the City’s population of 19,337 persons.
From 2010 to 2023, the population within the City grew at a compound annual growth ra te (“CAGR”) of 1.9% annually, increasing 31% from 14,809 persons in 2010 to 19,337 persons in 2023. About 53% of this population growth within the City occurred between 2010 and 2020. During this time frame, the County also experienced a CAGR of 2.0%. Comparatively, the CRA experienced a smaller CAGR, at 0.2%, fro m 2010 to 2023; with population increasing about 2.6%, from 3,238 persons in 2010 to 3,322 persons in 2023.
So URCE : U.S. CENSUS BUREAU; BEBR 2023 ESTIMATES; ESRI 2023 ESTIMATES; GAI C o NSULTANTS.
So URCE : U.S. CENSUS BUREAU; BEBR 2023 ESTIMATES; ESRI 2023 ESTIMATES; GAI C o NSULTANTS.
Overall, population has increased by nearly 4,528 persons within the City and only 84 persons within the CRA since 2010, with the capture of the CRA to City’s population steadily declining over this same time period.
The figures on the following page illustrate the change in total population within the County, City, and CRA, as well as the CRA’s capture to City population from 2010 to 2023 estimates.
Age Distribution
Age distribution is another important factor when examining market characteristics. Within the CRA, the median age is approximately 45 years old; this is notably lower than the median age of 56 years observed within the City and comparable to that of the County with a median age of 46. In the CRA, approximately 59% of the population are between the ages of 15 to 64, which is defined as the typical working-age population. This figure indicates that a slight majority of the population within the CRA is considered to be working-age . In comparison, about 51% and 61% represent the working-age population within the County and City, respectively.
Additionally, 22% of the population within the CRA are younger than 20, and 34% are 60 years or older. Whereas, the City has a slightly older population, with about 16% identified as younger than 20, and 44% aged 60 years or older. The table below illustrates the age distribution for the County, City, and CRA, as of 2023 estimates.
So URCE : U.S. CENSUS BUREAU; ESRI 2023 ESTIMATES; GAI C o NSULTANTS.
F IG u RE 45. POP u LATION CAPT u RE
TABLE 19. TOTAL POP u LATION
TABLE 20. AGE DISTRIB u TION
Race and Ethnicity
Understanding the racial and ethnic composition of an area can provide unique insight into its market characteristics. Within the CRA, approximately 74% of the population identifies as White, with 12% identifying as Two or More Races, 7% identifying as Black/African American, 2% as Asian, and 6% identifying as Other Race.
The racial composition within the City is relatively comparable; with 75% White, 11% Two or More Races, 7% Black/African American, 2% Asian, and 6% Other Race. The breakdown of the population by racial composition within the CRA compared to that of the County and City as of
TABLE 21. POP u LATION BY RACE
Academic Achievement
Academic achievement refers to the level of schooling a person has successfully completed, and only accounts for those 25 years or older. Within the CRA, 90% of the population have obtained their high school diploma/GED or a more advanced degree, which is similar to the 88% and 93% observed within the County and City, respectively, following these same metrics.
In addition, about 12% of the population within the CRA has a bachelor’s degree or more advanced degree, which is lower compared to the 29% and 17% of the population observed within the County and City, respectively, with a bachelor’s degree or greater. Comparatively, about 10% of the total population in the CRA do not have a high school diploma/GED, which is slightly lower than the 12% observed within the City, as illustrated in the figure below.
So URCE : U.S. CENSUS BUREAU; BEBR 2023 ESTIMATES; ESRI 2023 ESTIMATES; GAI C o NSULTANTS.
2023 estimates is represented in the table below.
Additionally, Hispanic origin is defined as an ethnicity, and therefore can be identified as any race. According to 2023 ESRI Estimates, 15% of the total population in the County, City, and the CRA are of Hispanic ethnicity.
So URCE : U.S. CENSUS BUREAU; BEBR 2023 ESTIMATES; ESRI 2023 ESTIMATES; GAI C o NSULTANTS.
F IG u RE 46. ACADEMIC ACHIEVEMENT
Income
Income is another important factor to consider when examining market characteristics, as it can be a broad indicator of a household or individual’s spending potential and their general ability to purchase a variety of goods and services within a specific marketplace. As of 2023 estimates, median household income within the CRA is estimated to be $40,534, which is significantly lower than that of the County at $64,690 and slightly lower than that of the City at $41,453. Similarly, per capita incomes within the CRA at $25,754 are also lower than those observed in the County and City at $36,487 and $26,565, respectively, as illustrated in the table below.
TABLE 22. INCOME CHARACTERISTICS
Incomes
Median Household $ 61,689 $ 41,450 $ 40,530
Average Household $ 91,023 $ 59,230 $ 57,790
Per Capita
$ 36,487 $ 26,565 $ 25,755
Average Disposable $ 71,540 $ 48,670 $ 48,000
In addition, the largest concentration of households within the CRA (approximately 18%) have household incomes of $35,000–$49,999, which is lower than that of the City, wherein the largest concentration of households (19%) have household incomes of $50,000–$74,999. The distribution of household incomes within the County, City, and CRA are illustrated in the figure below.
Within the CRA, the average disposable income is $47,997, which is also marginally lower than that of the City at $48,672. From this income-related data, it can be inferred that the CRA comprises a population with comparable, although slightly lower, incomes and spending potential compared to that of the City. However, the County has a significantly greater average disposable income at $71,540, which may be driven by the County’s higher average household incomes contributing to a greater level of consumer spending available per household.
F IG u RE 47. INCOME DISTRIB u TION
So URCE : U.S. CENSUS BUREAU; ESRI 2023 ESTIMATES; GAI C o NSULTANTS.
So URCE : U.S. CENSUS BUREAU; ESRI 2023 ESTIMATES; GAI C o NSULTANTS.
Employment and Business Activity
Annual Employment Trends
A diverse workforce and industry base within a market area can be an indication of healthy economic conditions, as it broadens the range of available employment and interested companies in an area. The key components to employment to consider when analyzing the overall business and employment market include annual employment trends, jobs by industry sector, unemployment rate, and employee inflow/ outflow within the area.
There are currently about 17,430 businesses within the County, and 888 businesses within the City. Approximately 34% or 306 businesses within the City are located within the CRA as of 2023 estimates. The total businesses within the City employ nearly 10,680 people or 7% of the 150,230 employees within the County. Comparatively, total businesses within the CRA employ approximately 1,740 people, or 16% of the City’s total employment.
Employment by sector data for 2023 estimates is provided by the Florida Department of Economic Opportunity and the historical data is provided by the U.S. Census Bureau Longitudinal Employer-Household Dynamics (“LEHD”).
From 2010 to 2023 estimates, total employment within the County, City, and CRA have grown at CAGRs of 3.5%, 2.9%, and 3.0%, respectively. Since 2010, the City has experienced an increase of nearly 3,487 employees; with the CRA capturing nearly 17%, or 585 employees, of this increase. The figure below illustrates the annual employment trends for the City and CRA from 2010 to 2023 estimates.
F IG u RE 48. TOTAL EMPLOYMENT
So URCE : FL o RIDA DEPARTMENT o F EC o N o MIC o PP o RTUNITY; U.S. CENSUS BUREAU LEHD; GAI C o NSULTANTS. N oTE: 2022-2023 ARE ESTIMATES.
The unemployment rate within the CRA is 1.4% lower than the unemployment rate within the County and City both at 3.9% as of 2023 estimates
Unemployment Rate
As of 2023 estimates, the CRA’s unemployment rate—i.e., the total number of unemployed persons as a percentage of the Civilian Labor Force—at nearly 2.5%, is lower than the unemployment rate within the County and City both at 3.9%. The unemployment rate is the percentage of the labor force that does not currently have a job, and generally rises and falls in the wake of changing economic conditions.
The high unemployment rate within the CRA may be a result of the lagging impacts of the COVID-19 pandemic when unemployment across the nation reached an all time high of 14.7%. As more businesses are established within the CRA, subsequently creating more jobs, the unemployment rate should experience a decrease.
Employee Inflow/Outflow
The most current employee inflow/outflow data provided by the U.S. Census Bureau is for year-end 2021. This data serves as an indication of the efficiency of the respective area’s labor force. As of year-end 2021, there were about 131,390 employees within the County. Of these employees, about 46% live within the County, while roughly 54% commute into the County from elsewhere to work (inflow). In addition, approximately 162,890 workers live inside the County, but are employed elsewhere outside the County (outflow). This condition results in a net negative outflow of 92,540 jobs out of the County.
At the City level, the employee inflow/outflow illustrates a different picture. Of the 8,435 employees within the City as of year-end 2021, nearly 9% live within the City, while roughly 91% commute into the City from elsewhere to work (inflow). Additionally, approximately 6,548 workers live inside the City, but are employed elsewhere outside of the City (outflow)—this results in a net positive inflow of 1,170 jobs in the City. Net job inflow (+)/outflow (-) indicates where the area is a labor force magnet or provider.
Comparatively, there were about 1,660 employees within the CRA as of year-end 2021. Of these employees, approximately 3% live within the CRA, while roughly 97% commute into the CRA from elsewhere to work (inflow). Additionally, 1,298 workers live inside the CRA, but are employed elsewhere outside (outflow). This condition results in a net positive inflow of 316 jobs to the CRA.
Employment Earnings
The most current employee earnings data provided by the U.S. Census Bureau is for year-end 2021. As of year-end 2021, the majority of employees within the County were earning wages that were more than $3,333 per month, at 40.3%. Comparatively, within the City and CRA as of yearend 2021, the majority of employees were earning wages between $1,251 to $3,333 per month, representing 40% and 45%, respectively. The adjacent table illustrates the year-end 2021 capture of monthly earnings respective to total employment for the County, City, and CRA.
Jobs by Industry Sector
The most current employment estimates by the North American Industry Classification System (“NAICs”) Industry Sector indicate that Health Care and Social Assistance, Retail Trade, Accommodation and Food Services, and Educational Services are the dominant industries within the County, City, and CRA. Combined, these industries comprise 58%, 84%, and 63% of the total share of employment within the County, City, and CRA, respectively, as of 2023 estimates.
Professional employment includes the following industry sectors: Information; Finance and Insurance; Real Estate; Professional Services; Management of Companies; Administration, Support, and Waste Management; and Educational Services. The County, City, and CRA’s white collar, or professional, work force comprises 27%, 11%, and 29%, respectively, of total employment as of 2023 estimates.
The table below illustrates the breakdown of employment by NAICs Industry Sector for the County, City, and CRA as of 2023 estimates.
Employees
So URCE :
So URCE : ESRI 2023 ESTIMATES; GAI C o NSULTANTS.
TABLE 24. JOBS BY IND u STRY SECTOR
TABLE 23. EMPLOYMENT EARNINGS CAPT u RE, YEAR-END 2021
U.S. CENSUS BUREAU LEHD; GAI C o NSULTANTS.
4.6.2 Inventory Analysis of Commercial & Residential Markets
As of YTD 2023, the CRA had a total of 582,682 sq. ft. of retail space, comprising 21% of the total inventory of retail space within the City at 2.71 million sq. ft.
The inventory analysis relied upon real estate data to evaluate performance trends for commercial uses, office, retail, and industrial; as well as residential uses, including multi-family, single family, and condo residential within the County, City, and CRA, as illustrated within the following pages. To note, the market and performance characteristics represented along the following pages reflect year-to-date (“YTD”) 2023, January through September 2023.
Retail Market Trends
The table below illustrates the retail market char acteristics for the County, City, and CRA as of YTD 2023 estimates.
TABLE 25. RETAIL MARKET CHARACTERISTICS
Total Inventory
Over the last 10 years, total inventory of retail space increased 4.0%, or 22,320 sq. ft., within the CRA: from 560,358 sq. ft. in 2014 to 582,682 sq. ft. as of 2023 YTD. The change in inventory within the CRA was driven solely by growth that occurred between 2021 to 2022; resulting in an increase of 10,542 sq. ft. driven by one single-tenant building, a Dollar General located on 1.39 acres at the corner of Gall Boulevard and C Avenue, which completed construction in 2022. There has been zero growth in the subsequent years following 2022.
Comparatively, the City experienced a 3.3%, or a 87,420-sq. ft., increase in total retail space during this same time frame, from 2.63 million sq. ft. in 2014 to 2.71 million sq. ft. as of 2023 YTD. Roughly a quarter of the growth that is observed within the City was driven by the development within the CRA. During this same 10year period, the CRA’s capture of retail space within the City has remained unchanged at 21%, as illustrated in the figure below.
Occupancy and Average Rental Rate
Over the last 10 years, 2014 to 2023 YTD, occupancy rates increased 5.5% within the CRA; from 93.3% in 2014 to 98.4% as of 2023 YTD. Comparatively, the City experienced a 7.9% increase also in occupancy of retail space during this same time frame, from 91.2% in 2014 to 98.3% as of 2023 YTD. During this same time frame, the County also experienced a 4.6% increase in occupancy, from 91.7% in 2014 to 96.3% as of 2023 YTD. An increase in occupancy rates may be attributed to an increase in health spending behaviors and a rise in building demand within the County, City, and CRA.
Throughout the last 10 years, average rental rates of retail space increased 37%, or $4.35, within the CRA: from $11.65 in 2014 to $20.04 as of 2023 YTD. Comparatively, the retail market within the City
experienced a 21%, or $2.54, increase in average rental rates during this same time frame, from $12.29 in 2014 to $19.88 as of 2023 YTD. The County also experienced an increase in average rental rates over the last 10 years, increasing by 59% from $14.05 in 2014 to $22.27 as of 2023 YTD. An increase in overall retail demand within the County and City may be driving the higher rents within the CRA.
The figures in the following page illustrates the relationship between occupancy rates and average rental rates within the County, City, and CRA’s retail market throughout the last 10 years, 2014 to YTD 2023 estimates.
So URCE : C o STAR GR o UP, 2023 YTD; GAI C o NSULTANTS.
F IG u RE 50. RETAIL MARKET OCC u PANCY RATE
So URCE : C o STAR GR o UP, 2023 YTD; GAI C o NSULTANTS.
F IG u RE 51. RETAIL MARKET AVERAGE RENTAL RATES
So URCE : C o STAR GR o UP, 2023 YTD; GAI C o NSULTANTS.
Office Market Trends
As of YTD 2023, the CRA had a total of 223,173 sq. ft. of office space, comprising 20% of the total inventory of office space within the City at 1.12 million sq. ft.
The following table illustrates the office market characteristics for the County, City, and CRA as of YTD 2023 estimates.
TABLE 26. OFFICE MARKET CHARACTERISTICS
Total Inventory
Over the last 10 years, total inventory of office space increased 1.8%, or 20,000 sq. ft., within the City; from 1,099,399 in 2014 to 1,119,399 sq. ft. as of 2023 YTD. The change in inventory within the City was driven by growth that occurred within two new developments from 2021 to 2023 YTD: (1) A Veterans Affairs Clinic, adding 14,000 sq. ft. in 2022; and (2) a medical office building, adding 6,000 sq. ft. in 2023 YTD. Comparatively, the CRA experienced zero change in inventory over the last 10 years, remaining stagnant at 223,173 sq. ft. of office space from 2014 to 2023 YTD. As a result of growth in the City compared to the CRA, the CRA’s capture of office space within the City has drop marginally, as illustrated in the figure in the following page.
So URCE : C o STAR GR o UP, 2023 YTD; GAI C o NSULTANTS.
u RE 52. TOTAL OFFICE INVENTORY
So URCE : C o STAR GR o UP, 2023 YTD; GAI C o NSULTANTS.
F IG u RE 53. OFFICE MARKET OCC u PANCY RATE
So URCE : C o STAR GR o UP, 2023 YTD; GAI C o NSULTANTS.
F IG u RE 54. OFFICE MARKET AVERAGE RENTAL RATES
So URCE : C o STAR GR o UP, 2023 YTD; GAI C o NSULTANTS.
Occupancy and Average Rental Rate
Over the last 10 years, 2014 to 2023 YTD, occupancy rates increased by 2.0% within the CRA; from 94.7% in 2014 to 96.7% as of 2023 YTD. Comparatively, the City experienced a 1.4% increase in occupancy of office space during this same frame, from 94.1% in 2014 to 95.5% as of 2023 YTD. During this same period, the County experienced a 4.3% increase in occupancy of office space, from 90.1% in 2014 to 94.4% as of 2023 YTD. An increase in occupancy rates may be attributed to an increase in the rise of building demand within the County, City, and CRA.
Throughout the last 10 years, average rental rates of office space significantly increased by 73%, or $6.96, within the CRA; from $9.57 in 2014 to $16.53 as of 2023 YTD. Comparatively, the office market within the City also experienced a 59%, or $6.43, increase in average rental rates during this same time frame, from $10.89 in 2014 to $17.43 as of 2023 YTD. Over the last 10 years, the County also experienced an increase in average rental rates, increasing by 44% from $19.95 in 2014 to $28.97 as of 2023 YTD. An increase in overall office demand within the County and City may be driving the higher average rents within the CRA. The figures above illustrate the relationship between occupancy rates and average rental rates within the County, City, and CRA’s office market throughout the last 10 years, 2014 to YTD 2023 estimates. To note, the average rental rates for office space are significantly higher within the County compared to the City and CRA, as illustrated in the figure above.
Industrial Market Trends
As of YTD 2023, the CRA had a total of 49,523 sq. ft. of industrial/flex space, comprising 3.3% of the total inventory within the City at 1.52 million sq. ft.
The following table illustrates the industrial/flex market characteristics for the County, City, and CRA as of YTD 2023 estimates.
TABLE 27. IND u STRIAL/FLEX MARKET CHARACTERISTICS
So URCE : C o STAR GR o UP, 2023 YTD; GAI C o NSULTANTS.
Total Inventory
Over the last 10 years, total inventory of industrial/flex space increased 25%, or 304,350 sq. ft., within the city; from 1.2 million sq. ft. in 2014 to 1.5 million sq. ft. as of 2023 YTD. The change in inventory within the City was driven by growth in 8 new industrial/flex properties with the largest two buildings comprising 61% and 14% of the new inventory, completed in 2023 and 2016, respectively.
Comparatively, the inventory of industrial/flex space within the CRA remained unchanged over the last 10 years, remaining stagnant at 49,534sq. ft. from 2014 to 2023 YTD. As a result of growth in the City compared to the CRA, the CRA’s capture of industrial/flex space within the City has drop marginally, as illustrated in the following figure.
F IG u RE 55. TOTAL IND u STRIAL/FLEX SPACE INVENTORY
So URCE : C o STAR GR o UP, 2023 YTD; GAI C o NSULTANTS.
Occupancy and Average Rental Rate
Over the last 10 years, occupancy rates remained unchanged within the CRA at 100% from 2014 to 2023 YTD. Comparatively, the City experienced a 0.8% decline in occupancy of industrial/flex space during this same period, from 86.7% in 2014 to 86.0% as of 2023 YTD. During this same time frame, the County experienced a 0.2% increase in occupancy of industrial/flex space, from 91.4% in 2014 to 91.6% as of 2023 YTD. An decline in occupancy rates within the City may be attributed to a decrease in building demand for industrial/flex space.
Throughout the last 10 years, average rental rates of industrial/flex space increased significantly with rents
more than doubling in the County, City, and CRA, increasing 120%, 115%, and 102%, respectively. The CRA experienced an increase of $6.25, from $6.14 in 2014 to $12.39 as of 2023 YTD; whereas the City experienced an increase of $6.24, from $5.43 in 2014 to $11.67 as of 2023 YTD. Comparatively, the County experienced an increase of $7.68, from $6.39 in 2014 to $14.07 as of 2023 YTD. An increase in overall industrial/flex space demand within the County and City may be driving the higher rents within the CRA.
The figures below illustrate the relationship between occupancy rates and average rental rates within the County, City, and CRA’s industrial/flex market throughout the last 10 years, 2014 to YTD 2023 estimates.
So URCE : C o STAR GR o UP, 2023 YTD; GAI C o NSULTANTS.
C o NSULTANTS.
So URCE : C o STAR GR o UP, 2023 YTD; GAI
F IG u RE 56. IND u STRIAL/FLEX MARKET OCC u PANCY RATES
F IG u RE 57. IND u STRIAL/FLEX MARKET AVERAGE RENTAL RATES
Space Utilization
Space utilization per job, particular to specific building types or industries, represents the typical square feet (“sq. ft.”) needed per employee and is a commonly used metric for measuring employment intensity and capacity. Although other factors, such as remote work and coworking space, can impact how much square footage is actually needed per employee, space utilization per job is generally a good indicator of space needed for both comfort and productivity in a physical setting.
Within the County the square footage per employee for combined commercial space was approximately 343 sq. ft. per employee. Comparatively, the City and CRA has significantly higher square footage per employee for combined commercial space at approximately 502 sq. ft., and 491 sq. ft. per employee, respectively.
To note, office and industrial space require significantly less square footage per employee than retail space—this is not surprising as retail space depends largely on “foot traffic” and requires substantially more accommodation space for customers. The table on the following page illustrates the space utilization ratios for combined commercial space within the County, City, and CRA as of 2023 YTD estimates.
As the CRA continues to grow in terms of population, employment, and inventory of commercial and residential space, it is reasonable to assume the potential development opportunities will support the space utilization per employee currently being achieved in the marketplace. This space utilization analysis is intended to help guide the amount of square footage necessary to accommodate employees in both a comfort and productivity capacity for new commercial developments within the CRA.
TABLE 28. SPACE u TILIZATION
So URCE : ESRI BUSINESS ANALYST; C o STAR GR o UP; GAI C o NSULTANTS.
Residential Dwelling unit Characteristics
Total Housing Units
As of the most recent YTD 2023 estimates, the CRA had a total of 1,707 housing units, which represents nearly 18% of the total housing units within the City at 9,685 units and 0.6% of the total housing units within the County at 270,046 units.
Since 2010, total housing units within the County and City grew at a CAGR of nearly 1.3% and 1.0%, respectively. During this time frame, the County added over 41,120 new housing units; whereas, the City added about 1,280 new units. Comparatively, the CRA experienced a negative CAGR of 0.13% since 2010— decreasing by 32 units, resulting in a steady decline of the CRA’s capture of housing within the City, as illustrated in the table below.
Housing Unit Composition
Of the total housing units within the County and City, single family units represent the majority only in the County at 81.7% and 48%, respectively, as of 2023 estimates. In the County, multi-family and mobile/manufactured homes represent 0.1% and 13.0%, respectively; whereas, multifamily represent 0.1% and mobile/manufactured home represent the majority at 49.3%, in the City.
The breakdown of housing unit composition is similar to that observed within the CRA as of 2023 final estimates. Within the CRA, single family units (i.e, detached single family and attached townhomes) represent the majority at 70% of the total share. Multi-family and mobile/manufactured homes compose approximately 26% and 4%, respectively, of the total housing units within the CRA, as illustrated in the figure below. To note, there are zero condominium housing units located within the CRA.
F IG u RE 58. CRA HO u SING COMPOSITION
So URCE : PASC o C o UNTY FINAL 2022 TAX R o LL; ESRI 2023 ESTIMATES; GAI C o NSULTANTS.
TABLE 29. TOTAL HO u SING u NITS
Missing Middle Housing
Missing Middle Housing is a range of house-scale buildings with multiple units—compatible in scale and form with detached single-family homes—located in walkable neighborhoods. The Missing Middle Housing types provide diverse housing options, such as duplexes, fourplexes, cottage courts, and multiplexes. These housescale buildings fit seamlessly into existing residential neighborhoods and support walkability, locally-serving retail, and public transportation options. They provide solutions along a spectrum of affordability to address the mismatch between the available U.S. housing stock and shifting demographics to the shrinking family size and financial resources available, combined with the growing demand for walkability.
TABLE 30. RESIDENTIAL PARCEL COMPOSITION
So URCE : PASCo Co UNTY FINAL 2023 TAX R o LL; GAI Co NSULTANTS. N oTE: Mo RE INF o RMATI o N RELATED To THE Co MP oSITI o N o F CRA RESIDENTIAL UNITS CAN BE F o UND IN THE AREA ASSESSMENT SECTI o N (FIGURE 29, TABLE 6).
For the purposes of this market assessment, Missing Middle Housing was classified as single family attached townhomes and multi-family residential properties with between 2 and 8 units within the City and CRA. The table below illustrates the total residential parcels by total units within the City and CRA according to Pasco County’s Final 2023 Tax Roll.
Work | Multiplex
Housing Tenure
The households within the City and the CRA average approximately 2.3 persons per household, whereas the average household size within the County is about 2.5 persons per household. Additionally, the household tenure in the County, City, and CRA is predominately owner-occupied, as illustrated in the following figure. As of 2023 estimates, the CRA has a significantly greater owneroccupied composition when compared with the City, which may be driven by the significantly less multi-family units compared to single family units within the CRA.
So URCE : ESRI 2023 ESTIMATES; GAI C o NSULTANTS.
F IG u RE 59. CRA HO u SING u NIT SIZE
F IG u RE 60. OWNER/RENTER OCC u PIED
Housing Unit Vacancy Rates
As of most recent 2023 estimates, the percentage of vacant housing units within the CRA at 17% are only slightly greater than that of the County and City at 11% and 15%, respectively. This indicates that the housing trends within the County, City, CRA follow a similar pattern in terms of housing types and seasonality and/or rotational vacancy. To note, rotational vacancy includes units currently for rent, rented but not yet occupied, for sale, and sold but not yet occupied.
F IG u RE 61. HO u SING u NIT VACANCY RATE
In addition, since 2010, vacancy rates in housing units have significantly declined in both the County and CRA by 8% each, whereas the City experienced a greater decline in housing units vacancy by 6%, as illustrated in the figure below. A decrease in vacancy rates can be attributed to an increase in quality of housing units, a decrease in seasonality and rotational vacancy, and an increase in demand to reside within the specific area—in this case to reside within the County, City, or CRA.
So URCE : ESRI 2023 ESTIMATES; GAI C o NSULTANTS.
Unit Values
According to the final 2023 Pasco County Tax Roll, the average just/market value per dwelling unit within the CRA was greater within single family units, followed by multi-family and mobile/manufactured housing units. On average, the residential properties within the CRA are achieving just/market values approximately 21% lower than those observed within the City. The following table details the average just/market values for all residential properties within the CRA and the City.
TABLE 31. AVERAGE J u ST/MARKET VAL u E
So URCE : PASC o C o UNTY FINAL 2022 TAX R o LL; GAI C o NSULTANTS.
Cost to Rent
The average asking rent for multi-family properties within the County experienced a 23% increase over the last 5 years, from $1,242 per unit in 2019 to $1,531 per unit as of 2023 YTD, January 2023 through October 2023. Comparatively, the City also experienced a 17% increase over the last 5 years, from $982 per unit in 2019 to $1,150 per unit as of 2023 YTD. In addition, since the inventory of multi-family properties within the CRA is minimal, the market rent per square foot was used to compare rental rates within this assessment. As a result, the average market asking rent for multi-family properties within the CRA experienced an 8% increase over the last 5 years, from $656 per unit in 2019 to $710 per unit as of 2023 YTD.
The figure below illustrates the average rental rates per unit for both the City and CRA from 2019 to 2023 YTD.
F IG u RE 63. M u LTI-FAMILY AVERAGE RENTAL RATES PER u NIT
Concentration Mapping
The map above illustrates the areas of concentration for commercial, office, and industrial; as well as residential uses, including multi-family and single family (i.e., detached single family and attached townhomes) within the CRA as of YTD 2023 estimates.
F IG u RE 62. CONCENTRATION MAPPING OF PROPERTIES BY u SE TYPE
So URCE : C o STAR GR o UP, 2023 YTD; GAI C o NSULTANTS.
4.6.3 Market Potential Analysis
The market potential analysis draws upon the previously described inventory analysis for commercial and residential markets, and comprises the following: (1) population and employment projections for the CRA; (2) consumer spending and retail gap analysis within the CRA as it relates to the City; and (3) potential demand and supply of commercial and residential inventory within the CRA over the next 20-year period, 2023 through 2042 (“projection period”).
Over the 20-year projection period, the CRA is estimated to experience a 30% increase in population and a 20% increase in employment by 2042.
Population and Employment Projections
Population Projections
The Bureau of Economic and Business Research (“BEBR”) has been instrumental in providing population projections for Florida and its counties since the 1970s. BEBR provides a high, moderate, and low (“H-M-L”) growth projection extending to 2050 for all Florida counties; these projections are considered an industry standard when approaching population projections for counties in Florida. Although the moderate scenario is considered the most accurate forecast of future population change, the high and low scenarios illustrate a range of possible outcomes. It is important to note that the population projections provided through BEBR solely reflect Florida residents, and exclude any seasonal population change as a result of tourism and visitation.
In 2023, total population was estimated to be about 610,740 persons within the County, 19,340 within the City, and 3,320 within the CRA. Over the last 10 full years, 2013 to 2022, the City has captured an average of 2.9% of the total population within the County annually. Whereas, the CRA has captured an average of only 0.6% of the total population within the County during this same time frame. Applying these capture rates to the County’s net population change according to BEBR’s projections, the City and CRA’s H-M-L future population growth can also be estimated throughout the next 20 years.
Throughout the 20-year projection period, the City is estimated to experience an increase in population between 3% and 46%, resulting in total population between 19,830 and 28,160 persons by 2042. Comparatively, the CRA is estimated to experience an increase between 3% and 57%, resulting in total population between 3,430 and 5,200 persons by 2043. To emphasize, the moderate scenario is considered the
most accurate forecast of future population change. In the moderate scenario, total population is estimated to grow at a CAGR of 1.1% and 1.3% for the City and CRA, respectively; with the City and CRA experiencing a 24% and 30% increase, respectively, in total population growth by 2042. In the moderate scenario, total population is estimated to be 23,990 persons in the City and 4,315 persons in the CRA by 2042.
The table below illustrates the moderate scenario of population projections for the City and CRA in 5-year increments throughout the projection period.
Employment Projections
The annual average ratio of establishment employment to total population in the County is 23.23 jobs per 100 people. By applying this ratio to the County’s population projections according to BEBR, H-M-L future employment growth can also be estimated throughout the 20-year projection period.
As of 2023 estimates, total establishment employment was estimated to be nearly 150,230 persons within the County, 10,680 within the City, and 1,740 within the CRA. Over the last 10 full years, 2013 to 2022, the City has captured an average of 7.1% of the total employment within the County annually. Whereas, the CRA has captured an average of 1.2% of the total employment within the County during this same time frame. Applying these capture rates to the County’s employment projections, the City and CRA’s H-M-L future employment growth can also be estimated.
SoURCE: BEBR 2023 ESTIMATES; BEBR 2025-2050 PRoJECTIoNS; GAI CoNSULTANTS.
Throughout the 20-year projection period, the City is estimated to experience between a decrease in employment of 4% to an increase of 40%, resulting in total employment between 10,290 and 14,980 employees by 2042. Comparatively, the CRA is also estimated to experience between a decrease in employment of 2% to an increase of 42%, resulting in total employment between 1,700 to 2,130 employees by 2042. TABLE 32. POP u LATION PROJECTIONS | MODERATE SCENARIO, 5-YEAR INCREMENTS
To emphasize, the moderate scenario is considered the most accurate forecast of future employment change. In the moderate scenario, total employment is estimated to grow at a CAGR of 0.8% for the City and 0.9% for the CRA, with the City and CRA each experiencing an 18% and 20% increase in total employment growth by 2042, respectively. In the moderate scenario, total employment is estimated to be 12,640 employees in the City and 2,090 employees in the CRA by the end of the projection period, as illustrated in the adjacent table.
The figure below illustrates the moderate scenario of population and employment projections for the CRA in throughout the projection period, 2023 to 2042.
So URCE : BEBR 2023 ESTIMATES; BEBR 2025-2050 PR o JECTI o NS; GAI C o NSULTANTS.
F IG u RE 64. CRA POP u LATION AND EMPLOYMENT PROJECTIONS | MODERATE SCENARIO
So URCE : BEBR 2023 ESTIMATES; BEBER 2025-2050 PR o JECTI o NS; GAI C o NSULTANTS.
As of 2023 estimates, the CRA has an approximate total of $79.2 million in consumer spending, composing 16% of the $490.5 million of consumer spending within the City.
Retail Gap Analysis
To assist with the potential positioning of development opportunities within the CRA amongst current and emerging supply of similar commercial uses, a retail gap analysis was conducted to examine the relationship between what households spend their income on and where that spending occurs.
The act of residents within a defined market area leaving that area to purchase certain types of goods because they are not readily or abundantly available locally is commonly referred to as Retail Leakage . This retail gap analysis will examine both consumer spending behaviors and assess Retail Leakage within the City and the CRA to inform types of retail that might be appropriate and supported within the CRA, based on demand and supply.
Consumer Spending
What individuals and households residing within the CRA spend on retail, restaurants, or other food service provides additional perspective for this retail gap analysis. The most current consumer spending data provided by the U.S. Census for the CRA and the City is 2023 estimates.
Within the CRA, the largest consumer spending categories are housing, retail goods, and transportation, composing 29%, 28%, and 10%, respectively, of the total consumer spending within the CRA. Similarly, the largest consumer spending categories within the City are also retail goods, housing, and transportation. Additionally, the CRA is capturing a relatively consistent share of consumer spending within the City across every retail category, composing between 15.7% and 17.4% of the spending in each category.
The following table illustrates the 10 highest consumer spending by retail category for the City and CRA as of YTD 2023 estimates.
TABLE 34. 10 HIGHEST CONS u MER SPENDING RETAIL CATEGORIES (IN THO u SANDS)
Retail Leakage
The retail gap analysis compares and contrasts Retail Leakage occurring within the CRA and the City from permanent and visiting population at each 3-digit North American Industry Classification System (“NAICs”) industry code between 44-45 (Retail Trade) and 772 (Food Services and Drinking Places). A Retail Leakage analysis illustrates the dollar value difference between consumer expenditures in a market area (demand) and the corresponding retail sales of the market area stores (supply). The “retail gap” presents a snapshot of retail opportunity, and is a measure of the relationship between supply and demand. A positive ‘retail gap’ value indicates there is greater supply than current demand.
Overall, the CRA is experiencing a retail surplus of nearly $32.8 million per year. Food Services and Drinking Places compose $10.6 million of the total annual retail surplus; whereas, Retail Trade composes $22.2 million of this share. This retail surplus occurring within the CRA is primarily driven by an abundance of supply (sales) within Food and Alcoholic Drinking Places, Building Material, Garden Equipment and Supplies stores, and Sports, Hobby, Book, and Music stores, which significantly exceed existing demand within the CRA.
Comparatively, the City is also experiencing a retail surplus of nearly $227.9 million per year. Food Services and Drinking Places compose $26.2 million of the total annual retail surplus; whereas, Retail Trade composes $201.7 million of this share. This retail surplus occurring within the City is primarily driven by an abundance of supply (sales) within General Merchandise stores, Food and Beverage stores, and Building Material, Garden Equipment and Supplies stores, which significantly exceed existing demand within the City.
As a result of the analysis of spending patterns, existing inventory, and retail surplus within the CRA, there appears to be very little need for additional retail capacity within the CRA. However, there are important distinctions between need and demand. Need is a relatively static concept, driven primarily by deficient supply. Viewed through such a lens, need is largely a planning and welfare matter often measured exclusively by gains or losses in population.
Responses to need typically focus on community priorities without reference to the capacity of the market to provide alternatives through profit-driven transactions. Needs are real and definable, but they cannot always be adequately addressed. On the other hand, demand, is a dynamic concept. It is very price and product driven—functionally, the result of choices, age, lifestyle, preferences, and continued movement of the population. Even when need is limited, demand can be strong in a marketplace that has proven itself a reliable and systematic source for products and services.
In the present case, there are elements of both need and demand within the CRA. To that point in particular, residents outside the City and CRA are drawn to the area to meet shopping-related needs, as illustrated in the table below. To note, although some of the demand within the City could be met by additional industry-specific retail capacity within the CRA, development should be conducive to the existing supply of retail in terms of character, space, and scale to the CRA. Altogether, this retail gap analysis helps identify opportunities for industry-specific retail uses that could be supported by the current demand within the City and CRA.
TABLE 35. RETAIL GAP ANALYSIS
The CRA will need to accommodate 260,800 sq. ft. of new commercial space and 462 new housing units by 2042 to support the population and employment projections in the moderate scenario.
Commercial & Residential Space Demand Analysis
New Commercial Demand
Demand for new commercial space is a function of the type and nature of the employment industry it supports. While strong health care and social assistance services, accommodation and food services, educational services, and retail trade industries exist within the CRA, the City and County are expected to remain the major draws for regional employment. The consequence is that most employment growth and, therefore, demand for commercial space in the CRA would be driven by supporting population needs in services and community and neighborhood retail and restaurants.
Based on the H-M-L projections of population and employment through 2042, along with the space utilization per employee ratios, the CRA would need an increase of between 53,440 and 468,120 sq. ft. of additional commercial space (office, retail, and industrial) to support new demand—roughly an annual rate between 2,670 and 23,410 sq. ft. per year throughout the projection period. The following table illustrates the H-M-L estimated total square footage for combined commercial space throughout the projection period which may be reasonably achievable based on demand projections.
This demand analysis predicts that in the near-term, 2023 to 2032, the rates of growth will be slightly higher as the CRA reacts to potential development opportunities to accommodate new population and employment growth. Throughout the remaining projection period, the addition of new commercial space is predicted to grow at a slightly slower, steady rate between 0.3% and 2.2% CAGR, as supply of vacant commercial land lessens and redevelopment of existing space comprises the majority of additional growth in commercial space. These rates
of growth are similar to what the CRA has previously achieved over the last 10 years.
In the moderate scenario, demand for retail space will comprise the majority of the net new commercial development within the CRA at an estimated 68% of the share of new commercial growth by 2042. Demand for office and industrial space will comprise a relatively modest share of the new growth by 2042 at 26% and 6.8%, respectively.
TABLE 36. COMBINED COMMERCIAL SPACE PROJECTIONS (2023–2042)
So URCE : CoSTAR GR o UP; GAI Co NSULTANTS. N oTE: VALUES ARE ESTIMATED.
New Residential Demand
Demand for new household formation from population growth is not exclusively a product of the supply and sales of residential housing units, but the ability for an area to accommodate overall demand for housing, which is linked to the steady supply of new housing units. Absent the construction of new housing units, population growth within the CRA is likely to stagnate. Thus, it is important to recognize new housing unit stock as both an opportunity to accommodate new households as well as provide existing households the opportunity for household mobility. The net effect either way is the accommodation of housing supply to meet demand.
Although total housing units have experienced a slight decline, total households have seen a positive growth of 75 households since 2010. This decline in housing units may be attributed to increases in seasonal and/or vacation housing units. To note, a household includes all the persons who occupy a housing unit as their usual place of residence; whereas, a housing unit is a house, an apartment, a mobile home, a group of rooms, or a single room that is occupied (or if vacant, is intended for occupancy) as separate living quarters. The historic housing supply as it relates to historic population within the CRA has remained relatively stable since 2010, as detailed in the following table.
Based on the projections of population over the next 20 years, through 2042, as well as considering the average persons per households and the annual vacancy rates attributed to seasonality, the stock of housing units within the CRA would need to grow by about 462 units to support net new residential demand. This new demand equates to an annual rate of roughly 23 units per year. The table on the following page illustrates the estimated total households and housing units throughout the 20year projection period in 5-year increments which may be reasonably achievable based on moderate scenario of population and employment demand projections.
TABLE 37. HISTORIC CRA HO u SING u NITS
So URCE : PASC o C o UNTY FINAL 2022 TAX R o LL; ESRI 2023 ESTIMATES; GAI C o NSULTANTS.
TABLE 38. HO u SING u NIT PROJECTIONS
So URCE : PASC o C o UNTY FINAL 2022 TAX R o LL; ESRI 2023 ESTIMATES; GAI C o NSULTANTS. N oTE: VALUES ARE ESTIMATED. (1) REPRESENTS CURRENT 2023 ESTIMATES.
Proximate Commercial and Residential Capacity (Supply)
Although the land needed to accommodate this commercial and residential demand growth is unknown— either because existing vacant lands are not currently planned for development or they exist in a use that does not allow for commercial or residential development. What is known, is that within the CRA exists a stock of 110 parcels with a combined total of 34.4 vacant commercial (i.e., office and retail) and institutional acres, as well as 137 vacant residential parcels equating to 35.8 acres.
Given the various average residential densities existing within the CRA for R-2 (5 dwelling units per gross acre), R-3 (7 single-family detached or 10.5 duplex dwelling units per gross acre), and R-4 (20 units per gross acre) , the limited amount of vacant residential land existing within the CRA is likely not adequate to accommodate future population growth and housing needs through 2042. In addition, applying the average floor area ratio (“FAR”) for existing commercial properties within the CRA, at an FAR of 0.18, it can be estimated that the new commercial demand will need between 6.8 to 61.9 acres of vacant land for development by the end of the 20-year
projection period. Given the limited amount of vacant commercial land existing within the CRA, there is likely not adequate land to accommodate the moderate and high projections of future employment and commercial demand needs through 2042.
As a result of this analysis of commercial and residential capacity, redevelopment of existing properties and sites within the CRA at higher densities/intensities should be considered to accommodate future demand.