Annual Report
2025
Figures in 2025
Gross revenue
1 158 million (USD)
Employees
Diversity
320
41%
28 nationalities
women / 59% men
15 locations
Vessels
Port calls
96
2 790
nominated and chartered vessels
port calls to 48 countries
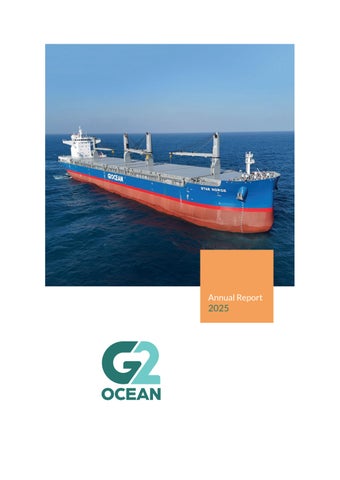
Front page: Star Norge. Photo: Grieg Maritime Group 2
+30
Global trade routes
MANAGEMENT REPORT
Introduction
About G2 Ocean
Sustainability statements
General information
Environment
Social
Financial statements Governance
Carbon intensity (AER)
-2.35% from 2024 to 2025
Cargo carried
Voyage days
21 105 518
34 308
revenue tons of cargo carried
3
total voyage days
Appendix
4
02
Annual Report 2025
Introduction
02 Figures in 2025 06
08
10
Letter from the CEO
Management report About G2 Ocean
18
12 Company overview
Sustainability statements 20
General information
20 Reporting practices 15
Market development and outlook
16
Financial performance
17
Risk factors
22 Our sustainability strategy and approach 24 ESG Governance 30 Impacts, risks and opportunities management 40
Environment information
41 Climate change
54 EU taxonomy 64 Pollution of air 66
Social information
68 Own workforce
81 Workers in the value chain 86
111
Financial statements
96 112
Consolidated financial statement
Governance information
87 Business conduct
Appendix
96 ESRS Index
98 EU legislation 117
Notes to the Consolidated Financial Statements
105
Statement from the Board of Directors and the CEO Independent Sustainability Auditor's Limited Assurance Report 106
144
Report of Independent Auditors
g2ocean.com
5
Letter Our from the CEO organisation
Building a stronger G2 Ocean in volatile times Throughout 2025, G2 Ocean maintained its commitment to continous service improvement, actively pursuing new opportunities that enabled us to further strengthen our offerings to global customers, expand into new areas, enhance efficiency, and increase value creation.
We continued to operate under an environment of high volatility, driven by ongoing security threats in the Red Sea, geopolitical tensions, and shifting trade policies, all of which impacted customer demand, vessel routes, and freight rates.
as we continued to integrate responsible practices into our daily decision-making. This approach has enabled us to make progress across our material sustainability areas, contributing to a strengthened competitive position. As an example, from 2022 to 2025, stevedore injuries related to our operations have more than halved. This underscores the importance of maintaining a continuous focus on safety and risk management, as well as collaborating closely with our partners to implement effective measures that further enhance safety. While we have made progress, we are committed to further strengthening our safety culture, striving for zero injuries ensuring all involved in our operations return home safely.
Over the years, we have developed an organisation that is highly adaptive, responding effectively to changing circumstances by identifying practical solutions and then applying them with rigour. This resilience has proven to be a critical asset, enabling us to navigate a complex global environment with agility. Despite the challenges faced, we concluded 2025 with strong results. We transported 21.1 million revenue tons of cargo, reaching 2,790 ports over the course of 34,308 voyage days. This activity contributed to a gross revenue of USD 1.1 billion, and distribution to the pool participants of USD 457 million, an increase of 16% compared to last year.
Fleet renewal Decarbonisation continued to be a central focus for G2 Ocean during 2025, driven by a combination of evolving regulatory requirements, increasing customer expectations, and our commitment to ensuring long-term business resilience. Despite the International Maritime Organization (IMO) deciding to postpone the adoption of its carbon pricing mechanism, the Net-Zero Framework, by 12 months, we continued our decarbonisation efforts. Among the measures taken include increasing the use of biofuels across our fleet by 31%, contributing to achieving a 2.3% improvement in the carbon intensity of our nominated fleet compared to 2024.
Strengthening partnerships A significant event for G2 Ocean in 2025 was the change in Gearbulk's ownership structure, with Mitsui O.S.K Lines (MOL) increasing its shareholding and Marubeni Corporation (Marubeni) becoming a minority shareholder in Gearbulk. This has helped to strengthen G2 Ocean's collaboration with both companies, allowing for further optimisation of our fleet and trade operations, leading to enhanced services for our customers. We look forward to continuing this partnership and working together to grow our businesses in the years ahead.
Looking forward, our commitment to sustainability and operational excellence will be further strengthened as Gearbulk and Grieg Maritime Group, as shareholders and pool participants, deliver 10 advanced newbuild vessels to our fleet over the next three years, including four scheduled for delivery in 2026. These additions will further enhance
Sustainability progress Sustainability remained a core focus throughout the year
6
our operational capabilities and support our climate targets.
services. Looking ahead, we are committed to upholding these qualities as we work toward building an even stronger G2 Ocean.
Core strengths On behalf of the leadership team, thank you for your trust and partnership.
As you review our 2025 performance in this report, I want to highlight the four main factors that have driven our ongoing progress and growth over the past year: Flexibility: Our team's ability to swiftly adapt to market fluctuations, evolving customer requirements, and global challenges, coupled with our flexible fleet and trade pattern model, enables us to efficiently serve a broad spectrum of markets and cargo demands. High performing culture: G2 Ocean's culture is defined by the dedication of our highly skilled employees who collaborate across functions and regions as one team. We encourage proactive action and empower individuals to lead, regardless of formal authority, ensuring that each team member is motivated and empowered to make meaningful contributions.
Arthur English Chief Executive Officer G2 Ocean
Continuous improvement: We focus on continually improving our processes and systems, enabling us to increase productivity, reduce risks, and deliver greater value to our customers and shareholders. Strategic partnerships: Over the years, we have developed strategic partnerships with key suppliers and stakeholders. Collaborating on joint initiatives enables us to solve complex challenges, strengthen our market position and achieve common objectives. Collectively, these strengths position us to provide our customers with safe, flexible, sustainable, and reliable
7
Management report
8 8
About G2 Ocean
11
Sustainability statements 19
9 9
10
Management Report
About G2 Ocean 12
Company overview
15
Market development and outlook
16
Financial performance
17
Risk factors
11
Management report About G2 Ocean
COMPANY OVERVIEW G2 Ocean is a global ship operator specialising in the break bulk open hatch segment. The Company has extensive experience in cargo handling, trade management, and global port operations. Established in 2017 as a joint venture by Gearbulk Holding AG (“Gearbulk”) and Grieg Shipholding AS, a subsidiary of Grieg Maritime Group (“Grieg”), G2 Ocean has grown to become a trusted name in the maritime industry.
Our services
It is also worth noting that, in 2025, G2 Ocean’s strategic partnerships with MOL and Marubeni was further strengthened following their new and expanded ownership stakes in Gearbulk. This enhanced relationship has fostered deeper cooperation and synergies, supporting G2 Ocean’s continued growth and ability to deliver exceptional services to its customers worldwide.
Our experience and expertise in cargo handling, combined with our comprehensive knowledge of global port operations, positions us as a reliable transportation partner for a wide range of industries, including raw materials, metals, forest products, as well as renewable energy and automotive industries. Figure 1 provides an overview of G2 Ocean’s cargo mix in 2025.
To exceed its customer expectations, G2 Ocean is dedicated to delivering safe, flexible, reliable, and sustainable shipping services. In 2025, we operated a core fleet of 88 open hatch vessels, supplemented by 8 vessels from third-party partners. We transported a total of 21.1 million revenue tons of cargo to 283 ports in 48 countries around the globe.
Figure 1
G2 Ocean’s 2025 cargo mix (percentage of commodities carried by revenue tonnes)
Soda
3.3% Aluminium
6.0%
Granite
2.2% Fertilizer
6.8%
Forest Products
46.8%
Bulk Other
7.2%
Project
11%
Steel
16.8%
12
MANAGEMENT REPORT
Introduction
About G2 Ocean
Sustainability statements
General information
Environment
Social
Financial statements Governance
Appendix
Global presence Headquartered in Bergen, Norway, G2 Ocean supports its global network through commercial hubs in Singapore and Atlanta, USA, alongside 12 representative offices worldwide. Our diverse and international workforce is spread across several geographical locations, underpinning our commitment to serving customers wherever they operate. Our headcount in 2025 was 320, with a gender balance of 41% female and 59% male employees across the organisation.
Illustration 1
G2 Ocean’s office network
62 Bergen (HQ) 9 Vancouver
50 Atlanta (Hub)
3 Gothenburg
30 Shanghai
1 Houston 92 Manila
3 Santiago
3 Rotterdam
Livorno Rio de Janeiro
1
Dubai Durban
4
20
13
2
Singapore (Hub)
35
Melbourne
5
Management report About G2 Ocean
1
2
Cargo booking
4
Vessel allocation
3
Clear the goods for departure
5
Cargo arrives at port
Cargo loading operation
The G2 Ocean Cargo Journey Our employees, located across various global regions, play a key role in delivering our services. Illustration 2 demonstrates a typical cargo journey at G2 Ocean.
6
Vessel departure
Illustration 2
G2 Ocean Cargo Journey
7 1
Vessel voyage
9
Cargo booking
Cargo discharge operation
G2 Ocean receives a cargo request from the customer a nd agrees on the most suitable transportation service according to the customer’s needs and cargo requirements. 2
Vessel allocation
G2 Ocean selects a suitable vessel for the cargo considering the origin and destination of the cargo, cargo handling and stowage requirements and timing of delivery. The vessel is provided from the G2 Ocean pool. 3
8
10
Vessel arrival
Clearing the cargo
Cargo arrives at port
The cargo is delivered at the port of origin. 4
Clear the goods for departure
The cargo is custom cleared by a Port Agent hired by G2 Ocean to administer the arrival a nd departure of the vessel. 5
11
Cargo loading operation
G2 Ocean hires stevedores to load and secure the cargo at the port of origin safely and efficiently. G2 Ocean’s equipment is used to load the cargo safely and efficiently. G2 Ocean provides fuel for the voyage via a bunker supplier. 6
Vessel departure
G2 Ocean departs the port assisted by tugs and a pilot contracted by the Company. 7
Vessel voyage
G2 Ocean executes the voyage from the port of origin to the port of destination in close cooperation with the vessel master and crew. G2 Ocean gives the vessel instructions on speed and fuel consumption. We also provide weather routing services to the vessel to ensure the safety of the vessel personnel, cargo and ship. 8
Store the cargo
Vessel arrival
The vessel arrives at the port of destination assisted by tugs and a pilot contracted by G2 Ocean.
12
9
Transhipment of cargo
Cargo discharge operation
G2 Ocean hires stevedores to discharge the cargo at the port of destination safely and efficiently. G2 Ocean’s equipment is used to discharge the cargo safely and efficiently. 10
Clearing the cargo
The cargo is custom cleared by a Port Agent hired by G2 Ocean to administer the arrival of the vessel. 11
Store the cargo
The cargo is discharged and, depending on the contractual terms, transferred to a safe location waiting for collection by the receiver. 12
Transhipment of cargo
In many cases, G2 Ocean arranges transhipment or further on-carriage if required.
14
MANAGEMENT REPORT
Introduction
About G2 Ocean
Sustainability statements
General information
Environment
Social
Financial statements Governance
Appendix
MARKET DEVELOPMENT AND OUTLOOK Shipping in 2025 was defined by increasing geopolitical instability and uncertain trade policies.
Looking ahead, these dynamics are expected to remain central. Shipping markets will likely continue to be driven by changes in trade patterns and tonne-mile demand rather than pure volume growth due to the ongoing diversification of global trade, as well as geopolitical unpredictability.
From the escalation of tariffs to the ongoing disruptions in the Red Sea, the industry experienced challenges throughout the year. Despite these uncertainties, seaborne trade demonstrated strength, growing by 1.1% as global supply chains adapted to a constantly changing landscape. Geopolitical events, including Middle Eastern conflicts, sanctions on Russia, Iran, and Venezuela, and policy volatility particularly related to US tariffs, disrupted global trade routes. Importers front-loaded cargo to bypass tariffs, which shifted rather than decreased trade volumes and demand patterns. This led carriers and cargo owners to restructure supply chains and vessel routing, increasing operational costs and complexity but also lengthening sailing distances, absorbing fleet capacity, and supporting shipping demand. For the Container sector, these geopolitical tensions helped offset oversupply, as new vessel deliveries and Cape of Good Hope rerouting absorbed excess capacity and increased tonne-mile demand. Freight markets remained volatile due to shifting trade lanes and US-China tensions, while charter rates remained high due to limited tonnage. The sector also continued its technological development, with record orders for vessels powered by alternative green fuels. The Dry Bulk market faced different but equally complex challenges. The year started with Russian grain export restrictions and quotas disrupting traditional Black Sea routes, placing immediate pressure on smaller ship classes amidst a surge of new vessels entering the market. In the year’s second half, demand rebounded due to China's increased iron ore imports, higher long-haul exports from the Atlantic, and route changes caused by canal constraints and regional conflict. A notable trend was a sharp decline in new dry bulk vessel orders, as shipyards focused on container and tanker contracts. Looking more broadly, tariffs and political uncertainty led global trade to adjust, not decline. Manufacturers diversified supply chains, shifting exports to Europe, the Middle East, Africa, and South America, which increased tonne-mile demand and extended supply routes. Eased monetary policy, fiscal stimulus, and strong investments in digitalisation and artificial intelligence (AI) further supported cargo demand and helped offset risks from trade barriers. For both the Dry Bulk and Container segments, 2025 showed how shipping is increasingly impacted by geopolitical developments. Trade policy, sanctions, security risks, and environmental regulation are part of the industry’s normal landscape, rather than external shocks. The year demonstrated the industry’s resilience, with market outcomes driven more by global politics than economic growth.
15
Management report About G2 Ocean
FINANCIAL PERFORMANCE Results, earnings and operations
was injected capital. By end of 2025, the equity ratio was 21.8% (2024: 14.4%). The increase is driven by a positive impact from the market value of outstanding derivatives for hedging purposes. By the end of 2025, the Company had total assets of USD 205 million (2024: USD 227 million), with current assets accounting for USD 167 million (2024: USD 186 million) and total current liabilities amounting to USD 154 million (2024: USD 189 million).
The fluctuations in the dry bulk market in 2025 impacted G2 Ocean’s financial performance. The Company’s revenue for 2025 was USD 1 158 million, a reduction from the 2024's USD 1 382 million due to less activity, though partly offset by increased rates. Voyage related and time charter costs reduced to USD 630 million from USD 915 million in 2024, driven by less activity and costs. Income from operations before pool distribution was USD 462 million (2024: USD 402 million), resulting in a pool distribution of USD 457 million to our pool participants (2024: USD 392 million). Net earnings per vessel per day increased by 10.0% compared to 2024, driven by increased rates. G2 Ocean’s income before tax was USD 4.5 million (2024: USD 4.3 million), with a net income of USD 3.2 million for 2025 (2024: USD 3.5 million).
Based on net negative cash flows from operations of USD 0.4 million (2024: positive by USD 35.8 million), a net negative cash flow from investments of USD 3.1 million (2024: negative by USD 2.1 million) and a net positive cash flow of USD 6.7 million (2024: negative by USD 34.4 million) from financing activities, the Company’s net change in liquid funds in 2025 was positive by USD 4.8 million (2024: negative by USD 2.8 million). Liquidity in the form of bank deposits, cash and undrawn credit facility at year-end totalled USD 34.0 million (2024: USD 48.1 million).
Balance sheet, financial situation and cash flow The Company’s book equity was USD 44.6 million (2024: USD 32.7 million) at year-end, whereof USD 28.1 million (2024: USD 28.1 million)
Figure 2
Breakdown of share of revenues by customer segment/product
Soda
Granite
Granite
2.6% 2.4%
Fertilizer
30.4% 9.3%
5.2%
Lumber/Wood
5.8% Bulk Other
2.7% 2.3%
Fertilizer
5.8%
Lumber/Wood
Soda
5.4%
Forest products
33.8%
Bulk Other 5.9%
Percentage of revenue 2024
9.9%
Percentage of revenue 2025
Aluminium
10.0% Aluminium
19.1%
12.8%
14.5%
21.9% Steel
Project Steel
Project
16
Forest products
MANAGEMENT REPORT
Introduction
RISK FACTORS
About G2 Ocean
Sustainability statements
General information
Environment
Social
Financial statements Governance
Appendix
OVERVIEW RISK MANAGEMENT PROCESS
G2 Ocean´s Risk Environment
Risk Iden fica on
Analyse the risk
STEP 1
Evaluate the risk
STEP 2
STEP 3
Identify the risks in our Analysing the risk, operating environment. determining its scope.
Ranking and prioritising the risk.
Risk Response
Monitor, Review and learning
STEP 4
STEP 5
Deciding Monitoring the risks on the risk mitigation and controls, learning actions. for future.
Annual Risk Repor ng
STEP 6 Overview of and reporting on top risks.
Illustration 3 G2 Ocean’s risk management process
Effective risk management is a critical component of our corporate governance. For G2 Ocean, the identification and mitigation of risks is essential to maintaining operational stability and supporting long-term growth objectives.
processes and procedures. This includes continuous monitoring, assessment, and management of risks, as well as the implementation of appropriate mitigation strategies to reduce exposure to these risks.
Some of the key company risks in 2025 are summarised in the section below. These risks could have had a material adverse effect separately, or in combination, on our financial performance. At G2 Ocean, we address and manage these risks according to our risk management
In addition to robust risk management procedures, G2 Ocean has a Directors and Officers Insurance providing financial protection to the Board of Directors and the CEO, covering losses, defence costs, and company reimbursement up to a specified limit.
Directors and Officers Liability Insurance
Table 1 Top Risks in 2025 Classification of Risk
Description of risk
Impact
Mitigation actions in place
Commercial
Increased competition and market capacity
Lower freight rates; potential business loss
Market monitoring, contract management, business diversification
Commercial
Limited trading flexibility due to fleet profile
Restricted business opportunities
Fleet renewal and chartering in vessels from the market
Operations
Vessel maintenance
Cargo damage, safety risks, reduced operational efficiency
Collaboration with pool participants, enhanced maintenance routines
Operations
Port performance
Higher costs, reduced fleet capacity, missed deadlines, reduced customer satisfaction
Strategic partnerships with key ports
Health & Safety
Stevedore safety incidents
Serious injuries or loss of life; financial and reputational loss
Safety procedures, Safety Management System, training and awareness campaigns, proactive risk management, industry collaboration initiatives, Safety bulletins
Health & Safety
Ship crew safety incidents
Serious injuries or loss of life; financial and reputational loss
Safety procedures, Safety Management System, training and awareness campaigns, proactive risk management, industry collaboration initiatives, Safety bulletins
Geopolitical/ Macroeconomic
Exposure to geopolitical events
Reduced rates, trade restrictions, new business opportunities as trade routes change
Continued monitoring, scenario planning, contingency plans, strategic flexibility planning
Information Security
Malware or cyber-attack on critical systems
Financial loss, business disruption, reputational and legal risks
Antimalware, continuous monitoring and 24/7 incident response capabilities, segmentation of networks, advanced detection and prevention tools, incident response plan, access controls, awareness and training campaigns
17
18
Management Report
Sustainability statements 20
General information
86
20
Reporting practices
22
Our sustainability strategy and approach
24
Governance
30
Impacts, risks and opportunities management
40
Climate change
54
EU taxonomy
64
Pollution of air
66
87
Business conduct
Appendix 1 96 ESRS Index 96
Environment information
41
Governance information
98
EU legislation
Statement from the Board of Directors and the CEO 105
Independent Sustainability Auditor's Limited Assurance Report 106
Social information
68
Own workforce
81
Workers in the value chain
19
Management report Sustainability statements
GENERAL INFORMATION This sustainability statement outlines G2 Ocean’s value chain, the significant impacts, risks, and
20
Reporting practices
22
Our sustainability strategy and approach
24
ESG Governance
30
Impacts, risks and opportunities management
opportunities related to our business activities and those occurring throughout our value chain. It also details our strategic approach and governance framework for managing these factors, as well as our performance in key sustainability areas.
Reporting practices Exclusions and use of phase-in provisions
The Sustainability Statement for the 2025 fiscal year, covering the period 1 January 2025 to 31 December 2025, has been prepared in accordance with the requirements of the Norwegian Accounting Act and the European Sustainability Reporting Standards (ESRS). Although G2 Ocean is not legally required to follow the ESRS standards, the Company has chosen to adopt them voluntarily to meet stakeholder expectations by providing standardised, high-quality and audited reporting on sustainability information. In addition, this Statement fulfils the required reporting obligations under the EU Taxonomy Regulation.
We have opted for phase-in option on details related to work-related ill-health (ESRS S1-14, paragraph 88), as well as anticipated financial effects on climate change (E1-9). Furthermore, as ESRS Sectors are yet to be defined, ESRS 2 par. 40 (b) and (c) are also not disclosed.
Estimation The metrics in this Statement are based on actual data where available, with some figures estimated due to limited information. Metrics with significant uncertainty are listed below; these estimates use the best current methods but remain subject to measurement uncertainty. Therefore, the level of accuracy is expressed qualitatively by describing the source of uncertainty—not as a confidence interval for the estimated figures.
Scope of reporting The Sustainability Statement has been prepared on a consolidated basis aligned with the financial statements for the reporting period. This includes activities conducted within our own operations, as well as those throughout the upstream and downstream value chain. For this report, “own operations” generally refers to entities included in the consolidated financial statements. Specifically, in the climate change chapter, “own operations” also extends to vessels under our operational control during voyages, as referenced in ESRS E1, paragraph 50b
We continue to improve data accuracy as possible by implementing a new system for reporting Scope 1 emissions, refining categorisation, applying updated conversion factors, and internal controls, including data owner responsibilities, quarterly internal reviews and reporting. See the section ‘Internal controls over sustainability reporting’ for more information on our efforts to improve data accuracy and quality.
G2 Ocean has completed a double materiality assessment to determine the sustainability topics of greatest significance to the Company and its stakeholders. The findings from this assessment have defined the selection of material topics that form the basis of the reported information within this Statement. Our reporting is structured across short, - medium, -, and long-term time horizons, consistent with the approach outlined in ESRS 1, section 6.4.
Forward-looking statements reflect current information but are inherently uncertain and may be affected by factors outside G2 Ocean’s control. Assumptions about estimation uncertainties are detailed in the ‘Climate change’ chapter.
20
MANAGEMENT REPORT
Introduction
About G2 Ocean
Sustainability statements
General information
Environment
Social
Financial statements Governance
Appendix
Table 2 Sources of estimation and outcome uncertainty Disclosure requirements (reference)
Measurement
Source of uncertainty
Page
GHG emission from purchased goods and services
CO2e
Availability of data, categorisation, conversion factor
53
GHG emission from upstream transportation and distribution
CO2e
Type of vessel and fuel, conversion factor
53
Illustration 12: Expected efficiency gains from decarbonisation levers
AER
Uncertainty with regards to operational levers and expected AER reduction
52
Energy consumption Scope 2
CO2e
Estimate on energy used in office space
52
Restatements We have made no adjustments in comparative figures for metrics that were also disclosed in our 2024 report.
Other reporting This Statement also includes required disclosures related to the EU Taxonomy regulation as specified in the section ‘EU Taxonomy Reporting’. For a list of disclosure requirements and related datapoints referenced from other EU laws, refer to Appendix 1 of the Sustainability Statement. 21
Management report Sustainability statements
Our sustainability strategy and approach
Sustainability in our corporate strategy
Building upon our commitment to integrate sustainability into our business, we have developed a sustainability strategy as an extension of our corporate strategy. It is organised around three core pillars:
G2 Ocean’s corporate strategy is guided by its vision of pioneering sustainable shipping solutions. This vision influences our strategic direction, ensuring that sustainability is an integral part of our business.
• Environmental protection (dark green) • Social responsibility (turquoise)
Our corporate strategy is structured around five key areas, placing the customer at the core of all our activities, as shown in Illustration 4. Through our strategy, we are committed to continuously improve customer service, expand our business, drive innovation and digitalisation, foster a high-performance culture, and take environmental action. Through these efforts, sustainability plays an integral role, as illustrated by the inner circle of our corporate strategy.
• Governance excellence (orange) Within these three pillars, we have identified five focus areas. Each focus area is supported by a clear ambition, specific targets, measurable KPIs, and detailed action plans designed to effectively manage our material impacts, risks and opportunities, as described in tables 5 and 6. This structured approach ensures that our sustainability commitment is translated into actions and measurable results, strengthening the link between our corporate strategy and day-to-day operations.
Illustration 4
Sustainability strategy, extension of the corporate strategy
RO
He
rp or
Take Environmental Action
at eC
tu
ul
Build Performance Culture
re
Reduce carbon intensity while growing the business
C li m a t e C h a n g e
22
Be an industry leader in safety
a lt h
N
VI
Co
EN
Pioneering Sustainable Shipping Solutions
ry -
CI
AL
Ensure a corruptionfree business
ri be
M
EN
T
C or r up ti o n a n d b
SO
Customer in focus
D
ive Ensure all employees grow in a gender-balanced, equal and inclusive organisation
af e t y
Innovate and Digitalise
responsible and sustainable supply chain
Training an d skil ls de velo pm en t-
and S
Ma nag em en to fr
VERNANCE GO
Grow Our Business
pliers sup ith sw p i h ns tio la Achieve a
y alit qu de an ty rsi
e
Corporate and sustainability strategy Corporate Strategy
MANAGEMENT REPORT
Introduction
About G2 Ocean
Sustainability statements
General information
Environment
Social
Financial statements Governance
Appendix
Climate-related resilience structures Climate change introduces a complex set of evolving risks and opportunities for G2 Ocean. To address these, G2 Ocean has put in place structures and processes that specifically focus on climate-related resilience. We continuously assess climate-related risks emerging from our Double Materiality Assessment, reviewing and reporting them quarterly to ensure timely identification and effective mitigation actions.
As part of our sustainability strategy, we are working closely with our customers and partners to develop and implement solutions that reduce emissions, uphold safe and responsible business practices, and support sustainable development. More information about these efforts can be found in the topical standard chapters of this report. Strategy development G2 Ocean conducts an annual review of its sustainability strategy. This follows a process that begins with reviewing and updating our Double Materiality Assessment to ensure we focus on the topics of highest significance to our business. Building on the findings of this assessment, objectives are reviewed, updated and added through a collaborative process involving key stakeholders from relevant departments. These objectives are designed to address material environmental, social, and governance impacts, risks and opportunities. Associated KPIs and action plans are developed to support the achievement of these objectives. Once finalised, the revised strategy is reviewed by the Leadership Team before being presented to the Board of Directors for review and approval.
In anticipation of stricter environmental regulations, such as the IMO Net-Zero Framework, we have developed a strategy centered on reducing emissions, securing alternative fuels, and investing in new environmentally advanced vessels. A key element of this strategy is the planned introduction of ten new alternative-fuel capable vessels between 2026 and 2029. Also, in the coming years, we will prioritise building partnerships with ports and fuel suppliers to secure a stable long-term supply of alternative fuels. While no material physical climate risks have been identified to date, we remain vigilant, recognising that adverse weather events—such as those affecting the Panama Canal—can present operational challenges. To address these risks, our fleet renewal strategy focuses on acquiring vessels with enhanced resilience against severe offshore weather, and we continue to adapt our operations to minimise disruptions at ports. Although a comprehensive climate risk assessment aligned with the ESRS, including scenario analysis, has not yet been completed, we are planning to complete this in the future to further strengthen our resilience planning.
Business resilience While we have not yet completed a formal resilience analysis aligned with the ESRS, G2 Ocean’s business model and strategy is considered resilient, effectively managing its material impacts, risks, and opportunities. We have an effective ESG governance framework that provides clear oversight and management of material impacts, risks and opportunities. This framework is further supported by established processes, procedures, policies, and action plans that enable systematic management to material topics such as climate change, health and safety, and prevention of corruption and bribery. We have a proactive approach to risk management, regularly identifying, monitoring, and mitigating risks through risk review processes and implementation of actions. Together, these structures empower G2 Ocean to manage impacts, risks and opportunities across short, medium and long-term horizons and to adapt as our operating environment changes.
For additional information, refer to the section ‘Impacts, Risks, Opportunities Management’. Related action plans can be found in the topical standard chapters of this report.
23
Management report Sustainability statements
ESG Governance
Board composition
Gearbulk since 2017 and is a member of Gearbulk’s audit committee. He has been an employee of MOL since 1985 and has worked in various areas including Bulk Carrier Division in both the Tokyo and London Office. He has also taken the role as General Manager of Finance Division in Tokyo. He was appointed Senior Managing Executive Officer of MOL in charge of Europe and African Region in 2023. He was born in 1963 and is a Japanese citizen and resides in Japan.
Table 3 Board composition
Board Members
5
Executive Board Members
0
Non-executive Board members
5
Male
3
Female
2
Female to male ratio
40%
Independent executive Board Members (%)
0%
• Yutaka Arakawa (Board Member) – Yutaka Arakawa was appointed to the Board in 2025. He has been employed by MOL since 1999, following the merger with his previous company. Since then, he has gained extensive experience working across various liquid cargo sectors, holding positions in the Tokyo, Singapore, and London offices. He was born in 1971 and is a Japanese citizen and resides in the United Kingdom. • Matt Duke (Deputy Board Member) - Matt Duke was appointed to the Board of G2 Ocean in 2021 and since January 2025 he has served as a deputy member of the Board of Directors. He is the Group CEO of Grieg Maritime Group and is Chair of the Board in several of the companies within the Grieg Group and is chair of the Board of the Bergen Shipowners association. He was born in 1975 and is a United Kingdom citizen and resides in Norway.
The Board of Directors (Board) at G2 Ocean is composed of a diverse group of experienced professionals with backgrounds in shipping, maritime law, finance, and business leadership. The Board consists of five core members and two deputy members, representing a range of nationalities and expertise. The members bring broad industry knowledge and international perspective to the governance G2 Ocean. Their collective experience supports the oversight and strategic direction for our operations and sustainability initiatives. G2 Ocean does not have any direct representatives of employees or other workers in the Board.
• Hans Olav Lindal (Deputy Board Member) - Hans Olav Lindal was appointed to the Board in 2017 and since January 2025 he has served as a deputy member of the Board of Directors. He has been a partner in the Norwegian based law firm Thommessen AS since 1993 until end of 2024. He serves as a non-executive director at the Board of several companies predominantly in the maritime sector. He is currently a Board Member at Gearbulk and the CEO of Gearbulk Shipowning AS. He was the President of the Norwegian Shipowners’ Association and was a Board Member of International Chamber of Shipping (ICS) until 2018. Lindal was born in 1962 and is a Norwegian citizen who resides in Norway.
The Board comprises: • Kristian Jebsen (Chair) - Kristian Jebsen is the Chair of the Board. He was appointed to the Board in 2017. Jebsen is the CEO, Chairman and one of the owners of Gearbulk. Jebsen was born in 1954. He resides in Singapore and is a Swiss national. • Camilla Grieg (Vice Chair) - Camilla Grieg was appointed to the Board in 2017. She is Chair of the Board at Grieg Maritime Group and has many years of experience in shipping and the maritime industry. She is also on the Board of a number of the companies within the Grieg Group and leader of the Election Committee at DNB. She was born in 1964 and is a Norwegian citizen and resides in Norway.
G2 Ocean’s ESG Governance structure G2 Ocean has established an ESG governance structure to ensure effective oversight and management of its sustainability efforts. This structure, as shown in Illustration 5, establishes clear roles and responsibilities across various organisational levels, facilitating the integration of ESG considerations into strategic decision-making and daily operations.
• Mariann Revheim (Board Member) – Mariann Revheim was appointed to the Board in 2024. She has been with Grieg Maritime Group since 2017 as VP Legal and Compliance. She was born in 1967 and is a Norwegian citizen and resides in Norway.
The responsibilities and mandates of the bodies involved in this structure have been formally approved by the Board. Furthermore, the representatives have been selected for their responsibility and expertise in material sustainability topics, strategy development and implementation, reporting, risk management, and data management,
• Toshinobu Shinoda (Board Member) – Toshinobu Shinoda was appointed to the Board in 2025. He has served on the Board of 24
MANAGEMENT REPORT
Introduction
About G2 Ocean
Sustainability statements
General information
Environment
Social
Financial statements Governance
Appendix
thereby ensuring effective governance. The following outlines the key components of our ESG governance framework and the responsibilities of the respective roles.
and progress reports to the Board and receives quarterly updates on the progress related to G2 Ocean’s sustainability strategy from G2 Ocean’s ESG Steering Committee.
Board of directors The Board oversees G2 Ocean’s overall management, including the management and progress related to our sustainability strategy. This includes overseeing the assessment and management of sustainability-related impacts, risks, and opportunities. They review and approve G2 Ocean’s double materiality assessment and sustainability strategy, including targets, KPIs and action plans, as part of the annual strategy review process. Furthermore, the Board receives regular updates on progress, challenges, and achievements regarding sustainability, providing guidance and intervention when necessary. Their reporting duties include approving annual reports, such as the Sustainability Statement, and ensuring that all reporting meets regulatory and stakeholder requirements. Board members also review and approve sustainability-related policies, ensuring these are aligned with legal requirements, regulatory standards, and best practices.
ESG Steering Committee The ESG Steering Committee (Committee) is responsible for executing the double materiality assessment, and conducting regular reviews of impacts, risks, and opportunities. They integrate the management of these factors into the sustainability strategy, developing objectives, KPIs, and action plans together with the ESG Team, and guides them in their implementation. The Committee monitors and assesses sustainability performance, advocates for necessary resources, and fosters engagement throughout the organisation. The Committee manages quarterly reporting on G2 Ocean’s sustainability strategy, including internal review and quality assurance, reporting on progress to the LT. Policy oversight and contribution to the development and implementation of procedures for material topics also fall under the responsibilities of the Committee. Business and ESG manager The Business and ESG Control Manager coordinates and oversees the quarterly internal control and assurance processes related to sustainability. This role works closely with the ESG team to identify potential gaps or inconsistencies in reporting, implementing corrective actions as needed. The Business and ESG Control Manager is responsible for preparing consolidated reports for submission to the Committee, ensuring accurate and reliable sustainability reporting.
Leadership Team G2 Ocean’s Leadership Team (LT) plays a key role in shaping and executing the sustainability strategy. They provide input to the strategy development process and propose the sustainability strategy to the Board, supervise its execution, and actively endorse it, dedicating necessary resources for successful delivery. The LT ensures the operational alignment with Board-approved policies and oversees the implementation of these. Additionally, the LT provides updates 25
Management report Sustainability statements
ESG Team The ESG Team is made up of specialists who are experts in their respective material areas. They are responsible for identifying, assessing, and managing sustainability-related impacts, risks, and opportunities for their specific areas. For their respective material topics, they set objectives, define KPIs, and implement action plans, while monitoring performance and reporting quarterly on progress to the Committee. Additionally, the ESG team develops policies related to their material topics.
ESG reporting framework and information flow To ensure alignment and progress on sustainability matters across all levels, G2 Ocean has established a defined reporting framework for our ESG efforts, as shown in Illustration 5. It has a bottom-up approach, supporting effective oversight and decision-making. It begins with the ESG Team who monitor performance and provide quarterly progress reports on objectives, key performance indicators (KPIs) and action plans within their designated areas. Following quality assurance by
Illustration 5 ESG Governance structure
Board of Directors Approves sustainability strategy as part of annual strategy review
Annual reporting (Annual Strategy Meeting) and when relevant (Board meetings)
Leadership Team Proposes and oversees implementation of sustainability strategy
Quarterly reporting (Strategic Actions Meeting)
ESG Steering Committee Strategy
ESG and Communications (lead)
Finance
Facilitates sustainability strategy and oversight, guides and enables material topic owners. Quarterly reporting
Internal control and quality assurance Quarterly review
ESG Team
Business and ESG Control Manager
ENVIRONMENT
SOCIAL
GOVERNANCE
ESG topic
Owner
ESG Category
Owner
ESG Category
Owner
Climate Change
Decarbonisation
Health and Safety
HSEQ
Supplier management
Procurement
Pollution to air
Decarbonisation
Training and Education
HR
Corruption and Bribery
Compliance
EU Taxonomy
Accounting
Diversity and Equality
HR
Corporate culture (business ethics, governance)
Compliance
26
MANAGEMENT REPORT
Introduction
our Business and ESG Control Manager, these reports are submitted to the Committee for review and validation. The Committee consolidates the findings and reports to the LT during quarterly Strategic Actions Meetings. This enables G2 Ocean to maintain oversight on the implementation and progress of our sustainability strategy, as well as implement improvements when required. As G2 Ocean advances in its sustainability efforts, we aim to not only assess and discuss performance at each quarterly meeting, but also its impacts, risks, and opportunities. At the highest level, the Board is kept informed with annual sustainability updates—typically at the September Strategy Meeting—alongside additional reports as required. The Board reviews and approves the double materiality assessment, considers impacts, risks, and opportunities, and receives progress reports on sustainability strategies and regulatory developments, as well as biannual updates on the organisation’s risk landscape.
About G2 Ocean
Sustainability statements
General information
Environment
Social
Financial statements Governance
Appendix
G2 Ocean has appointed an Business and ESG Control Manager. The Business and ESG Control Manager's role is central to improving data quality and reporting processes, providing guidance to the ESG Team on accurate reporting. As part of this initiative, the Business and ESG Control Manager oversees quarterly internal reviews and quality assurance procedures. These reviews include a thorough examination of documentation and reporting routines, assessment of data quality and data flow, evaluation of internal control procedures, and the implementation of additional audit steps where necessary. The process, as further described in Illustration 6, is designed to identify potential sources of error, ensure consistency in data collection, and confirm accuracy in reporting on G2 Ocean’s sustainability goals and ESRS disclosure requirements. Since engaging the Business and ESG Control Manager, G2 Ocean has observed improvements in both the quality and efficiency of sustainability reporting. Enhanced internal controls, regular quality assurance and continuous support and guidance to the ESG Team have contributed to reduced human errors and better data control. G2 Ocean remains committed to further improving data quality and control in its sustainability reporting.
Sustainability-related performance in incentive schemes G2 Ocean has not integrated sustainability-related performance in incentive schemes.
Internal controls over sustainability reporting G2 Ocean recognises that there are inherent risks of reporting errors in sustainability disclosures, particularly due to the complexity of consolidating data across multiple sources. To address these risks and strengthen the accuracy and reliability of our sustainability reporting,
Illustration 6 G2 Ocean’s Sustainability Reporting Risk Framework
STEP 1 Identification of risks
STEP 2
1
Assessments are conducted to identify potential risks that could impact our sustainability reporting, i.e. data quality, data flow, documentation routines, sufficient quality checks and control mechanisms.
2
Identified risk is evaluated and assessed regarding the potential impact on our sustainability objectives and reporting accuracy. Main risks are assessed to be related to data quality and data flow.
3
Implement targeted strategies to mitigate identified risks, including training for staff, enhancing data collection processes and performing additional analysis and procedures.
Risk assessment
STEP 3 Mitigation strategies
27
Management report Sustainability statements
Illustration 7
G2 Ocean’s Value Chain
INPUT Cargo Cargo owners extract or process raw materials for shipment to global markets.
UPSTREAM VALUE CHAIN
Vessel supply
Port services
Transshipment (cargo transfer)
Vessel supply from the market and pool participants, including shipbuilding.
Port services, including pilotage, towage, berthing, and cargo handling services such as loading, discharging, storage, warehousing, bunkering, and logistics management.
Delivery of goods to G2 Ocean at an intermediate port, where they are transferred from incoming vessels onto G2 Ocean’s ships for onward transportation to the next destination.
OWN OPERATIONS
Own workforce G2 Ocean employs a diverse team of professionals across 15 international locations. Our people are the driving force behind our global operations, ensuring seamless coordination and exceptional service delivery at every stage of the shipping process.
Customer Relations
Voyage
Business
Management
Management
Developing and maintaining strong partnership with customers and securing growth through new business opportunities.
Planning and managing voyages and fleet to ensure safe and reliable shipments from customer booking to delivery.
28
Equipment
Support
Management
Support all business and operational activities, from finance and administration to compliance and IT, driving continuous improvement and business resilience.
Developing equipment specifically for our cargo operations and maintaining it to the highest standards.
MANAGEMENT REPORT
Introduction
About G2 Ocean
Sustainability statements
General information
Environment
Social
Financial statements Governance
OUTPUT Safe, efficient and reliable cargo transportation
Job creation
Safe, timely, and efficient delivery of cargo to its intended destination, fulfilling customer and regulatory requirements.
G2 Ocean’s operations contribute to job creation by supporting employment opportunities both directly within the Company and indirectly through our work with customers and suppliers, whose own teams support our operations. This contributes to fostering economic growth in the communities where we operate.
Economic infrastructure and global trade facilitation
Value creation to shareholders and society
By transporting goods worldwide, G2 Ocean contributes to strengthening the global economic infrastructure. Our services contribute to connecting economies and ensuring the reliable supply of essential goods across industries and borders.
G2 Ocean creates value to its shareholders by delivering profitable cargo transportation services. Shareholder profits are distributed through dividends known as pool distribution. Additionally, G2 Ocean contributes to society by facilitating global trade, supporting local economies via tax payments, and promoting responsible business practices.
DOWNSTREAM VALUE CHAIN
Transhipment (cargo transfer) Upon arrival at an intermediate port, goods are transferred from G2 Ocean’s vessels onto other carriers or onward transport modes, facilitating their continued journey towards final delivery points.
Ship recycling
Cargo Management Supervision
Overseeing the handling, loading, and unloading of cargo, maintaining strict quality and safety protocols.
When vessels come to the end of their operational life, ship owners typically send them to specialised, certified facilities for recycling.
29
Cargo processing and consumption End users receive and utilise their goods.
Appendix
Management report Sustainability statements
Impacts, risks and opportunities management
Our process to identify and assess material impacts, risks and opportunities G2 Ocean uses a double materiality assessment (DMA) to identify, prioritise, and manage sustainability impacts, risks, and opportunities across its value chain. Our value chain is detailed in Illustration 7 and includes upstream activities such as raw material extraction and processing, the Company’s own operations including transportation, as well as downstream activities involving re-processing, usage, and disposal of products.
ensuring that key sustainability topics are systematically addressed.
The DMA is conducted in alignment with the ESRS and is an important component of G2 Ocean’s sustainability management and reporting,
DMA Review G2 Ocean reviews the DMA every year to keep it up to date with
The assessment is based on a structured process described in Illustration 8. Internal control is maintained through review by the ESG Steering Committee before progressing to the next step. G2 Ocean’s risk management processes are aligned with the double materiality assessment to ensure regular monitoring and appropriate integration into overall company risk management tools.
Illustration 8 G2 Ocean's Double Materiality Assessment (DMA) Process
STEP 1
1
Mapping the Value Chain
All value chain activities, including own operations, upstream, and downstream, are systematically reviewed and documented. Relevant stakeholders are identified and categorised.
INTERNAL CONTROL
STEP 2 Identification of Impacts, Risks, and Opportunities (IROs)
2
IROs are identified by examining our own operations and value chain using data analysis, insight and information gathered from various sources, including stakeholder input, as well as reference to high-risk areas along the value chain. All potential, actual, direct, and indirect impacts on people and the environment are considered.
INTERNAL CONTROL
STEP 3 Evaluation and Prioritisation
3
Each IRO is evaluated and prioritised according to its relevance and significance to G2 Ocean, following ESRS 1 criteria for impact and financial materiality. A threshold at 4 on a 1-5 scale is set to distinguish material from non-material topics. Topics at this value and higher are considered sufficiently material to require focused strategic attention with objectives, KPIs, and targeted action plans to address them. Topics that are close to being material, but have not yet crossed the threshold, are monitored, though they do not receive the same level of strategic attention.
INTERNAL CONTROL
STEP 4 Alignment, Integration and Monitoring
4
DMA results are anchored with the Leadership Team and Board. The outcomes from the DMA serve as a foundation for the development of the Company’s strategy, including objectives, KPIs and actions to manage material impacts, risks and opportunities. Results from the risk assessment are incorporated into the corporate risk register. The assessment is monitored and updated in response to changes in the business environment. Status and progress are reported to the Leadership Team and Board.
30
MANAGEMENT REPORT
Introduction
About G2 Ocean
Sustainability statements
General information
Environment
Social
Financial statements Governance
Appendix
• inclusion of new regulatory requirements and technologies. • integration of updated stakeholder insights. • removal of duplicate entries.
changes in the Company's operating environment. The IROs are monitored throughout the reporting period and until the report issuing date, and reviewed in detail once a year. Any material impacts, risks or opportunities arising in the interim period are also considered as part of this ongoing monitoring process. The latest review followed the previously mentioned assessment process and was completed in September 2025.
The number of material topics remains at seven, consistent with 2024, but there have been shifts in topic significance and focus due to adjustments in ratings and the addition of new or removal of original IROs. The topic ‘Pollution of air’ was upgraded from non-material to material status for 2025 due to the environmental impact of NOx and SOx emissions from our vessels. Conversely, ‘Diversity and equality’ has shifted from material to non-material, following strengthened gender balance within our chartering and commercial department.
Changes to the DMA The 2025 DMA review resulted in several updates to the assessment, resulting from enhanced internal expertise related to identifying and assessing IROs, improved access to data, changes to G2 Ocean’s business environment, and new insight received from various sources, including stakeholder input. As a result, the assessment process benefited from more accurate scoring and topic identification. Updates in our regulatory environment, new industry trends, and incident data also contributed to the reassessment of material topics. As a result, the 2025 review provides a more robust, evidence-based, and stakeholder-informed understanding of G2 Ocean’s most significant sustainability issues.
Illustration 9 summarises our material topics from the 2025 DMA Review, with material IROs detailed in tables 4 and 5. These topics guided our sustainability initiatives this reporting period. All material topics and associated IROs have been reviewed and approved by the Board and Leadership team. It should be noted that, since G2 Ocean neither owns vessels nor has responsibility for capital investments related to them, it is not expected that material adjustments to assets or liabilities will be made in the forthcoming annual reporting period due to the identified risks.
Key changes to the DMA include: • refined value chain as a result of enhanced insight into the underlying activities. • reclassification of certain impacts previously categorised as risk mitigation actions. • re-evaluation of topics that may have been misvalued in 2024.
Our material topics Material topics are defined as those that receive a score of 4 or higher on the 1-5 scale.
Illustration 9 Our material topics
Material Topics
5 1
7
2
4
4
3
Impact (po sitive o r negative)
9 16
11 10
12
3
14
Social: 3. Health and safety (own workforce and workers in the value chain) 4. Training and skills development (own workforce and workers in the value chain)
5
13 19
3,5
Environmental: 1. Climate change (mitigation and adaptation) 2. Pollution of air (NoX and SoX) Material in 2025
8
4,5
5. Diversity and equality (own workforce) Non-material in 2025
6
17
18
Governance: 6. Management of relationships with suppliers 7. Corruption and bribery 8. Corporate culture (business conduct)
15
2,5
2
Non-material topics (scores over 2.5)
1,5
NEW
Environmental: 9. Direct impact drivers of biodiversity loss (invasive alien species) 10. Circular economy 11. Impacts on the extent and condition of ecosystems 12. Pollution of soil 13. Impacts on the state of species (water and marine resources)
NEW
Social 14. Working time 15. Privacy 16. Work-life balance (workers in the value chain and own workforce) 17. Forced labour (workers in the value chain ) 18. Child labour (workers in the value chain ) 19. Violence and harassment in the workplace (value chain workers)
1
0,5
0,5
1
1,5
2
2,5
3
3,5
4
4,5
5
Financial (risks and opportunities)
Movement in ratings of impacts, risks and opportunities from 2024 to 2025:
31
no change
increase
decrease
Management report Sustainability statements
Location
Table 4
Medium-term
Long-term
Sustainability topic
Type of impact
Climate change adaption
Actual negative impact
•
•
•
Actual negative impact
•
•
•
Actual negative impact
•
•
•
•
Potential negative impact
•
•
•
•
Potential positive impact
•
•
•
•
Potential negative impact
•
•
•
•
Actual positive impact
•
•
•
•
Potential negative impact
•
•
•
•
G2 Ocean's vessel operations contribute to GHG emissions.
Climate change adaption The products and services purchased by G2 Ocean release GHG emissions through its production (i.e. equipment) or when in use (i.e. tugs)
Pollution of air G2 Ocean's vessel operations contribute to NOx and Sox emissions, negatively impacting air quality in areas we trade. (NEW)
Own workforce: Health and safety Cargo operations may lead to life impacting (high consequence) injuries for employees involved.
Own workforce: Training and skills developments G2 Ocean's focus on training and skill development can lead to safe practices and business continuity for the Company.
Workers in the value chain: Health and safety Cargo operations may lead to life impacting (high consequence) injuries for suppliers involved.
Corporate culture G2 Ocean's robust corporate governance practices fosters environmental accountability, inclusivity, equity and ethical labour practices.
Corruption and bribery G2 Ocean’s commercial activities may lead to corruption and bribery.
Current financial effects of material risks and opportunities
Upstream
Short-term
Material Impacts
Own operations
Time horizon
• •
Effects of material impacts, risks and opportunities on G2 Ocean’s business model, value chain, strategy, and decision-making
G2 Ocean has evaluated the current financial effects of its material risks and opportunities, particularly those with a short-term time horizon as outlined in Table 5, since they are relevant at present.
G2 Ocean’s material impacts, risks, and opportunities, as outlined in tables 5 and 6, have the potential to impact the Company’s operational resilience and long-term competitiveness. To address these factors effectively, we have established a robust ESG Governance structure, further detailed in ‘G2 Ocean’s ESG Governance structure’. This includes formal oversight at board, leadership, and management levels, supported by a cross-functional ESG Team with clearly defined roles and responsibilities.
These have been assessed to have a high potential impact on the Company’s financial performance, either by increasing costs (risks) or reducing costs (opportunities). The level of financial significance related to these risks and opportunities is further detailed in Illustration 10, where the relevant sustainability topics are presented. Furthermore, as G2 Ocean does not own any vessels and is not responsible for capital investments in them, there are no planned sources of funding for such investments. Consequently, the Company does not anticipate any material adjustments to the carrying amounts of assets or liabilities within the next annual reporting period arising from the identified risks and opportunities.
To ensure ongoing monitoring, transparency, and open communication regarding performance and progress, we have also introduced quarterly ESG reporting. This systematic approach enables us to quickly identify emerging risks and opportunities and respond proactively to them.
32
MANAGEMENT REPORT
About G2 Ocean
Sustainability statements
General information
Environment
Social
Financial statements Governance
Time horizon
Location
Risk or opportunity
Climate change mitigation
Opportunity
Newbuilds with option to use low- or zero-emission fuels can in the future create new business opportunities for G2 Ocean. (NEW)
Climate change mitigation
Opportunity
Using more biofuel and maximising fuel efficiency measures reduces both carbon emission and regulatory costs for G2 Ocean and its customers. (NEW)
Climate change adaptation
Risk
Selecting suppliers with strong environmental performance, such as low CO2 emissions, may increase G2 Ocean's procurement costs.
Climate change adaptation
•
•
•
•
Downstream
Upstream
•
•
Risk
•
•
•
•
•
•
•
•
•
•
•
•
•
•
•
•
•
•
•
•
•
Risk
Risk
Risk
Cases of corruption and bribery can result in legal disputes, financial penalties, and harm to G2 Ocean's reputation.
Management of relationship with suppliers, including payment practices
•
•
Poor technical conditions of the vessel, such as issues with cranes, the hull, or cargo holds, can increase the likelihood of incidents and may result in financial claims. (NEW)
Corruption and bribery
•
•
Poor working conditions, inadequate living arrangements, or a high frequency of safety incidents on board the vessels can result in significant business losses and harm to G2 Ocean's reputation.
Workers in the value chain: Health and safety
•
•
Obstacles in obtaining alternative fuels may hinder G2 Ocean's supply, possibly resulting in higher regulatory compliance costs. (NEW)
Workers in the value chain: Health and safety
•
Risk
Potential new environmental regulations such as the IMO Net Zero Framework may increase operating costs. (NEW)
Climate change mitigation
Long-term
Short-term Sustainability topic
Medium-term
Table 5
Material Risks and Opportunities
Appendix
Own operations
Introduction
Opportunity
Improved collaboration with suppliers creates opportunities for reducing emissions through increased port productivity and reduced time waiting for berth. It also contributes to enhancing safety performance.
In parallel, we have developed an ESG strategy which shapes G2 Ocean’s business model, decision-making, and consequently our value chain. This strategy, as described in ‘Our sustainability strategy and approach’, is supported by action plans aimed at addressing the identified material impacts, risks, and opportunities. These action plans integrate risk mitigation and opportunity maximization measures into our operational processes and initiatives, driving progress in decarbonisation, ethical business conduct, and supply chain sustainability.
•
environmental initiatives, and enhancement of service offerings. Consequently, our value chain is also directly shaped by these decisions. With our growing maturity in sustainability, G2 Ocean’s decision-making—at both strategic and operational levels—is becoming increasingly data-driven and forward-looking, informed by regular ESG reporting and scenario analysis. This not only enhances our ability to respond effectively to emerging challenges but also positions G2 Ocean to seize opportunities arising from regulatory changes, shifting market dynamics, and evolving stakeholder expectations.
As a result, G2 Ocean’s business model is evolving to embed ESG considerations across its decision-making processes—from the implementation of robust policies and procedures to supplier engagement,
We recognise that our landscape of material impacts, risks, and
33
Management report Sustainability statements
opportunities will continue to develop. We are committed to continuously improving our ESG frameworks, strategies, and action plans to adapt to these changes to ensure G2 Ocean remains resilient, responsible, and competitive in the years to come.
Short- and medium-term assessments focused on operational disruptions caused by weather events, while the long-term analysis considered the adaptability and resilience of our fleet in response to increasingly severe offshore weather conditions. However, we have not yet assessed the extent to which our business activities may be exposed and are sensitive to the identified climate-related hazards.
Topic specific processes related to the DMA This section reports on information related to the additional DMA requirements for the topic-specific chapters. Beyond the general DMA process described earlier, it covers specific methods and considerations relevant to those topics.
Our assessment identified a range of specific hazards with direct relevance to G2 Ocean’s operational routes. Prolonged drought conditions in the Panama Canal region have led to reduced water levels, restricting vessel transits and extended waiting times and voyage delays. Extreme heat events – affecting key ports in Southern Europe, the Middle East, Australia, and North America – have resulted in equipment failures and health and safety challenges for port personnel resulting in occasional labour shortages in affected ports, further disrupting our operations. Low water levels in the Mississippi River have caused schedule interruptions, and heightened typhoon and hurricane activity, alongside the increasing severity and unpredictability of tropical cyclones in both the Pacific and Atlantic Oceans, has led to port closures, rerouting of vessels, and voyage delays. These physical risks are already being observed and are expected to persist – and intensify – in the medium and long term if adverse climate conditions continue.
Climate change The identification and assessment of climate-related impacts, risks, and opportunities were completed in parallel with the 2025 DMA review. As part of this process, we assessed our business activities and strategic plans to identify both actual and potential future sources of greenhouse gas (GHG) emissions across our operations and throughout our value chain, including upstream and downstream activities. This approach enabled us to identify key emission drivers, such as fuel consumption in transportation (Scope 1), and expenditure related to bunker fuel and chartered out vessels (Scope 3). In addition to GHG emissions, we have also considered drivers for other climate-related impacts, including land-use change. For example, the extraction of raw materials by cargo owners (customers of G2 Ocean) – such as mining for coal and metals, or deforestation – was evaluated as a potential source of impact. However, based on our understanding of customer practices, these activities were not deemed material, as the affected areas are expected to be concentrated and can likely be restored.
In evaluating transitional risks, G2 Ocean has reviewed both its current operations and fleet composition, with a particular emphasis on the potential impacts of a rapid transition to a 1.5°C global warming scenario. As part of our risk identification process, we evaluated how our business activities may be exposed and sensitive to key transition events. The assessment considered the likelihood of these events occuring, the magnitude of their possible impact on our operations, and the anticipated duration of the associated risks. Specifically, our analysis focused on regulatory developments, including the EU Emissions Trading System (ETS), FuelEU Maritime, and IMO Net-Zero Framework, recognising that these measures could have significant implications for G2 Ocean’s operational and financial performance over the short,- medium,- and long term. Further, we assessed whether our assets and business activities are considered compatible with a transition to a climate neutral economy, and concluded that they are not. For further details, please refer to our EU Taxonomy Reporting.
We also assessed possible future emission sources associated with long-term strategic initiatives; however, no such sources were identified. Our evaluation of climate-related risks and opportunities was informed by the Task Force on Climate-Related Financial Disclosures (TCFD) framework, which guided our identification of both physical and transitional risks relevant to our assets and business operations. The analysis incorporated qualitative assessments under two scenarios from the Intergovernmental Panel on Climate Change (IPCC) AR6 report: a sustainable development scenario (SSP1-2.6) and a regional rivalry scenario (SSP3-7.0), each covering short-term (2026), medium-term (2030), and long-term (2050) horizons. The sustainable development scenario anticipates heightened transitional risks as the global economy shifts towards decarbonisation, while the regional rivalry scenario assumes increased physical risks due to a greater prevalence of extreme weather events. By considering both scenarios, we accounted for a broad spectrum of potential risks and uncertainties facing G2 Ocean as we navigate future strategic decisions.
Scenario modelling has been used to quantify our exposure to these transition events, indicating that compliance costs are projected to rise significantly over the coming years, with substantial increases expected by 2028 and further growth anticipated by 2035. The likelihood of such financial impact is considered possible, given the evolving status of the IMO Net-Zero Framework and ongoing regulatory developments. The duration of these transition risks is anticipated to span the medium to long term, reflecting the timeframes associated with regulatory implementation.
In assessing physical risks, we assessed our operational routes—particularly critical passages such as the Panama Canal—to evaluate the potential impacts of weather events on voyage schedules and operational resilience. This assessment drew on publicly available data specific to the shipping sector and was further strengthened by input from stakeholders, including internal expert insights from our operations team, to ensure relevance to G2 Ocean’s activities.
To reduce G2 Ocean’s exposure and sensitivity to these transition events, we have developed a strategic plan for the short,- medium,- and long- term centred on fleet renewal and operational advancement. This includes the introduction of fuel-efficient vessels designed to use alternative fuels, expanded adoption of biofuels, optimisation of fuel consumption through improved operational practices, and use
34
MANAGEMENT REPORT
Introduction
About G2 Ocean
Sustainability statements
General information
Environment
Social
Financial statements Governance
Appendix
of advanced technologies. For more information about our specific actions, please refer to the ‘Climate Change’ chapter.
intermediaries, or span multiple jurisdictions may reduce transparency and heighten exposure to unethical practices.
It should be noted that this analysis is based on qualitative data, with limited geospatial specificity, and is subject to significant uncertainty given the evolving nature of climate risks and regulatory developments. Furthermore, no direct assumptions from the climate risk assessment have been incorporated into our financial statements at this stage.
Interests and views of stakeholders G2 Ocean manages stakeholder interests by regularly engaging with those impacted by or involved in our operations. This includes among other individuals, organisations, authorities, societies, customers, suppliers, employees, and vessel owners. We connect with stakeholders and gain valuable insights into our business's impacts, risks, and opportunities by using various channels such as online or in-person meetings, employee forums, webinars, industry events, and customer surveys. Additional examples of stakeholder engagement are detailed in Table 6 and throughout the report.
Other environmental topics The IROs related to the additional environmental topics specified by the ESRS were evaluated as part of our 2025 DMA Review. The standard DMA Process was applied across topics and was not specifically tailored for each environmental area.
Stakeholder input is systematically integrated into strategic decisions via our DMAs. In 2024, we conducted targeted interviews and meetings with customers, suppliers, employees, and vessel owners to inform our DMA. For the 2025 DMA review, multiple information sources—including internal and external data, expert consultations, and insights from our vessel owners—were used instead of specific stakeholder dialogue meetings. The input received from our stakeholders informs our strategy development process. Stakeholder feedback with significant relevance is communicated to the LT and Board through our internal reporting processes.
The primary focus of the assessment was on transportation and port-related activities rather than on individual site locations, which were not screened separately during this process. With respect to air pollution and water and marine resources, no formal screening of site locations was carried out as part of our impact assessment, nor were any consultations conducted with affected communities. However, we assessed the significance of our business activities, including vessel operations and associated effects and risks, when determining potential and actual impacts on people - particularly local communities - and on the environment. Regarding biodiversity, our office locations were not considered material for determining whether they are situated in biodiversity-sensitive areas. For our vessel operations, we remain compliant with all applicable laws regulating permitted sailing locations; however, no additional detailed screening of biodiversity-sensitive sites has yet been conducted. As no material biodiversity-related risks or impacts have been identified to date, no mitigating measures have been implemented beyond those already required by law. At present, G2 Ocean has not undertaken a dedicated nature risk assessment targeting biodiversity and ecosystems. We plan to further assess its biodiversity impacts in 2026 to better understand how operations affect sensitive ecosystems and to guide necessary future mitigation efforts. Business conduct Within the context of business conduct, impacts, risks, and opportunities are identified through our DMA Process, as shown in Illustration 8. To ensure thorough identification, we apply specific criteria that focus on location, activity, industry, and the structure of transactions. Location is an important criterion, as certain geographical regions, including Peru, Saudi Arabia, and Thailand, are recognised for heightened risks such as corruption, child labour, and forced labour. In identifying IROs, we additionally consider activities that present heightened risks or substantial impacts within high-risk sectors. Lastly, our IRO identification process considers our structure of transactions to identify potential vulnerabilities, including indirect relationships with high-risk third parties or non-standard contractual terms. Transactions that are multi-layered, involve numerous
35
Management report Sustainability statements
Table 6
G2 Ocean’s key stakeholders
Description
Key Dialogue Topics
Arena for dialogue
Shareholders
G2 Ocean’s shareholders, Gearbulk and Grieg, are primary stakeholders and directly affect the Company by deciding our strategic direction and priorities.
Climate change, health and safety, gender equality and diversity and anti-bribery and corruption.
Monthly reports. Meetings.
Board of Directors
The Board of Directors are primary stakeholders. They have the overall responsibility of G2 Ocean and play a crucial role in the governance and oversight of the Company. The Board of Directors decide our strategic priorities and direction.
Climate change, health and safety, gender equality and diversity and anti-bribery and corruption.
Board of Directors meetings. Monthly reports.
Leadership Team
G2 Ocean’s Leadership Team are responsible for setting the strategic direction, endorsing the sustainability strategy.
Material sustainability topics: impacts, risks, opportunities, strategies, governance, performance, regulations, and resource requirements.
Quarterly strategic update meetings. Town hall meetings. Intranet.
Employees
Employees actively participate in sustainability programmes, driving progress towards G2 Ocean’s sustainability strategy.
Material sustainability topics: impacts, risks and opportunities, strategies, performance, regulations. Human rights issues.
Internal meetings. Intranet. Webinars. Town hall meetings. Performance review conversations. Employee engagement survey.
Customers
G2 Ocean’s customers are primary stakeholders who directly affect the Company economically, and whose expectations and needs guide G2 Ocean’s strategic priorities.
Climate change, health and safety, human rights issues, and anti-bribery and corruption.
Customer surveys. Industry events. Meetings. Dialogue/ responding to inquiries. Marketing activities. Webinars.
Suppliers
Suppliers are impacted by G2 Ocean financially and indirectly by the Company’s emphasis on responsible business practices. This includes expectations for a collective approach to delivering services safely and sustainably, as well as a commitment to upholding human rights and ethical standards.
Health and safety, climate change, anti-bribery and corruption, management of relationship with suppliers, human rights issues
Performance review meetings. Industry events. Tender processes. Dialogue/ responding to inquiries. External audits.
Banks
Banks impact G2 Ocean’s treasury activities related to cash management, payments, and availability of cash pool and credit facility to support the working capital. G2 Ocean influences the quality of services through its established compliance policies and procedures as well as through its transparent and close working relationship with the banks.
Climate change, anti-bribery and corruption and compliance.
Surveys. Industry events. Meetings. Dialogue/ responding to inquiries. Technical and administrative support service. Marketing activities
36
MANAGEMENT REPORT
Introduction
Description
About G2 Ocean
Sustainability statements
General information
Environment
Social
Financial statements Governance
Appendix
Key Dialogue Topics
Arena for dialogue
Financial Hedging Counterparts
Financial hedging counterparts’ impact on G2 Ocean’s financial risk mitigation activities is related to the provision of credit lines for hedging of bunkers, freight forward agreements, foreign currencies, and carbon tax allowances.
Climate risk.
Industry events. Meetings/dialogue responding to inquiries. Marketing activities.
Insurers
Insurers impact G2 Ocean’s risk management related to safety, security, and compliance by providing legal advice and financial coverage.
Climate risk, corruption and bribery and compliance.
Daily dialogue in the context of legal and claims issues. Bi-annual physical membership meetings.
NGOs and Industry Associations
Through its partnerships with nongovernmental organisations and industry associations, G2 Ocean directly affects and is influenced by strategies, viewpoints, and actions related to safety, diversity, equality and inclusion, security, and antibribery and corruption, among others.
Climate change, health and safety, gender equality and diversity, anti-bribery and corruption, management of relationship with suppliers and corporate culture.
Industry events. Meetings. Dialogue in the context of partnerships.
Unions
Trade unions can influence the wages and working conditions of G2 Ocean’s employees and workers in our value chain. Trade unions can also impact G2 Ocean’s operations through labour strikes.
Health and safety, and gender equality and diversity.
Meetings. Dialogue/responding to queries.
Governments and IMO
Governments and IMO, directly and indirectly, impact G2 Ocean and its operating conditions through regulations.
Regulations, climate change, anti-bribery and corruption and compliance.
Media and Industry events.
Port Authorities
Port authorities affect G2 Ocean’s operations through local regulations and port infrastructure. G2 Ocean influences the port’s finances through port fees and procedures through the Company’s focus on safety and responsible business practices.
Climate change, anti-bribery and corruption, management of relationship with suppliers and compliance.
Port site visits. Meetings.
Primary
37
Secondary
Management report Sustainability statements
Sustainability due diligence
G2 Ocean’s sustainability due diligence process is founded on the OECD Due Diligence Guidance for Responsible Business, providing a systematic and risk-based framework for identifying, assessing, and mitigating social and environmental risks across our operations and value chain.
All suppliers and customers—both existing and prospective—are subject to comprehensive screening for risks such as child labour, forced labour, human trafficking, human rights abuses, slave labour, environmental crimes, and other forms of non-compliance or sanctions, with special attention paid to high-risk regions and industries.
The procedure is risk-based, ensuring thorough evaluations where necessary, and involves the screening, assessment, and auditing of partners, focusing on those in high-risk industries and regions.
Additionally, all customers, whether new or existing, are screened through our compliance system for potential noncompliance, sanctions, and criminal activities, including but not limited to human trafficking, human rights violations, forced labour, environmental offenses, migrant smuggling, child sexual exploitation, and smuggling. Should adverse findings arise during this process, our internal compliance team will assess the associated risks. If the risk level is determined to be excessive, the customer relationship will be suspended pending further investigation.
All suppliers undergo an initial review that takes into account factors including supplier category, country risk, spend, and any recorded safety incidents. For those identified as higher risk, further scrutiny is applied, such as examining company websites and requesting self-assessments from suppliers. Should any negative findings arise and remain unresolved, they are escalated to our internal compliance team, and the relevant business relationship is suspended until adequate checks are completed.
This structured approach ensures that both actual and potential adverse impacts are detected and addressed, reinforcing our commitment to responsible business conduct and robust sustainability risk management.
38
MANAGEMENT REPORT
Introduction
About G2 Ocean
Sustainability statements
General information
Environment
Social
Financial statements Governance
Table 7 Statement on due diligence Core elements of due diligence
Paragraphs in the sustainability statement
Does the disclosure relate to people and/or the environment?
Our sustainability strategy and approach
People and the environment
ESG Governance
People and the environment
Impacts, risks and opportunity management
People and the environment
Sustainability due diligence
People and the environment
c) Identifying and assessing adverse impacts
Impacts, risks and opportunities management
People and the environment
d) Taking actions to address those adverse impacts
Climate Change; Actions
Environment
Pollution of Air
Environment
Own Workforce; Health and Safety; Actions
People
Own Workforce; Training and skills development; Actions
People
Workers in the Value Chain; Health and Safety; Actions
People and environment
Business conduct; Corporate culture and anti-bribery and corruption; Actions
People
Business conduct; Management of relationships with suppliers including payment practices; Actions
People and environment
Climate Change; Targets and Performance
Environment
Pollution of Air
Environment
Own Workforce; Health and Safety; Target and Performance
People
Own Workforce; Training and skills development; Targets and Performance
People
Workers in the Value Chain; Health and Safety; Targets and Performance
People
Business conduct; Corporate culture and anti-bribery and corruption; Targets and Performance
People
Business conduct; Management of relationships with suppliers including payment practices; Targets and Performance
People and the environment
a) Embedding due diligence in governance, strategy and business model
e) Tracking the effectiveness of these efforts and communicating
39
Appendix
Management report Sustainability statements
ENVIRONMENTAL INFORMATION This chapter presents an overview of G2 Ocean’s environmental information, highlighting the environmental impacts, risks and opportunities
41
Climate change
54
EU taxonomy
61
Pollution of air
associated with our operations and value chain activities, as well as our efforts to address these. It focuses on two major areas: climate change, addressing our greenhouse gas emissions, and pollution of air, which concerns the air pollutants resulting from our activities.
2,5%
21.2%
improvement in the carbon intensity of our
reduction in total vessel CO2 emissions
nominated fleet compared to our 2023 baseline
EMISSION SCOPES Scope 1: Direct emissions from owned or controlled sources. In G2 Ocean’s case, this refers to emissions produced by our vessels, which transport cargo for our customers and account for 72% of our total greenhouse gas emissions, making them the largest source of emissions across our value chain. Scope 2: Indirect emissions from the generation of purchased energy. For G2 Ocean, this includes electricity for our offices and equipment workshop, which make up 0.0042% of our total greenhouse gas emissions. Scope 3: Indirect greenhouse gas emissions that are not included within Scope 2, but arise throughout G2 Ocean’s value chain, both upstream and downstream. These emissions come from activities that support our operations, such as purchased goods and services, fuel- and energy-related activities, upstream transportation (relet), and emissions from downstream leased assets. During the reporting period, Scope 3 emissions made up 28% of our total greenhouse gas emissions. Relevant policies: Environmental Policy
40
MANAGEMENT REPORT
Introduction
About G2 Ocean
Sustainability statements
General information
Environment
Social
Financial statements Governance
Appendix
Climate change In the following, we provide an overview of G2 Ocean's impacts, risks, and opportunities associated with climate change, along with our strategies for managing these effectively. We outline our environmental objectives, describes the measures implemented to address climate change and facilitate the transition to sustainable shipping practices, and presents our performance in relation to established targets.
and procurement of goods and services, contribute to greenhouse gas emissions, thereby affecting the climate. Risks include new emerging environmental regulations and increased operating costs, which could impact G2 Ocean's operations and financial performance. However, opportunities exist to reduce our environmental impact through the adoption of low carbon or zero carbon fuel types, energy efficiency measures, and sustainable procurement. By effectively managing these factors, we aim to not only reduce our environmental impacts and risks but also seize opportunities for positive contribution on the environment and people and achieve sustainable growth for G2 Ocean.
Material impacts, risks and opportunities: Climate change Climate change is a material topic for G2 Ocean due to the environmental impacts, risks and opportunities associated with our shipping operations, as shown in Table 8. Our business activities, such as our vessel operations
Table 8 Material impacts, risks and opportunities: Climate Change Material matters
Scope
Description of materiality
G2 Ocean's vessel operations contribute to GHG emissions. (-)
Own operations
G2 Ocean’s vessel operations have direct emissions of greenhouse gases which use heavy fuel oil and marine gas oil, producing carbon dioxide (CO2) and methane (CH4) emissions, contribute to global GHG emissions, negatively affecting the climate.
The products and services purchased by G2 Ocean release GHG emissions through its production. (-)
Upstream value chain
G2 Ocean’s operations require resource inflows (e.g. cargo equipment or tug services), which have associated GHG emissions, negatively affecting the climate.
Transition risk – market risk and competition: Selecting suppliers with strong environmental performance, such as low CO2 emissions, may increase G2 Ocean’s procurement costs.
Own operations
Implementing climate adaptation measures may result in increased procurement costs, potentially affecting G2 Ocean’s competitiveness relative to companies that do not emphasise environmental performance within their supply chains.
Transition risk – regulatory: Potential new environmental regulations, such as the IMO Net-zero Framework, may increase operating costs.
Own operations
New environmental regulations like the IMO Net-Zero Framework could cause G2 Ocean to face considerable expenses to remain compliant.
Transition risk – supply: Obstacles in obtaining alternative fuels may hinder G2 Ocean's supply, possibly resulting in higher regulatory compliance costs.
Own operations
G2 Ocean may struggle to secure sufficient supplies of alternative fuels (e.g. biofuels) which are essential for meeting evolving environmental regulations. Such supply challenges could lead to increased operational expenses, particularly with regard to regulatory compliance, and may impact our ability to remain competitive in a market that is progressively prioritising sustainability.
Newbuilds with option to use low- or zero-emission fuels can in the future create new business opportunities for G2 Ocean.
Own operations
By renewing our fleet with new vessels designed for alternative fuels, G2 Ocean can attract new business from customers seeking to lower their supply chain emissions and stay ahead of tightening regulations.
Increasing biofuel use and improving fuel efficiency allows G2 Ocean and its customers to cut carbon emissions and reduce regulatory costs.
Own operations
Biofuels are produced from renewable organic materials, such as plants or waste, which release less net carbon dioxide when burned compared to conventional fossil fuels. As a result, using more biofuel helps reduce overall greenhouse gas emissions. In addition, certain environmental regulations, such as FuelEU Maritime, offer lower compliance costs for companies switching to cleaner fuels. Therefore, by adopting biofuels, G2 Ocean can both decrease its carbon footprint and benefit from reduced regulatory expenses.
Material impacts
1
Material risks
Material opportunities
1
(+) symbolises a positive impact whereas (-) symbolises a negative impact. 41
Management report Sustainability statements
Climate transition plan
scientific strategy is based on long-term economic and energy scenarios and reflects international expectations for emission reductions within our sector. It should also be noted that these targets are not externally assured.
G2 Ocean does not have any targets to reduce our Scope 3 emissions. As a result, we do not have a climate transition plan in line with the ESRS’ requirements and do not have a timeline for if or when we will develop such a plan. While our current targets are not aligned with the Paris Agreement, G2 Ocean is not excluded from any EU Paris-aligned Benchmarks.
Governance and reporting All targets are embedded within our sustainability strategy, which has received Board approval during our annual strategy review. Progress is reported quarterly to the Leadership Team during Strategic Actions Meetings and provided to the Board every six months. In addition, updates related to Target 1 are presented at our biannual Decarbonisation Forum, held jointly with Gearbulk and Grieg, as close collaboration is essential to achieving this target. The forum comprises senior management from G2 Ocean, Grieg, and Gearbulk. External progress reports are available upon request and included in our annual reports.
Ambition, targets and metrics Decarbonisation ambition As stated in our Sustainability Strategy, G2 Ocean’s ambition is to reduce the carbon intensity of our operations whilst continuing to grow our business, thereby contributing to the decarbonisation of maritime transportation. Targets To achieve this, we have set three primary decarbonisation targets, which addresses our Scope 1 emissions – our largest category of emissions. A summary of these targets, relevant metrics, and our progress can be found in Table 9. We have not yet set decarbonisation targets for Scope 2 and 3 emissions.
Target 1 Target 1 focuses specifically on G2 Ocean’s nominated fleet, including own voyages and those voyages related to vessels chartered out to another party (STTC-out). This target aims to reduce the carbon intensity of this fleet by 40% by 2030, compared to 2008 figures for general cargo ships. This target is in line with the IMO's greenhouse gas reduction strategy under the Carbon Intensity Indicator (CII) regulation.
Targets 1 and 2 focus on carbon intensity, while Target 3 sets an absolute goal for reducing emissions. Given our plans for future growth, intensity-based targets have been selected to align with our evolving business model, as they allow our goals to remain flexible and responsive to changes in business activity in the short and medium term.
Annual carbon intensity trajectory To ensure progress against this target, the IMO has set annual carbon intensity trajectory requirements based on data collection and scientific analysis. The baseline for these requirements was determined by gathering fuel consumption data from the global shipping fleet, which enabled the development of carbon intensity benchmarks tailored to different vessel types and sizes. A fleet average for carbon intensity was established using 2019 data, and since direct data for 2008 was not available, the improvement between 2008 and 2019 was estimated using the third and fourth IMO Greenhouse Gas (GHG) Studies. This approach ensures that the reduction trajectory is based on industry data, offering a clear benchmark for progress towards the 2030 target.
Target development and stakeholder engagement These targets are set to reduce our environmental impacts and risks, while also capitalising on opportunities arising from new green fuel types and technologies, as detailed in Table 8. In developing these targets, we involved our shareholders and pool participants, Gearbulk and Grieg, as well as internal experts on ESG, strategy and decarbonisation, our Leadership Team, and the Board. As part of this process, we considered the necessary investments required, alongside external factors such as the availability of alternative fuels and the supporting infrastructure needed for their supply, to ensure both realistic and achievable targets within our current and future operational landscape.
As shown in Illustration 10, the carbon intensity requirements for the nominated fleet are reduced annually, encouraging continuous improvements to 2030.
Baseline year G2 Ocean has chosen 2023 as the baseline year for all three targets because it provides a representative and stable reflection of our typical business activity. Unlike 2022, which experienced unusually high CO2e emissions due to a post-Covid-19-pandemic increase in demand for cargo transportation, 2023 marks a return to standard operating conditions. Additionally, from 2023 onwards, we have access to high-quality, audited vessel emission data, enabling more accurate and consistent measurement and reporting across all targets. This approach also ensures alignment and comparability among our climate targets.
KPI and progress tracking We track progress toward Target 1 using the Annual Efficiency Ratio (AER), a carbon intensity metric. Illustration 11 presents the decarbonisation levers that contribute to reducing our nominated fleet’s AER, covering both technical and operational measures, as well as fleet renewal. The illustration also shows the anticipated impact of each lever on carbon intensity reduction from 2024 to 2030, based on projected efficiency improvements. Collectively, these levers are expected to lower the nominated fleet’s carbon intensity (AER) by approximately 20% , resulting in a 18% reduction in absolute emissions for this fleet. This decline stems from the combined impact of our decarbonisation levers and an anticipated 1% reduction in overall fleet size.
Alignment with global standards and external assurance Although our current targets are not aligned with the Paris Agreement, Target 1 is consistent with the International Maritime Organization’s (IMO) strategy for reducing greenhouse gas emissions from ships. Their
For further details on the decarbonisation levers, refer to the ‘Actions’ 42
MANAGEMENT REPORT
Introduction
About G2 Ocean
Sustainability statements
General information
Environment
Social
Financial statements Governance
Appendix
Illustration 11
G2 Ocean’s projected carbon intensity and absolute emissions trajectory from 2024 to 2030 (Nominated Fleet and STTC Fleet
2500 000
7,00 6,00
2000 000
1500 000
AER
4,00 3,00
1000 000
CO2e (MT)
5,00
2,00 500 000 1,00 0,00
-
2023
2024
CO2e - nominated fleet
2025 CO2e - STTC fleet
2026
2027
2028
CO2 intensity - nominated fleet
2029
2030
CO2 intensity - STTC fleet
KPI and progress tracking We monitor progress towards Target 2 by using the metric of metric tons of CO2 equivalent per vessel day. This metric reflects the carbon intensity of our operations by comparing the total greenhouse gas emissions produced by our fleet to the number of days the vessels are actively engaged in service. To calculate this, we first determine the total CO2e emissions generated by the vessel over a given period, then divide this figure by the total number of vessel days—the days each vessel is on hire and operational within our fleet. By expressing emissions in this way, the metric provides a clear and consistent measure of how efficiently we are operating, allowing us to track improvements in operational efficiency and reductions in emissions over time.
section, while information about the AER metric can be found in the ‘Methodology’ section. STTC fleet emissions To give a complete picture of G2 Ocean’s overall emissions to 2030, it is important to consider the fleet outside the Scope of Target 1, namely the Short-term Time Charter (STTC) fleet. Our decarbonisation strategy for this fleet has not yet been developed; hence, our forecast currently assumes that the carbon intensity for these vessels will remain unchanged through to 2030, as shown in Illustration 10. In line with G2 Ocean’s growth strategy, however, absolute CO2e emissions from the STTC fleet are expected to increase by approximately 5%, as additional fleet capacity requirements will be met using STTC vessels. G2 Ocean conducts a bi-annual review of market outlook and adjusts its long-term forecast for required STTC vessel days accordingly. Compared to our 2024 Annual Report, the expected demand for required STTC vessel days has been reduced by 35%, leading to an 18% reduction in absolute emissions for the STTC fleet.
Given that emissions in shipping are significantly influenced by fluctuating market conditions and global economic activity, year-on-year results for this target may vary. Nevertheless, by closely monitoring our progress against this target, and implementing improvement initiatives, we remain confident that the 2030 objective is achievable despite this inherent volatility.
Target 2 G2 Ocean aims to improve operational efficiency by 18% by 2030 compared to our 2023 baseline of 48 tCo2e per vessel day. This target encompasses our nominated and STTC fleet, and specifically includes own voyages, STTC-in voyages, and STTC-out voyages. The target is closely interlinked with Target 1, and our approach to decarbonisation, illustrated in Illustration 11.
Target 3 G2 Ocean’s long-term climate target is to operate a zero-emission fleet by 2050. This ambitious target is aligned with the IMO’s net-zero goal and is considered technically achievable, provided there is sufficient global supply of scalable zero-emission maritime fuels.
It is worth noting that this objective was developed independently of any national, EU, or international policy directives. Rather than being underpinned by scientific studies, the target is founded on the logical correlation between enhanced voyage efficiency and reduced emissions.
Despite our commitment to reducing carbon intensity across the fleet, as outlined in Target 1 and illustrated in Illustrations 10 and 11, G2 Ocean’s total CO2e emissions are expected to rise by 2.5% by 2030. This growth is driven by anticipated commercial expansion, which in turn requires an increase in the size of our STTC fleet according to our latest long-term forecast. This highlights the inherent difficulty
43
Management report Sustainability statements
of balancing operational growth with environmental responsibility, as expanding our business and fleet can result in higher total emissions, even as we succeed in making individual vessels more efficient.
current environmental priorities, standardised governing document formats, and ESRS policy content requirements. The policy sets out G2 Ocean’s commitment to minimise environmental impacts across all business activities, with explicit commitments to reduce greenhouse gas emissions, prevent pollution, and promote the sustainable use of resources. The policy outlines a clear commitment to climate change mitigation, including the goal of operating a zero-emission fleet by 2050. Additionally, it establishes an objective to decrease the carbon intensity of our nominated fleet by 40% by 2030, compared to 2008 levels, aligning with the IMO's strategy for reducing greenhouse gas emissions from ships. Furthermore, the policy aims to enhance operational efficiency by 18% by 2030, based on 2023 metrics, directly addressing improvements in energy efficiency throughout operations. It should be noted that while the policy addresses climate change mitigation, it does not specifically mention climate change adaptation.
The target has been set in response to both industry expectations and the evolving regulatory landscape. It reflects the logical progression of our decarbonisation roadmap as shown in Illustration 11, rather than being underpinned by any single scientific study. However, it is informed by forecasts for green fuel availability and guided by G2 Ocean’s fleet development plan. Importantly, our assumptions and methodology are aligned with the IMO’s 2050 decarbonisation goal, ensuring our strategy remains consistent with global industry standards and ambitions. Key assumptions and Scope In establishing this target, several key assumptions were made to ensure both relevance and practicality. The target addresses emissions from both our nominated fleet and the STTC fleet, including own voyages, STTC-in voyages, and STTC-out voyages. This approach ensures that the Scope remains relevant as our fleet composition evolves, particularly as G2 Ocean is expected to rely more on an expanded STTC fleet to accommodate projected growth and increased demand that cannot be fulfilled by the nominated fleet alone.
Further, the policy mandates action plans for continuous monitoring, reporting, and improvement of environmental performance to adjust operations in response to climate-related risks and changing environmental conditions. It intentionally does not specify individual actions or initiatives to allow the policy to remain current and relevant without requiring frequent updates as new actions or strategies are introduced. Additionally, the policy does not make explicit reference to the deployment of renewable energy or the use of renewable energy sources within G2 Ocean’s operations. Lastly, the policy covers prevention of marine pollution, sustainable resource utilisation, and encourages stakeholder engagement for responsible environmental governance.
Methodology for emission projection The projection of absolute emissions is calculated by using historical per day CO2e emissions data for both nominated and STTC vessels, which is then multiplied by the projected total number of on-hire days. This methodology allows us to estimate future emissions based on actual operational patterns.
The policy applies to all G2 Ocean employees and covers all our operations, including owned and operated vessels, offices, and activities throughout our value chain.
To monitor progress towards the zero-emission fleet target, we use the metric of total greenhouse gas emissions in metric tons of CO2 equivalent. This measure reflects the absolute emissions generated by our nominated and STTC vessels and provides a clear indication of how close we are to achieving our long-term goal.
The ESG and Communications Director, supervised by the Chief Financial Officer, is responsible for the execution of the policy, ensuring G2 Ocean maintains its environmental commitments. The Leadership team receives quarterly updates on progress toward strategic objectives, risks, and action plans to effectively manage these. The Board is informed every six months or whenever relevant matters arise. External stakeholders receive updates on progress against policy commitments through the Company’s annual reports, ensuring transparency and accountability in environmental performance.
Key levers and collaboration Achieving this target will require improvements from all our decarbonisation levers, as illustrated in Illustration 11; however, success will primarily depend on a substantial increase in the use of alternative fuels. Additional key levers include significant investment in new technologies such as onboard carbon capture, wind propulsion, batteries, and energy storage. It is important to note that the implementation of such technologies is outside our direct investment and operational control. Instead, their progress will depend on the efforts and commitment of our pool participants, who are dedicated to reducing direct emissions and have already made substantial investments in newbuilds and advanced technologies.
G2 Ocean’s Environmental Policy is accessible to all stakeholders through our website and available to employees on our intranet.
Actions To address our climate change impacts, risks, and opportunities, we have identified key decarbonisation levers that support emission reductions across our fleet and advance progress toward our established climate targets. The decarbonisation levers fall into three categories: Fleet renewal, Operational levers, and Technical levers as shown in Illustration 11. These decarbonisation levers will serve as vital contributors to emission reductions and climate progress in the short, medium, and long term, helping us achieve our targets for 2030 and 2050.
Policies G2 Ocean’s Environmental Policy is developed to address our material environmental impacts, risks, and opportunities as specified in Table 8, and drive progress towards the Company’s climate objectives. The policy was updated in May 2025 to ensure alignment with G2 Ocean’s 44
MANAGEMENT REPORT
Introduction
About G2 Ocean
Sustainability statements
General information
Environment
Social
Financial statements Governance
Appendix
Illustration 11 Expected efficiency gains from decarbonisation levers
6
5.5
5.4
Fleet renewal
Operational levers
10%
5
6-7%
Technical levers 4-5%
Gap 5%
AER
4.2 4
3
2
1
0
2023 AER nominated fleet
2025 AER nominated fleet
Efficiency gain
Investment and financial commitment To effectively implement these decarbonisation levers, significant investment in both operational expenditures (opex) and capital expenditures (capex) is required.
Gap from target AER
2030 target core fleet AER
Expected and achieved emission reductions from decarbonisation levers If all identified decarbonisation levers are successfully implemented, G2 Ocean expects to achieve a cumulative reduction in carbon intensity of approximately 20% by 2030, compared with the average AER in 2023. This would leave a remaining gap of around 5% to meet our 2030 AER target. To address this, G2 Ocean is continuously exploring further initiatives and innovations to close the gap and reach our climate targets.
In 2025, G2 Ocean allocated USD 1.7 million towards opex for various operational levers essential to delivering Target 1, compared to an allocation of USD 1.9 million in 2024. These operational expenditures, which are reflected in the financial statements under voyage-related operating expenses, support initiatives such as efficiency improvements, optimised voyage planning, and maintenance activities that directly impact our carbon intensity reduction efforts. Looking ahead, opex is forecasted to reach approximately USD 10 million to fully realise Target 1. It is important to note that these substantial opex allocations are not fully aligned with the requirements of Commission Delegated Regulation (EU) 2021/2178. Alongside our own investments, our pool participants have also dedicated considerable financial resources through the procurement of new, more efficient vessels and the implementation of technical upgrades, which are categorised as capex. These capital investments play a critical role in enabling long-term emission reductions by modernising our fleet and adopting new technologies.
In 2025, G2 Ocean reduced its AER by approximately 2.3% from 5.5 to 5.4. This reduction was driven by a 2.0% improvement from operational levers and a 0.3% improvement from technical levers. As there were no new vessels delivered to G2 Ocean in 2025, fleet renewal did not contribute to any reduction. Fleet renewal Over the next three years, G2 Ocean will welcome ten new vessels to our fleet, invested by our shareholders and pool participants, Gearbulk and Grieg. The first of these, Star Norge, joined our fleet in January 2026, with three further deliveries planned during 2026. These newbuilds are designed for greater efficiency and environmental performance, featuring specialised technologies that optimise propeller efficiency, reducing fuel consumption and emissions. Additionally, the vessels are capable of generating more onboard electricity from their main engines, reducing reliance on auxiliary generators and further lowering fuel use and emissions. In terms of energy efficiency alone, the introduction of these vessels is projected to reduce our fleet’s carbon intensity by approximately 10% by 2030.
With respect to Targets 2 and 3, the precise breakdown of capex and opex required to achieve these goals has not yet been quantified. Nevertheless, expenditures associated with Target 1 are expected to contribute towards progress on these subsequent targets. At present, we do not have a defined timeline for establishing a comprehensive financial resource plan for Targets 2 and 3, but we recognise the importance of continued investment to underpin our broader decarbonisation ambitions.
The vessels are also designed to accommodate future use of alternative 45
Management report Sustainability statements
fuels, ensuring readiness for methanol or ammonia as these become viable options. When these fuels are adopted, we can anticipate even greater reductions in our nominated fleet’s carbon intensity, further supporting our climate targets.
for cargo loading and unloading also demands significant power, contributing to vessel emissions. Enhancing productivity at port enables G2 Ocean to minimise unnecessary fuel consumption and improve carbon intensity. To achieve this, we are collaborating strategically with ports and service providers to optimise port productivity, thereby reducing emissions. According to our long-term port productivity forecast, these improvement initiatives can support G2 Ocean in achieving an efficiency gain of 1–2% by 2030.
Operational levers Five key operational levers are identified, which is expected to reduce the carbon intensity with about 6-7%. The five operational levers are further detailed in Illustration 12. Lever 1: Optimise speed G2 Ocean operates a flexible fleet capable of operating across a broad spectrum of speeds, ranging from UltraEco (the most fuel-efficient) to FullSpeed (the fastest attainable). Historically, our vessels have maintained relatively consistent speeds throughout the year. However, in 2023 and 2024, we trialled a pilot project that used artificial intelligence to optimise vessel speed on each individual voyage. Building on the insights from this pilot, in 2025 we rolled out a voyage optimisation platform. This solution incorporates advanced speed optimisation tools, allowing vessels to consistently travel at the most efficient speed by integrating conventional weather routing with sophisticated features that consider a wider set of variables, such as real-time port congestion data, current and forecasted fuel prices and commercial requirements and contractual obligations.
In 2025, G2 Ocean continued its engagement with key ports in both the Pacific and Atlantic regions by forming and building on already established strategic alliances to eliminate operational bottlenecks. Dedicated efforts were made to coordinate vessel scheduling with port authorities and service providers, supported by the implementation of incentive programmes designed to encourage efficient cargo handling and quick vessel turnaround. Regular meetings with port partners facilitated continuous monitoring of performance. As a result, improvements in port productivity were achieved. Building on the progress of 2025, G2 Ocean will continue to focus on improving port productivity through collaborative initiatives and engagement with strategic port partners. Lever 3: Reduce time waiting for berth Depending on how busy a port is, a vessel may need to wait several days or even weeks before it can dock. G2 Ocean makes nearly 3,000 port calls each year, and longer waiting times increase our fleet’s carbon intensity because our ships burn fuel and run auxiliary engines while idling, emitting CO2 and pollutants without traveling distance. To time waiting for berth, we collaborate closely with ports and service providers. If we can lower the average annual waiting time for berthing to just one day by 2030, based on long-term forecasts, we expect to improve efficiency by 1–2%.
By leveraging these optimisation strategies, we anticipate achieving a reduction in fleet carbon intensity of approximately 2% by 2030. This initiative directly contributes to our three climate targets and ensures that our operations remain both cost-effective and environmentally responsible. Lever 2: Improve port productivity When our vessels are docked, their auxiliary engines produce emissions as they generate electricity. The operation of cranes
Illustration 12 Key operational areas G2 Ocean can control to reduce emissions
Speed Optimization
Waiting for Berth
Alternative Fuels*
Optimizing vessel speed throughout the voyage based on weather, currents, port congestion and commercial terms
Working strategically with ports and service providers to reduce time waiting for berth.
Using alternative fuels on our vessels (e.g., biofuel)
Port Productivity
Vessel Performance*
Working strategically with ports and service providers to improve port productivity.
Optimizing vessel performance by ensuring proper antifouling is used and corrective actions (hull cleanings) are taken as needed.
*The lever requires close collaboration with vessel owners Gearbulk and Grieg
46
MANAGEMENT REPORT
Introduction
Throughout 2025, G2 Ocean focused on reducing waiting for berth through proactive engagement with strategic port partners and negotiation of berth and space agreements. Enhanced scheduling coordination and the rollout of targeted incentive schemes encouraged ports to prioritise G2 Ocean vessels, resulting in reduction in average waiting for berth times across critical routes. Strategic monitoring and regular review meetings with port partners contributed to sustaining these improvements, ensuring that vessels experienced shorter idle periods and lower fuel consumption.
About G2 Ocean
Sustainability statements
General information
Environment
Social
Financial statements Governance
Appendix
Furthermore, in 2025, G2 Ocean continued to explore and implement various technologies to further improve vessel performance. For instance, we trialled robotic cleaning solutions during shorter port stays, which enabled more frequent hull cleaning and, consequently, reduced emissions. Looking towards 2026 and beyond, we plan to expand our vessel optimisation strategies to include increased adoption of advanced technologies such as AI-driven voyage optimisation tools, real-time performance monitoring through high-frequency sensor data, and the use of robotic systems for consistent hull cleaning. By embedding these innovations into our daily operations, we aim to further enhance our vessel’s operational efficiency, thereby improving our carbon intensity by 2%.
In 2026, G2 Ocean will continue to work closely with port partners to minimise vessel waiting times. Lever 4: Optimise vessel performance At G2 Ocean, we are committed to continually advancing our fuel efficiency by adopting various vessel optimisation strategies and leveraging new technologies.
Lever 5: Use alternative fuels G2 Ocean is committed to accelerating the adoption of low- and zero-carbon fuels in order to meet our climate targets, be compliant with regulations, as well as reduce regulatory costs. In 2025, we increased our use of biofuels across our fleet by 31%. This initiative has played an important role in reducing our fleet’s carbon intensity, as biofuels produce fewer greenhouse gas emissions compared to conventional marine fuels.
Among our main initiatives include conducting regular hull inspections and ensuring that propeller polishing is performed on our vessels. Well-maintained propellers are critical for achieving optimal speed by reducing drag, increasing power through improved thrust, and enhancing energy efficiency by lowering fuel consumption. This also helps protect the engine from unnecessary wear and tear. In 2025, we completed 124 propeller polishing operations, compared to 118 in 2024.
A notable contributor to our biofuel uptake in 2025 was the Jeager Arrow, which was the primary vessel utilising biofuel within our fleet. However, with the planned departure of the Jeager Arrow in 2026, we anticipate a temporary reduction in biofuel volumes. Despite this, we are proactively developing plans to extend biofuel usage to additional vessels. By expanding the programme, we expect to continue driving down the carbon intensity of our nominated fleet. These efforts, coupled with ongoing collaboration across our value chain, will lay the groundwork for broader adoption of alternative fuels such as methanol and ammonia, as these options become more readily available and economically viable in the future.
Additionally, we continued to closely monitor vessel performance throughout 2025, including hull condition, fuel consumption, and optimal operating speeds, using our Vessel Performance System. By leveraging this data, we were able to make timely, informed decisions that drive operational efficiency and reduce vessel emissions.
Table 9 Targets, metrics and performance: Climate change
2024
2025 target
2025 (Actual)
Medium term target (2028)
Long term targets (year)
5.54 (2023)
5.53
5.24
5.40
4.62
4.44 (2030+)
48 (2023)
50
47
47
41
39 (2030+)
1 961 245 (2023)
2 064 914
1 815 400
1 627 481
1 805 324
0 (2050)
Baseline (year)
Objective
Metric
Scope
Reduce the carbon intensity of the G2 Ocean nominated fleet by 40% within 2030 compared to 2008.
The ratio of the fleet’s carbon emissions per DWT transport work (AER)*
Fleet: Nominated fleet
Improve operational efficiency by 18% by 2030
MT CO2e per vessel days*
Fleet: Nominated and STTC
Voyages: Own voyages (Scope 1) and STTC-out voyages (Scope 3) Emissions in scope: Tank-to-wake
Voyages: Own voyages, STTC-in (Scope 1), and STTC-out (Scope 3) Emissions in scope: Tank-to-wake
Operate a zeroemission fleet by 2050.
Total GHG emissions in metric tons of CO2 equivalent*
Fleet: Nominated and STTC Voyages: Own voyages, STTC-in (Scope 1), and STTC-out (Scope 3) Emissions in scope: Tank-to-wake
47
Management report Sustainability statements
Technical levers Our pool participants, Grieg and Gearbulk, have identified a range of technical measures that can improve the energy efficiency of our existing fleet, with target carbon intensity reduction of about 4-5% by 2030. Since these initiatives are not part of G2 Ocean's responsibilities, please refer to the 'Climate Change' chapters of their respective Annual Reports for further details.
are presented in metric tonnes (MT), providing a consistent basis for comparing and tracking our climate impact over time. Baseline years Scope 1: Our baseline year for emissions from vessel operations is 2022. This year was selected as it was the first time we achieved third-party assurance on a complete and robust data set, providing a reliable foundation for tracking our progress in reducing greenhouse gas emissions.
Performance The 2025 results against our climate targets present a mixed but generally positive outlook.
Regulated Emission Trading Scheme Our Scope 1 emissions includes volumes subject to the EU ETS (Emission Trading Scheme), which was introduced for the maritime industry in 2024. This scheme is being phased in: initially, only CO2 emissions are regulated, but from 2026 onwards, methane (CH4) and nitrous oxide (N2O) will also be included in the EU ETS.
For the target to reduce the carbon intensity of the nominated fleet by 40% by 2030 (compared to 2008), the actual 2025 AER (Annual Efficiency Ratio) is 5.4, which is higher than the target of 5.24 but represents a reduction from the 2024 figure of 5.53. This indicates progress, though not quite at the pace initially aimed for. Continued focus on carbon intensity improvements will be important to ensure this target is achieved by 2030.
During the 2025 reporting year, both StormGeo and Coach platforms were used to ensure consistency and reliability in GHG reporting, as G2 Ocean is moving from Coach to StormGeo for emission data management. Vessels report data points like actual fuel consumption, distance sailed through noon reports to these platforms. Based on these reported data, emission covered under EU ETS is calculated.
Operational efficiency, measured by MT CO2e per vessel day, met its 2025 target exactly at 47, improving from 50 in 2024 and aligning with the set goal. This confirms that our measures to enhance efficiency have proved to be effective.
For data received from StormGeo, we applied a factor of 101% to reported CO2 emissions. This adjustment reflects the difference between the CO2 factor alone and the combined CO2e factor for marine fuels, which includes carbon dioxide (CO2), methane (CH4), and nitrous oxide (N2O). The combined CO2e factor is approximately 1% higher than the CO2 factor alone. In contrast, data received from Coach was already provided in terms of CO2e. As a result, no further conversion or adjustment was necessary for these figures.
For total GHG emissions, 1,627,481 MT CO2e was emitted from our fleet in 2025, which is 10.3% below our 2025 target of 1,815,400 and 21.2% reduction from 2024 figures, demonstrating progress in emissions reduction. It should be noted, however, that this outcome is highly correlated with operational activity levels. G2 Ocean’s voyage days in 2025 decreased by nearly 20% from 2024, consequently, part of the decrease in total GHG emissions is attributable to lower operational volumes rather than solely to efficiency improvements.
Scope 2: The baseline year for our Scope 2 emissions is also 2022, as this marks the first year we compiled a comprehensive data set for all office locations using a consistent carbon conversion factor. At present, we do not have any contractual instruments in place for purchased electricity.
G2 Ocean’s Climate Accounts G2 Ocean’s climate accounting covers all emission scopes in accordance with best practice and regulatory standards. We report both Scope 1 and Scope 2 emissions for our consolidated accounting group, as outlined in ESRS E1-1 paragraph 50(a), in addition to all significant Scope 3 categories. Furthermore, because G2 Ocean has operational control over the vessels we manage during their voyages, we also account for 100% of the greenhouse gas (GHG) emissions from these vessels, as specified by ESRS E1-1 paragraph 50(b). It is important to note that, for the purposes of our Scope 1 emission reporting, ‘control’ is determined based on operational authority rather than financial ownership.
Scope 3: For Scope 3 emissions related to fuel- and energy-related activities, upstream transportation (relet), and emissions from downstream leased assets, 2022 serves as our baseline year, as this was when we first comprehensively collected data for this category. However, for Scope 3 emissions related to purchased goods and services, 2024 is the designated baseline year, as this is the first year such data is being reported. Additional reporting definitions, underlying assumptions, calculation formulas, and methodologies for our Scope 1, 2, and 3 emissions are detailed in the section ‘Methodology: Climate Change’.
With respect to vessel emissions (Scope 1), our reported figures include all vessels carrying cargo for G2 Ocean, encompassing time-chartered (TC) vessels. However, vessels that are chartered out from our fleet to third parties are excluded from our calculations, as they fall outside our operational control and thus outside the Scope of our emissions reporting. All greenhouse gas emissions reported in this document—covering Scopes 1, 2 and 3—are expressed in carbon dioxide equivalents (CO2e). The CO2e metric consolidates carbon dioxide (CO2), methane (CH4) and nitrous oxide (N2O), which are the principal greenhouse gases quantified for maritime industry emission factors. All CO2e values 48
MANAGEMENT REPORT
Introduction
About G2 Ocean
Sustainability statements
General information
Environment
Social
Financial statements Governance
Appendix
Table 10 G2 Ocean’s climate accounts Retrospective Baseline (year)
Milestone and target years
2024
2025
% 2025/ 2024
2025
2030
(2050)
Annual % target / Base Year
Scope 1 GHG emissions Gross Scope 1 GHG emission (tCO2e)
2 114 850 (2022)
1 949 126
1 558 462
80%
n/a
n/a
n/a
n/a
% of Scope 1 GHG emissions from regulated emissions trading schemes
7.6% (2024)
7.60%
9.03%
119%
n/a
n/a
n/a
n/a
Gross location-based Scope 2 GHG emission (tCO2e)
135 (2022)
124
117
94%
n/a
n/a
n/a
n/a
Gross market-based Scope 2 GHG emissions (tCO2e)
176 (2022)
246
254
103%
n/a
n/a
n/a
n/a
826 244
592 607
72%
n/a
n/a
n/a
n/a
225 626 (2024)
225 626
140 287
64%
n/a
n/a
n/a
n/a
-
-
3. Fuel and energy-related Activities (not included in Scope 1 or 2)
475 583 (2022)
443 649
354 908
80%
n/a
n/a
n/a
n/a
4. Upstream transportation and distribution
19 317 (2022)
14 935
12 720
85%
n/a
n/a
n/a
n/a
5. Waste generated in operations
-
-
-
-
n/a
n/a
n/a
n/a
6. Business Travel
-
-
-
-
n/a
n/a
n/a
n/a
7. Employee commuting
-
-
-
-
n/a
n/a
n/a
n/a
8. Upstream leased assets
-
-
-
-
n/a
n/a
n/a
n/a
9. Downstream transportation
-
-
-
-
n/a
n/a
n/a
n/a
10. Processing of sold products
-
-
-
-
n/a
n/a
n/a
n/a
11. Use of sold products
-
-
-
-
n/a
n/a
n/a
n/a
12. End-of-life treatment of sold products
-
-
-
-
n/a
n/a
n/a
n/a
110 420 (2022)
142 034
84 692
60%
n/a
n/a
n/a
n/a
14. Franchises
-
-
-
n/a
n/a
n/a
n/a
15. Investments
-
-
-
n/a
n/a
n/a
n/a
Scope 2 GHG emissions
Significant Scope 3 GHG emissions Total Gross indirect (Scope 3) GHG emissions (tCO2e) 1. Purchased goods and services 2. Capital goods
13. Downstream leased assets
-
Total GHG emissions Total GHG emissions (location-based) (tCO2e)
2 770 760
2 151 186
78%
n/a
n/a
n/a
n/a
Total GHG emissions (market-based) (tCO2e)
2 770 882
2 151 323
78%
n/a
n/a
n/a
n/a
49
Management report Sustainability statements
GHG Intensity per net revenue The GHG intensity for 2025 is calculated as 2,151,186 (location-based) and 2,151,323 (market-based) tCO2e / USD 1,158,354 thousand (Total revenue in the Financial statements). The total GHG emission represents total Scopes 1, 2 and 3 emissions. Table 11 GHG Intensity per net revenue GHG intensity per net revenue
2024
2025
% 2025 / 2024
Total GHG emissions (location-based) per net revenue (tCO2e/Monetary unit)
0.0020
0.0019
93%
Total GHG emissions (market-based) per net revenue (tCO2e/Monetary unit)
0.0020
0.0019
93%
Biogenic emissions In 2025, G2 Ocean used biofuel blends consisting of 30% pure biodiesel and 70% marine fossil fuel on vessels trading in two separate trade routes. The biodiesel was sourced from sustainable feedstock, with its carbon factor reported as 0 to the IMO and the EU. However, the tank-to-wake biogenic emission factor reflects the actual emissions from the vessels.
The well-to-tank biogenic emissions are reported under Scope 3, Category 3 in Table 10. It should also be noted that methane (CH4) and nitrous oxide (N2O) from biogenic sources are to be included in our Scope 1 reporting; however, the amount for 2024 and 2025 have not been material and therefore have not been included. No biogenic emission for Scope 2 is reported as G2 Ocean does not have any emission source in this emission scope category.
Table 12 Biogenic emissions
Biogenic Emission (tCO2e)
Baseline (Year)
2024
2025
% 2025 / 2024
1 077 (2022)
7 677
10 021
131%
Overview of significant Scope 3 categories for reporting The overview provides a brief explanation of the Scope 3 categories and why they are significant or not. In Scope 3, fuel and energy-related activities and downstream leased asset is based on primary data as G2 Ocean is the owner of fuel consumption data. This represents 74% of total Scope 3 emissions. The last 26% emissions consist of purchased goods and services and upstream transportation and distribution is based on 3rd party reporting systems and not directly received from suppliers.
50
MANAGEMENT REPORT
Introduction
About G2 Ocean
Sustainability statements
General information
Environment
Social
Financial statements Governance
Appendix
Table 13 Overview of Scope 3 categories Category
Category Name
Significant?
Validation for applicability
1
Purchase goods and services
Yes
G2 Ocean has significant spend on goods and services with high emissions connected to operations.
2
Capital goods
No
G2 Ocean has not made any significant purchases of capital goods during the year.
3
Fuel and energy-related activities (not included in Scope 1 or Scope 2)
Yes
G2 Ocean bunkers significant amounts of marine fuels to operate the vessels. The production of said fuel has high emissions.
4
Upstream transportation and distribution
Yes
In some cases, G2 Ocean must book cargo space in 3rd party vessels as it cannot carry all the cargoes of a customer, due to lack of vessel availability. There are significant emissions from using 3rd party vessels outside of G2 Ocean’s direct operational control is accounted under this category.
5
Waste generated in operations
No
G2 Ocean does not produce significant amount of waste, neither in office nor in operations.
6
Business travel
No
G2 Ocean has estimated emissions from business travel and concluded that the amount is not significant.
7
Employee commuting
No
Employees generally do not travel far to work. Many uses public transportation. Emissions from this activity is not significant.
8
Upstream leased assets
No
G2 Ocean does not lease any assets/ vessels other than the one that is already reported under Scope 1 TC vessels.
9
Downstream transportation and distribution
No
This does not apply to G2 Ocean, as it is a transportation company itself that carries cargo for cargo owners.
10
Processing of sold products
No
G2 Ocean is company providing transportation services – it does not sell any physical products.
11
Use of sold products
No
G2 Ocean does not sell any goods or services that customers use later uses in their own operation.
12
End-of-life treatment of sold products
No
G2 Ocean does not have any products; hence no end-of-life treatment is relevant.
13
Downstream leased assets
Yes
When necessary G2 Ocean hires out vessels (TC out) to other charterers. Emissions from these vessels are of significant.
14
Franchises
No
G2 Ocean does not grant licenses to others to sell or distribute goods or services in return for payments.
15
Investments
No
G2 Ocean does not have any investments.
51
Management report Sustainability statements
Methodology: Climate change Emission figures have not been validated by any external body other than the auditor. The emission factors included in the methodology were chosen based on relevance to industry (IMO) and recommendation from notable authority (DEFRA) that is supported by most recent scientific studies. Table 14 Methodology: Climate change Metric
Unit
Methodology
MT CO2e
The CO2e from fuel consumption is calculated using DEFRA 2025 conversion factors.
Scope 1 CO2 equivalents (CO2e) from fuel consumption
The conversion factors for fuel oil and marine gas oil covers contributions from CO2, CH4 and N2O emissions and are as follows: - CO2e factor LFO: 3.15475 - CO2e factor MGO: 3.2453
Emission from emission trading scheme
MT CO2e
This includes emission from areas regulated by the EU ETS. The data is gathered under EU MRV framework and validated by Coach and StormGeo. Scope for EU ETS is: Port calls within EU – 100% CO2e emission Port calls in/out of EU – 50% CO2e emission Port calls outside of EU – 0% CO2e emission The emission reports were received from Coach and StormGeo. Percentage emission from emission trading scheme = StormGeo and Coach verified EU ETS emission/G2 Ocean’s total scope 1 emission.
Scope 2 Consumption of purchased energy for heating, cooling, lightning, and gas
CO2e
Energy consumption figures are used to calculate emissions. There are three methods applied for offices where G2 Ocean is the tenant (situation a), in prioritised order: Method a1 is used when we have direct information about the consumption from the electricity supplier about the office's kwh consumption in a given period. Method a2 is used where G2 Ocean does not have our own electricity meter, but we can obtain energy consumption data from the building owner. Our share of the total consumption is calculated based on our share of the total floor area of the building. Method a3 is used where electricity consumption figures are not provided by the building owner, and G2 Ocean does not purchase energy. We use relevant, generic studies of consumption per floor area of office space for the region where the office is located. For offices where G2 Ocean employees are situated in office spaces of another company which is the tenant (situation b), we obtain electricity consumption figures from the tenant and use employee head count to calculate our share of the total emissions. Method a1: input data is collected quarterly from the G2 Ocean invoicing system, using kwh consumption figures provided by the energy supplier. The invoices are filed within the invoicing system. Method a2: input data is collected on a quarterly basis from the building owner. Method a3: the availability of generic studies of energy consumption in office buildings is assessed annually, and figures are adjusted if and when improved data is available. Sources are referred to in the input sheet. Method B1: We obtain energy consumption data from the tenant and use head count to calculate our share of the consumption on a quarterly basis. Location-based emission conversion factors from the United Nations Framework Convention on Climate Change is used to calculate our Scope 2 emissions. We have prioritized to use one source for emission factors for all our locations, rather than selecting factors published by national authorities, to ensure consistency. Note that the UNFCCC factors are based on how electricity in the country is produced. It does not take into account the exchange of electricity with other countries, and it’s not a consumption-mix factor. Residual mix factors have been used for every location, as available from carbon database initiative (CaDI). For Bergen district heat, the Location and Market based factor is collected from the Environmental Product Declaration by Eviny in 2022. Note that emissions from incineration of waste is included in this emission factor.
52
MANAGEMENT REPORT
Introduction
Metric
About G2 Ocean
Sustainability statements
General information
Environment
Social
Financial statements Governance
Appendix
Unit
Methodology
CO2e
To calculate the well-to-tank emissions, we consider the entire lifecycle of the fuel before it enters the tanks onboard our vessels, including production, processing and delivery. We use the actual consumption of fuel oil, marine gas oil and biofuel, respectively, and then multiply it by specific conversion factors to determine the emissions in tons CO2e.
Scope 3 Fuel and energyrelated emissions / Well-to tank emissions
The emissions factors (kg CO2e per ton fuel) calculated using DEFRA 2025 emission factors for fuels which are as follows: - LFO: 714.86 - MGO: 743.83 - Biofuel: 443.91 Downstream Leased Assets
CO2e
To calculate emissions from downstream leased assets, we use DEFRA 2025 carbon factors: - CO2e factor LFO: 3.15475 - CO2e factor MGO: 3.2453 The well-to-tank emissions (Kg CO2e per ton fuel) is based on DEFRA 2025 emission factors. These are as follows: - LFO: 714.86 - MGO: 743.83
Emissions from upstream transportation (Relet)
CO2e
When G2 Ocean books space with other carriers to transport our customers’ cargo, it is called “relet”. Our Scope 3 emissions are determined by calculating our share of emissions from these vessels, taking into account the weight of the cargo. To calculate emissions from downstream leased assets, we use DEFRA 2025 carbon factors: - CO2e factor LFO: 3.15475 - CO2 factor MGO: 3.2453 The well-to-tank emissions (Kg CO2e per ton fuel) is based on DEFRA 2025 emission factors. These are as follows: - LFO: 714.86 - MGO: 743.83
Purchased goods and services
CO2e
For emissions from purchased goods and services, we use Sievo CO2 analytics. This tool follows the GHG Protocol, where emissions are calculated based on spend amount (USD) or material quantity (kg) using globally recognized emissions data. Calculation of CO2e: Spend data is taken directly from our ERP systems and categorized into a custom taxonomy. After that, 3rd party emission factors are applied to the spend data in Sievo CO2 analytics. The emission factors are sourced from a combination of licensed and open data source. These are: Ecoinvent: Emission factors for quantity-based values. Exiobase: Emission factors for monetary-based values. Both the type of activity and the location are taken into consideration to establish CO2e emission factor for each spend category and material. To increase accuracy, inflation and currency rates are considered. In addition to secondary data, it is also possible to add supplier-specific primary data that is received directly from our suppliers. When primary data is available for a supplier that is prioritized secondary data when calculating emission.
Other Annual Efficiency Ratio (AER)
MT CO2/ million DWT x nautical miles
The AER is calculated based on MEPC.336(76) guideline, with the formula: AER for vessel = (Annual fuel consumption nominated vessel x carbon factor of the fuel) / total transport work (distance sailed x DWT of vessel). The carbon factors used are as follows: Heavy fuel oil: 3.114 Light fuel oil: 3.151 Diesel oil: 3.206
Biogenic emissions
MT CO2
The biogenic emission from the combustion of biofuel is found using conversion factor from IMO lifecycle and carbon intensity guidelines (ISWG-GHG 11/2/3). Biogenic emission = Annual biofuel consumption x CO2 factor x GWP100 value CO2 CO2 factor: 2.834 For CO2 GWP100 value is 1.
53
Management report Sustainability statements
EU taxonomy G2 Ocean has prepared its EU Sustainable Finance Taxonomy (EU taxonomy) disclosure in compliance with EU Regulation 2020/852 and the Delegated Acts, as well as Norway's Sustainable Finance Act.
7.7 Acquisition and ownership of buildings: This activity includes buying real estate and exercising ownership of that real estate.
The EU Taxonomy is a system for classifying which economic activities are considered environmentally sustainable, helping companies and investors make informed choices. For an eligible activity to be considered aligned it must significantly support at least one EU climate or environmental goal, avoid harming any of the other remaining objectives, and meet basic minimum social safeguards.
Assessment: As of December 31, 2025, G2 Ocean had eight offices and other space operating that had an initial duration above 12 months. As per G2 Oceans accounting policies, these leases are treated as right-of-use asset (RoU) and consequently treated as if G2 Ocean has control over the office space leased. RoU has been assessed to fall into the category of ownership of buildings as defined in EU Taxonomy,and are therefore taxonomy eligible.
As legally required, G2 Ocean AS discloses the EU Taxonomy KPIs (turnover, CapEx and OpEx) related to the following economic activities performed by the Company during the reporting year: • 6.10 Sea and coastal freight water transport, vessels for port operations and auxiliary activities • 7.7 Acquisition and ownership of buildings
Compliance with minimum social safeguards The minimum safeguard assessment covers four main areas: • Human rights and workers’ rights • Bribery and corruption • Taxation • Fair competition
Within these activities, 100% of G2 Ocean's turnover, CapEx and OpEx is evaluated to be taxonomy eligible, whereof 0 % are taxonomy aligned. A summary of this result is provided in Table 17.
There are two main aspects that needs to be assessed: • Companies need to implement adequate processes to ensure that applicable laws and guidelines are complied with • The performance of companies has to be monitored
Identifying environmentally sustainable economic activities G2 Ocean has assessed all activities as defined by EU Taxonomy Compass. In this assessment, possible relevant activities have been discussed and concluded whether relevant activities for G2 Ocean. For our core business activity, the Transport sector has been assessed as relevant and, within this sector, we identified one economic activity specified in the taxonomy that has relevance to our ocean-based core business. In addition, G2 Ocean has assessed that the sector Construction and real estate activities are also relevant for G2 Ocean, and within this sector one activity is assessed to have relevance. Both these activities are assessed to be eligible under objective 1, Climate Change Mitigation (CCM). For Climate Change Adaption (CCA), there is currently no plan in place for doing a risk assessment and implementing a plan for making economic activities more resilient or adaptive to climate change. As a result, no activities are defined taxonomy eligible under the CCA-objective.
The Company’s activities are carried out in compliance with the minimum safeguards. Human rights, including labour rights: G2 Ocean’s due diligence process is guided by the OECD Guidelines for Multinational Enterprises and the UN Guiding Principles on Business and Human Rights. G2 Ocean has not been held liable or found to be in breach with labour law or human rights in 2025 and the Company is committed to engage with relevant stakeholders. For further information, please see G2 Ocean’s Transparency Act statement. Considering the due diligence process and the details provided in the Transparency Act statement, it is assessed that G2 Ocean’s compliance is adequate. Bribery and corruption: G2 Ocean has developed and adopted a compliance program covering the prevention and detection of corruption and bribery. Anti-corruption policies and procedures have been communicated to the Company’s employees and suppliers. Neither G2 Ocean or any of the members of the senior management were convicted of corruption or bribery in 2025. Based on above, it is assessed that G2 Ocean’s compliance with bribery and corruption legislation is adequate.
6.10 Sea and coastal freight water transport, vessels for port operations and auxiliary activities: This activity includes purchasing, financing, chartering and operation of vessels used for transport of freight. Assessment: As a pool company, G2 Ocean operates a fleet of open hatch vessels, and the Company is responsible for operation and chartering. G2 Ocean’s activity within the break bulk open hatch shipping segment is considered to be part of the “Sea and coastal freight water transport, vessels for port operations and auxiliary activities” and is therefore taxonomy eligible.
Taxation: G2 Ocean complies with taxation regulations and are aligned in regards with transfer pricing documentation, country-by-country
54
MANAGEMENT REPORT
Introduction
About G2 Ocean
Sustainability statements
General information
Environment
Social
Financial statements Governance
Appendix
Substantial contribution criteria
reporting and local tax requirements. None of the companies within the G2 Ocean Group were found to be in violation of tax laws in 2025. Considering the OECD MNE Guidelines covering tax, the Company’s tax policy is assessed to be adequate.
For activity 6.10 Sea and coastal freight water transport, vessels for port operations and auxiliary activities – Climate change mitigation, the requirements under the Substantial contribution criteria require vessels to comply with one or more criterias outlined in point 1 (a) to
Fair competition: G2 Ocean is committed to fair competition and to comply with all applicable anti-trust and competition laws. This is anchored in our code of business ethics, and training is provided for senior and other relevant employees. Neither G2 Ocean nor any of the members of the senior management have been found in breach of competition laws in 2025. G2 Ocean compliance with the fair competition rules and regulations are assessed to be adequate.
(f) and point 2. No vessels in G2 Ocean’s fleet are dedicated to the transport of fossil fuels, however, none of the vessels in G2 Ocean pool comply with the criteria’s in point 1(a) to (f). As a result, the shipping activity in G2 Ocean is not taxonomy-aligned for 2025.
Table 15 Substantial contribution criteria activity 6.10 Sea and coastal freight water transport, vessels for port operations and auxiliary activities Substantial contribution criteria: Objective 1 - Climate change mitigation
Compliance
1. The activity complies with one or more of the following criteria (a,b,c,d,e,f): a. Zero direct (tailpipe) CO2 emissions;
Currently non-compliant
X
c. Coastal and short sea services
Currently non-compliant
X
d. EEDI requirements
Currently non-compliant
X
e. EEDI, plug in and gas fueled ships
Currently non-compliant
X
f. Green house gas intensity limits
Currently non-compliant
X
Compliant. G2 Ocean vessels are not involved in transporting fossil fuels.
√
2. Vessels are not dedicated to the transport of fossil fuels.
Aligned
For activity 7.7 - Acquisition and ownership of buildings – Climate change mitigation – No office space defined as Right-of-Use asset comply with these criteria. As a result, the ownership of buildings activity in G2 Ocean is not taxonomy-aligned for 2025.
Table 16 Substantial contribution criteria activity 7.7 Acquisition and ownership of buildings Substantial contribution criteria: Objective 1 - Climate change mitigation
Compliance
1. Energy Performance Certificate (EPC)
Currently non-compliant
X
2. Energy performance monitoring and assessment
Currently non-compliant
X
55
Aligned
Management report Sustainability statements
Compliance with Do No Significant Harm (DNSH) criteria
water transport, vessels for port operations and auxiliary activities is assessed to be additions under property, plant and equipment, as this is equipment necessary for the shipping activity. Additions of right-of-use asset related to office lease is assessed to be categorized under the activity CCM 7.7 Acquisition and ownership of buildings as this is defined previously as to fall into the category of ownership of buildings as defined in EU Taxonomy. All additions under property, plant and equipment and all additions in right-of-use asset in 2025 is categorized to be additions for taxonomy-eligible activities.
In addition to making a substantial contribution to climate change mitigation by meeting the technical screening criteria, the eligible activities must also comply with the criteria of not causing significant harm to any of the other environmental objectives. As the activity was concluded to be non-taxonomy-aligned with respect to the substantial contribution criteria, no further assessment of the DNSH criteria has been carried out for 2025.
Financial KPI’s - Taxonomy
There is currently no Capex plan in place to expand Taxonomy-aligned economic activities or to allow Taxonomy-eligible economic activities to become Taxonomy-aligned.
The Financial Statement for G2 Ocean is prepared in accordance with USGAAP and is the basis for G2 Ocean’s KPI-reporting.
Operating expenditure (opex): A classification of operating expenses is defined in Consolidated statement of Income in the Financial Statement of G2 Ocean, as well as in the accounting policies. Of these operating expenses only part is assessed to be categorized as taxonomy-eligible activities under the definition given in taxonomy legislation. For the eligible taxonomy-activity CCM 6.10 Sea and coastal freight water transport, vessels for port operations and auxiliary activities, two types of opex is assessed to fall in under definitions given (1) short term lease of time charter vessel (Note 6 in the Financial Statements), and (2) other direct expenditures covering necessary day-to-day costs for maintaining the operational functionality of assets, such as minor repairs, spares and outsourced maintenance services (Note 5 in the Financial Statements). For the eligible taxonomy-activity CCM 7.7 Acquisition and ownership of buildings, short term lease of offices is assessed to fall in under the definitions given in the taxonomy legislation (Note 8 in the Financial Statements).
Revenue (turnover): Revenue represents revenue as described in our accounting policies, Note 2.5 in the Financial Statement of G2 Ocean. All revenue is assessed to be categorized under the eligible taxonomy-activity CCM 6.10 Sea and coastal freight water transport, vessels for port operations and auxiliary activities. Revenue from eligible activities includes revenues from contracts with customers and other revenues, as described in Note 3 in the Financial Statements, totalling the Total revenue from Consolidated statement of income. No revenue is assessed to be categorized under the activity CCM 7.7 Acquisition and ownership of buildings. Capital expenditure (capex): Capex comprises of additions to property, plant and equipment and additions to right-of-use assets (leases), all as described in our accounting policies, Note 2.11 and 2.14, as well as in Note 7 and 17 in the Financial Statement of G2 Ocean. Capex allocated to the eligible taxonomy-activity CCM 6.10 Sea and coastal freight
Table 17 Key Performance indicators EU taxonomy KPIs, %
2025
2024
Taxonomy-aligned revenue (turnover)
0%
0%
Taxonomy-eligible but not taxonomy-aligned revenue (turnover)
100 %
100 %
Sea and coastal freight water transport, vessels for port operations and auxiliary activities
100 %
100 %
Taxonomy-non-eligible revenue
0%
0%
Taxonomy-aligned CAPEX
0%
0%
Taxonomy-eligible but not taxonomy-aligned CAPEX
100 %
100 %
Sea and coastal freight water transport, vessels for port operations and auxiliary activities
83 %
49 %
Acquisition and ownership of buildings
17 %
51 %
Taxonomy-non-eligible CAPEX
0%
0%
Taxonomy-aligned OPEX
0%
0%
Taxonomy-eligible but not taxonomy-aligned OPEX
100 %
100 %
Sea and coastal freight water transport, vessels for port operations and auxiliary activities
92 %
99 %
Acquisition and ownership of buildings
8%
1%
Taxonomy-non-eligible OPEX
0%
0%
56
MANAGEMENT REPORT
Introduction
Table 18 shows the total revenue, opex and capex for G2 Ocean, and the estimated proportion of economic activities which is considered aligned, non-aligned, eligible, and non-eligible as defined in the taxonomy regulation. In combination, the indicators below are intended by the taxonomy to express G2 Ocean’s activities that qualify as environmentally sustainable.
57
About G2 Ocean
Sustainability statements
General information
Environment
Social
Financial statements Governance
Appendix
Management report Sustainability statements
Table 18 Turnover
Proportion of Turnover 2025
MUSD
%
Codes
Economic Activities
Climate Change Mitigation
Turnover
2025
Y; N; N/EL
A. TAXONOMY-ELIGIBLE ACTIVITIES A.1. Environmentally sustainable activities (Taxonomy-aligned) Activity 1
%
Activity 1
%
Activity 2
%
Turnover of environmentally sustainable activities (Taxonomy-aligned) (A.1)
-
0%
0%
Of which enabling
-
0%
Of which transitional
-
0%
1 158.4
100%
EL
Turnover of Taxonomy-eligible but not environmentally sustainable activities (not Taxonomy-aligned activities) (A.2)
1 158.4
100%
100%
A. Turnover of Taxonomy-eligible activities (A.1+A.2)
1 158.4
100%
100%
-
0%
1 158.4
100%
A.2. Taxonomy-eligible but not environmentally sustainable activities (not Taxonomy-aligned activities) Sea and coastal freight water transport, vessels for port operations and auxiliary activities
CCM 6.10
B. TAXONOMY-NON-ELIGIBLE ACTIVITIES Turnover of Taxonomy-non-eligible activities Total Total Turnover equals the total revenues in the Consolidated Statement of Income in the Financial Statement for 2025.
58
MANAGEMENT REPORT
Introduction
Governance
0%
Circular Economy
Biodiversity
Minimum Safeguards
Proportion of Taxonomy-aligned (A.1.) or -eligible (A.2.) turnover, year 2024
Category enabling activity (19)
Category transitional activity (20)
Y; N; N/EL
Pollution
Biodiversity
Y; N; N/EL
0%
Social
Water
Circular Economy
Y; N; N/EL
0%
Environment
Climate Change Adaptation
Pollution
Y; N; N/EL
0%
General information
Financial statements
Climate Change Mitigation
Water
Y; N; N/EL
0%
Sustainability statements
Do not significantly harm
Climate Change Adaptation
Substantial contribution criteria
About G2 Ocean
Y/N
Y/N
Y/N
Y/N
Y/N
Y/N
Y/N
%
E
T
Y
Y
Y
Y
Y
Y
Y
%
Y
Y
Y
Y
Y
Y
Y
%
Y
Y
Y
Y
Y
Y
Y
%
N
N
N
N
N
N
Y
0% 0% 0%
N/EL
N/EL
N/EL
N/EL
N/EL
100%
0%
0%
0%
0%
0%
100%
0%
0%
0%
0%
0%
100%
59
E T
Appendix
Management report Sustainability statements
Table 19 CapEx
Capex
Proportion of CapEx 2025
Climate Change Mitigation
2025
MUSD
%
Y; N; N/EL
Codes
Economic Activities
A. TAXONOMY-ELIGIBLE ACTIVITIES A.1. Environmentally sustainable activities (Taxonomy-aligned) Activity 1
%
Activity 1
%
Activity 2
%
Capex of environmentally sustainable activities (Taxonomy-aligned) (A.1)
-
0%
Of which enabling
-
0%
Of which transitional
-
0%
0%
A.2. Taxonomy-eligible but not environmentally sustainable activities (not Taxonomy-aligned activities) Sea and coastal freight water transport, vessels for port operations and auxiliary activities
CCM 6.10
3.0
83%
EL
Acquisition and ownership of buildings
CCM 7.7
0.6
17%
EL
Capex of Taxonomy-eligible but not environmentally sustainable activities (not Taxonomy-aligned activities) (A.2)
3.7
100%
100%
A. Capex of Taxonomy-eligible activities (A.1+A.2)
3.7
100%
100%
-
0%
3.7
100%
B. TAXONOMY-NON-ELIGIBLE ACTIVITIES Capex of Taxonomy-non-eligible activities TOTAL Total Capex equals the total additions in Note 7 and Note 17 in the Financial Statement for 2025.
60
MANAGEMENT REPORT
Introduction
Social
Governance
0%
0%
Circular Economy
Biodiversity
Minimum Safeguards
Proportion of Taxonomy-aligned (A.1.) or -eligible (A.2.) CapEx, year 2024
Category enabling activity
Category transitional activity
Y; N; N/EL
Pollution
Biodiversity
Y; N; N/EL
Water
Circular Economy
Y; N; N/EL
0%
Environment
Climate Change Adaptation
Pollution
Y; N; N/EL
0%
General information
Financial statements
Climate Change Mitigation
Water
Y; N; N/EL
0%
Sustainability statements
Do not significantly harm
Climate Change Adaptation
Substantial contribution criteria
About G2 Ocean
Y/N
Y/N
Y/N
Y/N
Y/N
Y/N
Y/N
%
E
T
Y
Y
Y
Y
Y
Y
Y
%
Y
Y
Y
Y
Y
Y
Y
%
Y
Y
Y
Y
Y
Y
Y
%
N
N
N
N
N
N
Y
0% 0% 0%
N/EL
N/EL
N/EL
N/EL
N/EL
49%
N/EL
N/EL
N/EL
N/EL
N/EL
51%
0%
0%
0%
0%
0%
100%
0%
0%
0%
0%
0%
100%
61
E T
Appendix
Management report Sustainability statements
Table 20 Opex
Circular Economy
Biodiversity
Y; N; N/EL
Y; N; N/EL
Y; N; N/EL
Y; N; N/EL
Y; N; N/EL
Water
Pollution
Y; N; N/EL
Climate Change Adaptation
Water
Codes
Climate Change Adaptation
Proportion of OpEx 2025 %
Climate Change Mitigation
Opex MUSD
Economic Activities
Do not significa
Climate Change Mitigation
Substantial contribution criteria
2025
Y/N
Y/N
Y/N
A. TAXONOMY-ELIGIBLE ACTIVITIES A.1. Environmentally sustainable activities (Taxonomy-aligned) Activity 1
%
Y
Y
Y
Activity 1
%
Y
Y
Y
Activity 2
%
Y
Y
Y
N
N
Opex of environmentally sustainable activities (Taxonomy-aligned) (A.1)
-
0%
Of which enabling
-
0%
Of which transitional
-
0%
0%
%
0%
0%
0%
0%
N
A.2. Taxonomy-eligible but not environmentally sustainable activities (not Taxonomy-aligned activities) Sea and coastal freight water transport, vessels for port operations and auxiliary activities
CCM 6.10
35.4
92%
EL
N/EL
N/EL
N/EL
N/EL
N/EL
Acquisition and ownership of buildings
CCM 7.7
3.1
8%
EL
N/EL
N/EL
N/EL
N/EL
N/EL
Opex of Taxonomy-eligible but not environmentally sustainable activities (not Taxonomyaligned activities) (A.2)
38.5
100%
100%
0%
0%
0%
0%
0%
A. Opex of Taxonomy-eligible activities (A.1+A.2)
38.5
100%
100%
0%
0%
0%
0%
0%
-
0%
38.5
100%
B. TAXONOMY-NON-ELIGIBLE ACTIVITIES Opex of Taxonomy-noneligible activities TOTAL
Total OpEx consist of Time Charter Rental Expense from Note 6 (mUSD 24.7), Other direct expenditures for repairs and manintenance sevices from Note 5 (10.7 mUSD) an
62
MANAGEMENT REPORT
Introduction
About G2 Ocean
Sustainability statements
General information
Environment
Social
Financial statements Governance
Appendix
Table 21 Nuclear energy and fossil gas related activities
antly harm
Pollution
Circular Economy
Biodiversity
Minimum Safeguards
Proportion of Taxonomy-aligned (A.1.) or -eligible (A.2.) OpEx, year 2024
Category enabling activity
Category transitional activity
Nuclear energy related activities
Y/N
Y/N
Y/N
Y/N
%
E
T
1
The undertaking carries out, funds or has exposures to research, development, demonstration and deployment of innovative electricity generation facilities that produce energy from nuclear processes with minimal waste from the fuel cycle.
NO
2
The undertaking carries out, funds or has exposures to construction and safe operation of new nuclear installations to produce electricity or process heat, including for the purposes of district heating or industrial processes such as hydrogen production, as well as their safety upgrades, using best available technologies.
NO
3
The undertaking carries out, funds or has exposures to safe operation of existing nuclear installations that produce electricity or process heat, including for the purposes of district heating or industrial processes such as hydrogen production from nuclear energy, as well as their safety upgrades.
NO
Fossil gas related activities
Y
Y
Y
Y
%
Y
Y
Y
Y
%
Y
Y
Y
Y
%
N
N
N
Y
E
4
The undertaking carries out, funds or has exposures to construction or operation of electricity generation facilities that produce electricity using fossil gaseous fuels.
NO
5
The undertaking carries out, funds or has exposures to construction, refurbishment, and operation of combined heat/cool and power generation facilities using fossil gaseous fuels.
NO
6
The undertaking carries out, funds or has exposures to construction, refurbishment and operation of heat generation facilities that produce heat/cool using fossil gaseous fuels.
NO
T
0% 0% 0%
99%
1%
100%
100%
nd Office expenses from Note 8 (mUSD 3.1) in the Financial Statement for 2025.
63
Management report Sustainability statements
Pollution of air Pollution of air has been identified as a key material topic for G2 Ocean, following our latest double materiality assessment conducted in 2025. Within this area, we have identified one material negative impact: emissions of nitrogen oxides (NOx) and sulphur oxides (SOx) resulting from our vessel operations, which affect air quality in the regions where we operate.
pollution, detailed pollution-related commitments have not yet been established. At present, we have not implemented strategic actions specifically aimed at mitigating NOx and SOx emissions; however, we comply with all regulatory requirements regarding NOx and SOx emissions and our ongoing decarbonisation initiatives described in the ‘Climate Change’ chapter do contribute to the reduction of such emissions. As reported in Table 23, SOx and NOx emissions decreased by 21% and 20%, respectively, between 2024 and 2025. These reductions are closely associated with lower fuel consumption across our fleet during this period, which served as the primary factor driving these improvements
Currently, we are working on developing appropriate targets, metrics, policies and responsibilities to manage this impact. As this process is ongoing, we do not yet have specific targets to disclose. While our Environmental policy does include a general commitment to reducing
Table 22 Material impacts, risks and opportunities: Pollution of air Material matters
Scope
Description of materiality
Own operations
NOx and SOx emissions primarily occur from the combustion of marine fuels in our ship engines. When our vessels burn fuel—such as heavy fuel oil or marine diesel—at high temperatures, nitrogen from the air reacts with oxygen, producing NOx. Similarly, SOx emissions are released when fuels containing sulphur are combusted, resulting in sulphur dioxide and related compounds. These pollutants are expelled through exhaust systems, contributing to poor air quality and posing health and environmental risks, especially in coastal and port areas.
Material impacts1 G2 Ocean's vessel operations contribute to NOx and Sox emissions, negatively impacting air quality in areas we trade. (-)
1
(+) symbolises a positive impact whereas (-) symbolises a negative impact
Table 23 Emissions of NOx and SOx Polluants to air
2024
2025
% 2025 / 2024
Total SOx emissions (mt)
5 077
3 991
79%
Total NOx emisions (mt)
54 931
43 959
80%
Table 24 Methodology: Pollution of air Metric
Unit
Methodology
Sulphur oxides emissions (SOx)
MT SOx
The mass of SOx emitted by the vessel is calculated by multiplying the given fuel type consumption (in metric tons) with the sulphur content of each fuel type (%) and sulphur content factor per metric ton of fuel. The sulphur content factor is a fixed parameter of 1.99782 per metric ton and, given the fuel type, the sulphur content percentage is expressed as an absolute value. The emitted mass of SOx will then be: Consumption (MT) * Sulphur content (%)* Sulphur Content Factor 1.99782 per mt Source: Norwegian Oil and Gas Association, Recommended guidelines for discharge and emission reporting, No:44
Nitrogen Oxides emissions (NOx)
MT SOx
The mass of NOx emitted is calculated using the following assumptions: - All main engines <200rpm, this equals 100 kg of Nox per metric ton of fuel used. - All auxiliary engines (1000<rpm<1500), this equals 50kg of Nox per metric ton of fuel used - All Boilers 9.6of Nox per metric ton fuel used. The fuel distribution between the main engines, auxiliary engines and boilers are calculated based on actual figures. NOx factors depend on the type of engine. The fuel type does not affect the emissions. Source: Norwegian NOx Fund
64
MANAGEMENT REPORT
Introduction
65
About G2 Ocean
Sustainability statements
General information
Environment
Social
Financial statements Governance
Appendix
Management Report Sustainability statements
SOCIAL INFORMATION This chapter outlines G2 Ocean’s key material topics related to our own workforce and those working throughout our value chain. It provides an overview of our approach to health and safety, protecting the wellbeing of both our own employees and those connected to our operations. Additionally, this chapter addresses our training and skills development initiatives, highlighting efforts to support our employees in developing the necessary knowledge for ensuring sustainable operations.
68
Own workforce
73
Health and safety
77
Training and skills development
81
Workers in the value chain
82
Health and safety
0
recordable accidents among
0
fatalities among our
recordable stevedore
our own workforce
own workforce and value
accidents - reduced by
chain workers
52.5% since 2022
Relevant policies Human Rights and Decent Work Conditions Policy Occupational Health and Safety policy Code of Business Ethics Bullying and Harassment Policy Equal Opportunities Policy Diversity, Equity and Inclusion Policy Supplier Code of Conduct
66
19
MANAGEMENT REPORT
Introduction
Commitment to Human Rights
About G2 Ocean
Sustainability statements
General information
Environment
Social
Financial statements Governance
Appendix
in every aspect of our operations. Please see ‘Code of Business Ethics’ for more information.
In line with our commitment to social responsibility, we place a strong emphasis on upholding fundamental human rights for all individuals throughout our operations and value chain. As evidence of this, there were no adverse human rights incidents involving our own workforce or workers in the value chain during the reporting period.
Governance and implementation The responsibility for implementing and monitoring these policies sits with our Director of Compliance, Risk, and Business Process. All employees have access to these documents via our intranet, and external stakeholders can view them on our website.
Our Human Rights and Decent Work Conditions Policy specifies our commitment to respecting and protecting human rights and ensuring decent working conditions across our operations. The policy commits G2 Ocean to adhering to internationally recognised frameworks, including:
Human rights management measures G2 Ocean ensures adherence to its human rights commitments through a set of measures: • Regular policy reviews and governance
• The International Bill of Human Rights and other relevant human rights conventions
• Quarterly progress reviews and internal audits to assess effectiveness of controls
• The ILO Declaration on Fundamental Principles and Rights at Work • The OECD Guidelines for Multinational Enterprises
• Human rights training as part of our employee development programme
Core human rights and labour standards covered include but are not limited to the human right to freedom of association; safe, healthy and secure working conditions; collective bargaining and the human rights not to be subject to forced labour, child labour or discrimination in respect of employment and occupation.
• Environmental and social due diligence, including human rights and saliency assessments based on OECD Guidance, is conducted to identify and prioritise risks. Peru (child labour), Saudi Arabia, and the UAE (forced labour) are considered high-risk countries. However, this risk is not considered material to G2 Ocean as suppliers are screened before providing services.
• The UN Guiding Principles on Business and Human Rights (UNGPs)
• Regular engagement with key stakeholders who could be impacted by our operations, as detailed in Stakeholder engagement. We also conduct in-depth stakeholder analysis as part of our human rights saliency assessment.
Policy Scope Our Human Rights and Decent Work Conditions Policy applies to all individuals involved in G2 Ocean’s operations, including employees, non-employees working through agency-type agreements (e.g., consultants, seconded staff), workers in our value chain, customers and suppliers.It covers all business activities, both at our own worksites and within our broader supply chain, with a particular focus on preventing and addressing potential human rights and labour rights impacts.
• Supplier audits and ongoing monitoring of value chain partners. • Transparent reporting, including our Annual Reports and the Norwegian Transparency Act statement Remediation and grievance mechanisms Furthermore, G2 Ocean offers accessible, confidential channels for both own workforce and workers in our value chain to report human rights or work condition concerns, ensuring that any adverse human rights impacts are identified and addressed promptly and effectively. For more information, please see our ‘Remediation’ practices.
Material impacts, risks and opportunities This policy is developed to address the material human rights and labor-related impacts and risks present within our operations and value chain, as presented in tables 4 and 5. G2 Ocean’s cargo operations can expose employees and suppliers to significant dangers, such as life-altering injuries. Additionally, there is a risk that poor working conditions, inadequate living arrangements, or a high frequency of safety incidents aboard vessels could result in substantial business losses and negatively affect G2 Ocean’s reputation. Ethical conduct and labour standards G2 Ocean’s Code of Business Ethics further describes our commitment to upholding fundamental human rights throughout our operations and supply chain by outlining our policy against any use of forced, compulsory or child labour. In this document, we also describe our commitment to fighting human trafficking and forced labour, ensuring that we and our partners always uphold and safeguard human rights
67
Management report Sustainability statements
Figure 3
Own workforce
Characteristics of our own workforce
G2 Ocean’s workforce consists of 320 (329 in 2024) employees and 8 (14 in 2024) non-employees. The slight decrease in total number of own employees compared to 2024, is due to standard workforce fluctuations. The reduction in the number of non-employees is primarily due to the departure of a seconded staff member from the Brazil office, who is no longer with G2 Ocean. Additionally, the demand for consultants in 2025 declined as several projects reached completion and some consultants, who had been temporarily covering parental leave, were no longer required.
All numbers are reported in headcount at the end of the reporting year. Total turnover is calculated by dividing the number of employees who left G2 Ocean during the reporting period by the total of employees on 31 December 2025. Note 8 in the Financial Statements covers employee expenses.
Total number of employees
Full-time employment is standard to all G2 Ocean permanent employees. Temporary contracts are occasionally offered to either interns or temporary substitutes for permanent employees. Part-time employees are defined as individuals whose scheduled working hours are less than 100% of the standard full-time hours.
Female 130
Total employees
320
G2 Ocean does not have any non-guaranteed employees within its workforce. This means that all individuals working for the Company, whether employees or non-employees, have defined terms and are not engaged on zero-hour or non-guaranteed contracts.
Male 190
Average number of employees: 324.5
EMPLOYEES Individuals who are in an employment relationship with G2 Ocean.
NON-EMPLOYEES Non-employees are people who do not have direct employment with G2 Ocean but still work for the Company. This includes seconded employees who are assigned to help with a project or department, as well as consultants hired to offer specialised services or expertise. Non-employees are hired through an agency-type agreement that meets specific criteria: • The person is employed by G2 Ocean through an external organisation
Turnover and Leavers In 2025, a total of 27 employees departed from G2 Ocean during the reporting period, marking a reduction from the 38 employees who left in 2024. Consequently, the employee turnover rate decreased to 8.3%, down from 11.6% in the previous year.
• The work will mainly be carried out at G2 Ocean’s offices. • The work of the person is controlled by G2 Ocean To date, none of our non-employees have been classified as self-employed individuals or as non-employees participating in employment-related activities.
68
MANAGEMENT REPORT
Introduction
Total number of employees by country for those countries with 50 or more employees
About G2 Ocean
Sustainability statements
General information
Environment
Social
Norway
USA
62
51
Total
205 Philippines
92 Total number of employees, by gender, by country for those countries with 50 or more employees
USA
Norway
15
18
USA
36 Female Total
Male Total
93
112
Norway
44
Philippines
Philippines
32
60
The average number of employees in countries with 50 or more employees was 68.
Total number of employees by contract type and gender
316
316
4 Number of permanent employees
0
4
Number of temporary Number of non-guaranteed employees hours employees
Number of full-time employees
Number of part time employees
Female 128
Female 2
Female 0
Female 127
Female 3
Male 188
Male 2
Male 0
Male 189
Male 1
69
Financial statements Governance
Appendix
Management report Sustainability statements
Material impacts, risks and opportunities As described in Table 26, the topic 'Own workforce' is material for G2 Ocean because the company's cargo operations expose certain employees, particularly Port Captains, to significant health and safety risks, including the potential for life-impacting injuries. Additionally, G2 Ocean's training and skill development activities have a positive impact on its workforce and operations. G2 Ocean has not identified any significant impacts on its workforce resulting from environmental transition initiatives. Furthermore, there are no operations or countries within our organisation where increased risks of child labor, forced labor, or compulsory labor have been observed. At this time, we have not identified any material risks or opportunities related to our own workforce.
Table 25 Material impacts, risks and opportunities: Own workforce Material matters
Scope
Description of materiality
G2 Ocean’s cargo operations may lead to life impacting (high consequence) injuries for employees involved. (-)
Own operations
G2 Ocean’s cargo operations place certain members of our workforce, particularly Port Captains, at health and safety risk. Port Captains, who make up 8% of our employees, are directly exposed to hazards such as the use of cranes, movement of heavy cargo, manual handling, and the potential for slips, trips, falls, and crush injuries during port and vessel operations. While most of our employees work in office environments and are not exposed to these risks, Port Captains—and occasionally other operational staff—play an important role in supervising and monitoring cargo operations and are therefore vulnerable to incidents that may lead to severe injuries.
G2 Ocean's focus on training and skill development can lead to safe practices and business continuity for the Company. (+)
Own operations
By providing employees with training and development opportunities, G2 Ocean reduces the risk of workplace incidents and contributes to a safe, resilient, and productive workforce. While our training and skill development activities are primarily targeted towards our own employees, non-employees—such as contractors or seconded staff—may also benefit when they participate in voluntary training sessions offered by the Company. This approach not only safeguards our operations and upholds high business standards, but also helps to minimise potential disruptions, thereby contributing to sustained business performance.
Material impacts
1
1
(+) symbolises a positive impact whereas (-) symbolises a negative impact
Engagement with our own workforce
Engagement is further strengthened through our performance management processes. Conducted twice a year, these processes allow employees to discuss job satisfaction, achievements, and development opportunities with their manager. In addition, employee representatives take part in local workplace environment committees that hold regular quarterly meetings with the Manager of Organisational Development to address issues protecting employee interests. Furthermore, each of our offices have social committees with allocated budgets to organise employee activities and events. These initiatives help ensure every employee feels included, strengthen team spirit, and contribute to a positive workplace culture.
Engaging with our workforce is essential to identify and manage actual and potential impacts, risks and opportunities related to our own workforce. The Managing Director of Organisational Development holds the overall responsibility for employee engagement and involvement, supported by G2 Ocean’s global HR Team. It should be noted that G2 Ocean does not have any Global Framework Agreement or other agreements with workers' representatives relating specifically to the respect of human rights of its own workforce. Annual employee engagement surveys are conducted to monitor satisfaction and gather valuable input, which informs our assessments of impacts, risks, and opportunities. All of G2 Ocean’s own employees are invited to participate in the survey. Survey findings and corresponding action plans are communicated to the Board, Leadership Team, and the broader organisation to ensure transparency and continuous improvement.
Recognising the importance of employee involvement in health and safety matters, we also provide multiple channels for sharing improvement proposals or raising any concerns—via management, our digital reporting system, or our confidential external reporting channel. Safety ambassadors and committees have been established in Norway, the Philippines, and Italy, as required by local legislation. They meet regularly to review workplace conditions and request
70
MANAGEMENT REPORT
Introduction
corrective actions where necessary. These committees are empowered to escalate matters to national authorities if needed.
About G2 Ocean
Sustainability statements
General information
Environment
Social
Financial statements Governance
Appendix
against any person submitting a report, ensuring that all employees, suppliers, and stakeholders can voice concerns without fear of adverse consequences. The policy is available on our external website.
The effectiveness of workforce engagement initiatives is evaluated through metrics such as employee survey results, training participation rates, and incident report numbers, ensuring continued improvement and accountability across all areas of our operations.
Information about our reporting channels and whistleblowing procedures are communicated to employees via our intranet and suppliers through the Supplier Code of Conduct, with masters instructed to report health and safety concerns directly to G2 Ocean. Additionally, we promote open engagement through meetings with port captains, stevedores, and vessel managers, facilitating the sharing and resolution of incident reports. We actively encourage our workforce to report suspected violations of laws and regulations through all available channels, and every report is taken seriously, with thorough follow-up to ensure effective remedies.
Remediation G2 Ocean is committed to the timely and just remediation of all negative impacts, operating in compliance with relevant legislation. Our approach prioritises proactive measures to prevent the need for remediation, but when cases do arise, we seek fair and swift resolution that involves all affected parties. Scope of remediation The Scope of our remediation covers both our workforce and those in our value chain, addressing environmental impacts from pollution and climate change, social impacts on human rights and working conditions, and governance impacts such as corruption, bribery, and business ethics violations.
As of today, G2 Ocean has not had any cases resolved via remediation, and therefore we do not assess whether the remedy provided is effective. The remedy process at G2 Ocean involves several steps to ensure grievances are resolved and appropriate actions are taken. It should be noted that G2 Ocean has not assessed whether people are aware of, or trust, this process as a way to raise their concerns or needs and have them addressed.
Remediation options are tailored to the nature of each case and may include apologies, financial or non-financial compensation, injunctions or guarantees of non-repetition, acceptance of punitive sanctions, restitution, restoration, or rehabilitation.
Policies Policies are in place to manage impacts, risks and opportunities related to our own workforce. These are outlined in the following sections, where our material topics concerning our own workforce are specified. In addition to the policies mentioned in the topic-specific sections, G2 Ocean has implemented both a Bullying and Harassment Policy and an Equal Opportunities Policy. These policies demonstrate our commitment to eliminating discrimination—including harassment—and promoting equal opportunities across the organisation. They explicitly state that individuals working with or interacting with the Company must not experience harassment, intimidation, or victimisation on grounds such as gender, race, colour, ethnic or national origin, sexual orientation, marital status, religion or belief, age, trade union membership, disability, or any other personal characteristic. Such behaviour constitutes gross misconduct and will lead to disciplinary action.
Oversight and standards The remediation process, as illustrated in Illustration 14, is overseen by the Director of Compliance, Risk, and Business Processes, and is conducted in accordance with the UN Guiding Principles on Business and Human Rights and the OECD Guidelines for Multinational Enterprises. Any completed remediation processes will be internally reviewed to ensure appropriate outcomes, and engagement with governmental entities, NGOs, and industry associations will be undertaken as required to reach settlements acceptable to all stakeholders. Reporting channels and stakeholder engagement We provide multiple accessible channels for raising complaints or concerns. Employees and stakeholders may contact our Ethics and Compliance team directly or use our confidential Ethics Helpline, which is hosted by a third-party provider (Navax Global). Reporting options are clearly available on our intranet and website, and their accessibility and effectiveness are reviewed during internal and external audits. In 2025, no reports were received from our employees. However, one report was submitted by an external supplier with a concern about dealing with a sanctioned party. Following a comprehensive investigation, it was determined that there was no significant risk to the company or G2 Ocean. As a result, the case was formally closed, and no further action was required. No financial fines, penalties, or compensation were deemed necessary or applicable.
G2 Ocean has no policies targeting specific groups within our workforce. No groups at particular risk of vulnerability have been identified; consequently, there are no explicit policy commitments related to inclusion or positive action for such groups. To prevent and mitigate discrimination, as well as ensure advancement of diversity and inclusion, all policy development follow a structured process in which final approval rests with the Board. The relevant functions contribute input based on the policy’s Scope, and the Director of Compliance, Risk, and Business Process is responsible for leading this initiative.
The Director Compliance, Risk and Business Process is appointed to handle whistleblowing reports and has received training by the supplier of the whistleblowing system. To protect individuals who raise concerns or report suspected violations through our reporting channels, we have implemented a whistleblowing policy. This policy explicitly prohibits retaliation 71
Management report Sustainability statements
Illustration 13 G2 Ocean’s remedy process
1
2
Filing the grievance
Acknowledgment
The complainant submits their grievance through the established channels, describing the complaint and providing necessary documentation.
Depending on which channel is used to submit the report, G2 Ocean or our third-party partner acknowledges receipt of the grievance and informs the complainant about the next steps.
3
4
Investigation
Assessment
An investigation is conducted to gather facts and evidence, which may include interviews, document reviews, and site visits.
The findings are assessed to determine the validity of the grievance and the necessary actions
5
6
Resolution
Implementation
A resolution is proposed, which could include apologies, financial or non-financial compensation, prevention of harm through injunctions or guarantees of non-repetition, acceptance of punitive sanctions, restitution, restoration, rehabilitation, or other remedies. The complainant is informed of the resolution.
The agreed-upon remedies are implemented, with steps taken to ensure compliance and follow-through.
7
8
Monitoring
Improvement
The resolution is monitored to ensure the grievance has been effectively addresse
Any completed remediation process will undergo an internal review to evaluate its effectiveness.
72
MANAGEMENT REPORT
Introduction
About G2 Ocean
Sustainability statements
General information
Environment
Social
Financial statements Governance
Appendix
Health and Safety Health and safety is a material topic for G2 Ocean because our cargo operations may impact the health and safety of employees directly involved in our cargo operations. By effectively managing these impacts through implementing strong health and safety measures, we not only safeguard the wellbeing of our workforce but also protect our reputation and operational continuity.
Strategic Actions Meetings. All reporting follows internal control procedures to ensure data accuracy and continuous improvement. This frequent and structured reporting approach enables us to identify areas for improvement and implement preventative measures, thereby reducing future risks and safeguarding our employees. While we have not engaged directly with our wider workforce or workers’ representatives in tracking performance or identifying lessons learned and improvement actions related to these targets, the wider workforce is encouraged to contribute to our health and safety performance through the individual objectives set at the beginning of each year.
Ambition, targets and metrics As specified in our Sustainability Strategy, our ambition is to become an industry leader in safety. By aiming for the highest standards in safety, we seek to protect our employees from workplace injuries, ensure their wellbeing, and maintain a positive reputation. Strong safety practices also help prevent business disruptions, reduce financial losses from accidents, and support G2 Ocean’s long-term success.
Table 26 provides a summary of our targets, the corresponding metrics, and our performance in relation to each. None of our metrics are validated by an external body other than our assurance provider.
Policies
To achieve this ambition, we have set the following targets for our own workforce:
The following policies have been developed to meet the aforementioned health and safety targets, and address our material health and safety impact, as outlined in Table 25.
• Target 1: Maintain a safe and incident-free working environment for G2 Ocean employees (incl. non-employees and seconded employees)
Occupational Health and Safety policy Our Occupational Health and Safety policy emphasises the prevention of workplace injuries, continual improvement in health and safety standards, and developing a culture where safety is a shared responsibility. The policy mandates near-miss reporting and root cause analysis as essential elements of our ongoing safety improvements, supporting our commitment to proactively addressing risks and continuously working to enhance our safety performance.
• Target 2: Improve our safety culture, ultimately reaching the top level of the Safety Maturity Ladder – a framework tool used to assess organisation’s safety culture level These targets are designed to effectively manage the health and safety impacts that are most material to our workforce. Target 1hey hasve been developed by our subject-matter experts in our HR and HSEQ departments as part of our strategy process. Target 2 was developed in by the HSEQ departments at G2 Ocean, Gearbulk and Grieg, as this is a mutual target for us and our shareholders. We have not engaged directly with our wider workforce or workers’ representatives in setting these targets. Both targets haveconsidered and received Board approval as part of our annual strategy review.
The Occupational Health and Safety Policy apply to the entire G2 Ocean workforce, encompassing all employees, and non-employees, as well as all business units and operations worldwide. It covers the full range of company activities, ensuring consistent health and safety standards across all our operations.
In order to measure our progress towards these targets, we use a range of metrics. These include:
The Director Fleet Operations holds the highest level of accountability for implementing the Occupational Health and Safety Policy, reporting directly to the CEO. Our HSEQ Manager, local safety ambassadors, and the Leadership Team provide additional support for policy execution throughout the organisation.
• Number and rate of recordable accidents – By monitoring the frequency and occurrence of workplace incidents, this metric directly supports Target 1. • Number of fatalities as a result of work-related injuries – This metric underpins our commitment to the highest safety standards and is integral to Target 1.
The policy aligns with international frameworks, including the UN Guiding Principles on Business and Human Rights and International Labour Organization (ILO) conventions. Mechanisms for monitoring adherence to international standards are outlined in the Human Rights chapter.
• Number and rate of high-consequence injuries – Tracking severe injuries allows us to assess the impact and effectiveness of our safety initiatives, which is essential for achieving Target 1.
The policy was revised in July 2025 to be aligned with ESRS requirements and ensure consistency with our policy document format. The revised policy has been reviewed and approved by the Board.
• Level on the G3 Safety Maturity Ladder – This benchmark measures our overall progress in building a robust safety culture and is directly tied to Target 2.
The Policy is accessible to both internal and external stakeholders via our intranet and website.
Monthly reports on performance agains these targets is monitored by the HSEQ function in our ESG Team, who tracks progress on an ongoing basis and reports monthly are submitted to the Leadership Team and Board, with additional quarterly updates during our quarterly
73
Management report Sustainability statements
Code of Business Ethics Our Code of Business Ethics provides a clear framework for ethical conduct at G2 Ocean, reflecting our commitment to maintaining a healthy, safe, and secure workplace. We prioritise the well-being of our workforce by promoting respect, tolerance, and professional development, while expecting all employees to uphold safety standards and contribute positively to the working environment.
strategy review process, and are managed by our HSEQ Manager, who holds responsibility for monitoring our impacts, risks, and opportunities associated with this material topic. Progress on these initiatives is reported by the HSEQ Manageron in our quarterly Strategic Actions Meetings to ensure continuous improvement. For further details regarding the management of our sustainability activities, please see ‘G2 Ocean’s ESG Governance structure’.
These health and safety commitments apply to all G2 Ocean employees, members of the Board of Directors, and non-employees acting on behalf of the Company. The Code’s requirements are relevant in every country where G2 Ocean operates and extend to all operational contexts, ensuring a consistent standard for workplace safety.
Training In April 2025, the Company organised a dedicated Safety Week, featuring a variety of sessions—both digital and in-person—to promote safety awareness and responsible behaviour among employees. Activities included discussions on safety culture, operational safety risks, and a review of our safety maturity assessment results.
All employees and contractors are responsible for being familiar with, and consistently following, the Code’s health and safety standards. Our Director Compliance, Risk and Business Process is responsible for monitoring and supporting compliance with these standards, ensuring that safety is never compromised.
A webinar on safety was also organised for employees in November as part of our sustainability webinar series, providing information on emerging trends, key health and safety impacts, risks and opportunities, as well as our risk mitigation actions and overall performance in health and safety.
Employees are encouraged to seek guidance from their supervisors, department heads, or the Director Compliance, Risk and Business Process if they have questions or concerns related to health and safety or potential breaches of the Code. Reporting of any safety-related concerns is considered a loyal act and is treated responsibly, with assurances against negative consequences for those who raise issues in good faith.
Furthermore, safety moments—brief discussions at meetings focused on a specific safety topic or issue—were presented at key meetings, including all our town hall meetings, to emphasise the importance of a proactive safety culture. We plan to continue these training activities in 2026 as part of our ongoing commitment to developing a proactive safety culture. We also intend to provide training to employees on safety-related subjects via our digital platform.
The Code of Business Ethics was revised in 2025 to ensure alignment with internal policy updates, the ESRS standards, as well as consistency with our policy document format. The revised document was reviewed and approved by the Board of Directors. The changes to the Code have been communicated to employees and the policy is accessible both via our intranet and external website.
Risk management A key focus in 2025 was strengthening our workforce’s ability to manage safety risks associated with daily tasks. To support this, risk management was established as a separate topic within internal audit interviews. This initiative promoted our ‘Risk dialogue’ methodology, encouraging employees to proactively identify, assess, and mitigate risks as part of their routine activities.
Health and safety management system In addition to our policies, we have a health and safety management system which supports the ongoing management and reduction of health and safety risks across the organisation. This system is applicable to all of our employees. For non-employees engaged by G2 Ocean in 2025, while the system itself does not formally apply to them, we maintained oversight of their injury rates and ensured their inclusion in risk mitigation activities, such as participation in workplace fire drills.
We also implemented a digital Risk Management System, to streamline risk identification and tracking, ensuring timely interventions and continuous improvement in safety practices. In 2026, we will continue to strengthen proactive risk dialogue throughout the organisation. Building on our previous initiatives, we will enhance the use of our digital Risk Management System by integrating incident reporting directly with risk management processes. This will enable more effective identification, assessment, and mitigation of risks, while ensuring that lessons learned from incidents are systematically incorporated into ongoing risk management and continuous improvement activities.
The system covers our established procedures for hazard identification, risk management, audits, and reviews. Routine vessel inspections and the preparation of loading and discharging reports were carried out, alongside internal audits with a continued focus on employee and vessel safety. Additionally, the system integrates an incident reporting and analysis platform, as well as ongoing health and safety training for staff, as further described under ‘Actions’.
Reporting We maintained our focus on safety incident reporting throughout the year, prioritising the proactive identification and reporting of near misses, non-conformities, and opportunities for improvement. For all high-risk incidents, a thorough root cause analysis was conducted to ensure that underlying factors were identified and effectively addressed. Preventive actions were developed for every safety
Actions To effectively manage and mitigate minimise our health and safety impacts, we have implemented several initiatives in 2025. These actions were selected to drive progress against our objectives and to ensure that our operations do not result in material negative impacts on our workforce. The actions were identified as part of our 2025 annual
74
MANAGEMENT REPORT
Introduction
About G2 Ocean
Sustainability statements
General information
Environment
Social
Financial statements Governance
Appendix
Methodology: Health and safety – Own workforce
incident report, with clear accountability for implementation and ongoing monitoring to ensure timely completion. The adoption and effectiveness of these actions were verified through both internal and external audits. Additionally, insights and "lessons learned" from reported incidents were shared across the organisation to promote continuous learning and reduce the likelihood of recurrence. Safety incident reporting is considered an important ongoing initiative, with the time horizon for completing these actions extending over the long term, as we continue to embed proactive safety management and continuous improvement throughout the organisation.
We use the ESRS definition for work-related incidents and accidents. Work-related incidents Work-related incidents occur out of or in the course of work that could or does result in injury or ill health. Incidents might be due to, for example, electrical problems, explosion, fire, overflow, overturning, leakage, flow, breakage, bursting, splitting, loss of control, slipping, stumbling and falling, body movement without stress, body movement under/with stress, shock, fright, workplace violence or harassment (e.g. sexual harassment).
Safety Maturity Assessment The Safety Maturity Assessment, previously completed in 2021, was repeated in 2025 to review the progress in our safety culture and management systems, as well as any improvements made since the 2021 assessment. This initiative evaluated G2 Ocean’s work practices, safety behaviours, leadership commitment, and health and safety engagement at all organisational levels. The assessment, which utilised both online surveys and interviews with targeted employees, demonstrated measurable progress, with G2 Ocean advancing from a ‘Calculative’ to a more ‘Proactive’ stage of safety maturity. Notable improvements were observed in safety communication, risk management, and executive commitment, reflecting a growing dedication to a proactive safety culture. However, the assessment also identified opportunities to further enhance safety reporting, learning and development, particularly through consistent follow-up and structured post-voyage reviews. In response, G2 Ocean has implemented an action plan to streamline reporting, strengthen root cause analysis, accelerate incident closure, and further develop safety training, supporting the Company’s ambition of zero safety incidents and ongoing cultural improvement. These initiatives will continue in 2026, with the next Safety Maturity Assessment to be conducted in coming years.
Accidents An incident that results in injury or ill health is often referred to as an accident. An incident that has the potential to result in injury or ill health but where none occurs is often referred to as a “close call”, “near-miss”, or “near-hit”.
Performance The performance for 2025 is line with expectations and unchanged from the previous year. Target 1 was fully met, as we achieved a safe and incident-free year, with zero recordable accidents, no fatalities from work-related injuries or ill health, and no high-consequence injuries among our own workforce. Additionally, no incidents of discrimination, including harassment, were reported in 2025. Target 2 was partly met, as our safety maturity assessment indicated that we are currently positioned between level 3 (calculative) and level 4 (proactive) on the Safety Maturity Ladder. This means G2 Ocean’s overall safety maturity has progressed from being classified as ‘Calculative’—where safety systems are in place and risks are managed primarily through established processes—to nearing the ‘Proactive’ level. At this stage, the organisation is not only maintaining robust safety systems but is actively fostering a culture where safety is prioritised, potential issues are anticipated before they arise, and continuous improvement is encouraged. This positive development reflects a shift towards more forward-thinking and preventative safety practices across the business. We will continue to focus on strengthening our safety culture and are actively working to progress further up the ladder.
75
Management report Sustainability statements
Table 26 Targets, metrics and performance: Own workforce - Health and safet
Objective
Maintain a safe and incident-free working environment for G2 Ocean’s workforce (incl. both employees and non-employees)
Improve our safety culture, ultimately reaching the top level (Generative) on the Safety Maturity Ladder.
Baseline (year)
Metric
2023
2024 (actual)
2025 target
2025 (actual)
Mediumterm target (2028)
Long-term target (2040)
Number and rate of recordable work-related accidents
0 (2022)
0
0
0
0
0
0
Number of fatalities as a result of work-related injuries and work-related ill health **
0 (2022)
0
0
0
0
0
0
Number and rate of highconsequence injuries*
0 (2022)
0
0
0
0
0
0
The number of days lost to workrelated injuries and fatalities from work-related accidents, work-related ill health and fatalities from ill health**
0 (2022)
0
0
0
0
0
0
3– Calculative (2023)
3– Calculative
3– Calculative
4– Proactive
3.5 – Calculative with proactive tendencies
4– Proactive
5– Generative
Level on the Safety Maturity Ladder*
Table 27 Methodology: Health and safety – Own workforce Metric
Unit
Methodology
Fatalities
Number
Number of fatalities as a result of work-related injury.
High-consequence injuries
Number
Number of injuries from which the worker cannot recover (e.g. amputation of a limb) or does not or is not expected to recover fully to pre-injury health status within 6 months.
Recordable work-related accidents
Number
Number of work-related accidents causing injuries that results in any of the following outcomes: death, days away from work, restricted work or transfer to another job, medical treatment beyond first aid, or loss of consciousness; or significant injury diagnosed by a physician or other licensed healthcare professional, even if it does not result in death, days away from work, restricted work or job transfer, medical treatment beyond first aid, or loss of consciousness.
Rate of high-consequence injuries
Rate
Number of incidents / number of hours worked x 1 000 000.
Rate of recordable work-related accidents
Rate
Number of incidents / number of hours worked x 1 000 000.
76
MANAGEMENT REPORT
Introduction
About G2 Ocean
Sustainability statements
General information
Environment
Social
Financial statements Governance
Appendix
Training and skills development Training and skills development is a material topic for G2 Ocean as it ensures workplace safety, business continuity, and strong performance. By providing employees with new skills and knowledge, we help prevent business risks and minimise operational disruptions. In a rapidly evolving maritime industry, targeted training and continuous development enable our workforce to remain adaptable, resilient, and productive, ensuring we continue to exceed customer expectations.
Performance against these targets is tracked by the HR function in our ESG Team and reported during our quarterly Strategic Actions Meetings, ensuring regular review and continuous improvement. While we do not engage directly with our wider workforce or workers’ representatives in tracking performance or identifying lessons learned and improvement actions related to these targets, employees managing training and development activities provide progress reports. In addition, feedback relating to training and development is gathered through our employee engagement surveys and our performance review processes, where professional development needs and opportunities are discussed.
Ambition, targets and metrics Through our sustainability strategy, we aim to support every employee’s professional growth, recognising that ongoing improvement benefits both engagement and company performance.
Performance against these metrics is summarised in Table 28, which provides a clear overview of our targets, metrics, and outcomes achieved. Except for assurance provided by our independent provider, none of these metrics are externally validated.
To achieve this ambition, we have set four targets: • Target 1: Develop employees’ skills and leadership capabilities • Target 2: Increase employee engagement • Target 3: Promote a culture of continuous growth and development, where employees receive regular feedback, set goals, and receive support to enhance their performance and advance their careers within G2 Ocean.
Policies G2 Ocean manages its material impact related to training and skills development for its workforce, as specified in Table 25, through two key policies; the Code of Business Ethics and the Diversity, Equity and Inclusion (DEI) policy. While there is no standalone policy dedicated solely to the aforementioned targets related to training and skills development, the organisation is committed to encouraging personal development and enhancing relevant business skills as part of its efforts to create a positive working environment. This commitment is embedded within the Code of Business Ethics.
• Target 4: Strengthen internal career advancement by increasing the proportion of leadership positions filled through internal promotions In setting these targets, we used inputs and data received from various engagement activities with our workforce, including working environment committee meetings, annual training planning meetings and training feedback questionnaires, and the succession planning exercise with managers. Each target has undergone Board review and approval as part of our annual strategic review process.
Our DEI policy highlights G2 Ocean’s commitment to fostering a workplace where all employees are valued and supported in their professional growth. Our DEI principles are integrated into our employee development activities, ensuring that training and skills development opportunities are accessible to all staff members regardless of background, and fostering an inclusive environment that supports equity and diversity throughout the organisation.
To monitor and evaluate our progress towards these objectives, we use a set of metrics, including: • Average hours of training per employee per year: This metric assesses the extent of investment in employee development, directly supporting Target 1.
The effectiveness of these efforts is monitored via our Quarterly Strategic Actions Meetings, employee engagement surveys, performance reviews, and participation tracking in training programmes, with outcomes informing continuous improvement.
• Employee Engagement Survey Scores related to key statements such as: • “My job role is engaging to me.” • “I show enthusiasm for G2 Ocean and my work tasks.” • “I like the working environment I am part of.”
The Scope of the DEI policy covers all employees and all aspects of employment, including recruitment, promotion, training, and working conditions.
These survey scores track the level of employee engagement, measuring our progress against Target 2.
The Managing Director of Organisational Development is responsible for implementation of the policy. The full policy is available to employees on our intranet and can also be seen on our external website.
• Percentage of employees receiving regular performance and career development reviews: This metric evaluates how consistently employees are provided with feedback and development opportunities, supporting Target 3.
Actions In 2025, G2 Ocean undertook a number of training and skills development initiatives to achieve the aforementioned targets. These activities were chosen during our 2025 annual strategy review process to ensure effective management of our training and skills development impacts. The HR team leads these efforts in collaboration
• Proportion of leadership recruitment from internal promotions: By measuring the percentage of leadership roles filled by internal candidates, we monitor the effectiveness of our commitment to internal career progression, which is central to Target 4. 77
Management report Sustainability statements
Internal career advancement initiatives We strengthened internal career progression by promoting vacant leadership positions within the Company and regularly assessing internal candidates. This initiative specifically targets talented and high-performing employees, identified through performance review results and succession planning with managers. This approachBy recognising and advancing the career of these individuals, we ensured that talented employees were recognised and given opportunities to advance, supporting support both individual personal growth and organisational success.. This is an ongoing initiative, with no specific completion date, as we remain committed to continuously supporting internal career advancement and nurturing leadership talent within the organisation.
with relevant departments, and progress reports are shared in our Quarterly Strategic Actions meetings. All of the initiatives implemented throughout 2025 will be continued in 2026. Annual training plan We developed an Annual Training Plan covering four main areas: onboarding, up to speed, knowledge boost, and toolbox upgrade. Training sessions were made available to all employees, including the Leadership Team, and promoted through our intranet and other communication channels to maximise participation. Employees were encouraged to suggest training topics, ensuring sessions remained relevant and strategically aligned. Additionally, we expanded opportunities for external courses and provided “Train the Trainer” sessions to develop our internal trainers’ capabilities. The expected outcome of this initiative is to enhance workforce skills, drive employee engagement, and ensure all staff are equipped to meet both current and future business needs. The training plan operates on an annual cycle, and the 2025 programme was completed at the end of the calendar year. A new plan will be created for 2026.
Performance The 2025 results, as reported in Table 28, show a notable improvement compared to previous years and, in most cases, meet or exceed the short-term targets set for the year. The average number of training hours per employee in 2025 was 23.76, which is a significant increase from the previous years (14.4 in 2022, 10.4 in 2023, and 5.4 in 2024). Although the 2025 target of 25 hours was narrowly missed, the progress achieved underscores our increased focus on upskilling and building leadership capabilities across the workforce.
Leadership development Leadership training was prioritised, with 20 senior managers participating in an intensive programme, focused on enhancing collaboration, strategic alignment, and practical leadership skills. Feedback from participants was collected to inform future leadership training activities, ensuring continuous improvement in our leadership development efforts. This initiative is an ongoing effort, with no specific timeline for completion, as we are committed to continuously strengthening our leadership capabilities across the organisation.
Employee engagement scores in 2025 were slightly below our 2025 target, with scores of 3.33 (job engagement), 3.46 (enthusiasm), and 3.37 (work environment). Compared to previous years, there is a marginal decline from 2023 and 2024, where scores were consistently above 3.45. While the organisation did not fully meet the 2025 target, the results remain close and highlight areas for further improvement to ensure sustained high engagement levels.
Employee engagement To assess employee satisfaction and engagement, we conducted a confidential company-wide survey. Insights from this survey will be used to develop local action plans to address challenges and opportunities. Results and actions were communicated organisation-wide, ensuring transparency and acknowledging employees’ contribution in shaping a positive working environment. The employee engagement initiative is designed as an ongoing process, with no specific timeline for completion, ensuring that regular engagement surveys and feedback mechanisms remain a central aspect of our organisational culture. In 2026, we will implement action plans focused on addressing identified areas for improvement and further enhancing engagement levels. These plans will be reviewed and refined based on survey results and employee input, supporting our commitment to long-term employee engagement.
In 2025, 95% of employees participated in regular performance and career development reviews, which is slightly below the 2025 target of 100% but represents an improvement compared to 92% in 2024. The slight shortfall is attributable to employees on probation, leave, or notice periods. The percentage of total leadership recruitment from internal promotions reached 83% in 2025, significantly surpassing both the 2025 target of 50% and previous years’ results (58% in 2023, and 45% in 2024). This improvement demonstrates our effective support for internal career progression and leadership development.
Performance review processes Our performance review processes in 2025 included our objective-setting, mid-year review, and year-end review, with all employees being invited to participate. In these sessions, managers and employees discussed progress against personal objectives and development needs, facilitating good performance and talent development. The expected outcome of this initiative is to support continuous employee growth, enhance performance, and ensure that employees are equipped to contribute to organisational objectives. This is an annual initiative, with each process-objective-setting, mid-year review, and year-end review—completed within the reporting year.
78
MANAGEMENT REPORT
Introduction
About G2 Ocean
Sustainability statements
General information
Environment
Social
Financial statements Governance
Appendix
Table 28 Targets, metrics and performance: Training and skills development
2023
2024 (actual)
2025 (Short-term target
2025 (Actual)
Medium term target (2028)
Long term targets (2040)
Target
Metric
Baseline (year)
Developing employees’ skills and their leadership capabilities.
Average number of training hours per employee
14.4 (2022)
10.4
5.4
25
23.76
60
88
Increase employee engagement.
Scores (overall mean) related to these statements in the Employee Engagement survey: a. “My job role is engaging to me” b. “I show enthusiasm for G2 Ocean and my work tasks” c. “I like the working environment I am part of”*
a. 3.47/4 b. 3.60/4 c. 3.45 /4 (2023)
a. 3.47/4 b. 3.60/4 c. 3.45 /4
a.3.43/4 b.3.55/4 c.3.43/4
All above 3.5
a.3.33 b.3.46 c.3.37
All above 3.5
All above 3.5
Promote a culture of continuous growth and development, where employees receive regular feedback, set goals, and receive support to enhance their performance and advance their careers within G2 Ocean.
Percentage of employees that participated in regular performance and career development review.
100% (2022)
100%
92%
25
95%***
100%
100%
Strengthen internal career advancement by increasing the percentage of internal promotions to leadership positions**.
Percentage of total leadership recruitment coming from internal promotions*
58% (2023)
58%
45%
50%
83%
70%
80%
*G2 Ocean-specific metric **Leadership positions is defined as manager, director and C-level *** The proportion of reviews to the number agreed by Management is also 95%.
Table 29 Gender indicator table, performance reviews participation, by genderlevel in number and percentage Number
Pourcentage
Female
124
41%
Male
180
59%
Total
304
100%
Table 30 Average number of training hours per person, by gender: Total training hours, female
Total number of females
Average training hours per employee, female
4016.64
130
30.90
Total training hours, male
Total number of males
Average training hours per employee, male
3587.99
190
18.65
Total training hours, all employees
Total number of employees
Average training hours per employee
7604
320
23.76
79
Management report Sustainability statements
Methodology: Training and skills development The metrics related to performance reviews are based on data from our HR system, on mid-year reviews and year-end reviews and objective-setting reviews completed in the reporting period.
G2 Ocean bases the metrics related to training and skills development, on headcount report from our HR system, and training attendance reports, including virtual training through Teams, physical trainings, and trainings completed through G2 Ocean Academy.
Table 31 Methodology Training and skills development Metric
Unit
Methodology
Average hours of training per year
Number of average hours spent on internal training
Hours employees have spent on internal training / total number of employees.
Percentage of employees receiving regular performance and career development reviews
Percentage
Employees who have received reviews / total number of employees.
Scores (overall mean) related to these statements in the Employee Engagement survey:
Number
Employees who “My job role is engaging to me.”, “I show enthusiasm for G2 Ocean and my work tasks.”, or “I like the working environment I am part of.” / total number of employees."
“My job role is engaging to me.”,
Percentage
Leadership is defined as directors, Leadership Team and managers/ senior professionals. Calculated as percentage of internal leadership recruitment of total leadership recruitment (internal and external).
“I show enthusiasm for G2 Ocean and my work tasks.”, or “I like the working environment I am part of.” “I show enthusiasm for G2 Ocean and my work tasks.”, or “I like the working environment I am part of.” / total number of employees.
Percentage
Employees who “My job role is engaging to me.”,
Percentage of total leadership recruitment coming from internal promotions.
Percentage
Leadership is defined as directors, Leadership Team and managers/ senior professionals. Calculated as percentage of internal leadership recruitment of total leadership recruitment (internal and external).
80
MANAGEMENT REPORT
Introduction
About G2 Ocean
Sustainability statements
General information
Environment
Social
Financial statements Governance
Appendix
Workers in the value chain
WORKERS IN THE VALUE CHAIN
In 2025, G2 Ocean worked in partnership with around 200 ports and 450 stevedoring and lashing companies across 48 countries worldwide. Many of these partners operate in environments where there are significant health and safety risks associated with cargo operations. G2 Ocean recognises that, through engaging suppliers to support our shipping operations, we have the potential to affect the health and safety of workers within our value chain. On the other hand, through our proactive efforts, we help create safer working environments and prioritise the wellbeing of our value chain workers, mitigating risks and supporting their well-being.
Our value chain workers include vessel crew members and stevedores who are directly involved in the loading, discharging, and transportation of cargo—activities that are central to G2 Ocean’s business model and carry inherent risks of work-related injuries. While these individuals are not employed directly by G2 Ocean, nor do they work on our sites, we acknowledge our responsibility to understand and mitigate the material impacts and risks related to their health, safety, and working conditions.
This chapter details the key impacts, risks, and opportunities associated with our value chain workforce, outlines our approach to safeguarding their wellbeing, and explains how these efforts support our commitment to responsible business practices.
Material impacts, risks and opportunities The topic ' Workers in the value chain' is material to G2 Ocean because the working conditions of individuals involved in G2 Ocean's operations directly influence their wellbeing, as well as G2 Ocean's business performance. This is further described in Table 33, which outlines the material impacts and risks associated with workers in the value chain. The risks identified are not specific to any particular group of value chain workers, such as those of a certain age, or those in a specific country. Furthermore, G2 Ocean has not identified any significant risks of child labour, forced labour, or compulsory labour among value chain workers. Additionally, we have not identified any material opportunities arising from impacts and dependencies on value chain workers.
Table 32 Material impacts, risks and opportunities: Workers in the value chain Material matters
Scope
Description of materiality
Own operations
Both stevedores and crew are exposed to significant health and safety risks as a result of our cargo operations, which have a direct and material impact on their fundamental human right to a safe workplace. Stevedores, whose primary role involves cargo handling in port, are particularly vulnerable due to the high degree of manual handling required for certain commodities, making them more susceptible to workplace injuries. Crew members, while responsible for monitoring and assisting with port operations and caring for cargo at sea, also face similar risks. These negative impacts are widespread and systemic for those physically present during cargo operations, as evidenced by G2 Ocean’s own and industry accident statistics for stevedores and port workers. The most common injuries include slips, trips, falls, crush injuries from moving cargo, and risks associated with falling objects during crane operations.
Poor technical conditions of the vessel, such as issues with cranes, the hull, or cargo holds, can increase the likelihood of incidents and may result in financial claims.
Own operations
This risk encompasses problems related to the ship's condition such as malfunctioning cranes, damaged hulls, or poorly maintained cargo holds. Technical deficiencies can compromise the safety of the crew and the cargo, increasing the likelihood of operational incidents, delays, or accidents at sea. These events may result in costly repairs, claims from customers or insurers, and disruptions to schedules.
Poor working conditions, inadequate living arrangements, or a high frequency of safety incidents on board the vessels can result in significant business losses and harm to G2 Ocean's reputation.
Own operations
This risk refer to situations where crew members are subjected to substandard environments on board vessels, such as cramped or unsanitary accommodation, insufficient rest, or lack of proper facilities. Such circumstances, if they occur, may lead to health and safety issues for crew, as well as operational challenges and reputational damage for G2 Ocean.
Material impacts 1
G2 Ocean’s cargo operations may lead to life impacting (high consequence) injuries for suppliers involved. (-)
Material risks
(+) symbolises a positive impact whereas (-) symbolises a negative impact
1
81
Management report Sustainability statements
Engagement with value chain workers
monthly operational meetings to review incidents and proactively manage risks. These forums ensure that the perspectives of value chain workers, gathered through incident reporting and safety meetings on board, are systematically considered and acted upon.
G2 Ocean regularly engages with value chain workers to promote their safety and wellbeing, both directly and through proxies who possess insight into their circumstances. Direct engagement occurs via site visits where port captains and operations staff interact with workers at ports and on vessels, assessing safety practices and gathering feedback. Additionally, proxies such as vessel managers, who are formally responsible for crew safety, participate in dedicated safety culture forums and operational meetings to ensure workers’ perspectives are heard and acted upon. Supplier audits, conducted by HSEQ and Compliance teams, further provide insight into value chain workers’ conditions through interviews and inspections. This combination of direct contact and engagement via knowledgeable intermediaries ensures a comprehensive approach to understanding and supporting the needs of value chain workers.
Site visits Port captains and operations department personnel play a key role in engaging with value chain workers. Through daily site visits, they assess safety practices, provide guidance, and collect feedback from workers at ports and on vessels. In addition to daily port call attendance, we also hold regular review meetings with stevedoring companies, with a dedicated focus on both safety and productivity. These meetings provide an opportunity to discuss recent performance, identify areas for improvement, and reinforce our shared commitment to maintaining high standards across all operations.
By encouraging dialogue, setting clear expectations, and monitoring performance, we address workplace risks, support continuous improvement, and foster trust and cooperation—ensuring safer working environments for our workers while protecting our reputation and operational performance.
Supplier audits Supplier audits are an important component of our engagement strategy to strengthen our oversight with value chain workers. These audits are conducted by our HSEQ and Compliance teams to evaluate suppliers’ compliance with health, safety, and ethical standards. The process involves on-site inspections and interviews, ensuring that suppliers uphold our expectations for safe working conditions and responsible practices. In 2025, we completed three supplier audits. The feedback gathered is shared with suppliers to drive corrective actions and foster continuous improvement. Looking ahead, we aim to expand on this initiative by increasing the frequency and Scope of supplier audits.
The Director Fleet Operations holds overall responsibility for the value chain worker engagement activities, ensuring that feedback and insights from these initiatives are integrated into our strategies and practices. In addition, the Director is accountable for assessing the effectiveness of these engagement initiatives by reviewing outcomes from safety forums, site visits, and supplier audits, and implementing improvements where necessary. This ongoing evaluation ensures that our approach remains responsive to worker needs and continues to drive progress towards a safer working environment for our value chain workers. The following section describes our key engagement initiatives.
Reporting mechanisms To facilitate open communication, G2 Ocean provides an ethics helpline available 24/7 for value chain workers to raise concerns confidentially. These mechanisms ensure that issues related to safety, working conditions, or ethical conduct can be reported without fear of reprisal, supporting a culture of transparency and accountability. See ‘Remediation’ for more information.
Engagement initiatives ICHCA collaboration G2 Ocean is an active member of the International Cargo Handling Coordination Association (ICHCA), a non-profit organisation dedicated to improving safety, productivity, and efficiency in cargo handling worldwide. In 2025, we participated in one in-person meeting with ICHCA and plan to continue this annual engagement moving forward. Additionally, ICHCA circulates our monthly Safety Bulletin—twelve editions each year—to its membership, ensuring our safety messages reach a wide industry audience, including shipping companies, ports, terminals, and unions. We also monitor industry developments by reviewing safety alerts and newsletters issued by ICHCA, which we receive several times a month. This ongoing, two-way engagement not only keeps us informed of emerging safety challenges but also enables us to share our own insights, reinforcing our collaborative efforts to foster a safer working environment.
The Director Fleet Operations holds overall responsibility for the value chain worker engagement activities, ensuring that feedback and insights from these initiatives are integrated into our strategies and practices. In addition, the Director is accountable for assessing the effectiveness of these engagement initiatives by reviewing outcomes from safety forums, site visits, and supplier audits, and implementing improvements where necessary. This ongoing evaluation ensures that our approach remains responsive to worker needs and continues to drive progress towards a safer working environment for our value chain workers.
Safety Culture Forum & Operational Meetings We work closely with vessel managers such as Grieg and Gearbulk, who hold formal responsibility for vessel and crew safety. Together, we have established a safety culture collaboration forum that meets every two months, complemented by 82
MANAGEMENT REPORT
Introduction
About G2 Ocean
Sustainability statements
General information
Environment
Social
Financial statements Governance
Appendix
Health and Safety Ambition, targets and metrics
to Gearbulk and Grieg Star crew each year supports our goal of increasing safety awareness (Target 2).
Recognising that the core activities of our business model—the loading and discharging of cargo at port and the transportation of cargo at sea—rely on the support of workers throughout our value chain, we are aware that these individuals, particularly vessel crew members and stevedores, are exposed to significant health and safety risks. Although these workers are not directly employed by G2 Ocean and operate outside our own sites, we acknowledge that their wellbeing is linked to the safety, reliability, and reputation of our operations. By proactively addressing the health and safety impacts of our operations on stevedores and crew, our ambition is to uphold the highest safety standards for all workers in our value chain, striving to avoid any workplace injuries and to safeguard their fundamental human right to a safe working environment.
Monthly reports on performance against these targets are submitted to the Leadership Team and Board, with additional quarterly updates during our quarterly Strategic Actions Meetings. All reporting follows internal control procedures to ensure accuracy and continuous improvement, helping to minimise possible health and safety impacts for workers throughout our value chain. Table 33 provides a summary of our targets, the corresponding metrics, and our performance in relation to each. None of our metrics are validated by an external body other than our assurance provider.
Policies Two central documents underpin our commitment to ensuring safe operations and a healthy working environment for all workers within our value chain: the Human Rights and Decent Work Conditions Policy and the Supplier Code of Conduct. The Human Rights and Decent Work Conditions Policy, as previously referenced, sets out our foundational principles for respecting and upholding internationally recognised standards of human rights and decent work. These policies play an important role in driving progress towards our targets for value chain workers, and enable us to effectively manage the material impacts and risks associated with value chain workers, as specified in Table 32. For more information about our Human Rights and Decent Work Conditions Policy, please refer to the ‘Commitment to Human Rights’ section.
To realise this ambition, we have established the following targets for our value chain workers: • Target 1: Maintain a safe and incident-free working environment for stevedores and crew. • Target 2: Increasing safety awareness amongst Gearbulk and Grieg Star crew. These targets are designed to effectively manage the health and safety impacts that are most material to workers in our value chain. They have beenwere developed by our HSEQ function witin our ESG Team, informed by insights from our shareholders and pool participants, Gearbulk and Grieg, incident and near-miss data, and feedback from stakeholder dialogues. These targets were then reviewed by the ESG Steering Committee and endorsed by our Leadership Team as part our strategy development process. considered andBoth targets have received Board approval as part of our annual strategy review.
Supplier Code of Conduct The Supplier Code of Conduct is a key instrument in operationalising these commitments across our supply network. It establishes clear health and safety expectations, requiring all suppliers—both new and existing—to create and maintain safe, healthy workplaces that protect employees from occupational hazards and minimise risks to physical and mental wellbeing. Specifically, the Code mandates adherence to robust health and safety protocols, accident prevention measures, and the requirement of necessary safety equipment and training. Additionally, the Code strictly prohibits all forms of forced labour, child labour, and human trafficking. Suppliers and agents are required to ensure that no worker is employed under pressure or threat, and that working age requirements are met. These requirements are fundamental to upholding decent work conditions and safeguarding human rights throughout our value chain.
In order to measure our progress towards these targets, we use a range of metrics. These include: • Number of recordable accidents among stevedores – By tracking the number of recordable accidents among stevedores, this metric enables us to monitor workplace incidents and identify trends. This directly supports our commitment to maintaining a safe and incident-free working environment for stevedores (Target 1) by highlighting areas where preventative actions may be required. • Number of fatalities among stevedores and crew – This metric reflects our zero-tolerance approach to workplace fatalities, supporting Target 1.
Applicability of the Supplier Code of Conduct extends to all suppliers and agents acting on our behalf, covering activities associated with port calls, cargo operations, and related engagements. Implementation and oversight of the Code is led by our Chief Executive Officer, who holds senior-level accountability for ensuring supplier compliance and continuous improvement in line with our strategic objectives.
• Number of high-consequence injuries among stevedores – Recording the number of high-consequence injuries among stevedores allows us to focus on severe incidents that have a lasting impact. This metric is important for evaluating the effectiveness of our safety practices and ensuring continuous improvement towards our ambition of an incident-free working environment (Target 1).
The Supplier Code of Conduct is aligned with international frameworks, including the International Labour Organization (ILO) conventions and the United Nations Guiding Principles on Business and Human Rights, ensuring suppliers operate to globally recognised standards.
• Average hours of training for Gearbulk and Grieg Star crew per year: Tracking the average hours of safety and skills training provided 83
Management report Sustainability statements
Safety Bulletin The G2 Ocean Safety Bulletin, introduced in June 2022, is distributed monthly to stevedore companies worldwide, all vessels in our fleet, and other key stakeholders, including ports, agencies, and terminals. The primary purpose of this initiative is to promote a proactive safety culture throughout our value chain by providing regular updates on operational incidents, such as dropped objects, fall accidents, and near misses. Each edition of the Bulletin references our LifeSaving Rules and Safety behaviours, using real-world examples to reinforce best practices and encourage individual reflection among recipients. By systematically sharing lessons learned and highlighting performance-related incidents, the Bulletin serves as an important tool for continuous improvement, supporting injury prevention and fostering collaboration among crew, stevedores, and other partners. The distribution and engagement with our Bulletin have had a positive impact on operational safety standards, contributing to enhanced awareness, reduced incidents, and strengthened commitment to safe working practices across our global operations.
Access to the Code is facilitated via publication on our company webpage; it is formally linked to purchase agreements and further communicated to suppliers and agents during the appointment process for port calls, guaranteeing transparency and consistent engagement across our value chain.
Actions To effectively address health and safety impacts on value chain workers, we implemented a series of targeted initiatives in 2025. These measures were selected to deliver on our strategic objectives and were identified during our 2025 annual strategy review. The actions are managed by our HSEQ Manager, who holds responsibility for monitoring our impacts, risks, and opportunities associated with this material topic. Progress on these initiatives is regularly reported during our quarterly Strategic Actions Meetings. All of the following initiatives will continue into 2026. For further details regarding the management of our sustainability activities, please see ‘G2 Ocean’s ESG Governance’ structure. It should be noted that we do not currently implement targeted actions concerning procurement, sales, or data use with regard to health and safety impacts. Our focus remains on direct operational practices that have the greatest potential to affect stevedores and crew, rather than areas such as procurement activities, commercial sales, or data management.
Performance
Safety training for Gearbulk and Grieg Maritime Crew G2 Ocean, in collaboration with Gearbulk and Grieg Maritime, conducts a safety training programme for vessel crew, covering both digital seminars and physical sessions held twice a year. Participation numbers typically range from 30 to 100 crew members per session.
The number of recordable accidents for stevedores was reduced from 25 in 2024 to 19 in 2025, achieving the set target and continuing the decline since 2022.
Comments to results to be included in January.The 2025 results reflect positive progress toward safety objectives, with most targets either met or showing improvements over previous years. • Target 1: Maintain a safe and incident free working environment
Fatalities among stevedores dropped to zero, attaining our 2025 target and improving from the previous two years, each of which saw one fatality. Crew-related fatalities also continued at zero.
These seminars cover a broad range of operational and safety topics, such as safety culture, fleet performance, effective communication between ship and shore personnel, best practices for voyage planning and cargo operations, incident reporting and claims handling, risk evaluation, equipment management, and more. The objective is to ensure crew members are equipped with the necessary knowledge and skills to uphold high standards of safety and operational efficiency throughout our voyages. These sessions offer practical insights and real-world scenarios that inspire ongoing improvement, leading to enhanced safety behaviours, fewer incidents, and improved performance for G2 Ocean. The training is provided at no cost to participants and is reviewed annually to ensure its continued relevance, with improvements made in response to participant feedback.
In 2025, we recorded one high consequence injury involving a stevedore, a reduction from two such incidents in 2024. The incident occurred when a worker fell approximately three metres inside the cargo hold. The stevedoring company involved had been contracted by the shipper and was not engaged directly by G2 Ocean. Although the root cause of the incident has not been formally communicated to G2 Ocean, we continue to prioritise the management of fall risks in our safety dialogues and engagements with workers across our value chain. Strengthening awareness of fall related hazards remains a key focus area in our ongoing efforts to promote a safer working environment. • Target 2: Increasing safety awareness amongst Gearbulk and Grieg Star crew:
Stevedore training and workshops In addition to crew training, G2 Ocean delivers training and workshops for stevedores, focusing on key safety aspects before and after cargo operations. These sessions include thorough reviews of procedures, interactive workshops, and the sharing of lessons learned from previous incidents. The primary aim is to reinforce safe working practices, promote collaboration, and ensure that all parties are fully engaged in maintaining a safe working environment during cargo handling. Participants gain a deeper understanding of safety protocols and risk mitigation strategies, leading to fewer injuries and improved operational outcomes. For G2 Ocean, these training initiatives contribute to a safer and more efficient cargo operations.
Safety awareness training for Gearbulk and Grieg Star crew surpassed expectations, with 80 hours delivered through 4 webinars and 2 seminars—exceeding the minimum requirement and reflecting the Company's dedication to ongoing safety education and development.
84
MANAGEMENT REPORT
Introduction
About G2 Ocean
Sustainability statements
General information
Environment
Social
Financial statements Governance
Appendix
Table 33 Targets, metrics and performance: Workers in the value chain Health and safety
Objective
Maintain a safe and incidentfree working environment for stevedores and crew
Increasing safety awareness amongst Gearbulk and Grieg Star crew.
2024
2025 (Short-term target)
2025 (Actual)
2026-2030
Over 5 years (Long-term targets)
32
25
25
19
20
15
0 (2022)
1
1
0
0
0
0
Number of high-consequence injuries – stevedores
1 (2022)
1
2
0
1
0
0
Number of fatalities – crew related to cargo operations (nominated and TC fleet)
0 (2022)
0
0
0
0
0
0
Hours of G2 Ocean training for Gearbulk and Grieg Star crew per year
3 webinars and 2 seminar, 60 hours in total (2024)
Data not available*
3 webinars and 2 seminar, 60 hours in total
4 webinars and 2 seminars/ year minimum 60 hours in total
4 webinars and 2 seminars, 80 hours in total
4 webinars and 2 seminars/ year, minimum 60 hours in total
4 webinars and 2 seminars/ year, minimum 60 hours in total
Baseline (year)
2023
Number of recordable accidents – stevedores
40 (2022)
Number of fatalities – stevedores
Metric
Methodology
assess, due to data privacy and other factors limiting the availability of information about the injuries. The categorisation is assessed and verified by a second person, and when in doubt, the higher severity category is chosen.
Work-related incidents and accidents for value chain workers are defined identically to those for G2 Ocean's own workforce; refer to the ‘Methodology: Own workforce’ for details. Regardless of whether stevedoring services are hired by the shipper, G2 Ocean does not distinguish between these categories when recording incidents. Note that the severity of work-related incidents can be difficult to
There have been no significant changes in methodology in this reporting year.
Table 34 Methodology: Workers in the value chain – Health and Safey Metric
Unit
Methodology and assumptions
Number of high-consequence injuries among stevedores
Number
Number of injuries from which the worker cannot recover (e.g. amputation of a limb) or does not or is not expected to recover fully to pre-injury health status within 6 months.
Number of fatalities among crew and stevedores
Number
Only crew fatalities related to cargo operations will be reported, not if the incident resulting in fatality was related to other vessel operations and activities.
Number of recordable work-related accidents among stevedores
Number
Number of work-related accidents causing injuries that results in any of the following outcomes: death, days away from work, restricted work or transfer to another job, medical treatment beyond first aid, or loss of consciousness; or significant injury diagnosed by a physician or other licensed healthcare professional, even if it does not result in death, days away from work, restricted work or job transfer, medical treatment beyond first aid, or loss of consciousness.
Number of training hours provided to crew
Number
The number of training hours at webinars and physical seminar for crew members.
85
Management Report Sustainability statements
GOVERNANCE INFORMATION This chapter sets out G2 Ocean’s approach to upholding the highest standards of integrity and ethical behaviour throughout our operations. It describes our commitments to fostering
87
Business conduct
88
Corporate culture and anti-bribery and corruption
91
Management of relationships with
a strong corporate culture, underpinned by our anti-bribery and anti-corruption measures, ensuring that all employees and stakeholders act in accordance with established codes of conduct. In addition, it details the framework for managing
suppliers including payment practices
relationships with suppliers, emphasising transparency, fair dealing, and responsible sourcing as key principles.
0
Bribery and corruption
488
suppliers assessed for social
ESG and quality audits
incidents
and environmental impacts - up
of suppliers completed
510% since 2022
Relevant policies Code of Business Ethics Anti-bribery and Corruption Policy Sustainable Procurement Policy
86
4
MANAGEMENT REPORT
Introduction
About G2 Ocean
Sustainability statements
General information
Environment
Social
Financial statements Governance
Appendix
Business conduct Material impacts, risks and opportunities As described in Table 35 'Business conduct' is a material topic for G2 Ocean because it underpins our ability to operate transparently, ethically, and sustainably in a complex, global environment. Robust corporate governance practices not only safeguard against risks such as corruption, bribery, and legal disputes but also promote inclusivity, equity, and responsible labour standards. These practices are essential for maintaining stakeholder trust, mitigating reputational and financial risks, and ensuring compliance across diverse regulatory landscapes. Furthermore, strong business conduct creates opportunities for improved collaboration with customers and suppliers, supporting environmental objectives and advancing safety performance.
Table 35 Impacts, risks and opportunities: Business conduct Material matters
Scope
Description of materiality
G2 Ocean's robust corporate governance practices foster environmental accountability, inclusivity, equity and ethical labour practices. (+)
Own operations
G2 Ocean's corporate governance practices ensures that the Company operates transparently and responsibly, holding ourselves and our stakeholders to high standards of conduct. By embedding these values into our governance framework, G2 Ocean not only reduces the risk of unethical behaviour such as corruption and bribery but also promotes a workplace culture where people are respected, equal opportunities are provided, and fair treatment is prioritised. These practices help to mitigate material risks, such as legal disputes and reputational damage, while creating opportunities for improved collaboration with customers and suppliers. Ultimately, this approach supports our long-term business success.
G2 Ocean’s commercial activities may lead to corruption and bribery. (-)
Own operations
G2 Ocean’s commercial activities may expose the Company to potential risks of corruption and bribery because, as with many organisations engaged in complex and wide-ranging, international business operations, there are frequent interactions with various external parties such as suppliers, customers, and port authorities. The main functions within G2 Ocean impacted are commercial, chartering, and procurement, given their direct involvement in external engagements and transactions. These engagements, particularly involving high-value transactions, urgent deadlines, or performance pressure, can present opportunities for unethical behaviour, including under-invoicing, illicit payments or incentives to influence decisions or gain unfair advantage, and the unlawful purchase of letters of credit. These risks are especially pronounced in certain highrisk regions, including Nigeria, Argentina, India, Indonesia, Ukraine, and the Suez Canal, where regulatory environments and business practices may differ significantly. G2 Ocean’s pursuit of growth in developing markets further heightens these risks, making robust controls and regular risk assessments essential for effective mitigation. Without controls and oversight, such situations can increase the likelihood of corruption or bribery occurring.
Own operations
The risk of corruption and bribery arises from the G2 Ocean’s commercial operations, which may lead to cases of corruption or bribery. This not only threatens our financial stability but also undermines stakeholder trust and could impact long-term business success. The risk is heightened in the absence of stringent controls and oversight, making it crucial for G2 Ocean to maintain robust corporate governance and compliance practices to mitigate these potential adverse outcomes.
Own operations
By working closely with partners to improve port productivity and reduce waiting times at berths, G2 Ocean can achieve reductions in emissions and operational inefficiencies. These efforts help us achieve our environmental goals while also advancing progress in safety.
Material impacts 1
Material risks
Cases of corruption and bribery can result in legal disputes, financial penalties, and harm to G2 Ocean's reputation. Material opportunities
Improved collaboration with suppliers creates opportunities for reducing emissions and enhancing safety performance.
(+) symbolises a positive impact whereas (-) symbolises a negative impact
1
87
Management report Sustainability statements
Corporate culture and anti-bribery and corruption A strong corporate culture is essential to G2 Ocean’s business integrity and long-term success. We are committed to conducting our operations ethically and responsibly, adhering to relevant laws and regulations, including those related to anti-bribery and corruption. Recognising the heightened risks of corruption and bribery in our complex, international business environment, G2 Ocean prioritises robust controls and oversight to mitigate these threats. Failure to maintain high ethical standards or comply with anti-bribery and corruption requirements can lead to serious consequences for G2 Ocean, such as substantial financial penalties, legal disputes, loss of business, and significant reputational damage.
training; supports Target 2. • Number of wrongdoing reports submitted by employees or stakeholders - this metric measure how often individuals report unethical behaviour. It supports Target 4 as well as Targets 1–3 by identifying potential issues. • Proportion of reported incidents that have been thoroughly investigated and appropriately addressed - this metric evaluates our responsiveness and commitment to resolving reported issues. Its purpose is to ensure that all incidents are managed effectively and ethically, supporting Targets 1–4.
To address these risks, we foster a culture of integrity, supported by regular audits, quarterly risk assessments, and ongoing compliance activities. Through these measures, we strive to ensure responsible business practices and minimise the risk of bribery and corruption across all areas of our operations.
Quarterly reports on performance against these targets are submitted to the Leadership Team and every six months to the Board. All reporting follows internal control procedures to ensure accuracy and continuous improvement, helping to minimise possible risks and strengthen our ethical standards across the organisation.
Ambition, targets, and metrics
Table 36 provides a summary of our targets, the corresponding metrics, and our performance in relation to each. None of our metrics are validated by an external body other than our assurance provider.
As specified in our Sustainability Strategy, our ambition is to ensure a corruption-free business, ensuring that all operations are conducted with the utmost integrity and in compliance with anti-bribery, anti-corruption, and anti-money laundering regulations.
Policies At G2 Ocean, we have established a set of policies to ensure that all our business activities are conducted with integrity, transparency, and in compliance with applicable laws and ethical standards. Our Code of Business Ethics acts as the foundation of our governance framework, setting out the principles and values that underpin our approach to responsible business conduct. This Code informs additional policies, such as our Anti-bribery and Corruption Policy. Together, these policies ensure that we effectively manage our material impacts and risks related to bribery and corruption, as specified in Table 35.
To support our ambition and ensure effective management of significant risks and impacts associated with bribery and corruption, we have established a set of measurable targets. These objectives have been evaluated and approved by the Board as part of our annual strategic review process. • Target 1: Achieve zero incidents of bribery and corruption. • Target 2: Achieve zero incidents related to anti-money laundering violations.
To promote transparency and accessibility, these policies are published on our external website as well as on our internal intranet, making them available to both employees and external stakeholders. Additionally, we highlight these policies in training and onboarding sessions.
• Target 3: Ensure that the Code of Business Ethics is followed by all employees. • Target 4: Encouraging individuals to report wrongdoing without fear of negative consequences, leading to a more responsible and ethical environment.
The Board of Directors holds ultimate responsibility for the implementation and oversight of these policies. Day-to-day management is delegated to the Director of Compliance, Risk and Business Process, who is responsible for embedding the principles of these policies throughout the organisation and overseeing ongoing compliance. Compliance is further monitored through G2 Ocean’s audit programmes. Should any issues be identified, the Director of Compliance, Risk and Business Process will investigate. If that individual is involved in the management chain related to the incident, responsibility for the investigation is transferred to another senior manager who is not involved. Where appropriate, incident reports are filed and presented to the Leadership Team during the quarterly ESG update meeting, or as circumstances require.
These targets were developed by our Compliance, Risk and Business Process function within our ESG Team, aligning with industry standards. The targets were then reviewed by the ESG Steering Committee and endorsed by the Leadership Team as part of our strategic planning process. Both targets have been approved by the Board as part of the annual strategy review and form an integral component of our broader governance and risk management framework. In order to measure our progress towards these targets, we use a range of metrics. These include: • Total bribery and corruption incidents reported during the reporting period—this metric tracks our progress toward Target 1 by evaluating our prevention measures.
In addition, our policies are developed and reviewed regularly to reflect the interests of key stakeholders, including employees, customers, suppliers, communities, and shareholders. Stakeholder feedback is gathered through both formal and informal channels, as outlined in
• Number of anti-money laundering incidents during the reporting period—tracks violations to highlight areas needing action or 88
MANAGEMENT REPORT
Introduction
the section ‘Interests and Views of Stakeholders’, and this input is incorporated into policy updates to ensure our approach remains relevant, effective, and responsive to evolving expectations.
About G2 Ocean
Sustainability statements
General information
Environment
Social
Financial statements Governance
Appendix
management, with a particular focus on digitalising risk management practices across the organisation. We implemented a new digital risk management platform, which will further enhance our ability to identify, evaluate, and manage risks, including those related to bribery and corruption, throughout our operations and business activities worldwide. The transition from manual risk assessment methods to these digital solutions has enabled more structured, real-time risk monitoring and improved the consistency of risk evaluation processes. In 2026, our main priority will be to ensure the system is successfully adopted by the organisation and its capabilities are fully utilised. See 'Risk factors' for more information about our risk management practices.
Code of Business Ethics Our Code of Business Ethics sets out our core commitments and ethical standards to conducting business with integrity, transparency, and respect for human rights, and affirms our zero tolerance for bribery, corruption, and discriminatory practices. Key principles include compliance with laws and regulations, promotion of diversity and inclusion, fair treatment of all stakeholders, environmental stewardship, and the protection of privacy and confidentiality.
Supplier and customer screenings Supplier and customer screening continued to be a key activity in 2025 to ensure that none of our business partners are subject to sanctions or potential bribery and corruption concerns. Should any issues be identified and verified, we will not conduct business with the Company in question.
The Code applies globally to all G2 Ocean employees, Board members, contractors, consultants, and third-party representatives, as well as business partners acting on behalf of the Company. This ensures consistent ethical standards across all locations and business activities. The Code is aligned with internationally recognised frameworks, including the UN Global Compact, OECD Guidelines for Multinational Enterprises, and ISO 37001 Anti-bribery Management Systems, reflecting our commitment to best practice in ethics, anti-corruption, and corporate responsibility. For more information, see 'Code of Business Ethics'.
Looking ahead to 2026, our primary focus will be on enhancing and streamlining our screening process by implementing a new screening platform. This transition will see the onboarding of both suppliers and customers consolidated into one single, integrated system to support ongoing screening processes. The screening will involve continuously evaluating the credibility, compliance, and overall risk profile of our business partners, both prior to and throughout their engagement with G2 Ocean, helping us further strengthen our ability to identify and mitigate risks in our value chain.
Anti-bribery and Corruption Policy G2 Ocean’s Anti-bribery and Corruption Policy describe our commitment to conducting business with integrity, transparency, and in strict compliance with global anti-corruption standards. The policy prohibits all forms of bribery and corruption and is developed to prevent such incidents across all aspects of our operations. It also commits G2 Ocean to continuously implement and improve preventive measures, including mandatory due diligence for third-party relationships, approval processes for gifts and hospitality, training and internal controls. Employees are required to report any suspected breaches, and G2 Ocean is committed to investigate all reported incidents and to take appropriate corrective action.
Training Enhancing our employees' understanding of ethical business practices, as well as the risks associated with bribery and corruption, remained a top priority throughout 2025. To support this, we delivered two mandatory, company-wide digital training courses to all staff, including our Leadership Team, focusing on our compliance programme and effective risk management techniques. In addition, every new employee completed an onboarding programme that introduced our standards for responsible business conduct, including our Code of Business Ethics. To mark International Anti-Corruption Day, we hosted a dedicated webinar for all employees. This session aimed to educate staff about the impacts and risks linked to bribery and corruption, outline our related objectives and initiatives, and reinforce our whistleblowing policies and procedures. The webinar also provided clear guidance on how to report unethical behaviour, ensuring all employees feel confident and well-informed about the reporting process.
The Anti-bribery and Corruption Policy apply to all G2 Ocean employees, directors, contractors, consultants, agents, and third-party representatives acting on behalf of the Company, irrespective of location or function. Our policy is closely aligned with internationally recognised frameworks and legislation, including the UK Bribery Act, the US Foreign Corrupt Practices Act (FCPA), and ISO 37001 (Anti-bribery Management Systems), ensuring our approach meets global standards.
Actions
In 2026, we will continue to enhance our training initiatives and adapt our materials to address emerging risks and incorporate employee feedback.
To effectively address our corporate governance and bribery and corruption impacts and risks, we implemented a series of targeted initiatives in 2025. Our main initiatives are described in this section. These measures were selected to deliver on our strategic objectives and were identified during our 2025 annual strategy review. Progress on these initiatives is regularly reported during our quarterly Strategic Actions Meetings.
External collaborations G2 Ocean continued to be an active member of the Maritime AntiCorruption Network (MACN) in 2025, collaborating with nearly 200 member organisations to promote integrity in the maritime sector. We reported all bribery and corruption-related incidents internally and to MACN, facilitating sector-wide learning and the development of preventative measures.
Risk management In 2025, G2 Ocean continued its focus on risk assessment and 89
Management report Sustainability statements
Performance In 2025, performance against our corporate culture and anti-bribery and corruption targets continued to demonstrate strong compliance and a commitment to ethical standards. The figures in Table 36 show that there were no reports of wrongdoing requiring investigation during the year. Additionally, the ongoing goal of zero incidents related to bribery, corruption, anti-money laundering, and breaches of the Code of Business Ethics have been met, as no incidents were recorded.
We also maintained our close collaboration with our pool participants, Gearbulk and Grieg, in our joint compliance forum. This forum focuses on recent incidents, regulation updates, and continuous improvement of our risks management actions, including bribery and corruption. We aim to continue these efforts in 2026.
Table 36 Targets, metrics and performance: Corporate culture and anti-bribery and corruption Baseline (2023)
2023
2024
2025 target
2025 (actual)
2026-2030 target
2030 +
Number of reported bribery and corruption incidents
0
0
2
0
0
0
0
Zero anti-money laundering incidents
Number of AntiMoney Laundering Incidents
0
0
0
0
0
0
0
Ensuring the Code of Business Ethics is followed by all employees
Number of incidents reported*
0
0
0
0
0
0
0
Encouraging individuals to report wrongdoing without fear of negative consequences, leading to a more responsible and ethical environment
Number of reports thoroughly addressed and investigated*
No reports to investigate
No reports to investigate
No reports to investigate
All reports to be investigated and whistleblowers notified
No reports to investigate
All reports to be investigated and whistleblowers notified
All reports to be investigated and whistleblowers notified
Objective
Metric
Zero bribery and corruption incidents
Table 37 Anti-bribery and corruption training*
Number of employees who have completed training
Number of employees in high-risk functions who have completed training
Percentage of employees in high-risk functions who have completed training
Number of Board Members received training and percentage
Compliance Training
277 (29)
29 (6)
94% (7%)
0 (5/71%)
Annual webinar
154 (153)
13 (35)
42% (40%)
0 (0)
Training
*Figures in parenthesis are from 2024
Among G2 Ocean’s 320 employees, 31 hold roles designated as “high-risk” - positions with responsibility for financial, operational, or strategic decisions. Individuals in these roles handle sensitive tasks like contract negotiation and transactions, procurement, resource allocation, and regulatory compliance, impacting our reputation and risk exposure. Therefore, heightened diligence, ethics, and risk management are essential to protect the business.
Regular training on anti-bribery and corruption is provided to both the Board and Leadership Team. For the Board, this training is delivered on a bi annual basis to ensure ongoing awareness of evolving compliance requirements and ethical expectations. Therefore, in 2025, 0% of our board members completed such training compared to 71% in 2024.
Table 38 Incidents of corruption or bribery*
Number of confirmed incidents in which own workers were dismissed or disciplined for corruption or bribery-related incidents
0 (0)
Number of confirmed incidents relating to contracts with business partners that were terminated or not renewed due to violations related to corruption or bribery
0 (0)
*Figures in parenthesis are from 2024
90
MANAGEMENT REPORT
Introduction
About G2 Ocean
Sustainability statements
General information
Environment
Social
Financial statements Governance
Appendix
Management of relationships with suppliers including payment practices Our approach to ethical, responsible and sustainable business conduct, extends to our strategic management of relationships with suppliers, emphasising fair treatment and alignment with sustainable business practices. By setting ambitious targets and employing robust metrics, we aim to develop a responsible supply chain that effectively manages impacts, risks and opportunities, thus supporting our strategic objectives and. This section of the report outlines our priorities, ongoing efforts and performance related to promoting ethical conduct and sustainability throughout our supply network.
metrics, and our performance in relation to each. None of our metrics are validated by an external body other than our assurance provider.
Policies
Ambition, targets, and metrics
G2 Ocean’s Sustainable Procurement Policy is developed to ensure that our organisation works towards our ambition of establishing a responsible and sustainable supply chain. It also contributes to effectively managing our supply chain by fostering improved collaboration with suppliers, which creates opportunities for reducing emissions and enhancing safety performance – a material opportunity for G2 Ocean as described in Table 35.
G2 Ocean is dedicated to establishing a responsible and sustainable supply chain. This ambition is embedded in our sustainability strategy and is supported by our policies and procedures.
Approved by our Board of Directors, the policy has among the following key commitments: • Be open, transparent, and ensure fair treatment of all suppliers.
To drive progress towards our ambition, we have established two key targets.
• Give preference to suppliers with recognised commitment for fair labour practices and environmental improvement results.
• Target 1: Ensure that a significant portion of our supplier base aligns with our sustainable and responsible business practices.
• Work towards reducing our Scope 3 emissions associated with our procurement activities, contributing to our broader climate goals.
• Target 2: Ensure fair treatment of all suppliers within our supply chain.
The policy applies to all procurement activities conducted by G2 Ocean, across all business units and regions. It covers the selection, evaluation, and management of all suppliers, contractors, and service providers who deliver goods or services to G2 Ocean. The policy applies to all employees, agents and suppliers contracting on our behalf.
Both of these targets have been reviewed and approved by our Board of Directors as part of our annual strategic review process. In order to measure our progress towards achieving these targets, we use a range of metrics, each chosen to provide meaningful insights:
Overall accountability for the implementation and oversight of the Sustainable Procurement Policy rests with our Managing Director Operations, who reports to the Chief Executive Officer. The Managing Director Operations is supported by the Procurement Team, who are responsible for daily operations and continuous improvement.
• Number of suppliers assessed for social and environmental impacts: This metric helps us evaluate how extensively we are screening our supplier base for alignment with our sustainability values and identify any potential or existing risks before any business interaction, supporting Target 1.
The policy is guided by, and makes references to, recognised international standards and initiatives, including the UN Guiding Principles on Business and Human Rights, the International Labour Organization (ILO) conventions, and the United Nations’ Sustainable Development Goals. Alignment with these frameworks ensures our approach reflects best practice and is benchmarked against global expectations for responsible business conduct.
• Number of ESG and Quality audits of suppliers: By conducting these audits, we ensure a thorough review of suppliers' adherence to environmental, social, governance standards, supporting Target 1. • Percentage of procurement staff receiving annual training on sustainable procurement: This metric tracks our commitment to equipping our team with the knowledge and skills necessary for responsible sourcing, supporting both targets.
The Sustainable Procurement Policy is available to all internal stakeholders via G2 Ocean’s intranet and is published on our external website for access by suppliers and other interested parties.
• The average time taken to pay an invoice (in days) from the contractual or statutory payment start date: Monitoring this ensures that suppliers are treated fairly and paid according to company procedures, supporting Target 2.
In line with our commitment to responsible and sustainable business practices, we require all suppliers to comply with our Supplier Code of Business Ethics as well as our Anti-Bribery and Corruption Policy. These policies are shared with suppliers during the onboarding process to ensure clear understanding and adherence to our standards from the start.
Quarterly reports on performance against these targets are submitted to the Leadership Team and every six months to the Board. All reporting follows internal control procedures to ensure accuracy and continuous improvement, helping to minimise possible risks and strengthen our ethical standards across the organisation.
Actions To effectively address our supply chain impacts and risks, we implemented a series of targeted initiatives in 2025. These measures were
Tables 39 and 40 provides a summary of our targets, the corresponding
91
Management report Sustainability statements
selected to deliver on our strategic objectives and were identified during our 2025 annual strategy review. Progress on these initiatives is regularly reported during our quarterly Strategic Actions Meetings.
In 2026, we will focus on the successful adoption of this system, ensuring its full functionality is utilized to support our business operations and drive continuous improvement.
Payment practises In 2025, we continued our focus on responsible payment practices by taking several actions to ensure timely and transparent transactions with our suppliers.
Screening and assessment of suppliers In 2025, we continued to screen and assess our suppliers on relevant environmental, social, and governance (ESG) criteria. Our supplier screening and assessment process was implemented through two main channels:
Throughout the year, we maintained a strong commitment to paid invoices and honouring the contractual deadlines agreed with each vendor. This applied equally to all suppliers, including small and medium-sized entities (SMEs), with no exceptions made. To reinforce this approach, we implement several process improvements aimed at enhancing efficiency and reducing the risk of delays in payments. Examples include streamlining and closing gaps in our Request-toPay process by introducing stricter controls and regular reviews of outstanding transactions. We proactively engaged with suppliers to resolve pending items and ensure timely processing. Additionally, we conducted a review of invoices without contractual terms or stated due dates, followed by direct engagement with suppliers to agree on clear payment terms, ensuring transparency and predictability in the payment cycle.
1. New suppliers: Throughout 2025, all new suppliers identified as critical or high-risk—according to our established criteria—were subject to a screening process using our supplier self-assessment questionnaire. The self-assessment included questions on environmental, social, and governance aspects. Where necessary, we followed up with targeted actions such as on-site audits, collaboration meetings, or supplier training to address any identified issues. 2. Existing suppliers: In 2025, all existing suppliers classified as high-risk based on our annual environmental and social due diligence processes were assessed in line with the OECD Due Diligence Guidance for Responsible Business Conduct. Every supplier underwent an initial review focusing on supplier category, supplier country, ESG country risk, supplier spend, and any reported safety incidents involving G2 Ocean. For those suppliers deemed at higher risk of potential negative impact, we conducted further checks, including reviewing their websites and requesting additional self-assessments.
Any postponement of payment occurred only in circumstances where no viable alternative existed, underscoring our focus on transparency, accountability, and continuous improvement.
In addition to these measures, during 2025 all suppliers—both new and existing—were reviewed in our supplier risk management system for non-compliance, sanctions, and criminal activity in areas such as human trafficking, other human rights abuses, slave labour, environmental crimes, migrant smuggling, sexual exploitation of children, and smuggling. Where negative findings were identified and not remedied by the supplier, our compliance team conducted a further risk review. If the risk was deemed too significant, we suspended engagement with the supplier pending further investigation.
For invoices where a due date was specified—whether defined by contractual terms, stated on the invoice, or agreed directly with the supplier, payments were made in accordance with these agreed timelines regardless of their size. For invoices where a due date was not specified, we continued to apply our standard terms and conditions, with payment for services due 60 days after completion. We continued to manage port-related invoices by distinguishing between pre-disbursement and final-disbursement accounts:
Supplier audit In 2025, we further advanced our supplier audit program, with an emphasis on ESG and quality. This initiative is designed to strengthen partnerships, enhance quality, and deepen our insight into how suppliers address ESG practices. In total, three audits were conducted, both of which involved on-site visits where our team observed work practices, conducted interviews, and reviewed relevant records and documentation. We will continue our supplier audit programme in 2026, maintaining our focus on on-site engagement and evaluation of our suppliers’ practices.
• Pre-disbursement accounts (PDAs): In 2025, we paid partial estimated costs in advance of vessel arrivals at port, supporting efficient port operations and maintaining strong supplier relations. Most cases involved prepayments, with approximately 80% of PDAs settled before disbursement. • Final-disbursement accounts (FDAs): These were paid upon approval and within the industry standard timeframe, further demonstrating our commitment to timely settlements. Our average payment time in 2025 was 1 day before the start of the contractual or statutory payment term, reflecting an average early payment of one day.
Strategic supply chain management To ensure consistency, drive continuous improvements, and maintain a comprehensive perspective of our supply chain, we have adopted a category management approach to procurement. As part of this strategy, we have implemented a supplier segmentation framework that organises our suppliers into four distinct tiers. Tier 1 suppliers are recognised as strategic partners essential to our long-term growth and operational resilience. In contrast, Tier 4 suppliers are characterised by a low strategic focus and represent a lesser degree of influence on our core objectives.
Supplier Contract Management System To ensure fair treatment of suppliers in our supply chain, we implemented a contract management system in 2025. This system enhances transparency between contractual agreements on payment terms and the invoices received, enabling the organisation to monitor compliance with contractual obligations, identify discrepancies, and address potential risks. 92
MANAGEMENT REPORT
Introduction
About G2 Ocean
Sustainability statements
General information
Environment
Social
Financial statements Governance
Appendix
Performance This segmentation enables us to implement tailored improvement strategies and mitigation actions for environmental, social and governance issues, for example human rights aspects, specific to each product or service group. A dedicated framework is in place to support targeted and sustained engagement with our most critical suppliers, particularly those in Tiers 1 and 2. This approach marks a deliberate shift from reactive supplier management to a proactive, forward-looking model. By focusing our efforts and resources on the suppliers who have the greatest impact on our business, we optimise the use of our resources, strengthen key port and supplier relationships—leading to faster turnaround times and enhanced customer satisfaction—and mitigate supply chain risks to prevent potential disruptions. Ultimately, this strategic allocation of resources ensures greater efficiency, agility, and responsiveness across our supply chain operations.
In 2024, the average time taken to pay an invoice was 1.1 days, with a 2025 target of reducing this to 0 days to ensure that suppliers are paid exactly on time—neither early nor late. However, the actual figure for 2025 was slightly higher than in 2024 – at 1.3 days before the invoice was due. We will continue to work for an average of 0 days to promote optimal cash flow management for both our company and our suppliers. There have been no outstanding legal proceedings for late payments across all reported years, meeting the target of zero and reflecting strong compliance with payment terms. The number of suppliers assessed for social and environmental impacts has shown significant increase, rising from a baseline of 80 in 2022 to 230 in 2024 and reaching 488 in 2025, far surpassing the 2025 target of 150. This increase is due to a broader Scope of screening activities in 2025. In addition to continuing our assessments of new vendors, we expanded our efforts to include two additional categories of suppliers: agents and vessel hire. By assessing these groups alongside new vendors, we achieved a rise in the total number of suppliers screened.
In 2026, we will continue to develop this initiative by translating our four-tier supplier segmentation model into clearly defined objectives, key performance indicators (KPIs), and tailored engagement activities for each supplier tier. Additionally, we will allocate ownership at for the various tier levels to the appropriate organisational resources. This approach will ensure alignment with our broader operational and procurement strategy, fostering a more structured and accountable supplier management framework.
In 2024, G2 Ocean implemented its ESG and quality audit program for suppliers. To date, seven audits have been completed, including three conducted in 2025. We will continue to increase our audit activity in the coming years to further enhance the quality of our supply chain. The percentage of procurement staff receiving annual training on sustainable procurement reached 83% in 2025, not meeting the target of 100%.
Table 39 Targets, metrics and performance: Payment practices
Objective
Metric
Ensure fair treatment of the suppliers in our supply chain.
The average time the undertaking takes to pay an invoice from the date when the contractual or statutory term of payment starts to be calculated, in number of days
2024 (baseline)
2025 target
2025 (actual)
Medium-term target (2028)
Long-term target (2040)
1.1
0
-1.3
0
0
0
0
0
0
0
Number of outstanding legal proceedings for late payments
Table 40 Performance: Supplier relationship management 2022 (baseline)
2023
2024
2025 target
2025 (actual)
Medium-term target (2028)
Long-term target (2040)
Number of suppliers assessed for social and environmental impacts*
80
131
230
150
488
200
250
Number of ESG and quality audits of suppliers*
NA
NA
4
4
3
7
10
Percentage of procurement staff receiving annual training on sustainable procurement*
NA
NA
100%
100%
83%
100%
100%
Objective
Metric
Ensure that a significant portion of our supplier base aligns with our sustainable and responsible business practices
*G2 Ocean-specific metric
93
Management report Sustainability statements
Methodology Table 41 Methodology: Anti-corruption and bribery Metric
Unit
Methodology
Total percentage of operations assessed for risks related to corruption.
Percentage
Counts the percentage of operations assessed for risks related to corruption.
Operations is defined as activities undertaken by G2 Ocean.
Number of outstanding proceedings
Legal proceedings are documented through inquirers to legal and claims department and G2 Ocean accounting department. This will document any proceedings directed to G2 Ocean, independent of payment system (D365 and DA-desk).
Significant risks related to corruption identified through the risk assessment.
List of risks
Details the significant risks identified through the risk assessments.
Total number and percentage of governance body members that the organization’s anticorruption policies and procedures have been communicated to.
Number and percentage
Number and percentage of members of the Board that policies and procedures have been communicated to.
Total number and percentage of all employees and high-risk employees that the organization’s anti-corruption policies and procedures have been communicated to, broken down by employee category and region.
Number and percentage
Number and percentage of employees that polices have been communicated to, measured by way of completed training on the subject.
Total number of confirmed incidents in which employees were dismissed or disciplined for corruption.
Number
Number of severe bribery and corruption incidents that resulted in employee dismissal.
Total number of confirmed incidents when contracts with business partners were terminated or not renewed due to violations related to corruption.
Number
Number of severe bribery and corruption cases that resulted in termination of business partners.
Public legal cases regarding corruption brought against the organization or its employees during the reporting period and the outcomes of such cases.
Number
Number of bribery and corruption public legal cases against the organization or its employees.
94
MANAGEMENT REPORT
Introduction
About G2 Ocean
Sustainability statements
General information
Environment
Social
Financial statements Governance
Appendix
Table 42 Methodology: Management of relationship with suppliers Metric
Unit
Methodology
Average due-to-pay
Number of days
This average is calculated by first determining the proportions of invoices in DA Desk and D365. The proportions are based on invoice count rather than total spend, due to the specific relevance of SMEs in this context. For invoices with a specified due date, the time elapsed from the due date to payment is calculated. For PDAs, the interval between payment and the estimated vessel arrival is estimated. For FDAs, the time from the agent's submission of the FDA to the payment date is calculated. The resulting average due-to-pay is derived by taking into account the proportions of the different invoice types, as well as the proportions of invoices in each of DA Desk and D365.
Number of outstanding legal proceedings for late payments
Number of outstanding proceedings
Legal proceedings are documented through inquirers to legal and claims department and G2 Ocean accounting department. This will document any proceedings directed to G2 Ocean, independent of payment system (D365 and DA-desk).
Number of suppliers assessed for social and environmental impacts
Number of suppliers
Number of suppliers assessed for social and environmental impacts after answering a self-assessment questionnaire or being assessed during the environmental and social due diligence (ESDD) review of a supplier category. Assessment of suppliers in ESDD-review is based on the following principles and priorities: supplier category, supplier country, country risk viewed from ESG risk perspective, supplier spend, and review of any G2 Ocean reported safety incidents connected with supplier.
Further assessments of supplier website and review of supplier self-assessment is conducted for suppliers identified with higher potential risk of negative social impact.
Number and percentage
Number and percentage of members of the Board that policies and procedures have been communicated to.
Percentage of procurement staff receiving annual training on sustainable procurement
Percentage
Procurement staff as determined by any full-time employee working within the procurement department, either through direct reporting lines or functionally reporting to procurement. Documented through training documentation.
95
Management report Sustainability statements
APPENDIX Table 43 ESRS Index
List of material DRs
Page
ESRS 2 - General Disclosures BP-1
General basis for preparation of the sustainability statement
20
BP-2
Disclosures in relation to specific circumstances
20
GOV-1
The role of the administrative, management and supervisory bodies
24
GOV-2
Information provided to and sustainability matters addressed by the undertaking’s administrative, management and supervisory bodies
24
GOV-3
Integration of sustainability-related performance in incentive schemes
27
GOV-4
Statement on due diligence
38
GOV-5
Risk management and internal controls over sustainability reporting
27
SBM-1
Strategy, business model and value chain
SBM-2
Interests and views of stakeholders
35
SBM-3
Material impacts, risks and opportunities and their interaction with strategy and business model
30
IRO-1
Description of the processes to identify and assess material impacts, risks and opportunities
30
IRO-2
Disclosure Requirements in ESRS covered by the undertaking’s sustainability statement
96
ESRS 2 GOV-3-E1
Integration of sustainability-related performance in incentive schemes
27
E1-1
Transition plan for climate change mitigation
42
ESRS 2 SBM-3-E1
Material impacts, risks and opportunities and their interaction with strategy and business model
ESRS 2 IRO-1-E1
Description of the processes to identify and assess material climate-related impacts, risks and opportunities
34
E1-2
Policies related to climate change mitigation and adaptation
44
E1-3
Actions and resources in relation to climate change policies
44
E1-4
Targets related to climate change mitigation and adaptation
42
E1-6
Gross Scopes 1, 2, 3 and Total GHG emissions
48
ESRS 2 IRO-1 – E2
Description of the processes to identify and assess material pollution-related impacts, risks and opportunities
35
E2-1
E2-1 – Policies related to pollution
64
E2-2
E2-2 – Actions and resources related to pollution
64
E2-3
E2-3 – Targets related to pollution
64
E2-4
E2-4 – Pollution of air, water and soil
64
22, 28
E1 - Climate Change
30, 41
E2 - Pollution
96
MANAGEMENT REPORT
Introduction
About G2 Ocean
Sustainability statements
General information
Environment
Social
Financial statements Governance
List of material DRs
Appendix
Page
S1- Own workforce ESRS 2 SBM-2-S1
Interests and views of stakeholders
ESRS 2 SBM-3-S1
35
Material impacts, risks and opportunities and their interaction with strategy and business model
S1-1
Policies related to own workforce
S1-2
Processes for engaging with own workforce and workers' representatives about impacts
70
S1-3
Processes to remediate negative impacts and channels for own workforce to raise concerns
71
S1-4
Taking action on material impacts on own workforce, and approaches to mitigating material risks and pursuing material opportunities related to own workforce, and effectiveness of those actions
30, 70 71, 73, 77
74, 77
S1-5
Targets related to managing material negative impacts, advancing positive impacts, and managing material risks and opportunities
S1-6
Characteristics of the undertaking’s employees
68
S1-7
Characteristics of non-employees in the undertaking’s own workforce
68
S1-13
Training and skills development metrics
77
S1-14
Health and safety metrics
73
73, 77
S2- Workers in the value chain ESRS 2 SBM-2-S2
Interests and views of stakeholders
35
ESRS 2 SBM-3-S2
Material impacts, risks and opportunities and their interaction with strategy and business model
S2-1
Policies related to value chain workers
83
S2-2
Processes for engaging with value chain workers about impacts
82
S2-3
Processes to remediate negative impacts and channels for value chain workers to raise concerns
S2-4
Taking action on material impacts on value chain workers, and approaches to managing material risks and pursuing material opportunities related to value chain workers, and effectiveness of those actions
84
S2-5
Targets related to managing material negative impacts, advancing positive impacts, and managing material risks and opportunities
83
30, 81
82, 71
G1 - Business Conduct ESRS 2 SBM-3-G1
Material impacts, risks and opportunities and their interaction with strategy and business model
ESRS 2 GOV-1-G1
The role of the administrative, management and supervisory bodies
24
ESRS 2 IRO-1-G1
Description of the processes to identify and assess material impacts, risks and opportunities
30
G1-1
Business conduct policies and corporate culture
88
G1-2
Management of relationships with suppliers
91
G1-3
Prevention and detection of corruption and bribery
88
G1-4
Incidents of corruption or bribery
90
G1-6
Payment practices
92
97
30, 87
Management report Sustainability statements
Table 44 List of datapoints in cross-cutting and topical standards that derive from other EU legislation Disclosure Requirement and related datapoint
SFDR reference
ESRS 2 GOV-1 Board’s gender diversity paragraph 21 (d)
Indicator number 13 of Table #1 of Annex 1
Benchmark Regulation reference
Pillar 3 reference
ESRS GOV-1 Percentage of board members who are independent paragraph 21 (e) ESRS 2 GOV-4 Statement on due diligence paragraph 30
Indicator number 10 Table #3 of Annex 1
ESRS 2 SBM-1 Involvement in activities related to fossil fuel activities paragraph 40 (d) i
Indicators number 4 Table #1 of Annex 1
ESRS 2 SBM-1 Involvement in activities related to chemical production paragraph 40 (d) ii ESRS 2 SBM-1 Involvement in activities related to controversial weapons paragraph 40 (d) iii
Material / Not material
Page
Commission Delegated Regulation (EU) 2020/1816, Annex II
Material
24
Delegated Regulation (EU) 2020/1816, Annex II
Material
24
Material
39
Delegated Regulation (EU) 2020/1816, Annex II
Not material
Indicator number 9 Table #2 of Annex 1
Delegated Regulation (EU) 2020/1816, Annex II
Not material
Indicator number 14 Table #1 of Annex 1
Delegated Regulation (EU) 2020/1818, Article 12(1) Delegated Regulation (EU) 2020/1816, Annex II
Not material
Delegated Regulation (EU) 2020/1818, Article 12(1) Delegated Regulation (EU) 2020/1816, Annex II
Not material
Article 449a Regulation (EU) No 575/2013: Commission Implementing Regulation (EU) 2022/2453 Table 1: Qualitative information on Environmental risk and Table 2: Qualitative information on Social risk
ESRS 2 SBM-1 Involvement in activities related to cultivation and production of tobacco paragraph 40 (d) iv
Regulation (EU) 2021/1119, Article 2(1)
ESRS E1-1 Transition plan to reach climate neutrality by 2050 paragraph 14 ESRS E1-1 Undertakings excluded from Paris-aligned Benchmarks paragraph 16 (g)
EU Climate Law reference
Article 449a Regulation (EU) No 575/2013; Commission Implementing Regulation (EU) 2022/2453 Template 1: Banking book Climate Change transition risk: Credit quality of exposures by sector, emissions and residual maturity
98
Delegated Regulation (EU) 2020/1818, Article 12.1 (d) to (g), and Article 12.2
Material, but not developed
42
Material
42
MANAGEMENT REPORT
Introduction
About G2 Ocean
Sustainability statements
General information
Environment
Disclosure Requirement and related datapoint
SFDR reference
Pillar 3 reference
Benchmark Regulation reference
ESRS E1-4 GHG emission reduction targets paragraph 34
Indicator number 4 Table #2 of Annex 1
Article 449a Regulation (EU) No 575/2013; Commission Implementing Regulation (EU) 2022/2453 Template 3: Banking book – Climate change transition risk: alignment metrics
ESRS E1-6 Gross Scope 1, 2, 3 and Total GHG emissions paragraph 44
Indicators number 1 and 2 Table #1 of Annex 1
ESRS E1-6 Gross GHG emissions intensity paragraphs 53 to 55
Indicators number 3 Table #1 of Annex 1
EU Climate Law reference
Social
Financial statements Governance
Appendix
Material / Not material
Page
Delegated Regulation (EU) 2020/1818, Article 6
Material
42
Article 449a; Regulation (EU) No 575/2013; Commission Implementing Regulation (EU) 2022/2453 Template 1: Banking book – Climate change transition risk: Credit quality of exposures by sector, emissions and residual maturity
Delegated Regulation (EU) 2020/1818, Article 5(1), 6 and 8(1)
Material
49
Article 449a Regulation (EU) No 575/2013; Commission Implementing Regulation (EU) 2022/2453 Template 3: Banking book – Climate change transition risk: alignment metrics
Delegated Regulation (EU) 2020/1818, Article 8(1)
Material
50
Regulation (EU) 2021/1119, Article 2(1)
ESRS E1-7 GHG removals and carbon credits paragraph 56 Delegated Regulation (EU) 2020/1818, Annex II Delegated Regulation (EU) 2020/1816, Annex II
ESRS E1-9 Exposure of the benchmark portfolio to climate-related physical risks paragraph 66
Not material
Material, but not disclosed due to phase-in
ESRS E1-9 Disaggregation of monetary amounts by acute and chronic physical risk paragraph 66 (a) ESRS E1-9 Location of significant assets at material physical risk paragraph 66 (c).
Article 449a Regulation (EU) No 575/2013; Commission Implementing Regulation (EU) 2022/2453 paragraphs 46 and 47; Template 5: Banking book - Climate change physical risk: Exposures subject to physical risk.
Material, but not disclosed due to phase-in
ESRS E1-9 Breakdown of the carrying value of its real estate assets by energy-efficiency classes paragraph 67 (c).
Article 449a Regulation (EU) No 575/2013; Commission Implementing Regulation (EU) 2022/2453 paragraph 34; Template 2: Banking book -Climate change transition risk: Loans collateralised by immovable property - Energy efficiency of the collateral
Material, but not disclosed due to phase-in
99
Management report Sustainability statements
Disclosure Requirement and related datapoint
SFDR reference
Pillar 3 reference
Benchmark Regulation reference
Delegated Regulation (EU) 2020/1818, Annex II
ESRS E1-9 Degree of exposure of the portfolio to climate-related opportunities paragraph 69
EU Climate Law reference
Material, but not developed
Material, but not disclosed due to phase-in
ESRS E2-4 Amount of each pollutant listed in Annex II of the E-PRTR Regulation (European Pollutant Release and Transfer Register) emitted to air, water and soil, paragraph 28
Indicator number 8 Table #1 of Annex 1 Indicator number 2 Table #2 of Annex 1 Indicator number 1 Table #2 of Annex 1 Indicator number 3 Table #2 of Annex 1
Not material
ESRS E3-1 Water and marine resources p aragraph 9
Indicator number 7 Table #2 of Annex 1
Not material
ESRS E3-1 Dedicated policy paragraph 13
Indicator number 8 Table 2 of Annex 1
Not material
ESRS E3-1 Sustainable oceans and seas paragraph 14
Indicator number 12 Table #2 of Annex 1
Not material
ESRS E3-4 Total water recycled and reused paragraph 28 (c)
Indicator number 6.2 Table #2 of Annex 1
Not material
ESRS E3-4 Total water consumption in m^3 per net revenue on own operations paragraph 29
Indicator number 6.1 Table #2 of Annex 1
Not material
ESRS 2- SBM-3 - E4 paragraph 16 (a) i
Indicator number 7 Table #1 of Annex 1
Not material
ESRS 2- SBM-3 - E4 paragraph 16 (b)
Indicator number 10 Table #2 of Annex 1
Not material
ESRS 2- SBM-3 - E4 paragraph 16 (c)
Indicator number 14 Table #2 of Annex 1
Not material
ESRS E4-2 Sustainable land / agriculture practices or policies paragraph 24 (b)
Indicator number 11 Table #2 of Annex 1
Not material
ESRS E4-2 Sustainable oceans / seas practices or policies paragraph 24 (c)
Indicator number 12 Table #2 of Annex 1
Not material
ESRS E4-2 Policies to address deforestation paragraph 24 (d)
Indicator number 15 Table #2 of Annex 1
Not material
ESRS E5-5 Non-recycled waste paragraph 37 (d)
Indicator number 13 Table #2 of Annex 1
Not material
100
Page
MANAGEMENT REPORT
Introduction
Pillar 3 reference
About G2 Ocean
Sustainability statements
General information
Environment
Benchmark Regulation reference
Governance
Appendix
Disclosure Requirement and related datapoint
SFDR reference
ESRS E5-5 Hazardous waste and radioactive waste paragraph 39
Indicator number 9 Table #1 of Annex 1
Not material
ESRS 2- SBM3 - S1 Risk of incidents of forced labour paragraph 14 (f)
Indicator number 13 Table #3 of Annex I
Not material
ESRS 2- SBM3 - S1 Risk of incidents of child labour paragraph 14 (g)
Indicator number 12 Table #3 of Annex I
Not material
ESRS S1-1 Human rights policy commitments paragraph 20
Indicator number 9 Table #3 and Indicator number 11 Table #1 of Annex I
Material
67
Material
67
Delegated Regulation (EU) 2020/1816, Annex II
ESRS S1-1 Due diligence policies on issues addressed by the fundamental International Labor Organisation Conventions 1 to 8, paragraph 21
EU Climate Law reference
Social
Financial statements
Not material
Page
ESRS S1-1 processes and measures for preventing trafficking in human beings paragraph 22
Indicator number 11 Table #3 of Annex I
Not material
ESRS S1-1 workplace accident prevention policy or management system paragraph 23
Indicator number 1 Table #3 of Annex I
Material
73
ESRS S1-3 grievance/ complaints handling mechanisms paragraph 32 (c)
Indicator number 5 Table #3 of Annex I
Material
71
ESRS S1-14 Number of fatalities and number and rate of work-related accidents paragraph 88 (b) and (c)
Indicator number 2 Table #3 of Annex I
Material
76
ESRS S1-14 Number of days lost to injuries, accidents, fatalities or illness paragraph 88 (e)
Indicator number 3 Table #3 of Annex I
Material
76
ESRS S1-16 Unadjusted gender pay gap paragraph 97 (a)
Indicator number 12 Table #1 of Annex I
ESRS S1-16 Excessive CEO pay ratio paragraph 97 (b)
Indicator number 8 Table #3 of Annex I
Not material
ESRS S1-17 Incidents of discrimination paragraph 103 (a)
Indicator number 7 Table #3 of Annex I
Not material
75
ESRS S1-17 Non-respect of UNGPs on Business and Human Rights and OECD Guidelines paragraph 104 (a)
Indicator number 10 Table #1 and Indicator n. 14 Table #3 of Annex I
Not material
67
Delegated Regulation (EU) 2020/1816, Annex II
Delegated Regulation (EU) 2020/1816, Annex II
Delegated Regulation (EU) 2020/1816, Annex II Delegated Regulation (EU) 2020/1818 Art 12 (1)
101
Not material
Management report Sustainability statements
Disclosure Requirement and related datapoint
SFDR reference
ESRS 2- SBM-3 – S2 Significant risk of child labour or forced labour in the value chain paragraph 11 (b)
Pillar 3 reference
Benchmark Regulation reference
Material / Not material
Page
Indicators number 12 and n. 13 Table #3 of Annex I
Material
81
ESRS S2-1 Human rights policy commitments paragraph 17
Indicator number 9 Table #3 and Indicator n. 11 Table #1 of Annex 1
Material
67
ESRS S2-1 Policies related to value chain workers paragraph 18
Indicator number 11 and n. 4 Table #3 of Annex 1
Not material
67
ESRS S2-1 Non-respect of UNGPs on Business and Human Rights principles and OECD guidelines paragraph 19
Indicator number 10 Table #1 of Annex 1
Delegated Regulation (EU) 2020/1816, Annex II Delegated Regulation (EU) 2020/1818, Art 12 (1)
Material
67
Delegated Regulation (EU) 2020/1816, Annex II
Material
67
67
ESRS S2-1 Due diligence policies on issues addressed by the fundamental International Labor Organisation Conventions 1 to 8, paragraph 19
EU Climate Law reference
ESRS S2-4 Human rights issues and incidents connected to its upstream and downstream value chain paragraph 36
Indicator number 14 Table #3 of Annex 1
Material
ESRS S3-1 Human rights policy commitments paragraph 16
Indicator number 9 Table #3 of Annex 1 and Indicator number 11 Table #1 of Annex 1
Not material
ESRS S3-1 non-respect of UNGPs on Business and Human Rights, ILO principles or and OECD guidelines paragraph 17
Indicator number 10 Table #1 Annex 1
ESRS S3-4 Human rights issues and incidents paragraph 36
Indicator number 14 Table #3 of Annex 1
Not material
ESRS S4-1 Policies related to consumers and end-users paragraph 16
Indicator number 9 Table #3 and Indicator number 11 Table #1 of Annex 1
Not material
ESRS S4-1 Non-respect of UNGPs on Business and Human Rights and OECD guidelines paragraph 17
Indicator number 10 Table #1 of Annex 1
ESRS S4-4 Human rights issues and incidents paragraph 35
Indicator number 14 Table #3 of Annex 1
Delegated Regulation (EU) 2020/1816, Annex II Delegated Regulation (EU) 2020/1818, Art 12 (1)
Delegated Regulation (EU) 2020/1816, Annex II Delegated Regulation (EU) 2020/1818, Art 12 (1)
Not material
Not material
Not material
102
MANAGEMENT REPORT
Introduction
Disclosure Requirement and related datapoint
SFDR reference
ESRS G1-1 United Nations Convention against Corruption paragraph 10 (b)
Pillar 3 reference
About G2 Ocean
Sustainability statements
General information
Environment
Benchmark Regulation reference
Governance
Appendix
Material / Not material
Page
Indicator number 15 Table #3 of Annex 1
Material
88
ESRS G1-1 Protection of whistle-blowers paragraph 10 (d)
Indicator number 6 Table #3 of Annex 1
Not material
71
ESRS G1-4 Fines for violation of anti-corruption and anti-bribery laws paragraph 24 (a)
Indicator number 17 Table #3 of Annex 1
Material
90
ESRS G1-4 Standards of anti-corruption and antibribery paragraph 24 (b)
Indicator number 16 Table #3 of Annex 1
Material
90
Delegated Regulation (EU) 2020/1816, Annex II)
103
EU Climate Law reference
Social
Financial statements
Management report Sustainability statements
104
MANAGEMENT REPORT
Introduction
About G2 Ocean
Sustainability statements
General information
Environment
Social
Financial statements Governance
Appendix
Statement from the Board of Directors and the CEO In our opinion, the Management Report represents a true and fair account of the development, operation and financial circumstances in G2 Ocean of the results for the year and of the financial position of G2 Ocean as well as a description of the most significant risks and elements of uncertainty facing G2 Ocean. Additionally, in our opinion, the Sustainability statement included in the Management Report represents a reasonable, fair, and balanced representation of G2 Ocean’s sustainability performance and are prepared in accordance with the stated accounting policies. In our opinion, the consolidated financial statements provide a true and fair view of G2 Ocean’s financial performance during 2025 and financial position on December 31, 2025. The Board of Directors and the CEO confirm that the annual accounts have been prepared on the basis of the going concern assumption and that this assumption is valid. The consideration is based on the G2 Ocean’s financial position and expectations of future earnings. The Board of Directors are grateful for the effort and the results achieved by all employees throughout 2025.
Bergen, March 12, 2026
The Board of Directors of G2 Ocean AS
Kristian Jebsen
Camilla Grieg
Toshinobu Shinoda
Chair
Vice Chair
Board Member
Arthur English
Mariann Revheim
Yutaka Arakawa
CEO
Board Member
Board Member
105
Management report Sustainability statements
Independent Sustainability Auditor's Limited Assurance Report
To the General Meeting of G2 Ocean AS
Independent Sustainability Auditor’s Limited Assurance Report Limited Assurance Conclusion We have conducted a limited assurance engagement on the consolidated sustainability statement of G2 Ocean AS (the «Company») included in Sustainability statements of the Board of Directors’ report (the «Sustainability Statement»), as at 31 December 2025 and for the year then ended. Based on the procedures we have performed and the evidence we have obtained, nothing has come to our attention that causes us to believe that the Sustainability Statement is not prepared, in all material respects, in accordance with the European Sustainability Reporting Standards (ESRS), including that the process carried out by the Company to identify the information reported in the Sustainability Statement (the «Process») is in accordance with the description set out in the subsection "Impacts, risks and opportunities management"; and that the disclosures in the subsection "EU taxonomy" of the Sustainability Statement is in accordance with Article 8 of EU Regulation 2020/852 (the «Taxonomy Regulation»). Basis for Conclusion We conducted our limited assurance engagement in accordance with International Standard on Assurance Engagements (ISAE) 3000 (Revised), Assurance engagements other than audits or reviews of historical financial information («ISAE 3000 (Revised)»), issued by the International Auditing and Assurance Standards Board. We believe that the evidence we have obtained is sufficient and appropriate to provide a basis for our conclusion. Our responsibilities under this standard are further described in the Sustainability Auditor’s Responsibilities section of our report. Our Independence and Quality Management We have complied with the independence and other ethical requirements as required by relevant laws and regulations in Norway and the International Code of Ethics for Professional Accountants (including International Independence Standards) issued by the International Ethics Standards Board for Accountants (IESBA Code), which is founded on fundamental principles of integrity, objectivity, professional competence and due care, confidentiality and professional behaviour. The firm applies International Standard on Quality Management 1, which requires the firm to design, implement and operate a system of quality management including policies or procedures regarding compliance with ethical requirements, professional standards and applicable legal and regulatory requirements. Responsibilities for the Sustainability Statement The Board of Directors and the Managing Director (Management) are responsible for designing and implementing a process to identify the information reported in the Sustainability Statement in accordance with the ESRS and for disclosing this Process in the subsection "Impacts, risks and opportunities management" of the Sustainability Statement. This responsibility includes: •
understanding the context in which the Group's activities and business relationships take place and developing an understanding of its affected stakeholders;
•
the identification of the actual and potential impacts (both negative and positive) related to sustainability matters, as well as risks and opportunities that affect, or could reasonably be expected to affect, the Group’s financial position, financial performance, cash flows, access to finance or cost of capital over the short-, medium-, or longterm;
PricewaterhouseCoopers AS, org.no.: 987 009 713 MVA, Statsautoriserte revisorer, medlemmer av Den norske Revisorforening og autorisert regnskapsførerselskap Advokatfirmaet PricewaterhouseCoopers AS, Org.no.: 988 371 084 MVA, Medlemmer av Advokatforeningen. advokatfirmaet@pwc.com PwC Tax Services AS, Org.no.: 962 066 321 MVA, Autorisert regnskapsførerselskap, Medlem av Regnskap Norge Torgallmenningen 14, 5014 Bergen, P.O, Box 3984 - Sandviken, NO-5835 Bergen, T: 02316 (+47 952 60 000) www.pwc.no
106
MANAGEMENT REPORT
Introduction
About G2 Ocean
Sustainability statements
General information
Environment
Social
•
the assessment of the materiality of the identified impacts, risks and opportunities related to sustainability matters by selecting and applying appropriate thresholds; and
•
making assumptions that are reasonable in the circumstances.
Financial statements Governance
Management is further responsible for the preparation of the Sustainability Statement, in accordance with the ESRS; and •
preparing the disclosures in the subsection "EU taxonomy" of the Sustainability Statement, in compliance with the Taxonomy Regulation;
•
designing, implementing and maintaining such internal control that Management determines is necessary to enable the preparation of the Sustainability Statement that is free from material misstatement, whether due to fraud or error; and
•
the selection and application of appropriate sustainability reporting methods and making assumptions and estimates that are reasonable in the circumstances.
Inherent limitations in preparing the Sustainability Statement In reporting forward-looking information in accordance with ESRS, Management is required to prepare the forwardlooking information on the basis of disclosed assumptions about events that may occur in the future and possible future actions by the Group. Actual outcomes are likely to be different since anticipated events frequently do not occur as expected. Sustainability Auditor’s Responsibilities Our responsibility is to plan and perform the assurance engagement to obtain limited assurance about whether the Sustainability Statement is free from material misstatement, whether due to fraud or error, and to issue a limited assurance report that includes our conclusion. Misstatements can arise from fraud or error and are considered material if, individually or in the aggregate, they could reasonably be expected to influence decisions of users taken on the basis of the Sustainability Statement as a whole. As part of a limited assurance engagement in accordance with ISAE 3000 (Revised) we exercise professional judgement and maintain professional scepticism throughout the engagement. Our responsibilities in respect of the Sustainability Statement, in relation to the Process, include: •
Obtaining an understanding of the Process, but not for the purpose of providing a conclusion on the effectiveness of the Process, including the outcome of the Process;
•
Considering whether the information identified addresses the applicable disclosure requirements of the ESRS; and
•
Designing and performing procedures to evaluate whether the Process is consistent with the Company’s description of its Process set out in the subsection "Impacts, risks and opportunities management".
Our other responsibilities in respect of the Sustainability Statement include: •
Identifying where material misstatements are likely to arise, whether due to fraud or error; and
•
Designing and performing procedures responsive to where material misstatements are likely to arise in the Sustainability Statement. The risk of not detecting a material misstatement resulting from fraud is higher than for one resulting from error, as fraud may involve collusion, forgery, intentional omissions, misrepresentations, or the override of internal control.
Summary of the Work Performed A limited assurance engagement involves performing procedures to obtain evidence about the Sustainability Statement. The procedures in a limited assurance engagement vary in nature and timing from, and are less in extent than for, a reasonable assurance engagement. Consequently, the level of assurance obtained in a limited assurance engagement is substantially lower than the assurance that would have been obtained had a reasonable assurance engagement been performed. The nature, timing and extent of procedures selected depend on professional judgement, including the identification of disclosures where material misstatements are likely to arise in the Sustainability Statement, whether due to fraud or error. 2/3
107
Appendix
Management report Sustainability statements
In conducting our limited assurance engagement, with respect to the Process, we: •
•
Obtained an understanding of the Process by: o
performing inquiries to understand the sources of the information used by management (e.g., stakeholder engagement, business plans and strategy documents); and
o
reviewing the Company’s internal documentation of its Process; and
Evaluated whether the evidence obtained from our procedures with respect to the Process implemented by the Company was consistent with the description of the Process set out in the subsection "Impacts, risks and opportunities management".
In conducting our limited assurance engagement, with respect to the Sustainability Statement, we: •
Obtained an understanding of the Group’s reporting processes relevant to the preparation of its Sustainability Statement by: o o
Obtaining an understanding of the Group’s control environment, processes, control activities and information system relevant to the preparation of the Sustainability Statement, but not for the purpose of providing a conclusion on the effectiveness of the Group’s internal control; and Obtaining an understanding of the Group’s risk assessment process;
•
Evaluated whether the information identified by the Process is included in the Sustainability Statement;
•
Evaluated whether the structure and the presentation of the Sustainability Statement is in accordance with the ESRS;
•
Performed inquiries of relevant personnel and analytical procedures on selected information in the Sustainability Statement;
•
Performed substantive assurance procedures on selected information in the Sustainability Statement;
•
Where applicable, compared disclosures in the Sustainability Statement with the corresponding disclosures in the financial statements and other sections of the Board of Directors’ report;
•
Evaluated the methods, assumptions and data for developing estimates and forward-looking information;
•
Obtained an understanding of the Company’s process to identify taxonomy-eligible and taxonomy-aligned economic activities and the corresponding disclosures in the Sustainability Statement;
•
Evaluated whether information about the identified taxonomy-eligible and taxonomy-aligned economic activities is included in the Sustainability Statement; and
•
Performed inquiries of relevant personnel and substantive procedures on selected taxonomy disclosures included in the Sustainability Statement.
Bergen, 12 March 2026 PricewaterhouseCoopers AS
Hanne Sælemyr Johansen State Authorised Public Accountant – Sustainability Auditor 3/3
108
MANAGEMENT REPORT
Introduction
109
About G2 Ocean
Sustainability statements
General information
Environment
Social
Financial statements Governance
Appendix
G2 Ocean's headquarters in Bergen, Norway. Photo: Lumir
110
Annual Report 2025
Annual Report 2024
Financial Statements 112
Consolidated financial statement
117
Notes to the Consolidated Financial Statements
144
Report of Independent Auditors
111
Financial statements
Consolidated Financial Statements Consolidated Statement of Income For the period (USD 1 000)
Note
Jan 1 – Dec 31, 2025
Jan 1 – Dec 31, 2024
Total revenues
3, 4
1 158 354
1 381 857
Voyage related
4, 5
605 256
752 071
Time charter rental
6, 7
24 715
162 825
Depreciation and amortization
16, 17
5 592
6 112
Selling, general & administrative
7, 8, 9
Operating expenses
Income from operations before pool distribution Pool distribution to pool participants
10
Income from operations
61 189
59 245
461 602
401 604
456 722
391 871
4 880
9 733
Non-operating income / (expenses): Interest income / (expense) Other income and expenses, net
11
Income before income taxes Income tax expense
12
Net income
211
(1 568)
(571)
(3 883)
4 520
4 282
1 309
773
3 211
3 508
Jan 1 – Dec 31, 2025
Jan 1 – Dec 31, 2024
3 211
3 508
8 143
(7 877)
550
(1 122)
The accompanying notes form an integral part of these consolidated financial statements.
Consolidated Statement of Comprehensive Income For the period Note
(USD 1 000)
Comprehensive Income / (Loss) Net income Other Comprehensive Income / (Loss) Net change in the fair value of cash flow hedges
13
Translation adjustment Other Comprehensive Income / (Loss) for the period The accompanying notes form an integral part of these consolidated financial statements.
112
3
(90)
11 907
(5 581)
MANAGEMENT REPORT
Introduction
About G2 Ocean
Sustainability statements
General information
Environment
Social
Financial statements Governance
Appendix
Consolidated Balance Sheet Assets as per (USD 1 000)
Note
Dec 31, 2025
Dec 31, 2024
Assets Current assets Cash Trade receivables (net) Related parties receivables
24
11 867
7 021
10, 21
73 457
73 319
10
4 826
5 467
Accrued voyage revenue
22
19 351
26 891
Inventories
20
46 530
52,064
4 203
20 149
7 177
1 390
167 411
186 301
Prepaid expenses Other current assets
14, 15, 19
Total current assets Non-current assets Property, plant and equipment
17
14 919
17 387
Right-of-use assets
7
3 790
3 489
Goodwill
16
17 751
17 683
Other non-current assets
23
1 318
2 551
Total non-current assets
37 778
41 110
Total assets
205 189
227 412
The accompanying notes form an integral part of these consolidated financial statements.
113
Financial statements
Consolidated Balance Sheet Liabilities and Shareholder´s Equity as per (USD 1 000)
Note
Dec 31, 2025
Dec 31, 2024
29
17 845
8 896
10 099
17 503
Liabilities and Shareholder´s Equity Current liabilities Short-term debt Trade payable Related parties payable
10
6 799
4 178
Lease liability, current
7
1 740
1 374
Accrued liabilities
30
54 120
80 700
Deferred voyage revenue
22
58 389
66 369
Other current payables
14, 15, 31
5 385
10 442
154 377
189 463
Total current liabilities Non-current liabilities Lease liability, non-current
7
2 742
2 349
Other non-current liabilities
27, 28
3 433
2 871
6 175
5 220
160 552
194 682
25, 26
14 471
14 471
26
13 652
13 652
15 099
11 888
1 415
(7 282)
Total equity
44 637
32 729
Total liabilities and shareholder´s equity
205 189
227 412
Total non-current liabilities
Total liabilities
Shareholder´s equity Share capital; par value NOK 1 421: issued and outstanding 84 360 shares Additional paid-in capital Retained earnings Accumulated other comprehensive income/ (loss)
13
The accompanying notes form an integral part of these consolidated financial statements.
Bergen, March 12, 2026 The Board of Directors of G2 Ocean AS
Kristian Jebsen
Camilla Grieg
Toshinobu Shinoda
Chair
Vice Chair
Board Member
Arthur English
Mariann Revheim
Yutaka Arakawa
CEO
Board Member
Board Member
114
MANAGEMENT REPORT
Introduction
About G2 Ocean
Sustainability statements
General information
Environment
Social
Financial statements Governance
Appendix
Consolidated Statement of Changes in Shareholder´s Equity For the period Jan 1 – Dec 31, 2024
($)
Accumulated Other Comprehensive Income / (Loss) ($)
Total Shareholder´s Equity ($)
13 652
11 888
(7 282)
32 729
-
-
-
8 143
8 143
-
-
-
-
550
550
-
-
-
3 211
-
3 211
Share capital
Share capital
Additional paid in capital
Retained earnings
(USD 1 000)
(Number)
($)
($)
Balance at Jan 1, 2025
84 360
14 471
Net change in fair value of cash flow hedges
-
Translation adjustment Net income Other
-
-
-
-
4
4
84 360
14 471
13 652
15 099
1 415
44 637
Share capital
Share capital
Additional paid in capital
Retained earnings
(USD 1 000)
(Number)
($)
($)
($)
Accumulated Other Comprehensive Income / (Loss) ($)
Total Shareholder´s Equity ($)
Balance at Jan 1, 2024
84 360
14 471
13 652
8 380
1 807
38 310
Net change in fair value of cash flow hedges
-
-
-
-
(7 877)
(7 877)
Translation adjustment
-
-
-
-
(1 122)
(1 122)
Balance at Dec 31, 2025
For the period Jan 1 – Dec 31, 2024
Net income
-
-
-
3 508
-
3 508
Other
-
-
-
-
(90)
(90)
84 360
14 471
13 652
11 888
(7 282)
32 729
Balance at Dec 31, 2024
The accompanying notes form an integral part of these consolidated financial statements.
115
Financial statements
Consolidated Statement of Cash Flows Cash flows as per Note
(USD 1 000)
Dec 31, 2025
Dec 31, 2024
3 211
3 508
Cash flows from operating activities Net income Adjustments to reconcile net income to net cash provided by operating activities: Depreciation and amortization
16, 17
5 592
6 112
Non-cash lease expense
7
1 954
3 298
Net (gains) losses from disposals
17
(26)
(1)
785
3 466
(139)
8 972
Financial cost
Changes in operating assets and liabilities Trades receivable
21
Inventories
20
Prepaid expenses and other assets
5 535
4 799
14 021
(8 106)
Accrued voyage revenue
22
7 540
(6 311)
Deferred voyage revenue
22
(7 979)
6 329
Accrued liabilities
30
(26 580)
27 982
(7 404)
(7 204)
3 262
(5 917)
888
(1 184)
Trade payable Payments to and from related parties
10
Other payables Other, net Net cash provided / (used) by operating activities
(1 074)
74
(414)
35 816
(3 046)
(2 087)
Cash flows from investing activities Purchase of property, plant and equipment
17
Proceeds from disposal of property, plant and equipment
17
Net cash provided / (used) by investing activities
(24)
-
(3 070)
(2 087)
Cash flows from financing activities Proceeds from revolving credit facility
29
8 948
(25 217)
Repayment of loans to related parties
10
-
(3 000)
Payment of lease liabilities
7
(1 495)
(2 700)
(785)
(3 466)
Net cash provided / (used) by financing activities
6 669
(34 383)
Net increase / (decrease) in cash
3 185
(654)
1 661
(2 163)
7 021
9 838
11 867
7 021
Cash at the beginning of the year
603
1 460
Interest paid
785
3 466
Interest received
838
1 393
Payment of finance costs
Effect of exchange rate changes on the cash in the year Cash at the beginning of the year
24
Cash at the end of the year
Supplementary disclosure
The accompanying notes form an integral part of these consolidated financial statements. 116
MANAGEMENT REPORT
Introduction
About G2 Ocean
Sustainability statements
General information
Environment
Social
Financial statements Governance
Appendix
Notes to the Consolidated Financial Statements Note 1 Description of the business These are the consolidated financial statements of G2 Ocean AS (“G2 Ocean” or “Company”) and its subsidiaries. Investments in companies in which G2 Ocean control, or directly or indirectly hold more than 50% of the voting control of, are consolidated in the financial statements. G2 Ocean is a global ship operator within the open hatch segment. Founded as a joint venture company in 2017 by the ship-owning companies Gearbulk Holding AG and Grieg Shipholding AS, a subsidiary of Grieg Maritime Group (“Grieg”). G2 Ocean is owned by G2 Ocean Holding AS, which is, in turn, owned by Gearbulk Holding AG, Noosa Holding AG and Grieg Shipholding AS. G2 Ocean operates a core fleet of 88 open hatch vessels with gantry or jib cranes with box-shaped holds as of December 31, 2025. In addition, on average 8 vessels have been chartered from third parties on short-term contracts or operated as short term nominated pool vessels during 2025.
Note 2 Summary of significant accounting policies 2.1 Basis of presentation The consolidated financial statements have been prepared in accordance with accounting principles generally accepted in the United States of America (“USGAAP”). 2.2 Basis of consolidation The consolidated financial statements include the accounts of the Company and its subsidiaries. Subsidiaries are identified under either the voting interest model, where the Company exercises control through owning the majority of the voting interests in the entity, or the variable interest model, where the Company has been identified as the primary beneficiary of the risks and rewards associated with a variable interest entity. All intercompany balances and transactions have been eliminated. 2.3 Use of estimates Preparation of financial statements in accordance with USGAAP requires management to make estimates and assumptions that affect the reported amounts of assets and liabilities and disclosure of contingent assets and liabilities at the date of the financial statements and the reported amounts of revenues and expenses during the reporting period. Actual results could differ from those estimates. 2.4 Changes in accounting principles There have been no changes of accounting principles in 2025. 2.5 Revenue and voyage related expenses recognition Revenue from contracts with customers is recognized when control of the services is transferred to the customer at an amount that reflects the consideration to which G2 Ocean expects to be entitled in exchange for those goods or services. The Company has generally concluded that it is the principal in its revenue arrangements, because it typically controls the services before transferring them to the customer. 2.5.1 Freight revenue G2 Ocean recognizes revenue from rendering of transportation services over time, because the customer simultaneously receives and consumes the benefits provided by the Company. G2 Ocean has decided that every voyage consist of a single performance obligation of transporting the cargo within a specific time period. Therefore, the performance obligation is met evenly as the voyage progresses and the freight revenue is recognized over time from load port to discharge port by measuring the progress towards complete fulfilment of the performance obligation(s) under the contract. Number of days sailed from load port compared to total estimated days until discharge port is used as a measure progress. The method applied is the one that most faithfully depicts our progress towards complete satisfaction of the performance obligation. 2.5.2 Variable consideration If the consideration in a contract includes a variable amount, the Company estimates the amount of consideration to which it will be entitled in exchange for transferring the service to the customer. The variable consideration is estimated at contract inception or when changes in circumstances occur and is recognized as revenue if it is highly probable that there will not be a significant reversal of revenue in a future period. The Company is estimating demurrage revenue as a variable consideration when delays occur and the vessel is prevented from loading 117
Financial statements
or discharging cargo within the stipulated laytime. The variable consideration based on contracted price terms and estimated excess time taken to discharge or load are being recognized as part of the freight service revenue over time for the remaining voyage (from the delay occurs to the discharge port). 2.5.3 Contract balances A contract asset is the right to consideration in exchange for goods or services transferred to the customer. If the Company performs by transferring goods or services to a customer before the customer pays consideration or before payment is due, a contract asset is recognized for the earned consideration that is conditional. A trade receivable represents the Company’s right to an amount of consideration that is unconditional. A contract liability is the obligation to transfer goods or services to a customer for which the Company has received consideration (or an amount of consideration is due) from the customer. If a customer pays consideration before the Company transfers goods or services to the customer, a contract liability is recognized when the payment is made. Contract liabilities are recognized as revenue when the Company fulfils the performance obligation(s) under the contract. 2.5.4 Cost to obtain a contract G2 Ocean has elected to apply the optional practical expedient for costs to obtain a contract, e.g. voyage costs and broker commissions, which allows the Company to immediately expense such costs when the related revenue is expected to be recognized within one year. 2.6 Depreciation Depreciation is charged on a straight-line basis, using rates calculated to write off the cost of property, plant and equipment to its estimated residual value over the following periods: Item
Period
Machinery & equipment
Up to 12 years
Cars, furniture & fixtures
Up to 5 years
IT equipment & software
Up to 5 years
On retirement or disposal of property, plant and equipment the difference between any proceeds received and the net book value of the respective asset is recognized as a gain or loss in the Statement of Income. Leasehold improvements are depreciated over the period of the lease. 2.7 Foreign currency The Company’s functional and reporting currency is the US Dollar. Assets and liabilities denominated in foreign currencies are translated to US Dollars using the rates of exchange at the balance sheet date. Revenues and expenses denominated in foreign currencies are translated into US Dollars using the exchange rate on the date of the transaction. Exchange gains and losses on settlement or translation are included in Net income / (loss). Assets and liabilities of foreign subsidiaries, whose functional currency is not the US Dollar, are translated using the rates of exchange at the balance sheet date. Revenues and expenses of foreign subsidiaries are translated at average exchange rates prevailing during the year. Exchange gains and losses arising from the translation of foreign subsidiaries are reported as a separate component of Other Comprehensive Income / (Loss) as a translation adjustment. The cash flows from derivative instruments, which are accounted for as hedges of forecasted foreign currency denominated transactions, are classified in the statement of cash flows in a manner consistent with the underlying nature of the hedged transactions. Foreign currency transaction gains or losses are reported in other income and expense in the Consolidated statement of Income. 2.8 Cash Cash include cash in hand and in bank, and deposits held at call with banks. Restricted cash consists of cash, which may only be used for certain purposes under our contractual arrangements. The amount of cash in the cash flow statement does not include available credit facilities. 2.9 Loans and receivables Trade receivables, other receivables and long-term receivables are presented net of allowances for expected credit losses. 118
MANAGEMENT REPORT
Introduction
About G2 Ocean
Sustainability statements
General information
Environment
Social
Financial statements Governance
Appendix
The Company creates the allowance for expected credit losses to reflect the risk of estimated loss during the lifetime of receivables. The Company makes significant judgements and assumptions to estimate its expected losses. The allowance for credit losses can be determined using various methods, such as loss-rate methods, probability-of-default method or methods that utilize an aging schedule. These conditions are considered in relation to individual receivables or in relation to groups of similar types of receivables. At each reporting date, the allowance for credit losses is recorded as a reduction of receivables. Net income is adjusted to reflect the change in estimate from prior period. If trade accounts receivable become uncollectible, they are charged as an operating expense. 2.10 Inventories Inventories are recorded at the lower of cost and net realizable value with cost determined using the first-in-first-out (“FIFO”) method. 2.11 Property, plant and equipment Property, plant and equipment is recorded at historic cost, less accumulated depreciation and any impairment. Property, plant and equipment includes capitalized Information Technology (“IT”) system costs. Where an asset is constructed over an extended period and the Company is responsible for funding the construction, interest is capitalized into the cost of the asset. The Company performs impairment reviews when there is a triggering event and to supplement this the Company performs reviews annually. These reviews are based upon comparisons between book values and estimated market values and projections of anticipated future cash flows. The projections of anticipated future cash flows are derived from approved budgets and medium-term forecasts. Thereafter, cash flows are adjusted by long term global growth rates considered applicable to the Company’s revenues and costs. An impairment loss is recognized only if the carrying amount of a long-lived asset is not recoverable and exceeds its fair value. The carrying amount of a long-lived asset is not recoverable if it exceeds the sum of the undiscounted cash flows expected to result from the use and eventual disposal of the asset. That assessment is based on the carrying amount of the asset at the date it is tested for recoverability, whether in use or under development. An impairment loss is measured as the amount by which the carrying amount of a long-lived asset exceeds its fair value. 2.12 Intangible assets Internally generated intangible assets are not carried in the Company’s Consolidated balance sheet. 2.13 Goodwill and impairment of goodwill Goodwill arising from a business combination, being the value of purchase consideration in excess of amounts allocable to identifiable assets and liabilities is not amortized and is subject to annual review for impairment or more frequently should indications of impairment arise. For purposes of performing the impairment test of goodwill, we have established that the Company has one reporting unit: Open hatch. Impairment of goodwill in excess of amounts allocable to identifiable assets and liabilities is determined using a one-step approach, based on a comparison of the fair value of the reporting unit to the book value of its net assets; if the fair value of the reporting unit is lower than the book value of its net assets, then an impairment loss is recognized for the difference. We estimate the fair value of the Company based on a discounted cash flow analysis. The Company has selected December 31 as its annual goodwill impairment testing date. Goodwill is tested for impairment between annual tests if an event occurs or circumstances change that would more likely than not reduce the fair value of a reporting unit below its carrying amount. 2.14 Operating leases Our operating leases relate to vessels, offices, cars and equipment under leasing agreements that do not meet the criteria to be classified as finance leases. We recognize on the balance sheet the right to use those assets and a corresponding liability in respect of all material lease contracts with a duration, or lease term, in excess of 12-months. The discount rate used for calculating the cost of the operating leases is the incremental cost of borrowing. For the Company’s charter-in vessel contracts, a non-lease component, or service element has been determined which is reported under time charter rental expenses. G2 Ocean makes significant judgements and assumptions to separate the lease component from the non-lease component of our chartered-in vessels. For purposes of determining the technical management service components of the charter-in vessel contracts, we obtain available historical market statistics for comparable vessels which consider market data based on type and size of vessels as well as age of the vessel. The amortization of right of use assets relating to operating chartered-in vessels is presented under time charter rental expenses in the consolidated statement of income and the amortization of right of use assets relating to office and car leases is reported under selling, general & administrative expenses in the consolidated statement of income. 2.15 Fair value The guidance for fair value measurements applies to all assets and liabilities that are being measured and reported on a fair value basis. This 119
Financial statements
guidance enables the reader of the financial statements to assess the inputs used to develop those measurements by establishing a hierarchy for ranking the quality and reliability of the information used to determine fair values. The same guidance requires that assets and liabilities carried at fair value should be classified and disclosed in one of three categories based on the inputs used to determine its fair value. Fair values of derivatives are estimated using relevant market information and other assumptions, as more fully disclosed in a separate note. Fair value estimates involve uncertainties and matters of significant judgment regarding currency rates, credit risk, bunker prices and other factors. Changes in assumptions or in market conditions could significantly affect these estimates. 2.16 Derivatives The Company recognizes derivatives as either assets or liabilities on the balance sheet and measures them at fair value. On the date that the Company enters into a derivative contract, it designates the derivative as either: 1. A hedge of the fair value of a recognized asset or liability (a “fair value” hedge); 2. A hedge of (a) a forecasted transaction, (b) the variability of cash flows that are to be received or paid in connection with a recognized asset or liability or (c) an unrecognized firm commitment (a “cash flow” hedge); 3. A foreign-currency fair-value or cash flow hedge (a “foreign currency” hedge); 4. A hedge of a net investment in a foreign operation: or 5. An instrument that is held for trading or non-hedging purposes (a “trading” or “non-hedging” instrument). The Company in general enters into forward foreign exchange contracts, fuel rate swap agreements and options and less frequently, derivatives such as forward freight agreements, freight options and fuel purchase options, to manage its exposure to fluctuations in currency rates, the market price of fuel, the market price of time charter freight rates and voyage charter freight rates. Certain forward foreign exchange contracts and fuel rate swap agreements are designated as cash flow hedges and where they meet the criteria for hedge accounting, each is accounted for accordingly as follows. Changes in the fair value of derivative instruments that do not qualify for hedge accounting are reported in the Statement of Income. Changes in the fair value of a derivative that is highly effective and that is designated and qualifies as a cash flow hedge, to the extent that the hedge is effective, are recorded in other comprehensive income, until earnings are affected by the variability of cash flows of the hedged transaction. Any hedge ineffectiveness (which represents the amount by which the changes in the fair value of the derivative exceed the variability in the cash flows of the forecasted transaction) is recorded in current-period earnings. The Company formally documents all relationships between hedging instruments and hedged items, as well as its risk-management objective and strategy for undertaking various hedge transactions. This process includes linking all derivatives that are designated as cash flow, or foreign-currency hedges to (1) specific assets and liabilities on the balance sheet or (2) specific forecast or committed transactions. The Company also formally assesses (both at the hedge’s inception and on an ongoing basis) whether the derivatives that are used in hedging transactions have been highly effective in offsetting changes in cash flows of hedged items and whether those derivatives may be expected to remain highly effective in future periods. When it is determined that a derivative is not (or has ceased to be) highly effective as a hedge, the Company discontinues hedge accounting prospectively. The Company discontinues hedge accounting prospectively when: • it determines that the derivative is no longer effective in offsetting changes in the fair value or cash flows of a hedged item (including hedged items such as firm commitments or forecasted transactions), • the derivative expires or is sold, terminated, or exercised, • it is no longer probable that the forecasted transaction will occur, • a hedged firm commitment no longer meets the definition of a firm commitment, or • the Company determines that designating the derivative as a hedging instrument is no longer appropriate. The Company discontinues hedge accounting when it is no longer probable that the forecasted transaction or firm commitment will occur on the original date or within a two-month window either side of this date. If the hedge is de-designated, the gain or loss accumulated to date on the derivative remains in Accumulated other comprehensive income and is reclassified into the Statement of Income when the transaction affects earnings. If the hedge is not de-designated, the gain or loss accumulated to date on the derivative is recognized immediately in the Statement of Income. In all situations in which hedge accounting is discontinued and the derivative remains outstanding, the Company will carry the derivative at its fair value on the balance sheet, recognizing changes in the fair value in current-period earnings. Where derivative instruments entered into by the Company do not qualify for hedge accounting, the movement in their fair value is recorded under the caption of Other income and expenses, net in the Statement of Income.
120
MANAGEMENT REPORT
Introduction
About G2 Ocean
Sustainability statements
General information
Environment
Social
Financial statements Governance
Appendix
2.17 Pension plans Obligations for contributions to defined contribution plans are recognized as an expense in the Statement of Income as incurred. The Company’s net obligation in respect of defined benefit pension plans is calculated separately for each plan by estimating the amount of future benefit that employees have earned in return for their service in the current and prior period. That benefit is discounted to determine its present value, and the fair value of any plan assets is deducted. The discount rate is the yield at the balance sheet date on high quality bonds that have maturity dates approximating the terms of the Company’s obligations. The calculation is performed by a qualified actuary using the projected unit credit method. 2.18 Income taxes Income taxes are accounted for under the asset and liability method. Significant judgment is required in determining the Company’s tax liabilities in the jurisdictions in which the Company operates. The Company’s income tax liabilities are based on calculations and assumptions that are subject to examination by different tax authorities. The Company establishes accruals for certain tax contingencies and interest when, despite the belief that the Company’s tax return positions are properly supported, the Company believes certain positions may be challenged and that the Company’s positions may not be fully sustained. The Company recognizes the effect of income tax positions only if those positions are more likely than not of being sustained. Changes in recognition or measurement are reflected in the period in which the change in judgment occurs. The Company recognizes interest accrued related to unrecognized tax benefits in interest income / (expense). Deferred income taxes are provided for the tax effect of temporary differences between the tax basis of assets and liabilities and their reported amounts in the consolidated financial statements. Deferred tax assets and deferred tax liabilities are adjusted to the extent necessary to reflect tax rates expected to be in effect when the temporary differences are reversed. Adjustments may be required to deferred tax assets and deferred tax liabilities due to changes in tax laws and audit adjustments by tax authorities. To the extent adjustments are required in any given period the adjustments would be included within the tax provision in the Statement of Income and/or Balance Sheet. A valuation allowance against a deferred tax asset is established if, based on the weight of available evidence, management believes that it is more likely than not that the recorded deferred tax asset will not be realized in future periods. Where items in Other Comprehensive Income have a tax effect, the tax effect is also taken to Other Comprehensive Income. 2.19 Dividends The Company accounts for dividends to shareholders once the dividend has been formally declared. These amounts are charged as a deduction to retained earnings. 2.20 Adoption of new accounting principles with future effect G2 Ocean has reviewed recent accounting pronouncements applicable to the consolidated financial statements for periods after December 31, 2025. The commentary below relates to recent accounting pronouncements applicable to the consolidated financial statements for periods after December 31, 2025. On December 14, 2023, the FASB issued ASU 2023-09, Income Taxes (Topic 740): Improvements to Income Tax Disclosures. The guidance requires disaggregated information about a reporting entity’s effective tax rate reconciliation as well as information on income taxes paid. The standard is intended to benefit investors by providing more detailed income tax disclosures that would be useful in making capital allocation decisions. This guidance is effective for periods beginning after December 15, 2025, with early adoption permitted. The amendments in this update should be applied either prospectively or retrospectively to all periods presented in the financial statements. The Company has not yet adopted this ASU and is not expected to have any material effect on the consolidated financial statements and related disclosures. On July 30, 2025, the FASB issued ASU 2025 05, Financial Instruments—Credit Losses (Topic 326): Measurement of Credit Losses for Accounts Receivable and Contract Assets. The guidance introduces a practical expedient intended to simplify the estimation of expected credit losses for current accounts receivable and current contract assets arising from transactions accounted for under Topic 606, Revenue from Contracts with Customers. The standard is intended to reduce the cost and complexity associated with applying the credit loss model to short term receivables. This guidance is effective for periods beginning after December 15, 2025, with early adoption permitted. The amendments in this update should be applied prospectively. The Company has not yet adopted this ASU and is not expected to have any material effect on the consolidated financial statements and related disclosures. On November 25, 2025, the FASB issued ASU 2025 09, Derivatives and Hedging (Topic 815): Hedge Accounting Improvements. The guidance makes improvements to hedge accounting to better align the accounting with an entity’s risk management activities and to address certain implementation issues that arose following the issuance of prior hedge accounting guidance and global reference rate reform. The amendments
121
Financial statements
primarily affect cash flow hedges and also impact certain fair value and net investment hedges. The standard is effective for reporting periods beginning after December 15, 2026 for public business entities and after December 15, 2027 for all other entities, with early adoption permitted. The amendments in this update should be applied prospectively. The Company has not yet adopted this ASU and is in the process of evaluating the impact of the adoption of this pronouncement on its consolidated financial statements and related disclosures.
Note 3 Total Revenues All of G2 Ocean’s revenues arise from international shipping. An analysis of revenue by origin of load port is as follows: For the period Jan 1 – Dec 31, 2025
Jan 1 - Dec 31, 2024
North America
117 511
113 375
South America
429 660
461 365
Europe
87 754
105 943
Africa
16 392
57 223
Australasia
74 792
74 382
Middle East and Asia
432 245
569 569
1 158 354
1 381 857
(USD 1 000)
Total
Load ports in the following countries each constituted more than 5% of the total cargo revenues reported in 2025 (and 2024): Brazil 27.1% (2024: 25.3%), China 26.3% (2024: 24.7%), Chile 7.0% (2024: 5.9%) and Canada 6.6 (2024: 5.2%). G2 Ocean’s gross revenue has been disaggregated and presented in the table below: For the period (USD 1 000)
Revenue from contracts with customers Other revenues Total
Jan 1 – Dec 31, 2025
Jan 1 - Dec 31, 2024
1 152 935
1 377 882
5 418
3 975
1 158 354
1 381 857
Revenue from contracts with customers disaggregated by type of contracts: Charter of affreightment contracts
644 407
806 605
Spot contracts
484 391
532 336
Time charter hire Total
24 137
38 941
1 152 935
1 377 882
One customer in the year ended December 31, 2025, accounted for 10% or more of the Company’s revenues (2024: one customer).
Note 4 Segment information Up until June 2022, the Company had two operating segments, Open Hatch and Conventional Bulk which were managed separately with each segment representing a strategic business unit that operates in the shipping market. In June 2022, the Conventional Bulk segment was liquidated and after this date, the Company only have one operating segment, Open Hatch.
122
MANAGEMENT REPORT
Introduction
About G2 Ocean
Sustainability statements
General information
Environment
Social
Financial statements Governance
Appendix
Note 5 Voyage related expenses Voyage related expenses consist of the following amounts: For the period Jan 1 – Dec 31, 2025
Jan 1 - Dec 31, 2024
Bunker expenses
236 406
315 029
Cargo handling expenses
163 201
192 721
Port expenses
(USD 1 000)
120 841
132 538
Insurance premiums and deductibles
6 540
6 650
Other voyage related expenses
67 580
91 447
Other direct expenditures for repairs and maintenance
10 688
13 686
Total
605 256
752 071
Note 6 Time charter rental expenses The time charter rental expenses consist of expenses for operating leases. Time charter is an arrangement for hire of a vessel. These arrangements vary in form and way of payment and period of hire may differ from time to time. The time charter rental expenses for the twelve months ending December 2025 were USD 24.7 million (2024: USD 162.8 million). From August 1st, 2025, the time charter vessels are chartered in by the pool participants and nominated into the G2 Ocean pool. There are no time charter rental expenses in G2 Ocean after August 1st, 2025.
Note 7 Operating leases The Company currently has two categories of leases - chartered-in vessels, and offices and cars. As of December 31, 2025, The Company had chartered-in nil vessels (2024: 23 vessels) whereof nil vessels are leased for a minimum initial non-cancelable lease period in excess of 12 months (2024: nil vessels). The vessels are classified as operating leases in accordance with ASC 842 if relevant. Additionally, as of December 31, 2025, G2 Ocean had offices and other space leases in 13 different geographical locations (2024: 13 locations), whereof 7 offices and other space operating leases (2024: 8 offices and other space operating leases) had an initial duration above 12 months. The Company’s right of use assets for long-term operating leases were as follows: As per Dec 31, 2025 Vessels
Offices and cars
Total
Jan 1, 2025
-
3 489
3 489
Additions
-
630
630
Amortization
-
1 217
1 217
Foreign exchange revaluation
-
(1 579)
(1 579)
Foreign exchange revaluation
-
33
33
Dec 31, 2025
-
3 790
3 790
(USD 1 000)
123
Financial statements
As per Dec 31, 2024 (USD 1 000)
Vessels
Offices and cars
Total
Jan 1, 2024
1 414
2 710
4 124
-
2 178
2 178
Additions Amortization
(1 414)
(1 381)
(2 795)
Foreign exchange revaluation
-
(18)
(18)
Dec 31, 2024
-
3 489
3 489
Vessels
Offices and cars
Total
Jan 1, 2025
-
3 723
3 723
Additions
-
600
600
1 217
1 217
The Company’s lease obligations for long-term operating leases were as follows: As per Dec 31, 2025 (USD 1 000)
Adjustments Repayments
-
(1 246)
(1 246)
Foreign exchange translations
-
188
188
Dec 31, 2025
-
4 482
4 482
Current portion
-
1 740
1 740
Non-current portion
-
2 742
2 742
(USD 1 000)
Vessels
Offices and cars
Total
Jan 1, 2024
1 455
2 870
4 325
-
2 178
2 178
(1 455)
(1 245)
(2 700)
As per Dec 31, 2024
Additions Repayments Foreign exchange translations
-
(80)
(80)
Des 31, 2024
-
3 723
3 723
Current portion
-
1 374
1 374
Non-current portion
-
2 349
2 349
Vessels
Offices and cars
Total
2026
-
1 746
1 746
2027
-
1 568
1 568
2028
-
999
999
2029
-
509
509
2030
-
130
130
Future minimum lease payments in respect of operating leases as of December 31, 2025, are as follows: As per Dec 31, 2025 (USD 1 000)
Thereafter
-
-
-
Total minimum lease payments
-
4 952
4 952
Less: Imputed interest
-
(470)
(470)
Present value of operating lease liabilities
-
4 482
4 482
124
MANAGEMENT REPORT
Introduction
About G2 Ocean
Sustainability statements
General information
Environment
Social
Financial statements Governance
Appendix
The future minimum operating lease expense payments are based on the contractual cash outflows under non-cancellable contracts. The time charter rental expense recognition is based upon the straight-line basis. As of December 31, 2025, the future rental payments include USD 4.5 million (2024: USD 3.7 million) in relation to office rent and car lease costs. Total expense for operating leases reflected as time charter rental expenses was USD 24.7 million in 2025 (2024: USD 162.8 million), which included USD 24.7 million (2024: USD 115.2 million) for short-term leases. From August 1st, 2025, the short-term time chartered vessels are chartered in by the pool participants and nominated into the pool. Total cash paid in respect of operating leases was USD 26.0 million in 2025 (2024: USD 164.2 million). The weighted average discount rate in relation to our operating leases was 6.2% for 2025 (2024: 6.0%). The weighted average lease term for offices and cars was 2.3 years as of end 2025 (2024: 3.9 years for offices and cars).
Note 8 Selling, general and administrative expenses Selling, general and administrative expenses consist of the following amounts: For the period Jan 1 – Dec 31, 2025
Jan 1 – Dec 31, 2024
Staff expenses
44 842
44 006
Office expenses
3 091
2 661
IT
5 297
4 560
Professional fees
5 097
4 312
Travel & marketing
3 133
3 120
Net currency hedging related to selling, general and administrative expenses
(271)
586
61 189
59 245
Jan 1 – Dec 31, 2025
Jan 1 – Dec 31, 2024
Statutory audit
195
196
Other audit assurance services
290
268
(USD 1 000)
Total
Note 9 Auditor’s remuneration The following auditor’s remuneration is included in the selling, general and administrative expenses: For the period (USD 1 000)
Other non-audit services Total
-
-
485
464
Note 10 Related parties transactions In the normal course of the conduct of its business, the Company enters into a number of transactions with related parties. Related parties of the Company include G2 Ocean AS’ owners, G2 Ocean Holding AS, Gearbulk Holding AG, Noosa Holding AG and Grieg Shipholding AS including subsidiaries and affiliates of Gearbulk Holding AG, Noosa Holding AG and Grieg Shipholding AS, affiliates of the Company, principal owners of the Company, including close family members and companies controlled by those owners, and management of the Company and companies in which the Company can significantly influence the operating and financial policies. 10.1 Gearbulk During 2025 pool distribution related to Gearbulk vessels amounted to USD 303.7 million (2024: USD 256.8 million), As of December 31, 2025, 60 vessels (2024: 58) were operated in the G2 Ocean pool on behalf of Gearbulk at a variable rate per day. 125
Financial statements
The Company has an arrangement with Gearbulk for the provision of certain chartering, operation and support services. Costs recognized from Gearbulk in respect of these services for 2025 were USD 0.2 million (2024: USD 1.3 million). Revenues recognized from Gearbulk in respect of the services for 2025 were USD 3.5 million (2024: USD 2.4 million). In addition, G2 Ocean has recognized USD nil million from Gearbulk and associated companies relating to TC hire (2024: USD 13.5 million). 10.2 Grieg During 2025 Pool distribution related to Grieg vessels amounted to USD 153.0 million (2024: USD 135.0 million), As of December 31, 2025, 33 vessels (2024: 31) were operated in the G2 Ocean pool on behalf of Grieg at a variable rate per day. The Company has an arrangement with Grieg for the provision of certain chartering, operation and support services. Costs recognized from Grieg in respect of these services for 2025 were USD 0.3 million (2024: USD 0.5 million). Revenues recognized from Grieg in respect of the services for 2025 were USD 1.6 million (2024: USD 1.1 million). 10.3 Noosa Holding AG The Company has an arrangement with Noosa for the provision of certain chartering, operation and support services. Costs recognized from Noosa in respect of these services for 2025 were USD 0.4 million (2024: USD 0.6 million). Revenues recognized from Noosa in respect of the services for 2025 were USD 0.2 million (2024: USD nil million). In addition, G2 Ocean has recognized USD 0.5 million from Noosa and associated companies relating to TC hire (2024: USD nil million). 10.4 Advokatfirmaet Thommessen AS (“Thommessen”) In 2024, a deputy member of the Board of Directors of the Company was also a partner of the Norwegian law firm Thommessen. During 2024, the Company paid USD 45 826 to Thommessen for services provided. 10.5 Related parties' balances As at December 31, the following amounts are due from/to related parties and affiliates of the Company: As per Dec 31, 2025
Dec 31, 2024
4
74
Gearbulk Shipowning Ltd
126
1 140
Gearbulk Shipping AS
50
8
Gearbulk Terminais do Brasil Ltda
5
5
(USD 1 000)
Related parties receivables (current) Gearbulk Pool Ltd
Gearbulk Norway AS
753
146
Gearbulk Shipping Singapore Pte Ltd.
2
13
Gearbulk and Ship Management & Transport Ltd
37
37
Gearbulk Shipowning AS
2 085
2 459
Gearbulk Shipping Investment Combi SI
6
-
Gearbulk Shipping Investment Transhipment Ltd
6
-
Grieg Shipping II AS
720
748
Grieg Star OH Pool AS
309
621
Grieg International II AS
405
217
Grieg Star Bulk AS
-
61
Grieg Gaarden AS
4
-
Grieg Shipholding AS
309
-
G2 Ocean Shipping AS
1
-
G2 Ocean Holding AS
4
(63)
4 826
5 467
Total
126
MANAGEMENT REPORT
Introduction
About G2 Ocean
Sustainability statements
General information
Environment
Social
Financial statements Governance
Appendix
As per (USD 1 000)
Dec 31, 2025
Dec 31, 2024
-
56
Related parties payables (current) Gearbulk Pool Ltd Gearbulk Norway AS
6
-
Gearbulk Holding AG
3 546
5
Gearbulk Shipowning AS
2
-
Gearbulk UK Ltd
34
-
Gearbulk Shipping AS
36
37
Gearbulk Maritima Ltda
5
19
Gearbulk Shipowning Ltd Grieg Shipholding AS Gearbulk Terminais do Brasil Ltda
-
110
60
42
4
-
Grieg Shipping II AS
116
-
Grieg International II AS
259
604
Grieg Star OH Pool AS
33
49
Grieg Star OH Pool AS
2 698
-
-
3 256
6 799
4 178
Other liabilities related parties Total
Other liabilities related parties relate to EU ETS Allowances payable to pool participants. 10.6 Other Loans to directors from G2 Ocean as of December 31, 2025, amounted to nil (2024: nil). Loans to employees amounted to nil (2024: nil).
Note 11 Other income and expense Other income and expense consist of the following amounts: For the period (USD 1 000)
Net foreign exchange loss / (gain)
Jan 1 – Dec 31, 2025
Jan 1 – Dec 31, 2024
319
2 989
Other financial expenses
252
894
Total
571
3 883
Note 12 Income taxes 12.1 Income taxes The Company has considered its uncertain tax positions and is not presently aware of any uncertain tax positions requiring material adjustment in the accounts. However, the Company has operations in a number of overseas jurisdictions, and these operations are required to comply with relevant local tax legislation, for example with respect to residency, transfer pricing and the application of indirect taxes. The Company seeks to ensure compliance with the relevant local tax legislation and takes professional advice as appropriate. The Company believes that the positions it takes meet “the more likely than not” criterion (required by relevant accounting guidance) to be sustained upon a future tax examination. However, in certain aspects there is a degree of inherent subjectivity in the assessment of the positions taken and there can be no assurance that the relevant local tax authority would agree with the Company’s position, and as a result, material adjustments could arise in the future. 127
Financial statements
Income taxes recorded in the Consolidated Statement of Income: For the period (USD 1 000)
Jan 1 – Dec 31, 2025
Jan 1 – Dec 31, 2024
560
197
Current tax Norway Overseas
762
756
1 322
953
Norway
(72)
(223)
Overseas
59
43
Deferred tax charge
(13)
(179)
1 309
773
Norway
2 297
(2 222)
Overseas
-
-
3 606
(1 448)
Total tax expense
Deferred tax included in Other Comprehensive Income
Total
The Company and its Norwegian subsidiaries pay income and capital tax in Norway. All other current tax represents income tax from certain of the Company’s overseas subsidiaries. At December 31, 2025, the Company has USD 0.0 million in tax losses carried forward (basis for deferred tax asset) in Norway (2024: USD 0.0 million). In overseas jurisdictions the tax loss carried forward amounts to USD 1.8 million (2024: USD 1.8 million). Deferred tax assets recognized in respect of these losses amount to USD 0.2 million (2024: USD 0.2 million). As per Dec 31, 2025
Dec 31, 2024
Goodwill
3 063
3 019
Provision
(1 102)
(1 072)
Receivables
(459)
(880)
Fixed assets
(1 017)
-
Pension
(1 872)
(1 977)
Derivatives
2 663
(7 777)
Tax losses carried forward
(1 763)
(1 769)
Tax losses carried forward not recognized
1 073
1 072
586
(9 384)
Deferred tax asset
1 106
2 198
(Defered tax liability)
(1 094)
-
(USD 1 000)
Temporary differences
Basis for deferred tax liability / (deferred tax asset)
12.2 BEPS 2.0 Pillar II From Jan 1, 2024, the OECD’s tax initiatives BEPS 2.0 Pillar II, Global minimum tax rules (“GloBE”) were implemented in Norway, EU and many other jurisdictions. The GloBE rules are designed to ensure that large multinational enterprises pay a minimum level of tax (15%) on income arising in each jurisdiction where they operate. G2 Ocean is subject to the GloBE rules. The Company meets the transitional CbCR Safe Harbour measures, and consequently no additional tax cost is calculated for 2025. 128
MANAGEMENT REPORT
Introduction
About G2 Ocean
Sustainability statements
General information
Environment
Social
Financial statements Governance
Appendix
Note 13 Accumulated other comprehensive Income / (Loss) Total Accumulated Other Comprehensive Income / (Loss) consists of the following: Accumulated net change in fair value of cash flow hedges
Translation adjustments
Other
Total accumulated othercomprehensive income / (loss)
Balance as of Jan 1, 2025
(6 066)
(1 160)
(56)
(7 282)
Movement in the year
10 440
550
4
10 994
Income tax effect
(2 297)
-
-
(2 297)
Balance as of Dec 31, 2025
2 077
(610)
(52)
1 415
(USD 1 000)
Balance as of Jan 1, 2024
1 811
(38)
34
1 807
(10 098)
(1 122)
(90)
(11 310)
Income tax effect
2 222
-
-
2 222
Balance as of Dec 31, 2024
(6 066)
(1 160)
(56)
(7 282)
Movement in the year
Note 14 Fair value Fair value is the exchange price that would be received for an asset or paid to transfer a liability (exit price) in the principal or most advantageous market for the asset or liability in an orderly transaction between market participants on the measurement date. There are three levels of inputs that may be used to measure fair values: I.
Level 1: Quoted prices (unadjusted) for identical assets or liabilities in active markets that the entity has the ability to access as of measurement date.
II. Level 2: Significant other observable inputs other than Level 1 such as quoted prices for similar assets or liabilities; quoted prices in markets that are not active; or other inputs that are observable or can be corroborated by observable market data. III. Level 3: Significant unobservable inputs that reflect a company’s own assumptions about the assumptions that market participants would use in pricing an asset or liability. The Company used the following methods and significant assumptions to estimate fair value: Derivatives The fair value of the derivatives are based upon quotations obtained from third party banks or brokers, or valuation techniques, using observable market data as of the measurement date (Level 2). Our derivatives are traded in an over-the-counter market where quoted market prices are not always available. Therefore, the fair values of derivatives are determined using quantitative models that utilize multiple market inputs. The inputs will vary based on the type of derivative, but could include forward rates, prices and indices to generate continuous yield or curves and volatility factors to value the position. The majority of market inputs are actively quoted and can be validated through external sources, including market transactions and third-party pricing services. Cash The fair value of the cash is based upon the carrying value of cash, which are highly liquid and approximate fair value (Level 1). Short-term debt The carrying value of the short-term debt in the balance sheet approximates the fair value since it bears a variable daily interest rate (Level 2). 129
Financial statements
As of December 31, the aggregate fair value of the assets and liabilities measured at fair value was as follows: Quoted prices in active markets for identical assets
Significant other observable inputs
Significant unobservable inputs
(Level 1)
(Level 2)
(Level 3)
Total
11 867
-
-
11 867
-
4 370
-
4 370
-
29
-
29
Short-term debt
-
17 845
-
17 845
Derivatives
-
1 708
-
1 708
-
28
-
28
Quoted prices in active markets for identical assets
Significant other observable inputs
Significant unobservable inputs
(Level 1)
(Level 2)
(Level 3)
Total
7 021
-
-
7 021
-
507
-
507
-
25
-
25
Short-term debt
-
8 896
-
8 896
Derivatives
-
7 654
-
7 654
-
655
-
655
As per Dec 31, 2025 (USD 1 000)
Financial assets Cash Other current assets Derivatives Other non-current assets Derivatives
Financial liabilities Other current payables
Other non-current liabilities Derivatives
As per Dec 31, 2024 (USD 1 000)
Financial assets Cash Other current assets Derivatives Other non-current assets Derivatives
Financial liabilities Other current payables
Other non-current liabilities Derivatives
There have been no transfers between different levels in the fair value hierarchy in 2025 and 2024.
130
MANAGEMENT REPORT
Introduction
About G2 Ocean
Sustainability statements
General information
Environment
Social
Financial statements Governance
Appendix
As of December 31, 2025 and 2024, the aggregate carrying value, fair value and gain or loss was as follows: As per Dec 31, 2025
Carrying values
Fair values
($)
($)
Gain / (loss)
Foreign exchange forward contracts
2 942
2 942
2 942
Fuel future purchase contracts
(1 101)
(1 101)
(1 101)
Freight forward agreements
(136)
(136)
(136)
EU allowances forward agreements
958
958
958
Carrying values
Fair values
($)
($)
Gain / (loss)
(7 053)
(7 053)
(7 053)
Fuel future purchase contracts
(116)
(116)
(116)
Freight forward agreements
762
762
762
EU allowances forward agreements
139
139
139
(USD 1 000)
Derivative instruments
As per Dec 31, 2024 (USD 1 000)
Derivative instruments Foreign exchange forward contracts
As of December 31, 2025 and 2024 the derivative instruments as presented in the tables above qualifies for hedge accounting and the gain / (loss) are included in the Other Comprehensive Income / (Loss) in the consolidated statement of comprehensive income.
Note 15 Derivatives 15.1 Foreign currency management The Company maintains a foreign-currency risk-management strategy that uses derivative instruments to protect its interests from unanticipated fluctuations in earnings and cash flows that may arise from volatility in currency exchange rates. Movements in foreign-currency exchange rates pose a risk to the Company’s operations and competitive position, since changes in exchange rates may affect the profitability, cash flow, and business and or pricing strategies of competitors. These movements affect transactions that involve operating costs incurred in foreign currencies. The Company uses foreign currency forward exchange contracts to hedge these risks. The notional amount of the foreign currency forward exchange contracts entered into during 2025 is USD 106.4 million (2024: USD 128.9 million). As of December 31, 2025, the fair value of aggregate foreign currency forward exchange contracts held on the balance sheet was a net unrealized gain of USD 2.9 million (2024: net unrealized loss of USD 7.1 million), of which USD 3.1 million (2024: USD 0.3 million) was recorded within Other current assets, USD 0.2 million (2024: USD 6.9 million) within Other current payables, USD 0.0 million (2024: USD 0.0 million) within Other non-current assets and USD 0.0 million (2024: USD 0.5 million) within Other non-current payables. As of December 31, 2025, these contracts had maturities of up to 2 year and a notional principal amount of USD 97.0 million (2024: USD 117.1 million). 15.2 Fuel cost management The Company maintains a fuel-cost risk-management strategy that uses derivative instruments to minimize significant, unanticipated fluctuations in earnings that may arise from volatility in fuel prices. The Company enters into forward contracts and options relating to fuel. The Company has applied hedge accounting to these arrangements during the year ending December 31, 2025. As of December 31, 2025, the fair value of aggregate fuel rate swap agreements held on the balance sheet was a net unrealized loss of USD 1.1 million (2024: net unrealized loss of USD 0.1 million), of which USD 0.1 million (2024: USD 0.1 million) was recorded in Other current assets and USD 1.2 million (2024: USD 0.2 million) was recorded within Other current payables. As of December 31, 2025, these contracts had maturities of up to one year and a notional principal quantity of 48 250 metric tons (2024: 9 750 metric tons). The notional value of these contracts is USD 20.6 million (2024: USD 5.2 million). 131
Financial statements
15.3 Freight cost management The Company maintains a freight cost risk-management strategy that uses derivative instruments to minimize significant, unanticipated fluctuations in earnings that may arise from volatility in freight cost prices. The Company enters into freight forward agreements relating to freight cost. The Company has applied hedge accounting to these arrangements during the year ending December 31, 2025. As of December 31, 2025, the fair value of aggregate forward freight agreements held on the balance sheet was a net unrealized loss of USD 0.1 million (2024: USD 0.8 million), of which USD 0.2 million (2024: USD 0.0 million) was recorded in Other current assets, USD 0.3 million (2024: USD 0.6 million) was recorded within Other current payables and USD 0.0 million (2024: USD 0.2 million) within Other non-current payables. As of December 31, 2025, these contracts had maturities under one year and a notional principal quantity of 75 (2024: 316). The notional value of these contracts is USD 1.1 million (2024: USD 4.0 million). 15.4 Carbon emission allowances management The Company maintains a carbon emission allowances cost risk-management strategy that uses derivative instruments to minimize significant, unanticipated fluctuations in earnings that may arise from volatility in EU allowances cost prices. The Company enters into EU allowances forward agreements relating to carbon emission allowance cost. The Company has applied hedge accounting to these arrangements during the year ending December 31, 2025. As of December 31, 2025, the fair value of aggregate EU allowances forward agreements held on the balance sheet was a net unrealized gain of USD 1.0 million (2024: USD 0.1 million), of which USD 1.0 million (2024: USD 0.1 million) was recorded in Other current assets and USD 0.0 million (2024: USD 0.0 million) was recorded within Other current payables. As of December 31, 2025, these contracts had maturities of up to one year and a notional principal quantity of 77 300 (2024: 12 033). The notional value of these contracts is USD 6.2 million (2024: USD 0.8 million). 15.5 Credit risk By using derivative financial instruments to hedge exposures to changes in exchange rates, fuel costs and freight costs, the Company exposes itself to credit risk. Credit risk is the risk that the counterparty might fail to fulfil its performance obligations under the terms of the derivative contract. When the fair value of a derivative contract is positive, the counterparty owes the Company, which creates repayment risk for the Company. When the fair value of a derivative contract is negative, the Company owes the counterparty and, therefore, does not assume repayment risk. The Company’s hedging policy does not require collateral or other security supporting the financial instruments, however, it sets a minimum creditworthiness threshold for establishing a relationship with counterparties. In the current economic environment, the Company is actively monitoring all of its material counterparty risks. The Company anticipates that the counterparties will be able to fully satisfy their obligations under the agreements as they are assessed to be established and reputable parties with no prior or recent history of default. 15.6 Fair values The estimated fair values of derivatives used to hedge or modify the Company’s risks will fluctuate over time. These fair values should not be viewed in isolation, but rather in relation to the fair values of the underlying hedged transactions and the overall reduction in the Company’s exposure to adverse fluctuations in foreign exchange rates, fuel prices and freight rates. The Company has deemed the fair value measurement for each asset or liability held at fair value to be level 2.
132
MANAGEMENT REPORT
Introduction
About G2 Ocean
Sustainability statements
General information
Environment
Social
Financial statements Governance
Appendix
The following tables present the aggregate notional principal amounts, carrying values, fair values and maturities of the Company’s financial instruments as of December 31, 2025 and as of December 31, 2024 (See Notes 19, 23, 28 and 31.): As per Dec 31, 2025
Notional principal amounts ($)
Carrying values
Fair values
($)
($)
Maturity
Foreign exchange forward contracts
96 985
2 942
2 942
2026-2027
Fuel future purchase contracts
20 583
(1 101)
(1 101)
2026-2027
Freight forward agreements
1 117
(136)
(136)
2026
EU allowances forward agreements
6 193
958
958
2026
Notional principal amounts ($)
Carrying values
Fair values
($)
($)
Maturity
(USD 1 000)
Derivative instruments
As per Dec 31, 2024 (USD 1 000)
Derivative instruments Foreign exchange forward contracts
117 092
(7 053)
(7 053)
2025-2026
Fuel future purchase contracts
5 168
(116)
(116)
2025
Freight forward agreements
3 964
762
762
2025
783
139
139
2025
EU allowances forward agreements
The carrying value of financial assets and liabilities approximates fair value. The fair value of the financial derivative instruments is the estimated amount, based upon quotations obtained from third party banks or brokers, or valuation techniques, which the Company would have received or would have had to pay if the financial instruments had been terminated or sold at the reporting date. The following tables present maturities of notional principal amounts of derivative instruments held as of December 31, 2025 and as of December 31, 2024: As per Dec 31, 2024
EU allowances forward agreements ($)
Freight forward agreements ($)
Forward currency purchase ($)
Fuel purchase contracts ($)
Fuel purchase contracts (MT)
2026
6 193
1 117
93 359
19 585
45 850
2027
-
-
3 626
998
2 400
2028
-
-
-
-
-
2029
-
-
-
-
-
2030
-
-
-
-
-
Thereafter
-
-
-
-
-
6 193
1 117
96 985
20 583
48 250
EU allowances forward agreements ($)
Freight forward agreements ($)
Forward currency purchase ($)
Fuel purchase contracts ($)
Fuel purchase contracts (MT)
2025
783
3 350
107 609
5 168
9 750
2026
-
614
9 483
-
-
2027
-
-
-
-
-
2028
-
-
-
-
-
2029
-
-
-
-
-
Thereafter
-
-
-
-
-
783
3 964
117 092
5 168
9 750
(USD 1 000)
Total
As per Dec 31, 2024 (USD 1 000)
Total Metric ton (MT)
133
Financial statements
Note 16 Goodwill The chartering and operational activities were acquired from Gearbulk and Grieg on May 2, 2017 resulting in a goodwill of USD 17.9 million. As of December 31, 2025 and as of December 31, 2024, there are no indicators of impairment and there is no accumulated impairment loss recognized.
Total
(USD 1 000)
Goodwill Historical cost Jan 1, 2025
17 683
Additions
-
Currency translation
68
Historical cost Dec 31, 2025
17 751
Impairment for the year
-
Accumulated impairment
-
Net carrying value Dec 31, 2025
17 751
Total
(USD 1 000)
Goodwill Historical cost Jan 1, 2024
17 758
Additions
-
Currency translation
(75)
Historical cost Dec 31, 2024
17 683
Impairment for the year
-
Accumulated impairment
-
Net carrying value Dec 31, 2024
17 683
134
MANAGEMENT REPORT
Introduction
About G2 Ocean
Sustainability statements
General information
Environment
Social
Financial statements Governance
Appendix
Note 17 Property, plant and equipment Property, plant and equipment consist of the following amounts:
(USD 1 000)
Machinery & equipment
Cars, furniture & fixtures
IT equipment & software
Total
57 352
991
1 923
60 266
Cost Balances as of Jan 1, 2025 Reclassification of assets
-
-
-
-
Additions
2 750
153
143
3 046
Disposal
-
(143)
(759)
(902)
Foreign exchange differences
97
66
37
200
Balances as of Dec 31, 2025
60 199
1 066
1 344
62 609
(40 335)
(737)
(1 806)
(42 878)
-
-
-
-
(5 372)
(125)
(95)
(5 592)
-
128
757
885
Depreciation and amortization Accumulated depreciation as of Jan 1, 2025 Reclassification of assets Depreciations Disposals Foreign exchange differences
(70)
(3)
(33)
(106)
Accumulated depreciations as of Dec 31, 2025
(45 778)
(736)
(1 176)
(47 690)
Net carrying value Jan 1, 2025
17 016
254
118
17 387
Net carrying value Dec 31, 2025
14 421
330
168
14 919
Machinery & equipment
Cars, furniture & fixtures
IT equipment & software
Total
Balances as of Jan 1, 2024
55 535
1 132
2 283
58 950
Reclassification of assets
-
(6)
(19)
(25)
(USD 1 000)
Cost
Additions
2 019
Disposal
10
58
2 087
(48)
(354)
(402)
Foreign exchange differences
(203)
(96)
(46)
(345)
Balances as of Dec 31, 2023
57 352
991
1 923
60 266
(34 604)
(726)
(2 082)
(37 412)
12
96
108
(116)
(128)
(6 112)
Depreciation and amortization Accumulated depreciation as of Jan 1, 2024 Reclassification of assets Depreciations
(5 867)
Disposals
47
352
399
137
45
(43)
139
Accumulated depreciations as of Dec 31, 2024
(40 355)
(737)
(1 806)
(42 878)
Net carrying value Jan 1, 2024
20 931
406
201
21 538
Net carrying value Dec 31, 2024
17 016
254
118
17 387
Foreign exchange differences
135
Financial statements
17.1 Depreciation and amortization The depreciation and amortization charge for 2025 was USD 5.6 million (2024: USD 6.1 million). In addition, there was a loss on disposal and scrapping of USD 0.0 million (2024 USD 0.0 million). 17.2 Impairment There was no impairment loss in 2024 or 2025.
Note 18 Subsidiaries As of December 31, 2025, the following subsidiaries are included in the consolidated accounts: Company name
Country of registration
Ownership shares
Voting Shares
G2 Ocean Brazil Ltda G2 Ocean Ltd G2 Ocean Ltd ROHQ G2 Ocean US Inc.
Brazil
100%
100%
Bermuda
100%
100%
The Philippines
100%
100%
United States
100%
100%
G2 Ocean Sweden AB
Sweden
100%
100%
G2 Ocean Shipping Canada Ltd
Canada
100%
100%
The Netherlands
100%
100%
Singapore
100%
100%
G2 Ocean Netherlands BV G2 Ocean Singapore Pte Ltd G2 Ocean Italy Srl G2 Ocean Australia Pty Ltd
Italy
100%
100%
Australia
100%
100%
Chile
100%
100%
South Africa
100%
100%
China
100%
100%
G2 Ocean Chile SpA G2 Ocean South Africa Pte Ltd G2 Ocean (Shanghai) Company Limited
In addition, G2 Ocean AS has a permanent establishment in United Kingdom.
Note 19 Other current assets Other current assets consist of the following amounts: As per (USD 1 000)
Note
Dec 31, 2025
Dec 31, 2024
Fair value of derivative instruments
14, 15
4 370
507
Value added taxes receivables
529
560
Other current assets
2 278
323
Total
7 177
1 390
Dec 31, 2025
Dec 31, 2024
Bunkers
46 530
52 064
Total
46 530
52 064
Note 20 Inventories Inventories consist of the following amounts: As per (USD 1 000)
There was no write-down of inventories in 2024 or 2025. 136
MANAGEMENT REPORT
Introduction
About G2 Ocean
Sustainability statements
General information
Environment
Social
Financial statements Governance
Appendix
Note 21 Trade Receivables Trade receivables consist of the following amounts: As per (USD 1 000)
Dec 31, 2025
Dec 31, 2024
73 935
74 216
(478)
(897)
73 457
73 319
Trade receivables Allowance for credit losses Total
All trade receivables and 100% of the loss provision is related to revenue from contract with customers. As at December 31, the ageing analysis of trade receivables are as follows: As per Total
Current
1-30 days
31-60 days
61-90 days
> 91 days
2025
73 935
51 119
18 394
318
(56)
4 159
2024
74 216
54 493
14 146
1 612
685
3 279
(USD 1 000)
Note 22 Contract assets and contract liabilities For the period Jan 1 – Dec 31, 2025
Jan 1 – Dec 31, 2024
Accrued voyage revenue
19 351
26 891
Contract assets
19 351
26 891
Deferred voyage revenue
58 389
66 369
Contract liabilities
58 389
66 369
(USD 1 000)
22.1 Contract assets Contract assets are recognized revenue for freight services partly satisfied from voyages that have commenced but are not completed and invoices have not been issued as at December 31. Contract assets are reclassified to receivables from contracts with customers once the freight service is being invoiced to the customer, normally at the latest within some weeks after the voyage is completed. 22.2 Contract liabilities Contract liabilities are being recognized as revenue from contracts with customers within the completion of the voyage (at the latest a few months after the prepayment). As at December 31, G2 Ocean has the following remaining performance obligations (amounts not disclosed): • For voyages in progress, revenues related to the remaining freight services will be recognized as the voyage progresses. All voyages in progress will be completed within a few months. • In addition, the Company has freight commitments related to contracts of affreightment entered into for future shipments.
137
Financial statements
Note 23 Other non-current assets Other non-current assets consist of the following amounts: As per (USD 1 000)
Note
Dec 31, 2025
Dec 31, 2024
Fair value of derivative instruments
14, 15
29
25
12
1 106
2 198
Deferred tax asset Other non-current assets Total
183
327
1 318
2 551
Note 24 Cash and restricted cash As of December 31, 2025, and 2024, the following table provides a reconciliation of cash and restricted cash reported within the statement of financial positions that sum to the total of the same such amounts shown in the statement of cash flows. As per (USD 1 000)
Cash
Dec 31, 2025
Dec 31, 2024
10 277
6 538
Short-term restricted cash
1 590
483
Total
11 867
7 021
Note 25 Shares As of December 31, 2025, and as of December 31, 2024, the authorized share capital of G2 Ocean AS comprises 84 360 shares of NOK 1 421 par, of which 84 360 are issued. No dividend were declared or paid during 2025 (2024: nil).
Note 26 Sharesholders As of December 31, 2025, the Company is a fully owned subsidiary of G2 Ocean Holding AS.
Shares of common stock
Shareholder
Amount
Shares
G2 Ocean Holding AS
84 360
100%
Total issued common shares
84 360
100%
G2 Ocean’s parent company, G2 Ocean Holding AS is owned by Gearbulk Holding AG, Noosa Holding AG and Grieg Shipholding AS. The table below shows the distribution of ownership in G2 Ocean Holding AS, as of December 31, 2025, between its shareholders, both in terms of number of shares of common stock and percentages.
Shareholder
Amount
Shares
Gearbulk Holding AG
14 700
49%
Noosa Holding AG
4 800
16%
Grieg Shipholding AS
10 500
35%
Total issued common shares
30 000
100%
138
MANAGEMENT REPORT
Introduction
About G2 Ocean
Sustainability statements
General information
Environment
Social
Financial statements Governance
Appendix
Note 27 Pension benefits and liabilities The Company funds pension for certain employees under either a defined contribution scheme or a defined benefit plan undertaken with various pension companies under several different plans. The Company’s Norwegian subsidiaries are bound to have a mandatory occupational pension scheme pursuant to the Norwegian law of Occupational pension scheme. The Company’s pension scheme meets the requirement of this Act. 27.1 Defined contribution plans The Company funds pensions for certain employees under defined contribution personal pension policies undertaken with various pension companies under several different plans. Contributions are generally based on a percentage of gross salaries. Other subsidiaries also make contributions into various defined contribution pension arrangements including state schemes where relevant. Costs in respect of these pension arrangements for the period ending December 31, 2025 were USD 2.4 million (2024: USD 2.2 million). 27.2 Defined benefit plans The Company has also defined benefit schemes and early retirement schemes. The defined benefit schemes are for certain employees with salaries above a specified threshold (12G). This pension gives the right to future defined benefits and the obligations are primarily dependent on years of service, salary at retirement and level of national insurance benefits. The scheme covers 1 employee. The early retirement scheme covers employees who were transferred from Grieg to G2 Ocean AS on May 2, 2017. The early retirement scheme pays 70% of salary at the time reaching the age of 65 until 67 years. This scheme is not funded but is financed through operations. The pension scheme covered 5 employees as of December 31, 2025, (2024: 6 employees). The net periodic pension cost for defined benefit plans for the year December 31, 2025 were USD 0.0 million (2024: USD 0.0 million). The total pension liabilities as of December 31, 2025 were USD 1.9 million (2024: USD 1.9 million).
Note 28 Other non-current liabilities Other non-current liabilities consist of the following amounts: As per (USD 1 000)
Note
Dec 31, 2025
Dec 31, 2024
Fair value of derivative instruments
14,15
28
655
Deferred tax liability
12
1 094
-
Pension obligation
27
1 936
1 912
375
303
3 433
2 871
Other long-term liabilities Total
Note 29 Short-term debt As at December 31, 2025 the Company had a revolving credit facility with a third-party financial institution of USD 40.0 million (2024: USD 50.0 million) whereof USD 17.8 million (2024: USD 8.9 million) had been drawn. The revolving credit facility is secured by a factoring pledge in the amount of USD 44.0 million of the outstanding accounts receivables with the exclusion of accounts receivables relating to certain specific customers. The aggregate carrying value of the pledged accounts receivable as at December 31, 2025, was USD 73.5 million (2024: USD 73.2 million). In addition, the revolving credit facility is secured by a guarantee from its parent company G2 Ocean Holding AS of USD 40.0 million (2024: USD 50.0 million). As of December 31, 2025, the revolving credit facility agreement contain a borrowing base clause, which require a prepayment of a portion of the outstanding borrowings should the drawn amount under the revolving credit facility exceed 70% of the value of the pledged accounts receivable. Further, the revolving credit facility includes a clean down clause which require the usage of the facility to be below a set threshold for three consecutive days during any given six months periods. Failure to comply with any of the covenants in the loan agreements could result in a default. As of December 31, 2025 and December 31, 2024, G2 Ocean was compliant with its covenants. 139
Financial statements
Note 30 Accrued liabilities Accrued liabilities consist of the following amounts: As per
Dec 31, 2025
Dec 31, 2024
Accrued voyage related expenses
42 084
70 396
Accrued staff expenses
9 654
8 735
(USD 1 000)
Accrued other expenses
2 382
1 569
Total
54 120
80 700
Note 31 Other current payables Other current payables consist of the following amounts: As per (USD 1 000)
Note
Dec 31, 2025
Dec 31, 2024
Fair value of derivative instruments
14, 15
1 708
7 654
12
789
417
692
829
1 847
1 284
349
258
5 385
10 442
Taxes payable Payroll tax Provisions for deductibles on cargo related insurance claims Other payables Total
Note 32 Commitments and contingencies 32.1 Contracts of Affreightment The Company enters into contracts of affreightment, committing the Company to provide transportation services covering medium and long-term periods. 32.2 Insurance The Company maintains protection and indemnity (“P&I”) jointly with Owners and charterers liability insurance coverage for its shipping activities, which include the legal liability and other related expenses of injury or death of crew, passengers and other third-parties, loss or damage to cargo, claims arising from collisions with other vessels, damage to other third-party property, pollution arising from oil or other substances, and salvage, towing and other related costs. The Company’s P&I insurance is arranged through three mutual protection and indemnity associations (“P&I Clubs”) of which two are in Norway and one is in the United Kingdom. As a member of a P&I Club, the Company is subject to calls payable to the association based on the Company’s claims record as well as the claims record of all other members of the association. The P&I Clubs operate a policy of reinsurance on certain insurance risks. While liabilities to third-parties are generally covered by P&I insurance, coverage ordinarily available for damage arising out of oil pollution is currently limited to USD 1 billion per incident per vessel for oil pollution damage, which covers response costs and third party claims as well as fines. The vessels operated by the Company do not transport crude oil or its products, but the vessels do carry significant quantities of diesel oil and other heavy oil used for fuel, which if spilled would cause pollution. Likewise, vessels commercially operated by the Company could be involved in a collision with a tanker vessel causing a spill of the tanker’s cargo for which the Company could be liable. G2 Ocean is a defendant in several lawsuits for damages and arbitration proceedings in foreign jurisdictions arising principally from contractual disputes, personal injury and property casualty claims. The Company believes that the resolution of such claims will not have a material adverse effect on the financial position, financial results or liquidity of the Company. As of December 31, 2025, and to the best of our knowledge to date, the Company does not have major claims pending under its liability insurance coverage which can adversely affect the financial position, 140
MANAGEMENT REPORT
Introduction
About G2 Ocean
Sustainability statements
General information
Environment
Social
Financial statements Governance
Appendix
financial results or liquidity. The Company believes that its current insurance coverage provides adequate protection against the accident related risks involved in the conduct of its business and that it maintains appropriate levels of environmental damage and pollution insurance coverage, consistent with standard industry practice. However, there is no assurance that all risks are adequately insured against, that any particular claims will be paid or that the Company will be able to procure adequate insurance coverage at commercially reasonable rates in the future. 32.3 Environmental The Company is subject to the laws of various jurisdictions and international conventions regarding the discharge of materials into the environment. Many countries have ratified and follow the liability scheme adopted by the IMO's and set out in the International Convention on Civil Liability for Oil Pollution Damage 1969 (“CLC”), Bunker Oil Pollution Damage 2001 (“BCLC”) and MARPOL. A 1992 Protocol to the CLC (“CLC92”), and a Supplementary Protocol, (“CLC2003”), have increased the liability limits of the CLC in several signatory countries. In addition, with effect from June 8, 2015, the limit of liability under the BCLC was increased by approximately 50%. The International Convention for the Prevention of Pollution from Ships (MARPOL) is the main international convention covering prevention of pollution by vessels from operational or accidental causes. In jurisdictions where the CLC, CLC92, BCLC2001 or CLC2003 have not been adopted or do not apply for vessels not carrying oil in bulk as cargo or as bunkers, various legislative schemes or common law govern, and liabilities are imposed on the basis of fault or in a manner similar to the CLC, CLC92, BCLC2001 or CLC2003. Compliance is arranged via the vessel’s P&I Club. The Ballast Water Management Convention (BWM Convention) a treaty adopted by the IMO's in order to help prevent the spread of potentially harmful aquatic organisms and pathogens in ships' ballast water. From September 8, 2017, ships must manage their ballast water so that aquatic organisms and pathogens are removed or rendered harmless before the ballast water is released into a new location. The Hong Kong International Convention for the Safe and environmentally Sound Recycling of Ships (the Hong Kong Convention), was adopted in 2009, but is not yet enforced. The Convention is aimed at ensuring that ships, when being recycled after reaching the end of their operational lives, do not pose any unnecessary risks to human health, safety and to the environment. The European Union (EU) Ship Recycling Regulation being largely based on the Hong Kong Convention, entered into force December 30, 2013. The regulation aims to prevent, reduce and minimize accidents, injuries and other negative effects on human health and the environment related to the recycling of ships flying the flag of European Union countries. EU Monitoring, Reporting and Verification Regulation (MRV Regulation) on the monitoring, reporting and verification of carbon dioxide emissions from maritime transport, entered into force on July 1, 2015. The IMO's adopted a mandatory Fuel Oil Data Collection System (DCS) for international shipping, requiring ships to start collecting and reporting data to an IMO database from 2019. For the BWM Convention, Hong Kong International Convention, EU) Ship Recycling Regulation, MRV Regulation and the Fuel Oil Data Collection System it is the vessel manager’s who have the formal responsibility to follow all above mentioned regulations are followed, and make sure the vessels are certified as required. Further, the United States Oil Pollution Act of 1990 (“OPA ‘90”), states that any Company which is an operator of a vessel could be exposed to substantial strict liability, and in some cases unlimited liability, for removal costs and damages arising from a spill caused by one of its vessels into any of the waters of such jurisdiction (including, for example, US waters). Such a claim against the Company would enable claimants in certain jurisdictions to seize the assets of the operating Company located in that jurisdiction. At the time of a final judgment against the operating Company, such Company’s assets in that jurisdiction, as well as in various other jurisdictions, could be exposed to seizure and sale in satisfaction of such judgment. The maximum amount of protection and indemnity (“P&I”) coverage ordinarily available in the market against some of these environmental risks is USD 1 billion per incident per vessel. While the Company maintains such P&I coverage, there can be no assurance that such coverage would be sufficient to cover the costs of damages suffered by the Company. OPA ‘90 expressly provides that individual states in the US are entitled to enforce their own pollution liability laws, even if inconsistent with or imposing greater liability than OPA ‘90. There is no uniform liability scheme among the states. Some states have OPA ‘90-like schemes for limiting liability to various amounts and some rely on fault-based remedies under common law, while others impose strict and unlimited liability on an owner or operator. Some states have also established their own requirements for financial responsibility. From January 1, 2021, the new law imposing increased penalties and fines was effective in California for ship sourced oil pollution damage in Californian State waters. The Energy Efficiency eXisting ship Index (“EEXI”) is a measure introduced by the IMO to reduce the greenhouse gas emissions of ships. The 141
Financial statements
EEXI is a measure related to the technical design of a ship. Ships must attain EEXI approval once in a lifetime, by the first periodical survey in 2023 at the latest. The Carbon Intensity Indicator (“CII”) is a measure of how efficiently a ship transports goods and is given in grams of CO2 emitted per cargo-carrying capacity and nautical mile. The ship is then given an annual rating ranging from A to E, whereby the rating thresholds will become increasingly stringent towards 2030. The yearly CII is calculated based on reported IMO DCS data and the ship is given a rating from A to E. The CII requirements takes effect from 2023 and the first rating is published in 2024. From January 1, 2024, the European Union Emissions Trading System (EU ETS) was extended to shipping. The EU ETS is an emissions capand-trade system that aims to reduce greenhouse gas (GHG) emissions by setting a limit, or cap, on GHG emissions for certain sectors of the economy. Each year, a limited number of EU Allowances (EUAs) is made available for trading in the market, and this is reduced yearly in order for the EU to meet its target of a 55% reduction in GHG emissions by 2030 relative to 1990, and net zero by 2050. Each EUA gives companies a right to emit GHG emissions equivalent to the global warming potential of one ton of CO2 equivalent. The EU ETS will initially cover CO2 emissions and be widened to include methane and nitrous oxide from 2026. The EU ETS directive is applicable to G2 Ocean from January 1, 2024 for vessels trading in the EU, with a requirement to surrender EUAs for a portion of the emissions during an initial phase-in period; 40% in 2024, 70% in 2025 and 100% in 2026. For 2025, G2 Ocean has included USD 8.0 million in cost (2024: USD 5.3 million) related to EUAs. From 2025, for vessels trading in the EU, the yearly average GHG intensity of energy used on board, measured as GHG emissions per energy unit, needs to be below a required level under the FuelEU Maritime regulation. The GHG emissions are calculated in a well-to-wake perspective, including emissions related to extraction, cultivation, production and transportation of the fuel, in addition to emissions from energy used on board the ship. In case the GHG emissions per energy unit is above the required level calculated on a pool of vessel basis, there is a set monetary penalty for the portion exceeding the limit. The Company has been able, and believes that it will continue to be able, to comply with applicable state laws and regulations which are important to the conduct of its operations. 32.4 Freight taxes and other indirect taxes The Company derives income from trade in numerous international jurisdictions, and this income may be subject to freight taxes or other indirect taxes. Where appropriate the Company recognizes income, expenses, assets or liabilities in respect of freight taxes or other indirect taxes in the financial statements. The Company takes legal and professional advice in seeking to ensure it is compliant with the tax legislation in the jurisdiction in which it operates. However, the operation of freight taxes and other indirect taxes within the context of international transportation is complex and continually evolving particularly in emerging markets. The Company takes various measures to address any potential exposure to freight taxes or other indirect taxes, including through its standard contractual terms of business. However, there can be no absolute assurance that these measures will fully protect the Company from potential exposure to such taxes or that the relevant tax authorities will agree with the tax positions the Company has taken and as such material adjustments may be required in the future.
Note 33 Events subsequent to the balance sheet date Subsequent events have been reviewed from period end to issuance of the consolidated financial statement on March 12, 2026, and there are no material events.
142
MANAGEMENT REPORT
Introduction
G2 Ocean's headquarters in Bergen, Norway. Photo: Grieg Maritime Group 143
About G2 Ocean
Sustainability statements
General information
Environment
Social
Financial statements Governance
Appendix
Financial statements
Report of Independent Auditors
144
MANAGEMENT REPORT
Introduction
145
About G2 Ocean
Sustainability statements
General information
Environment
Social
Financial statements Governance
Appendix
Annual Report Financial statements 2025
Subsidiaries and offices Atlanta (Hub office) G2 Ocean US Inc. 600 Galleria Parkway Suite 550 GA 30339 Atlanta, United States
Livorno G2 Ocean Italy Srl c/o Studio Masi Via Grande, 225 57123 Livorno, Italy
Santiago G2 Ocean Chile SpA Mariano Sanchez Fontecill 310 Department 201 Las Condes Santiago, Chile
Bergen (Headquarters) G2 Ocean AS Grieg-Gaarden, C. Sundtsgate 17 5004 Bergen, Norway
Manila G2 Ocean Ltd. - ROHQ 10th Floor, Times Plaza Building United Nation corner Taft Avenue Ermita Manila, The Philippines
Shanghai G2 Ocean (Shanghai) Company Limited Room 5005, Citic Plaza 859 Sichuan North Road 200085 Shanghai, China
Dubai G2 Ocean Singapore Pte Ltd Sharaf building – 3rd Floor Opp. Dubai Ports & Customs Al Mina Road PO Box 576 Dubai, United Arab Emirates
Melbourne G2 Ocean Australia Pty Ltd Suite 8a, 1st Floor Pier 35, 263 Lorimer St Port Melbourne, Victoria 320 Melbourne, Australia
Singapore (Hub office) G2 Ocean Singapore Pte Ltd 77 Robinson Road, #07-02 068809 Singapore
Durban G2 Ocean South Africa Pte Ltd 50 Oxford Road, Parktown 2193 Johannesburg, South Africa
Rio de Janeiro G2 Ocean Brasil Ltda Rua Lauro Muller 116 Rooms 3106, 3201, 3205, 3206 and 3207 Botafago 22290-160 Rio de Janeiro, Brazil
Gothenburg G2 Ocean Sweden AB Pumpgatan 1 SE-417 55 Gothenburg, Sweden
Rotterdam G2 Ocean Netherlands BV BijdorpWest 79 2992 LC Barendrecht Rotterdam, Netherlands
Houston G2 Ocean US Inc. Suite 925, 11490 Westheimer Road 77077 Houston, Texas, United States
146
Vancouver G2 Ocean Shipping Canada Ltd 620-4370 Dominion Street V5G 4L7 Burnaby, BC Canada
147
G2 Ocean AS Grieg-Gaarden, C. Sundts gate 17, 5004 Bergen, Norway g2o.contact@g2ocean.com
g2ocean.com