EXPERIENCE, EXPAND, EVOLVE WITH ZEEWEED* 500 Proven success in Florida municipalities - the next generation of superior MBR technology for large municipal MBR applications. • Meet high growth demands • Meet strict nutrient reduction regulations • Reduce membrane tank footprint by up to 50% • Lower energy usage • Longer membrane life Central County WRF 4.0 MGD (2028)
GRU Main Street WRF
Sanibel Donax WRF
Crest Avenue WWTF
Marco Island WWTP
Rotonda WWTP
Fort Drum Service Center
Babcock Ranch WRF
Glades County WWTP
7.0 MGD (2028)
7.5 MGD (2027)
2.0 MGD (2008)
Phase 1 - 0.75 MGD (2020) Phase 2B – 1.5 MGD (2023)
Bonita Springs East WRF 4.1 MGD (2007)
2.0 MGD (2021)
5.0 MGD (2006)
0.1 MGD (2013)
0.36 MGD (2005)
Suwannee County Catalyst Industrial Park WWTP 0.2 MGD (2027)
415 Country Club Drive, Winter Park, FL 32789 www.heywardfl.com
*Trademark of Veolia; may be registered in one or more countries. ©2026 Veolia. All rights reserved.
Learn more and hear customer testimonials
Editor’s Office and Advertiser Information: Florida Water Resources Journal 1402 Emerald Lakes Drive Clermont, FL 34711 Phone: 352-241-6006 Editorial, editor@fwrj.com Display and Classified Advertising, ads@fwrj.com
Business Office:
1402 Emerald Lakes Drive, Clermont, FL 34711 Web: www.fwrj.com General Manager: Editor: Graphic Design Manager: Mailing Coordinator:
Michael Delaney Rick Harmon Patrick Delaney Buena Vista Publishing
Published by BUENA VISTA PUBLISHING for Florida Water Resources Journal Inc. President: Richard Anderson (FSAWWA) Peace River Manasota Regional Water Supply Authority Vice President: Joe Paterniti (FWEA) Clay County Utility Authority Treasurer: Rim Bishop (FWPCOA) Seacoast Utility Authority Secretary: Rim Bishop (FWPCOA) Seacoast Utility Authority
Moving? The Post Office will not forward your magazine. Do not count on getting the Journal unless you notify us directly of address changes by the 15th of the month preceding the month of issue. Please do not telephone address changes. Email changes to changes@fwrj.com or mail to Florida Water Resources Journal, 1402 Emerald Lakes Drive, Clermont, FL 34711
Membership Questions FSAWWA: Casey Cumiskey – 407-979-4806 or Casey@fsawwa.org FWEA: Laura Cooley, 407-574-3318, admin@fwea.org FWPCOA: Darin Bishop – 561-840-0340
Training Questions FSAWWA: Donna Metherall – 407-979-4805 or Donna@fsawwa.org FWPCOA: Shirley Reaves – 321-383-9690
For Other Information FDEP Operator Certification: Ron McCulley – 850-245-7500 FSAWWA: Kim Kowalski – (407) 979-4814 Florida Water Resources Conference: 267-884-6292 FWPCOA Operators Helping Operators: John Lang – 772-559-0722, oho@fwpcoa.org FWEA: Laura Cooley – 407-574-3318, admin@fwea.org
Websites Florida Water Resources Journal: www.fwrj.com FWPCOA: www.fwpcoa.org FSAWWA: www.fsawwa.org FWEA: www.fwea.org and www.fweauc.org Florida Water Resources Conference: www.fwrc.org Throughout this issue trademark names are used. Rather than place a trademark symbol in every occurrence of a trademarked name, we state we are using the names only in an editorial fashion, and to the benefit of the trademark owner, with no intention of infringement of the trademark. None of the material in this publication necessarily reflects the opinions of the sponsoring organizations. All correspondence received is the property of the Florida Water Resources Journal and is subject to editing. Names are withheld in published letters only for extraordinary reasons. Authors agree to indemnify, defend and hold harmless the Florida Water Resources Journal Inc. (FWRJ), its officers, affiliates, directors, advisors, members, representatives, and agents from any and all losses, expenses, third-party claims, liability, damages and costs (including, but not limited to, attorneys’ fees) arising from authors’ infringement of any intellectual property, copyright or trademark, or other right of any person, as applicable under the laws of the state of Florida.
News and Features
4 FSAWWA at 100: Historic Water Treatment Landmarks: A Three-Part Series 8 CSID Celebrates 60 Years of Delivering Award-Winning Drinking Water, Wastewater Treatment, and Flood Control 18 Drop Savers Poster Contest Winners Announced 23 In Memoriam: Arthur “Art” Saey 24 How to Tap Your Innovation Pipeline When Your Organization is Tapped Out: Three Ways to Unlock Your Organization’s Hidden Innovation Potential—Rebecca Okamoto 34 Creating Waves: Scholarship Foundation Invests in Florida’s Water Future 57 News Beat
Technical Articles
12 Fast-Tracking Field Inspections and Leveraging Statistical Analysis: Reducing “Unknowns” for Tallahassee’s Service Line Inventory—Jennifer E.C. Porter, Diane Quigley, and Eric Balon 26 Modernizing Existing Water Treatment Facilities Through Emerging Technologies—Oscar Serrato
Education and Training
35 Florida Water Resources Conference 40 FSAWWA Celebrating Hispanic Heritage Month 41 FSAWWA Fall Conference Schedule of Events 42 FSAWWA Fall Conference Incoming Chair’s Reception and BBQ 43 FSAWWA Fall Conference Poker Night and Happy Hour 44 FSAWWA Fall Conference Students and Young Professionals Activities 45 FSAWWA Fall Conference Top Ops Competition Sponsorship 46 FSAWWA Fall Conference Top Ops Competition 47 FSAWWA Fall Conference Operation: WetVet 51 CEU Challenge 54 TREEO Center Training 55 FWPCOA Training Calendar
Columns
22 C Factor—Kevin G. Shropshire 36 Speaking Out—Tyler Tedcastle 38 Reader Profile—Marc Cannata 39 Test Yourself—Charles Lee Martin Jr. 48 Let’s Talk Safety: Climb Into ConfinedSpace Safety 52 FWEA Focus—David Hernandez
Departments
57 Classifieds 58 Display Advertiser Index
Volume 77
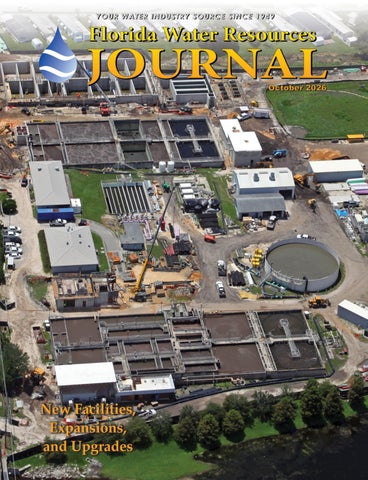
ON THE COVER: The Crest Avenue Wastewater Treatment Facility expansion project was designed to maximize the existing facility footprint, adding a new 5-stage Bardenpho process with membrane bioreactors. The project is expanding the facility from 4.75 to 7.5 million gallons per day annual average daily flow and improving the effluent quality to reliably meet advanced wastewater treatment standards. (photo: Wharton Smith)
October 2026
Number 10
Florida Water Resources Journal, USPS 069-770, ISSN 0896-1794, is published monthly by Florida Water Resources Journal Inc., 1402 Emerald Lakes Drive, Clermont, FL 34711, on behalf of the Florida Water & Pollution Control Operator’s Association Inc.; Florida Section, American Water Works Association; and the Florida Water Environment Association. Members of all three associations receive the publication as a service of their association; $6 of membership dues support the Journal. Subscriptions are otherwise available within the U.S. for $24 per year. Periodicals postage paid at Clermont, Fla., and additional offices.
POSTMASTER: Send address changes to Florida Water Resources Journal, 1402 Emerald Lakes Drive, Clermont, FL 34711
Florida Water Resources Journal • October 2026 3
FSAWWA at 100: Historic Water Treatment Landmarks: A Three-Part Series 100 years goes faster than you think! As the Florida Section of the American Water Works Association (FSAWWA) celebrates its 100th anniversary, the organization is reflecting on the remarkable legacy of Florida’s oldest water treatment facilities— plants that have safeguarded public health, supported economic growth, and shaped the state’s development for more than a century. This is the third article in a three part series to honor historic water treatment facilities across Florida, each of which has provided continuous service for 100 years or more. From early coastal waterworks to inland groundwater systems and major metropolitan treatment plants, these facilities represent the foundation upon which Florida’s modern water infrastructure was built.
City water works and electric plant in 1910.
City of Jacksonville’s Main Street Water Treatment Facility “Jacksonville’s Main Street Facility has delivered safe drinking water through every era of the city’s growth.” Jacksonville’s Main Street Water Treatment Facility has served the community for more than 145 years. The city’s original “Water Works” water distribution facility was built on land purchased in 1878 for $3,300. As a brick pumphouse with an adjacent octagonal building that covered the well, the one-million-gallon-per-day (mgd) waterworks facility was a major accomplishment for the city. By 1882, saltwater intrusion had made the system unusable, so a dam was erected across adjacent Hogans Creek, and the resulting pond was temporarily used as the water supply. Beginning in 1884, wells were sunk in Waterworks Park, which provided an ample supply of fresh water. In 1897, a new reservoir was built, and the facility was further expanded in 1907 to house an 8-milliongallon (MG) pump. The current waterworks facility was built from the expansion of the
Original water pump house, circa late 1800s.
4 October 2026 • Florida Water Resources Journal
Continued on page 6
Continued from page 4 existing structure that took place between June 1914 to October 1917 and added two Reynolds-Corliss steam engines used to drive Allis-Chalmers water pumps. The pump was declared a local historic landmark in 1976, and the building received the AWWA Water Landmark Award in 1988. Jacksonville’s drinking water is sourced from the Floridan aquifer, which is protected from chemical contamination by a thick confining layer of clay that prevents contaminants from entering it. After being pumped from the wells, the water is aerated to remove sulfur compounds and then chlorinated to kill bacteria.
Main Street Water Treatment Facility’s Growth Milestones in the growth of the facility include: S 1880: 1.5 mgd from 30-feet-below-grade underground streams S 1889: More than 5 mgd from more than 600-feet-deep Floridan aquifer wells S 1896-7: 50-feet-diameter aeration basin and reservoir constructed; two 5-mgd pumps installed S 1907: New 8-mgd pump installed S 1911: Additional 3-MG underground reservoir completed S 1915: Two 12-mgd Allis Chalmers water pumps added S 1 924: Up to 13 mgd produced from 15 wells S 2013: Replaced underground reservoir with a new 3-MG storage tank S Now: Eight high-service pumps added with a combined capacity of 30 mgd
Jacksonville’s water operations grew from a city government department to an independent authority created by the consolidation of city and county governments in 1967. On June 1, 1997, Jacksonville’s water and sewer systems became part of the utility service offerings provided by the Jacksonville Electric Authority, the city’s independent municipal utility. It was at that time that the authority changed the name to the nonacronymous “JEA.” Other smaller water utilities in the area were acquired by JEA, which expanded its service territory to include parts of Nassau, Clay, and St. Johns counties. The JEA now has 39 water treatment plants and 5,244 miles of delivery system pipe to serve an estimated 444,000 customers. The utility delivers more than 120 MG of water each day to residential and commercial customers. In 2001, the water plant was again renovated to preserve deteriorating structures, modernize the water production facility, and consolidate five existing water laboratories into a centrally located one. Today, there are 11 wells with a combined capacity of nearly 35 mgd, and the facility remains a backbone of Jacksonville’s water supply, supporting Florida’s most populous city with reliable, high-quality drinking water.
Purification Center Created Water shapes everything in Florida, from its economy and environment to the way people live. That’s why Jacksonville has strategically planned for the next century by diversifying and bolstering its water supply with its JEA H2.0®Purification Center.
The H2.0 Purification Center, completed on Jacksonville’s south side in 2026, serves as Florida’s first advanced water purification facility, a demonstration site for training and visitor education. The facility mimics the Floridan aquifer, which naturally replenishes the city’s water supply—just more efficiently, in a shorter amount of time, and over a smaller footprint. The center serves as an interactive hub of innovation and community engagement while setting a new standard for potable water reuse in the Sunshine State.
Looking to the Future As FSAWWA celebrates its 100th anniversary, the historic facilities featured in this series—spanning from 1894 to the 1920s—stand as powerful reminders of the vision, dedication, and engineering excellence that built Florida’s modern water systems. From Miami‑Dade to Tampa to Jacksonville, these century‑old plants have supported public health, economic development, and community resilience across generations. Their continued operation is a testament to the water professionals who maintain them and to the communities that have invested in their longevity. As Florida looks toward its next century of growth, these landmarks provide both inspiration and guidance. They remind us that the future of water depends on the same principles that shaped its past: thoughtful planning, continuous investment, and a steadfast commitment to protecting public health. S
Jacksonville’s Water System Evolution S 1950s: Mechanical upgrades S 1980s: Disinfection improvements S 2000s: Automation and supervisory control and data acquisition improvements and a switch from gas chlorine to sodium hypochlorite for disinfection S 2020s: Florida’s first potable water reuse facility built JEA water purification team members outside the H2.0 Purification Center in 2026.
6 October 2026 • Florida Water Resources Journal
All trademarks owned by Lakeside Equipment Corporation. © 2026 Lakeside Equipment Corporation.
WE STAND OUT FROM THE CROWD. As you would expect from Lakeside, our Raptor® Multi-Rake Bar Screen is an efficient, proven screen technology for rapid removal of inorganic solids in municipal and industrial applications. But what sets it apart is the simple fact that ours is built to Lakeside’s renowned standards and features superior quality. As with everything we do, our Raptor Multi-Rake Bar Screen is well-engineered, designed for optimum performance and durability, and is manufactured in the USA. That’s important on a lot of levels. When critical decisions are made on design and specifications, stand out with the Lakeside Raptor Multi-Rake Bar Screen, the gold standard of the industry.
REPRESENTED LOCALLY BY:
Trippensee Shaw, Inc. Eustis, Sebring, & Mount Dora, FL www.TrippenseeShaw.com T: 407.222.0575 Florida Panhandle Only T: 205.424.7570 www.eshelmancompany.com
Cleaner Water for a Brighter Future® Speak to one of our experts at 630.837.5640, email us at sales@lakeside-equipment.com, or visit www.lakeside-equipment.com for more product information.
Raptor® Screening Products Fine Screen Micro Strainer Rotating Drum Screen Septage Acceptance Plant Septage Complete Plant Complete Plant Multi-Rake Bar Screen FalconRake® Bar Screen Rotary Strainer Screen Wash Press
CSID Celebrates 60 Years of Delivering Award-Winning Drinking Water, Wastewater Treatment, and Flood Control In September 1966 the Florida Legislature founded the Coral Springs Drainage District. It was the sister special district of the Acme Drainage District in Wellington, with both sharing the same structure and engineering firm Gee and Jenson, a prominent Floridabased firm with a client base that includes the Port of Palm Beach and Walt Disney World. Westinghouse was the district’s designer.
Florida Section AWWA Water Distribution System of the Year in 2025 and Special District of the Year from the Florida Association of Special Districts in 2022, CSID has worked with Palm Beach State College in providing treatment plant tours to water students and has hired several college graduates.
Growth, Change, and Recognition
The conventional lime softening water process was upgraded in 2016 to a low-pressure reverse osmosis (RO) water treatment facility, with the source water being the surficial Biscayne Aquifer. At that time, CSID became one of Broward County’s first public water systems to achieve certified 4-log virus inactivation. The process has three stainless steel strainers with six filters that filter any particulate larger that 50 microns. After reaching the sand strainers the water flows to the three cartridge filters with 176 elements that are particle safeguards and remove material larger than 5 microns. The facility has the capacity to supply 10 million gallons per day of this pretreated water that adds chemical pretreatment with
The City of Coral Springs started to grow in population, with many new commercial and residential developments that included colonial-style architecture. The responsibilities of the district for the area’s water supply played a vital role in supporting the city’s growth. In 1970 the Legislature changed the name of the district to Coral Springs Improvement District (CSID). It’s governed by a fivemember board of supervisors who live and own property in the area, with their focus on sustainable regional utility management and infrastructure upkeep. With notable recognitions, like the
Upgrades and Replacements
Lead operator Rodger Dunbar (right) with students and cartridge filters.
8 October 2026 • Florida Water Resources Journal
antiscalant and sulfuric acid to the RO trains via 250-horsepower feed pumps. Each RO train has 50 pressure vessels with seven elements per vessel separating impurities down to 0.0005 microns. The RO permeate water flows upward to the subsequent degasification process to remove hydrogen sulfide and carbon dioxide. Then, 10 to 15 percent retreated raw water is bypassed to the clearwell to raise the waters alkalinity and hardness for stabilization before being disinfected with chloramines. Finally, the finished water has orthophosphates added before being stored in the three onsite ground storage tanks for corrosion control. This year CSID has launched a districtwide water meter replacement program to modernize its metering system, providing customers with more-accurate and reliable water usage information. The project will replace approximately 10,000 residential, irrigation, and commercial water meters with advanced metering infrastructure smart meters. This program is funded through the CSID capital improvements program and will not require a water rate increase related to the project. Continued on page 10
Rodger (right) with students and microsand strainers.
Florida Water Resources Journal • October 2026 9
Continued from page 8
Service and Commitment The 60-year story of CSID is ultimately one of steady stewardship—an organization that has grown with its community while never losing sight of its core mission to protect public health, safeguard infrastructure, and deliver reliable service. From pioneering treatment upgrades to modernizing metering systems, CSID continues to invest in the future with the same dedication that shaped its past. As Coral Springs moves forward, CSID’s commitment to innovation, education, and operational excellence ensures that residents will benefit from its resilient water, wastewater, and flood control services. S
Students at the reverse osmosis trains.
Rodger (left) discusses silt density index analysis.
Rodger (left) with students and other instructors.
Students and instructors at the storage tanks.
Rodger pointing to degassing system.
10 October 2026 • Florida Water Resources Journal
YOUR NEW DISTRIBUTOR
We Upgraded. So Should you. Built for Florida’s sand and grit, the Barnes Razor grinder’s hardened axial cutter and wear-resistant design reduces solids, fights abrasion, and cuts downtime. Upgrade your stations with the Razor for lasting performance, advanced technology, and better support. We’ve upgraded to Razor by Barnes. Now it’s your turn. Inventory stocked and ready for your switch.
Contact FJ Nugent today. 407.936.1139
F W R J
Fast-Tracking Field Inspections and Leveraging Statistical Analysis: Reducing “Unknowns” for Tallahassee’s Service Line Inventory Jennifer E.C. Porter, Diane Quigley, and Eric Balon
T
he City of Tallahassee (city) provides water to the residents of Tallahassee and a small portion of Wakulla County through over 91,000 water service connections. Tallahassee was established as a city in 1825, following a decision by the legislature to locate the capital of the new Florida Territory midway between St. Augustine and Pensacola, decades before Florida became the 27th state. During its first 150 years, Tallahassee expanded from a quarter of a mile in size to 28.2 sq mi by 1980. Since then, the city has witnessed tremendous growth, annexing an additional 75 sq mi and distributing potable drinking water to approximately 200,000 customers through a piping network of over 1,400 mi. Like all other water utilities, Tallahassee has been tasked with determining the water service line materials on both the public and private side of its water services to remain in compliance with the U.S. Environmental Protection Agency (EPA) Lead and Copper Rule Revisions, now the Lead and Copper Rule Improvements (LCRI). A project to categorize the public and private portions of the water service lines and develop the initial water service line inventory was initiated in March 2023. The
first task of the project included the review of pertinent records, including construction and plumbing codes, tap cards, work order notes, distribution system maps and drawings, historical inspection records on each service connection, meter installation records, historical capital improvement plans, historical inspection records for the distribution system, and historical lead and copper tap sampling results. Additionally, interviews were conducted with long-term and retired city utility employees to gather information about field observations. Utilizing the information obtained from the data/document review, the city’s existing geospatial databases, and a new service line feature layer, the public-side and private-side service lines were designated as one of the following: S Lead S Galvanized requiring replacement S Nonlead S Lead status unknown The initial inventory was completed in October 2024, along with the deployment of the publicly available inventory map and the city’s Lead and Copper Rule website.
Table 1. Minimum Number of Validations Required
Size of Validation Pool
Number of Validations Required
<1,500
20% of validation pool
1,500 to 2,000
322
2,001 to 3,000
341
3,001 to 4,000
351
4,001 to 6,000
361
6,001 to 10,000
371
10,001 to 50,000
381
>50,000
384
12 October 2026 • Florida Water Resources Journal
Jennifer E. C. Porter, P.E, CPM, is manager– water operations for the City of Tallahassee. Diane Quigley, AICP, CFM, is a principal and senior project manager with Stantec in Tallahassee. Eric Balon is project manager with CHA Consulting in Tampa.
The results of the initial inventory left the city with approximately 33,000 unknown service lines, which resulted in 33,000 customer notifications in November 2025. To reduce the number of unknowns ahead of last November’s customer notification date, the city decided to implement an aggressive field meter box inspection program. The following sections will illustrate the approach and findings from this expedited program.
Approach Address Selection The city’s initial inventory identified more than 33,000 service lines with unknown materials. Under the LCRI, all these unknowns must be verified; however, EPA allows utilities to use statistical analysis based on a set of physical inspection results to reduce the number of unknowns in the system rather than physically testing every service line at customer meter boxes. From the pool of unknowns, addresses were randomly selected, providing a subset of addresses for field verification that represented a statistically unbiased crosssection of the service area. The minimum validation requirements from EPA specify that for systems with more than 10,000, but fewer than 50,000 unknowns, at least 381 service line validations on both the public side and private side are required (Table 1). To provide statistical confidence and allow for inaccessible sites that cannot be inventoried, Stantec prepared a total list of 600 randomly selected addresses for visual field verification. Additionally, based on responses to Continued on page 14
Florida Water Resources Journal • October 2026 13
Continued from page 12 the letters sent to the community regarding unknown service lines, another 36 locations were included in the inventory. Residents at these locations indicated a concern for possible lead at their business or home. These locations were also visually field-tested to allay these concerns; however, they were not included in the statistical analysis for the random sampling.
Figure 1. Randomly selected field verification locations.
Figure 2. Copper service line.
Figure 3. Polyvinyl chloride service line.
14 October 2026 • Florida Water Resources Journal
Field Verification Methods Visual field verifications were then conducted at the randomly selected addresses with unknown water service line material (Figure 1). Inspections were limited to the portions of the service line visible within the customer meter box. Service line segments outside of the meter box were not exposed or inspected. Field verification was conducted in three waves, each targeting approximately 200 addresses. For the field testing and inventory, service line material was verified by performing visual, magnet, and scratch tests on the private and public side by the Stantec field team. Inspection was conducted on the portions of the public- and private-sector lines located within the water meter box. The crews were equipped with a companyconfigured tablet containing ArcGIS Field Maps, a digging device such as a shovel, a scraping tool (screwdriver), and a magnet. Once the crew arrived onsite, a “before” photo was taken to capture the surrounding features of the meter box and indicate the private and public sides. The crew visually inspected the inside of the meter box, noted the color of the line, then conducted a scratch test and/or a magnet test to determine the material of the water service line. Commonly found service line materials are copper, polyvinyl chloride
Figure 4. Galvanized steel service line.
(PVC), galvanized steel, and lead. The EPA recommends a scratch and magnet test or its approved swab test for identification. For this effort, the team used magnet/scratch tests for easy and accuracy: magnets adhere to galvanized steel, but not copper, lead, or PVC, and a visible scratch indicates the softer surface of lead (a scratch on copper also helps confirm its distinctive color). Where the underlying material was a shiny silver, a magnet test was conducted to differentiate between lead (nonmagnetic) and galvanized steel (magnetic). A screwdriver was used for the scratch test if the magnet test was unable to yield results. The field team took a photo record for validation and uploaded it to the working ArcGIS Field Maps and database, along with additional collected details to help confirm the material of the service line per side. Figures 2 through 4 illustrate the service line materials encountered during the field tests. In rare cases, an address could not be accessed due to water leaks, not being able to locate the meter box, multiple boxes, accessibility issues, and tree roots. Further, service line material could not always be identified on either the private side or public side, or both sides due to pipe outside of box. At addresses where sites were inaccessible or not able to be visually inspected, the locations were noted in the database as unknown and were not counted in the required public or private service line sampling quantities. The entire-service line was classified as unknown if the private-side material remained unknown following field assessment or if the public-side material remained unknown and the private side was classified as nonlead. If the private-side material was identified as galvanized, the entire-service line was also classified as such, unless nonlead was identified on the public-side material classification. Finally, all other observations (i.e., private side: nonlead; public side: nonlead or galvanized) were classified as nonlead across the entire-service line as no lead was found. A summary of the service line materials classification is detailed in Table 2. The field crew was able to access the randomized inspection addresses on the ArcGIS Field Maps via the field tablets and enter the field investigation findings immediately from the field. Figure 5 provides a snapshot of the ArcGIS field inspection inputs. The information was uploaded to the database and reviewed at the end of each day, and a quality assessment/quality control (QA/QC) analysis was conducted on the field data to confirm the number of inspections Continued on page 16
Table 2. Entire-Service Line Material Classification Rubric Based on Public-Side and Private-Side Classifications
Public Side
Private Side
Entire
Unknown
Unknown
Unknown
Galvanized
Unknown
Unknown
Nonlead
Unknown
Unknown
Unknown
Nonlead
Unknown
Nonlead
Galvanized
Nonlead
Unknown
Galvanized
Galvanized
Galvanized
Galvanized
Galvanized
Nonlead
Nonlead
Nonlead
Galvanized
Nonlead
Nonlead
Figure 5. Working ArcGIS field inspection inputs.
Table 3. Field Inspected Service Line Materials by Sector
Sector
Number of Material Verifications
Field Verifications
627
Private-Side
391
City-Side
464
Entire-Service Line
382
Florida Water Resources Journal • October 2026 15
Continued from page 15 completed each day. Overall, the team completed 627 service line field verifications, yielding definitive material classifications for 391 private-side lines, 464 public-side lines, and 382 entire-service lines. Table 3 provides a breakdown of the field-inspected service lines. The initial geographic information system (GIS) inventory files were updated with the field verification information and were provided to the city for uploading into its
GIS data library to create an updated publicfacing inventory map on its website. Confirmation of Field Verifications The QA/QC was performed by nonfield staff on all data and images uploaded to ArcGIS from field investigations. Figure 6 displays the field tracking dashboard. If the service line material provided by the field crews could not be verified by QA/QC personnel, it was flagged and labeled as a
Figure 6. ArcGIS field tracking dashboard.
revisit address for the field team to return to. If the service line material still could not be verified by QA/QC personnel, it was treated as an unknown service line. In cases where meter boxes were unable to be inspected, such as when a meter box couldn’t be located, the pipe was outside of box, the meter box was not accessible, or materials such as dirt, roots, and water protruded inside the box, material was treated as unknown. Upon completion of the field investigation program, no service lines were suspected or confirmed to be lead. An added benefit to the field investigation within meter boxes included the discovery of active leaks that were compiled in a list by the QA/QC personnel and distributed to city officials to complete repairs. Assessment of Field Verification Representativeness Following completion of the visual field verifications, further analysis was conducted to confirm how well the service lines, for which material was definitively identified, represented the broader list of unknowns. The purpose of these analyses was to avoid potential bias when inferring the systemwide probabilities of lead. Specifically, the locations where materials were definitively identified (separately for the public sides, private sides, and entire-service lines) were compared to the full list of unknowns with regard to: S G eographic location (i.e., easting and northing) S A ge (via year built) S O ccurrence within areas of concern (i.e., disadvantaged neighborhood or sensitive area, as defined in the city’s Service Line Identification Action Plan1). Comparisons were made visually and using formal statistical tests. Visual comparisons were done using either density plots to compare distributions of continuous variables (i.e., easting, northing, and year built), or bar graphs showing proportions of addresses inside or outside disadvantaged neighborhoods, or separately, sensitive areas. In all cases, the distributions of the data were not significantly different from one another, indicating that the field-verified service lines provide good representation of the broader “population of unknowns.”
Figure 7. Preliminary summary of verified materials from field verification of city service lines.
16 October 2026 • Florida Water Resources Journal
Service Line Material Verification Results Figure 7 summarizes the types of service line materials for each sector, and Figure 8 illustrates the locations of the materials identified. Results from the expanded field inventory effort confirmed that none of the
inspected service lines were composed of lead. Bar heights and text are counts of material types on the city side and private side of the lines, and across entire lines. No lead was identified for the city system.
Statistical Analysis The statistical analysis method was used, as opposed to the predictive modeling method, since no lead was found during field investigations. The statistical analysis method is valid for classifying materials for the development of service line inventory based on Florida Department of Environmental Protection (FDEP) and EPA requirements. Statistical methods can be applied to the results of field verifications of service line materials to infer, with a stated degree of confidence, the probability that the unknown city service lines contain no lead. The only way to prove categorically (i.e., with 100 percent confidence) that there is no lead in a utility system is to inspect all sections of all lines; however, given the impracticality of such holistic sampling, statistical methods offer a more efficient means of extrapolating the likelihood of lead based on a subset of field verifications. Based on the observation of no lead in 382 entire-service lines, 464 public-side service lines, and 391 private-side service lines, a probability of lead occurring throughout the city can be estimated. Across the city’s 91,465 service lines, there were previously no known lead lines and 33,375 lines for which the entireservice line was classified as unknown. Given these 33,375 unknown classifications and based on the field verification of no lead in 382 service lines, binomial statistical analysis indicates with 95 percent confidence that there will be less than 271 lead service lines across all 33,375 unknown classification service lines. This upper limit of 271, expressed across all service lines in the system, means that the probability of lead occurring among all 91,465 service lines is 0.296 percent; hence, the probability that there are no service lines with lead across both sides of the line is 99.7 percent. Further, if lead does occur, one can conclude, with 95 percent confidence, that there would be at most 271 instances in which the entire-service lines would be classified as lead. Following similar logic, the field verification results also allow inferences specific to the public side and private side of the city’s service lines. It can be concluded with 95 percent confidence that no more than 0.145 percent (i.e., 133 of 91,465) of publicside service lines and 0.263 percent (i.e., 241
Figure 8. Field-verified materials map.
of 91,464) of private-side service lines contain lead. Therefore, there is 95 percent confidence that the probabilities of there being no lead in the public side and private sides of service lines respectively are 99.9 and 99.7 percent.
Conclusion A comprehensive lead service line inventory was completed by performing more than the minimum required amount of field inspections and leveraging the use of FDEPapproved statistical analysis. Since no lead was discovered during the 464 public-side and 391 private-side inspections, the statistical analysis then confirmed, with 95 percent confidence,
that the probability of lead in the remaining unknowns is less than 0.3 percent. It also concluded that no more than 0.145 percent (i.e., 133 of 91,465) of public-side service lines and 0.263 percent (i.e., 241 of 91,464) of private-side service lines contain lead. This provides strong evidence that the city is a nonlead water system. The entire process resulted in cost savings with the use of representative inspections and statistical analysis. The result was a fully complete service line inventory which was resubmitted to FDEP. The results considerably decreased the number of unknowns and substantially decreased the number of letters Tallahassee needed to send to its constituents. S
Florida Water Resources Journal • October 2026 17
2026 Drop Savers Contest
Drop Savers Poster Contest Winners Announced Melissa Velez Every year the Florida Section of the American Water Works Association (FSAWWA) sponsors the “Drop Savers” Water Conservation Poster Contest. Students from Kindergarten to 12th grade are encouraged to create a poster depicting a water conservation idea in slogan form, drawing form, or both. The contest allows students to promote water awareness and the importance of water conservation in their daily routines. Posters are designated under one of the following categories: S Division 1 - Kindergarten and First Grade S Division 2 - Second and Third Grade S Division 3 - Fourth and Fifth Grade S Division 4 - Middle School: Grades Six, Seven, and Eight S Division 5 - High School: Grades Nine, Ten, Eleven, and Twelve
Rules for the contest include: S Posters are drawn on 8 ½-inch x 11-inch white paper (horizontally or vertically). S Each poster must portray a water conservation idea in a slogan, drawing, or both. Students may use crayons, paint, color pencils, or markers. No highlighters, photos, or computer graphics are permitted. S Students must work on posters individually, otherwise posters will be disqualified. S Only original artwork will be accepted (i.e., no trademarked or copyrighted materials). The responsibility of the Drop Savers Committee is to invite and provide each water utility in Florida with the guidelines for running their own poster contest. Once water utilities select their winners, they send the firstplace winner’s poster to the committee, where they participate in the state competition. This year, there were over 100 posters from 32 water utilities that participated in the contest.
The prizes for this year included: S First-Place Winners: • $100 Amazon gift card • Plaque displaying the poster • Calendar displaying the poster • Water conservation kit • Certificate S Second-Place Winners: • $75 Amazon gift card • Calendar displaying the poster • Water conservation kit • Certificate S Third-Place Winners: • $50 Amazon gift card • Calendar displaying the poster • Water conservation kit • Certificate The winning Drop Savers posters are pictured here. Melissa Velez, P.E., LEED AP, is a project manager at Black & Veatch in Coral Springs. S
DIVISION 1
DIVISION 1 – FIRST PLACE City of Sunrise Ruth Doyen
DIVISION 1 – SECOND PLACE City of Clermont Lilly Stoddart
18 October 2026 • Florida Water Resources Journal
DIVISION 1 – THIRD PLACE City of Margate Ameer Johnson
2026 Drop Savers Contest DIVISION 2
DIVISION 2 – FIRST PLACE Gainesville Regional Utilities Aurora Montecino-Mora
DIVISION 2 – SECOND PLACE City of Margate Iasmim Pereira
DIVISION 2 – THIRD PLACE Manatee County Utilities Department Leonardo Margarella
DIVISION 3
DIVISION 3 – FIRST PLACE Miami-Dade Water and Sewer Department Juanita Correa Velasquez
DIVISION 3 – SECOND PLACE Charlotte County Deja Noel
DIVISION 3 – THIRD PLACE Toho Water Isaiah Daly
DIVISION 4
DIVISION 4 – FIRST PLACE City of Casselberry Anni Zhu
DIVISION 4 – SECOND PLACE Charlotte County Utilities Eloise Randall
DIVISION 4 – THIRD PLACE Town of Jupiter Utilities Giahna Lipset
Florida Water Resources Journal • October 2026 19
2026 Drop Savers Contest DIVISION 5
DIVISION 5 – FIRST PLACE Town of Jupiter Caroline McCarthy
DIVISION 5 – SECOND PLACE City of Sunrise Maria Alice Souza Cunha
20 October 2026 • Florida Water Resources Journal
DIVISION 5 – THIRD PLACE Citrus County Utilities Carmen Bryan
Florida Water Resources Journal • October 2026 21
C FACTOR
October 1: New Year, New Budget, New Equipment? Kevin Shopshire
President, FWPCOA
H
appy October everyone! Has the weather started cooling? Not as of September, when I got to write this column attempting to predict the future. October 1 brings in pumpkin spice (everything), orange and brown wreaths on the doors, Halloween door mats, and a new budget year for most municipalities. Tis the season to paper your boss and/or procurement person with purchase requests!
Ordering Options What are you ordering this season? Are you restocking, replacing, or ordering new upgrades? Each option comes with challenges that you need to be trained in. Restocking This could be a simple process of
New transfer pump replacement being installed.
reordering offices supplies, safety equipment, or workplace chemicals. Why does this require training? There is math involved, with inventory, supply, and price comparisons. Your knowledge of the math involved will impact your facility’s ability to operate properly. If you’re not entirely using the computer, there will be customer service involved—on both sides of the conversations. Be sure to be professional in your interactions. You are representing your facility, and possibly your entire municipality or business. Warren Buffett once stated, “It takes twenty years to build a reputation and only five minutes to ruin it.” Replacing Equipment doesn’t last forever. Whether that equipment is 25 years old or 13 months, it’s going to need replacing. A lot of equipment replacement is budgeted, but sometimes “stuff happens.” Now you need a new piece of equipment. You’re back to the previously mentioned math and customer service skills. Now add maintenance (removal and installation) and operation skills for the new equipment. For maintenance, who is removing the old
New lift station pump in case there’s a need for replacement.
22 October 2026 • Florida Water Resources Journal
equipment? It could be an in-line pH monitor or a high-service reclaimed distribution pump; either way, are you qualified to remove and install the equipment? Here’s another venue for training, be it in-house, travel, or by sales representatives. Proper removal and installation will have major ramifications. How about the operation of the new equipment? Be sure to be trained on any new piece of equipment you may have contact with at your facility. I’ve previously written about some sales reps offering training of their equipment onsite. Ordering New Upgrades Some of this mirrors the previous information regarding replacement, with the addition of the obvious fact that technology changes. Equipment is made differently than it was 20, 10, or even one year ago. Those flanges or bolts may be made of completely different materials, requiring different handling during installation. Technology is changing faster than I can type a C Factor column. Did you get educated on the new in-line pH meter or its smart device features? Your understanding of the technology involved with the new equipment
New upgraded turbidimeter installed.
In Memoriam
Arthur “Art” Saey 1948-2026
can determine its successful integration into your treatment plant, and also the future of your career. So, October is here. Your budget has reset, hopefully to your benefit. Be involved, write it down (or it didn’t happen), and share the knowledge. You, and your assumedly perfect and legible notes, could be the source of training for the future generations of workers at your facility.
FWPCOA Committee Spotlight: Safety Committee The purpose of this committee is to develop, organize, schedule, and/or approve classes to coordinate safety training courses in Florida. The committee shall determine the criteria and assist the training director and the FWPCOA regions in scheduling the speakers and instructors for the schools. Each year this committee collects award applications so that the association can recognize those facilities that have an outstanding safety record with an awards plaque and public recognition in this magazine. These plaques are presented at the annual awards luncheon in conjunction with the Fall Short School. If you feel your facility is award-worthy, download the safety award application from our website. If you’d like to be involved with this committee, whether it be training or award selection, please reach out to our current committee chair, Ms. Renee Moticker, at safety@fwpcoa.org.
Upcoming Meeting Our next weekend of board of directors meetings will be Oct. 10-11, 2026, at Seacoast Utilities in Palm Beach Gardens. If you’re not already planning on going, it’s worth the trip! I hope to see you there! S
Arthur “Art” Saey, 78, passed away peacefully on Aug. 4, 2026, in Fort Lauderdale, where he lived. Art was born in Miami to Arthur and Gloria Saey, on March 17, 1948. Art graduated from Miami High School in 1967. While there, he excelled in football, swimming, basketball, and track (shot put). After high school Art continued his education and received associate of arts and associate of science degrees. He concluded his formal education at Florida International University, earning a bachelor’s degree in public administration. During his career, he continued to add to his knowledge. He gained numerous professional certifications, and held state licenses in water, wastewater, and stormwater. Art was devoted to public service. He worked for the City of Fort Lauderdale for 30 years, starting as a service worker and retiring as the stormwater manager. After leaving Fort Lauderdale he continued his career with the City of Oakland Park for another 14 years. During this time Art served as the interim assistant director before continuing as manager of streets and stormwater until retiring in 2018. The family wishes to thank Art’s crew members for the respect, friendship, and professionalism shown to him. It was a pleasure for him to work with all of them. Art loved his career field and was involved in many of its facets. As an honorary life member of the Florida Water and Pollution Control Operators Association (FWPCOA), he served as president for three terms. He also taught certification classes throughout Florida and was proud to have completed his 100th class. In his honor, Region 7 of FWPCOA initiated the Arthur P. Saey Award, which is for the outstanding regional member of the year. Art served as the educational chair for the state level of FWPCOA from 2008-2017. He also spearheaded, and was responsible for, the establishment of licensing for Florida water distribution employees. During his time as a FWPCOA member, Art formed many close friendships and bonds that continued for decades. Art was inducted into the Florida Select Society of Sanitary Sludge Shovelers in the Class of 2002 at the Florida Water Resource Conference. He was very proud of this
honor. He was also a member of the Doric Lodge, No. 140, of the Free and Accepted Masons. Beyond his professional accomplishments, Art was deeply committed to his community. He coached youth soccer and softball for many years, positively influencing the lives of countless young athletes and their families. His experiences with these young people were some of his fondest memories. As involved as Art was in the community, he managed to find time for various hobbies. Model railroading topped his list. He had a passion for the history of the Civil War, World War II, and the ancient civilizations of Egypt. He bred Siamese fighting fish (Betta splendens) and competed in fish shows nationally and internationally. He won many awards and was the top breeder nationwide two years in a row. It was after graduating high school in the summer of 1967 that Art would meet his future wife, Alexis Fazzini, that December. Art and Alexis were married July 5, 1969, in Fort Lauderdale. They had an amazing life together and were fortunate to have recently celebrated their 57th wedding anniversary. Art was a loving and devoted husband and father. His family was his greatest joy and he was theirs. Art was preceded in death by his parents, sister Debra Saey Chandler, grandmother Hilda Kiedaisch, and Aunt Dolly Craig. He is survived by his loving wife, Alexis, his daughters Alexandria Saey Burke (Alen) and Erin Saey Richter (Kerrin), grandson Michael, sister-in-law Ramona Sasso, niece Emily Kiffen (Marquise), and great niece London. Also included in his family is Gregory P. Peck, Christine Ray, and brother Gary Saey.S
Florida Water Resources Journal • October 2026 23
How to Tap Your Innovation Pipeline When Your Organization is Tapped Out: Three Ways to Unlock Your Organization’s Hidden Innovation Potential Rebecca Okamoto Stress. Uncertainty. Unrealistic deadlines. Unreasonable goals. You know what they are: the enemy of teamwork, creativity, and innovation. They’re also inescapable, which leaves today’s leaders in an unenviable position: how to build the capability to achieve company goals while dealing with massive uncertainty. But what if you could grow skills, build resilient teams, and accelerate innovative thinking even though there’s no time, few resources, and high instability? You can. Because every organization has an untapped innovation engine hiding in plain sight: the Lost Einstein. •
The Lost Einstein in Your Organization Your Lost Einstein is a super-smart person with a game-changing concept that no one understands. They struggle to explain the strategic value of something, and because of that, their ideas and potential aren’t seen, heard, or recognized.
You know who they are. The brainy person with the meticulous spreadsheets and multivariate testing results. The super-sharp engineer whose English skills make them hard to understand. The operations leader who didn’t learn to read the room and got a couple of eye rolls at the last meeting update. Or even the introvert you’ve been ignoring because they never speak up.
Does It Really Matter? How Much Potential Are We Talking About? Consider this: For the past 10 years the annual Gallup worldwide engagement survey has been reporting that 64 to 70 percent of organizations have workers who are disengaged. And over time, that percentage hasn’t budged much, averaging 67 percent. To put this into context: if 67 percent of the players on a professional soccer team were disengaged, that would mean out of 11 players, seven to eight of them aren’t playing to win. In fact, one or two of them would be actively disengaged, as in fighting with their teammates, sabotaging the play, or even helping the competition. Would this be acceptable, especially if the team wanted to be championship contenders? What if you could tap into that missing
24 October 2026 • Florida Water Resources Journal
capability? And what if the solution didn’t sacrifice short-term results, require a major culture reset, or take years of investment?
The Hidden Innovation Engine Hiding in Plain Sight You know what makes your Lost Einsteins so valuable? They’re already on your team and want to be more engaged. They have great ideas that are going unrecognized. You just need a better way to maximize their capability. But don’t overlook them for too long. What makes them valuable to you makes them invaluable to other organizations.
Tapping the Potential of Lost Einsteins Here are three ways you can tap into your Lost Einstein’s potential. Invest in Executive Clarity Skills for Managers Presenting to Senior Stakeholders Your smart managers are excellent at problem solving, running projects, and directing day-to-day activities. This is perfect for interacting with their functional colleagues, but not for communicating
with time-pressed senior leadership and influencing businesswide agendas. Without executive clarity skills some of your best leaders are getting tuned out, uninvited to meetings, or hearing “no” to groundbreaking ideas. Don’t just hand them a presentation template. Give them the skills to: S Explain the strategic and commercial value of breakthrough ideas S Read executive audiences and create messages that resonate with time-pressed executives S Identify, define, and pitch the big picture S Pinpoint the strategic barriers to “yes” and shift mindsets S Navigate the executive alignment minefield and influence up Clarity skills aren’t about speaking better; they’re about being better understood. Improve Executive Presence First impressions really matter. Research shows first impressions can be made in a blink of an eye1, by the pitch of your voice2 or even by how you say hello3. Don’t just think about what your leaders are saying; help them with how they are communicating. For example, offer training on: S Concise, engaging introductions to create a power first impression S Executive intonation so they sound more confident S Introducing topics and avoiding hedge words that can damage credibility Enable Introverts and Quiet Leaders to Speak Up More Speaking up is a critical skill to get breakthrough concepts recognized for their strategic importance. That’s because the more outside the box the idea is, the more times speakers will hear “no,” get interrupted, or provoke a “here’s why you’re wrong” response. Here’s the thing about Lost Einsteins—
they already struggle with speaking up. Drowning out their ideas makes it worse. Instead, try techniques like: S Rotate meeting leadership to equalize the opportunity to build and demonstrate skills like priority setting and conflict management. S Actively moderate meetings to avoid or reduce interruptions. S Adopt an amplification strategy: when a quiet team member, like an introvert, or a new or junior member makes a point, another team member repeats their point and credits them. Amplification helps counteract interruptions or crediting the wrong source.
Lost Einsteins are Your Organization’s Unrealized Innovation Engine Your Lost Einsteins can accelerate innovation and unlock value even when there’s little time, shrinking budgets, and mounting uncertainty.
You know who they are. And now you know how to develop them and tap into your company’s extra gear. Rebecca Okamoto is a clarity consultant, and the founder of Evoke Strategy Group. She consults with companies on sharpening their competitive edge by tapping overlooked or underutilized talent. She specializes in teaching high-potential and technical leaders to communicate clearly in dynamic, high-stakes situations. Her signature approach is how to introduce, market, and influence with a 20-word sound bite. To learn more about pitching big ideas and making complicated ideas clear visit 20words.com. S p rinceton.edu/news/2006/08/22/snap-judgments-decide-faces-character-psychologist-finds 2 p rinceton.edu/news/2006/08/22/snap-judgments-decide-faces-character-psychologist-finds 3 e prints.gla.ac.uk/149313/ 1
Florida Water Resources Journal • October 2026 25
F W R J
Modernizing Existing Water Treatment Facilities Through Emerging Technologies
T
he David L. Tippin Water Treatment Facility (WTF) is owned and operated by the City of Tampa Water Department and uses the Hillsborough River as its primary water source. The original plant was constructed in the 1920s and had a treatment capacity of approximately 8 mil gal per day (mgd). The WTF has since undergone several expansions and process modifications. By 2023, it was routinely producing an average of approximately 80 mgd of potable water. The present treatment configuration is the result of several decades of modifications; a major upgrade completed in the early 2000s added 40 mgd of treatment capacity to the existing 80-mgd flocculation and sedimentation system through the addition of high-rate Actiflo clarification. Ozone facilities were also installed with a treatment capacity of up to 120 mgd. The ozone system included two 3,500-lbs/day ozone generators, two contact basins, two 300-ton ozone chillers, and three 13,000-gal liquid oxygen storage tanks. It’s important to note that ozone replaced chlorine as the primary disinfectant, while chlorine and ammonia continued to be applied
Oscar Serrato after filtration to maintain a disinfectant residual in the distribution system. Filtration was also modified during the project. Twenty-nine of the WTF’s 30 filters received new underdrains and granular activated carbon (GAC) media operated in a biological mode. Additional improvements included two belt filter presses for solids dewatering, electrical system upgrades, a new switchgear building, and three 2-megawatt emergency generators. These modifications illustrate how the plant has been expanded by adding and modifying individual unit processes rather than replacing the original facility. Despite these improvements, later master planning identified additional limitations within the treatment process. The WTF operates as an enhanced-coagulation facility and was experiencing high chemical use and cost, low coagulation pH with associated corrosion concerns, high ozone doses, low filter loading rates and unit filter run volumes, limited backwash water handling capacity, and high solids production with poor dewaterability. The combination of high ozone
Figure 1. David L. Tippin Water Treatment Facility in Tampa, circa 1970. The facility illustrates the long service life of water infrastructure that can continue evolving through modernization and technology integration. (photo: George Skip Gandy IV, Gandy Commercial and Aerial Photography Collection, University of South Florida Libraries. Licensed under CC BY 3.0)
26 October 2026 • Florida Water Resources Journal
Oscar Serrato is a mechanical engineer and water treatment specialist with Serrato Industries in Orlando.
demand and bromide in the source water also required bromate mitigation. Tampa evaluated whether removing a larger portion of the dissolved organic matter (DOM) before conventional treatment could reduce some of these downstream demands. Pilot testing therefore focused on ion exchange pretreatment and its effects on coagulation, flocculation, sedimentation, ozonation, and filtration. Rather than evaluating a new process as an isolated treatment step, the study examined how modifying the front end of the plant could affect the performance and operating requirements of the treatment train as a whole.
Suspended Ion Exchange Pilot Testing As part of the WTF’s master planning process, suspended ion exchange (SIX) pretreatment was evaluated as a means of removing DOM before coagulation, ozonation, and filtration. The SIX pilot was operated for approximately 10 and a half months and consisted of a 30-gal-per-minute (gpm) treatment train that included SIX pretreatment followed by coagulation, flocculation, sedimentation, ozone, and biological filtration. This arrangement was important because the study was not limited to measuring ion exchange removal; downstream processes were operated with the SIX-treated water so that changes in chemical demand, ozone requirements, filter loading, and finished water quality could also be measured. The SIX is a continuous anion exchange process in which a strong-base anion resin is contacted with the raw water before conventional treatment. At the WTF, the raw water total organic carbon (TOC) concentration varied considerably during the study and reached values as high as 28 mg/L; even under these conditions, the pilot consistently produced finished water below the project goal of 2 mg/L TOC. Sulfate removal Continued on page 28
See Sediment. Save Money. See, quantify and map sediment in Wastewater Tanks. Oxidation Ditches. Large Diameter Pipes. Make data-driven maintenance and budget decisions.
(866) 982-6531 service@sedivision.com sedivision.com/FWRJ
Continued from page 26 averaged approximately 89 percent, which was expected because the resin also exchanges other anions present in the raw water, not only organic matter. It was noticed that chloride concentration increased following treatment, as chloride on the regenerated resin was exchanged for the target anions. The effect became more apparent in the coagulation process. Full-scale treatment was using an average ferric sulfate dose of approximately 124 mg/L, compared with approximately 45 mg/L in the SIX pilot. Overall, ferric sulfate use was reduced by approximately 64 percent and Floc Aid polymer use by approximately 59 percent. Removal of alkalinity by SIX also allowed the ferric sulfate addition to lower the coagulation pH without the sulfuric acid normally required during much of the year at the full-scale plant; pilot testing also indicated that routine lime addition could potentially be eliminated. A reduction in ferric sulfate is relevant beyond the chemical cost because less metal coagulant also means less chemical sludge entering the solids handling process. Ozonation showed a similar downstream effect. The average applied ozone dose in the pilot was approximately 2 mg/L, compared with 2.9 mg/L at full scale. Later engineering review of the pilot data reported ozone dose reductions ranging from approximately 24 to 41 percent, with an average reduction near 30 percent while maintaining the required disinfection target. This relationship is important at the WTF because natural organic matter (NOM) contributes to ozone demand and the source water contains bromide; under ozonation, bromide can be oxidized to bromate, which has
a drinking water maximum contaminant level of 10 µg/L. Reducing the ozone dose, however, does not remove every operating concern. Ozone at the WTF is used for purposes other than disinfection, including oxidation associated with taste and odor control. Tampa’s water quality goals for geosmin and methylisoborneol are less than 3 ng/L, and a later independent review noted that the pilot did not encounter the highest concentrations of these compounds that can occur in the source water. An ozone dose, therefore, optimized for disinfection after SIX may not always be sufficient for peak taste and odor conditions. Hydrogen peroxide addition, biological GAC contact, and other operating strategies have consequently remained part of the evaluation. Filtration was another area where the change in upstream water quality could be measured. The pilot compared an existing control filter with a deeper-bed configuration. The control filter contained approximately 22 in. of GAC over 12 in. of sand and was tested at loading rates from 3.25 to 8 gpm/sq ft, while the deeper filter contained approximately 63 in. of GAC over 9 in. of sand and was tested between 6 and 10 gpm/sq ft. The allowable headloss was 6 ft for the control filter and 12 ft for the deeper-bed configuration. With lower organic loading and reduced chemical addition upstream, the pilot achieved higher loading rates and greater unit filter run volumes than the existing process. The pilot also identified issues that cannot be evaluated from removal efficiency alone. The SIX pilot requires regeneration with salt, and salt consumption during the study was more than twice that associated with the magnetic
ion exchange process previously evaluated at the WTF, primarily because of regeneration frequency and the less-selective removal of anions. No resin fouling was observed during the approximately 10-and-a-half-month pilot period, but regeneration efficiency, salt use, chloride addition to the treated water, and management of the regeneration waste stream remain design considerations for a full-scale installation. Recycle streams present another issue when moving from pilot- to full-scale operation. The WTF returns water from its solids dewatering operation to the treatment process, while this recycle was not included in the SIX pilot feed. A later engineering review measured TOC concentrations of approximately 87 mg/L in an unsettled Monday morning recycle sample and 51 mg/L after settling. These short-duration organic loads were not represented during pilot operation and therefore have to be considered in the full-scale design. The WTF pilot is useful because the benefit of SIX was not limited to the ion exchange contactors themselves. Pretreatment changed the operating conditions for coagulation, solids production, ozonation, and filtration while at the same time introducing other requirements associated with salt, chloride, resin regeneration, and waste handling. For an existing plant, these interactions are as important as the removal efficiency of the new process.
From Organic Matter Removal to Emerging Contaminants The original evaluation of SIX at the WTF was driven primarily by NOM and its effects
Figure 2. Selected treatment impacts associated with suspended ion exchange pretreatment at the David L. Tippin Water Treatment Facility. Ferric sulfate, polymer, and ozone results are based on suspended ion exchange pilot testing; per- and polyfluoroalkyl substances reduction is based on separate independent testing reported by the City of Tampa in 2026.
28 October 2026 • Florida Water Resources Journal
on coagulation, ozonation, filtration, chemical consumption, and solids production; per- and polyfluoroalkyl substances (PFAS) removal was not the original basis for selecting the process. This became an additional consideration as PFAS regulations and monitoring requirements developed. In 2026, independent testing was performed to evaluate PFAS removal from the WTF’s raw water using the SIX process. The testing showed an approximately 30 percent reduction in PFAS compounds present in the source water. This level of removal does not make SIX a standalone PFAS treatment process, particularly where very low finished water concentrations are required, but it does provide another reduction step ahead of the remaining treatment train. The same process is therefore removing a portion of the NOM and a portion of the PFAS load before the water reaches downstream treatment. The full-scale implications are considerably larger than those of the pilot system. Following the pilot program and subsequent engineering evaluations, Tampa moved forward with the design of a full-scale SIX system at the WTF, with completion currently expected in 2032. Tampa estimates that incorporating SIX could avoid more than $80 million in future WTF improvements when compared with other treatment alternatives evaluated during project planning, while reductions in chemical consumption observed during the approximately 10-month pilot were projected to save about $2 million annually in treatment costs. These estimates have to be considered together with the additional infrastructure required by ion exchange, including resin handling and regeneration, salt storage and consumption, waste management, pumping, electrical systems, instrumentation, and process controls; in other words, the treatment benefit cannot be evaluated only from percent removal of TOC or PFAS. At full scale, the process has to operate within the hydraulic and operational limits of an existing facility that continues producing potable water during construction and after start-up. For the WTF, the progression from pilot testing to full-scale design shows one possible modernization path: identify limitations in the existing treatment train, test a process under site-specific source water conditions, measure its effect on downstream unit processes, and then determine whether the combined treatment and operating benefits justify integration into the existing plant. The result is not a replacement of the original facility, but another treatment layer added to a plant that has been modified repeatedly since the 1920s.
Per- and Polyfluoroalkyl Substances and Membrane Treatment at the Hollywood Water Treatment Plant The City of Hollywood operates a 59.5-mgd water treatment plant supplied by groundwater wells. The treatment plant doesn’t rely on a single process; its current configuration includes conventional lime softening combined with membrane treatment using reverse osmosis (RO) and nanofiltration (NF). This combination has enabled Hollywood to treat water from various groundwater sources, including the Biscayne Aquifer and deeper wells in the Floridan aquifer. This configuration became particularly important after PFAS were detected in multiple raw water wells supplying the plant. The RO and NF provide treatment mechanisms capable of removing PFAS, while the conventional lime softening portion of the facility was not designed for this purpose. Consequently, the presence of PFAS does not necessarily require replacement of the entire treatment plant, but it does change the role and capacity required from the membrane side of the existing facility. In 2025, Hollywood authorized engineering work for Phase 2A of its PFAS treatment program, including the design of an additional membrane softening train and evaluation of the final treatment configuration. The engineering authorization was approved for an amount up to $487,212. Hollywood’s capital planning also identified approximately $18.3 million for PFAS compliance over the planning period, separate from other membrane replacement and infrastructure projects already programmed at the water treatment plant. The engineering issue in Hollywood is therefore different from the one observed at the WTF. Tampa evaluated a new pretreatment process to reduce organic loading and downstream chemical demand; Hollywood already has membrane processes capable of providing a barrier for PFAS, but not all of the existing treatment capacity provides that same barrier. Increasing the portion of water receiving membrane treatment requires more than adding membrane area; feed water characteristics, pretreatment requirements, membrane recovery, concentrate production, pumping pressure, energy consumption, chemical cleaning, and the hydraulic capacity of downstream processes have to be considered together. The RO and NF also create a residual stream that conventional lime softening does not produce in the same way: membrane concentrate. Increasing membrane-treated flow therefore increases the importance of concentrate management and can change the overall water recovery of the facility. At the
same time, operating pressure and energy requirements become part of the life cycle cost of the upgrade. A membrane expansion that achieves the required contaminant removal, but exceeds existing pumping, electrical, or residuals-handling capacity simply transfers the limitation from one part of the plant to another. Hollywood also illustrates another issue with retrofitting an operating facility: treatment modifications can change finished water chemistry. When the contribution from membrane-treated water changes relative to conventionally softened water, parameters associated with corrosion control and distribution system stability must also be evaluated. In 2025, Hollywood separately authorized up to $492,723 for a corrosion control study at the water treatment plant, an indication that treatment changes and distribution system water quality cannot always be evaluated independently. For an existing facility, the useful question is not only whether RO or NF can remove PFAS; their ability to reject PFAS is already one reason membrane processes are being considered in this application. The design problem is determining how much additional membrane capacity is required, how that capacity can be incorporated into the existing treatment train, and what modifications are required elsewhere in the plant to operate it reliably.
Advanced Oxidation and Granular Activated Carbon at Sanford’s Main Water Treatment Plant Sanford has been monitoring 1,4-dioxane in its groundwater supply for several years, including sampling at individual wells and in the treated wáter; the wells showing higher concentrations have been operated less frequently as part of Sanford’s response. The June 2026 sampling results reported 1,4-dioxane at 0.14 µg/L at Water Plant No. 1 point of entry and below the laboratory reporting limit of 0.12 µg/L at Water Plant No. 2; these concentrations were below the health advisory level from the Florida Department of Health of 0.35 µg/L. Even with the finished water results remaining below that level, well operation by itself does not provide an additional treatment barrier, particularly when groundwater conditions and the contribution from individual production wells can change. Sanford has continued development of permanent treatment improvements at the main water treatment plant and its capital planning had already identified the main water Continued on page 30
Florida Water Resources Journal • October 2026 29
Continued from page 29 treatment plant improvements as a major project. Its fiscal year 2025 (FY25) capital improvement program allocated approximately $53.8 million for improvements at the main wáter treatment plant between FY25 and FY27, primarily associated with treatment of 1,4-dioxane and PFAS. As the project moved through planning and preliminary design, the proposed treatment train included ultraviolet advanced oxidation (UV/AOP) followed by GAC, and the two processes will be incorporated into the existing treatment train before the water enters the distribution system. The UV/AOP will provide treatment primarily for 1,4-dioxane while GAC adds an adsorption step for PFAS and other organic compounds; the combined system is also expected to help control total trihalomethane concentrations. This requires the new treatment units to operate with the existing plant flow, water chemistry, and downstream facilities rather than as separate treatment systems. This combination is significant because 1,4-dioxane behaves differently from many contaminants traditionally controlled through adsorption or conventional treatment. It is highly soluble and difficult to remove by conventional coagulation and filtration while UV/AOP can treat the compound through oxidation rather than transferring it to another
phase. In an advanced oxidation reactor, UV energy is applied together with an oxidant, commonly hydrogen peroxide or chlorine depending on process design, generating reactive radical species that attack organic molecules. The U.S. Environmental Protection Agency (EPA) identifies 1,4-dioxane as one of the organic micropollutants for which UV/AOP is applicable and reports that removal can exceed 99 percent under appropriate treatment conditions. Actual performance, however, depends on UV dose, oxidant dose, contact time, UV transmittance, and the presence of constituents that consume radicals before they react with the target compound. The PFAS creates a different requirement. The carbon fluorine bonds characteristic of these compounds make the same oxidation approach considerably less useful as a conventional drinking water PFAS barrier, so Sanford’s proposed treatment train also includes GAC, which does not destroy PFAS; the compounds are removed from the water by adsorption onto the carbon media and the performance of the bed can vary considerably depending on the PFAS present in the influent. Longer-chain compounds, including perfluorooctanoic acid and perfluorooctane sulfonate, are generally adsorbed more effectively while some of the shorter-chain PFAS tend to move through
Table 1. Comparison of Treatment Modernization Approaches at Three Existing Florida Water Treatment Facilities
Facility
Existing Treatment/ Condition
David L. Tippin WTP, Tampa
Enhanced coagulation, clarification, ozone, and biological GAC filtration
Modernization Driver
Added or Proposed Process
Main Integration Considerations
High organic SIX loading, chemical pretreatment and ozone demand; later PFAS considerations
Resin regeneration, salt and chloride, recycle streams, ozone demand, solids production, and filter performance
Hollywood Lime softening WTP combined with RO and NF membrane treatment
PFAS detected in raw water wells and unequal PFAS removal among existing treatment processes
Additional membrane softening capacity
Membrane recovery, concentrate production, pumping and energy, blending, finished water chemistry, and corrosion control
Sanford Existing Main WTP groundwater treatment with well management for 1,4-dioxane
1,4-dioxane, PFAS, and other organic contaminants
UV/AOP followed by GAC
UV dose and transmittance, oxidant feed, GAC EBCT and breakthrough, headloss, electrical load, and construction sequencing
30 October 2026 • Florida Water Resources Journal
the carbon bed faster and may show earlier breakthrough. For an existing plant this becomes an operating issue as much as a treatment issue, since bed depth, empty bed contact time (EBCT), hydraulic loading, DOM, carbon type, and the concentration and composition of PFAS entering the contactors will affect breakthrough and ultimately how frequently the GAC has to be replaced or reactivated. Placing GAC after advanced oxidation also has process implications beyond PFAS removal. The UV/AOP is nonselective, meaning that part of the applied oxidation capacity is consumed by background constituents in the water— not only by 1,4-dioxane—and oxidation can produce transformation products or leave residual oxidant that may require additional treatment. The GAC is identified by EPA as one possible post-treatment step for these conditions. For an operating plant, the UV reactors and GAC contactors consequently have to be designed as part of the same hydraulic and chemical treatment sequence; UV transmittance affects the energy delivered inside the reactor, oxidant concentration affects radical production, and the water leaving the oxidation process becomes the influent water for the carbon beds. The operating requirements are also different from those of the original plant. The UV/AOP introduces a continuous electrical load from the UV reactors, periodic lamp cleaning and replacement, oxidant storage and feed equipment, instrumentation for UV intensity and transmittance, and controls capable of maintaining the required dose as plant flow and water quality change. The GAC system introduces another set of variables, including contactor volume, headloss, carbon exhaustion, backwashing where applicable, carbon replacement or reactivation, and management of spent media containing the adsorbed contaminants. Increasing treatment reliability in one part of an existing facility can therefore increase electrical, chemical, residuals handling, and maintenance requirements elsewhere. This becomes more important when the facility cannot be removed from service while the new treatment system is constructed. New UV reactors and carbon contactors require piping connections, hydraulic grade-line evaluation, electrical capacity and standby power, chemical feed facilities, instrumentation, and modifications to the plant control system while the existing treatment process continues supplying water. The available hydraulic head through the existing facility can determine whether additional pumping is required and the Continued on page 32
Submergent Cleaning Pipes. Tanks. Lift Stations. 407-809-5556 ussubmergent.com/fwrj
Online Cleaning. Technology-Driven. Safety First.
Continued from page 30 additional headloss through GAC contactors has to be evaluated under both clean bed, and later, operating conditions, rather than only at start-up. The scale of the Sanford project reflects these requirements. In October 2025, Sanford reported obtaining approximately $56 million through the Florida Department of Environmental Protection State Revolving Fund for improvements at the main water treatment plant, with approximately $52 million described as loan-forgivable funding; at that time, the project design was approximately 30 percent complete. By August 2026, Sanford was negotiating with a design-build firm to complete the design and construction of the improvements. Sanford therefore adds another treatment configuration to the Florida facilities evaluated here. At the WTF, SIX pretreatment changes the water entering coagulation, ozonation, and filtration; at Hollywood, additional membrane capacity provides a physical separation barrier for PFAS; at Sanford, the proposed system combines advanced oxidation for a compound such as 1,4-dioxane with adsorption for PFAS and other organics. The technologies are different, but the design work eventually reaches many of the same existing-plant limitations: hydraulic capacity, energy, chemical feed, residuals, process controls, available footprint, construction sequencing, and the ability to keep the facility operating while a new treatment barrier is added.
Comparison of Florida Modernization Projects Although the three Florida facilities responded to different water quality conditions, each project began with an existing treatment system that could continue producing drinking wáter, but had limitations when new treatment objectives were introduced. S Tampa is modifying the water before it reaches several of its conventional treatment processes. S Hollywood is increasing the use of membrane separation within a plant that already operates membrane and conventional treatment. S Sanford is adding UV/AOP and GAC to provide treatment mechanisms that were not part of the original facility. None of these projects follows the same treatment approach, and the differences are largely related to source water chemistry, the contaminants being addressed, and the processes already available at each plant. The location of the new process within the treatment train is one of the more noticeable differences among the projects. At the WTF,
SIX is placed near the front of the process, where removing a portion of the DOM and other anions changes the water that subsequently enters coagulation, ozonation, and filtration. The measured benefit was therefore distributed across several downstream processes: ferric sulfate and polymer requirements decreased, ozone demand was lower, and filter operation could be evaluated under a different organic and chemical loading. The SIX system introduces its own requirements for regeneration and waste handling, but its effect cannot be measured only by what is removed inside the ion exchange contactor. Hollywood has almost the opposite condition. Membrane treatment is already part of the facility and provides a separation mechanism that is useful for PFAS, while another portion of the plant relies on conventional lime softening. The modernization effort is consequently related to how much additional flow needs to receive membrane treatment and what happens when membrane capacity is increased. Recovery becomes important because not all feed water becomes finished water, concentrate flow increases with membrane production, and pumping and electrical requirements are different from those of a conventional softening process. Changes in the relative quantities of membrane-treated and conventionally treated water can also affect the chemistry of the final blend. Sanford adds another arrangement because oxidation and adsorption are being used for different purposes within the same treatment train. The UV/AOP provides a treatment mechanism for 1,4-dioxane while GAC provides adsorption capacity for PFAS and other organic constituents. The design therefore has to account for the operating conditions of both processes and also for their sequence; UV transmittance, oxidant dose, and electrical demand affect AOP operation, while EBCT, hydraulic loading, headloss, and carbon breakthrough affect the GAC system that follows. Looking at the three facilities together, treatment selection is closely connected to what is already present at each plant. Adding a process at the front of an existing train, increasing capacity of a process already being used, or installing a new treatment barrier near the end of the train produces different hydraulic, chemical, and operational requirements. Available footprint, pumping capacity, electrical service, residuals handling, and the ability to isolate portions of the facility during construction may eventually determine how a technology can be implemented, even when pilot or bench testing has already shown that the process can remove the target contaminant.
32 October 2026 • Florida Water Resources Journal
Engineering Considerations for Modernizing Existing Facilities The three Florida projects show that selecting a treatment technology is only one part of an upgrade to an existing water treatment facility. The GAC, ion exchange, RO/NF, and UV/AOP can provide high removal for specific contaminants, but their performance depends considerably on the water entering the process and on the equipment already operating upstream and downstream. This becomes particularly relevant with PFAS, where research has shown that GAC, ion exchange, and high-pressure membranes can all provide effective removal, although treatment capacity changes with parameters such as total organic carbon, PFAS composition, EBCT, and other constituents present in the source water. Source water characterization should therefore occur before establishing the final treatment configuration and should extend beyond measurement of the contaminant that originally triggered the project. The TOC and DOM can compete for adsorption sites in GAC, influence ion exchange performance, and increase oxidant demand; hardness and dissolved salts affect membrane operation and recovery, while UV transmittance and radical scavenging constituents affect the energy and chemical dose required in UV/AOP. Seasonal variation also matters, particularly at surface water facilities where the water entering the plant may be considerably different during high-flow, low-flow, algal, or taste and odor events. A treatment process designed around an average analysis can operate differently when these conditions change. Bench and pilot testing become useful at this stage because treatment performance measured with the actual source water provides information that design values alone may not capture. Recent Water Research Foundation work on PFAS treatment has evaluated how bench-scale testing can predict pilot- and full-scale performance of ion exchange and other adsorbents, with the results indicating that properly designed bench testing can provide useful estimates of fullscale removal. Scale-up still has to account for hydraulic loading, media depth, contact time, and the actual water matrix, but testing can narrow the range of treatment alternatives before a utility commits to a full-scale installation. Hydraulics can become the next limitation, especially when a process is inserted into a treatment train that was originally designed decades earlier. The GAC contactors add headloss that changes as the bed operates, membrane systems require feed pressure and produce both permeate and concentrate flows, ion exchange
requires contactors and regeneration equipment, and UV reactors introduce their own hydraulic losses. The available hydraulic grade line has to be checked through the complete plant under normal and maximum-day conditions; where sufficient head is not available, intermediate pumping may be required, which then adds pumps, variable frequency drives, electrical service, standby power, and another control point to the facility. The available footprint can be equally restrictive. An upgrade may require chemical storage, contactors, membrane skids, backwash facilities, pumps, electrical, and residuals handling equipment in a plant where most of the usable area is already occupied. Piping routes and tie-in locations have to be developed around facilities that remain in service, and construction sequencing may determine which portions of a project can actually be built without reducing treatment capacity below system demand. For this reason, the physical location of a new process can sometimes be as important as the removal efficiency obtained during pilot testing. Residuals also need to be included early in the evaluation. The GAC and ion exchange transfer contaminants from the water to a solid media or resin, while RO and NF concentrate rejected constituents into a smaller liquid stream. The Water Research Foundation has identified management of PFAS-laden GAC, ion exchange media, and membrane concentrate as an area where utilities still face uncertainty involving characterization, regeneration or reactivation, disposal pathways, and longterm cost. A process that produces acceptable finished water, but creates a residual stream that cannot be managed reliably at the site, is not a complete treatment solution. Energy requirements vary considerably among the same technologies. The RO requires pressure to overcome membrane resistance and osmotic pressure, UV/AOP requires electrical energy for the UV reactors in addition to oxidant feed, and additional pumping may be needed when new treatment units consume hydraulic head. The GAC and ion exchange generally operate at lower pressure, but require periodic backwashing, media replacement, or regeneration. These loads should be evaluated under expected operating conditions, but not only at design flow, since a plant may operate for much of the year below its maximum capacity and treatment units can be staged differently as demand changes. Instrumentation and process control become increasingly important as these treatment trains become more complex. Flow, pressure, differential headloss, UV intensity and transmittance, oxidant residual, membrane pressure and conductivity, filter performance, and selected water quality
parameters can be incorporated into the plant supervisory control and data acquisition system, but the value of additional instrumentation depends on the quality of the data and its use for operation. The EPA guidance on treatment plant monitoring has emphasized proper sensor installation, calibration, verification, and data management because a continuous signal does not necessarily represent an accurate process measurement if the instrument or sampling arrangement is not maintained correctly. Modernization of an existing plant therefore tends to move beyond installation of a single treatment unit. Source water variability affects process selection; the selected process changes hydraulics and energy demand, which affects pumping and electrical systems; and contaminant removal produces residuals that still require management. Pilot testing can identify some of these interactions before construction, while hydraulic modeling, process controls, and operating data are needed to determine whether the same performance can be maintained once the process is operating at full scale.
Results and Discussion The three Florida facilities reviewed show different approaches to modernization because the existing treatment trains, source waters, and treatment objectives are different. At the WTF, pretreatment with SIX produced measurable changes beyond the ion exchange process itself; ferric sulfate decreased from approximately 124 to 45 mg/L during pilot operation, floc aid polymer use was reduced by approximately 59 percent, and the applied ozone dose decreased from approximately 2.9 to 2 mg/L. Later testing also measured approximately 30 percent PFAS reduction in the raw water. These results are particularly relevant for any existing facility because the benefit is distributed through several unit processes, while regeneration, salt consumption, chloride, and the resulting waste stream become additional operating requirements. Across the three projects, the location of a new process within the existing treatment train becomes almost as important as the technology selected. Pretreatment can reduce loading on downstream processes, membrane expansion changes the water balance and residual stream, and adding UV/AOP and GAC introduces additional headloss, energy, and maintenance requirements. Hydraulic grade line, available footprint, electrical capacity, chemical storage, residuals handling, and construction sequencing can limit full-scale implementation even when contaminant removal has already been demonstrated at bench or pilot scale. The results also support the use of site-
specific testing before major modifications are constructed. Treatment performance will also change with the water entering the plant. The TOC, hardness, and dissolved ions can vary during operation, UV transmittance is directly related to the dose that can be delivered in an AOP reactor, and the PFAS mixture itself affects adsorption and breakthrough in GAC. Consequently, a set of average water quality values may not represent the conditions occurring during seasonal changes or shorter source water events. Pilot operation under these variations provides more than a removal percentage, since chemical dose, headloss, energy requirements, residuals production, and the response of downstream processes can be observed before establishing the operating conditions for a fullscale system.
Conclusion The three Florida projects reviewed show that modernization of an existing water treatment facility does not follow a single treatment approach. The process selected at each plant is related to the source water, the contaminants being addressed, and, particularly, the treatment infrastructure already in operation. The SIX pretreatment at the WTF, additional membrane treatment at Hollywood, and UV/AOP followed by GAC at Sanford use different treatment mechanisms, but in all three cases the new process has to operate within the hydraulic, chemical, electrical, and physical conditions of an existing facility that was originally designed around a different treatment requirement. Pilot- and site-specific testing become particularly useful before moving to fullscale construction. Removal of the target contaminant is one measurement, but changes in chemical dose, headloss, energy demand, residuals production, membrane recovery, media breakthrough, and downstream water quality can have an equal effect on how the process will operate after installation. Tampa provides a good example, where modifying the water ahead of conventional treatment changed chemical and ozone requirements farther downstream; the same type of interaction has to be considered when additional membrane capacity or oxidation and adsorption processes are introduced into an operating plant. For existing facilities, the final design has to account for more than the treatment unit itself. Available hydraulic head, electrical capacity, residuals handling, chemical storage, footprint, process controls, and construction sequencing can determine whether a technology demonstrated at pilot scale can be incorporated successfully at full scale. Continued on page 34
Florida Water Resources Journal • October 2026 33
Creating Waves: Scholarship Foundation Invests in Florida’s Water Future Sarasota-based SediVision® presented $8,000 in scholarships through the Women of Water Scholarship Foundation™ to four women pursuing careers that will help shape the future of Florida’s water and wastewater industry. The Women of Water Scholarship Foundation, established in 2024, is a collaborative initiative managed by SediVision, which provides sand and grit mapping technology for water and wastewater utilities. The foundation was created to support and advance women pursuing careers in Florida’s water and wastewater professions. Women enrolled at accredited Florida colleges and universities and pursuing degrees in water resources, wastewater, civil engineering, environmental engineering, environmental science, hydrology, earth and atmospheric science, or related infrastructure fields were invited to apply. Each recipient received a $2,000 scholarship. “This program demonstrates our commitment to supporting the talent, dedication, and passion of women in this field while helping them build rewarding careers and strengthen the future of Florida’s water industry,” said Denver J. Stutler Jr., P.E., SediVision president and founder. The concept for the foundation originated with the SediVision team, where the workforce is 11 percent women. The company established the foundation to expand opportunities for women and encourage their advancement within the water and wastewater industry. Women make up only about 18 percent of the workforce in water and sanitation utilities worldwide, according to a World Bank survey of utilities in 28 countries. In that same study,
Aki Densmore
Natchaya Luangphairin
only 23 percent of engineers and managers were women, and 12 percent of utilities had no women in management at all. The American Water Works Association notes that women remain significantly underrepresented in the water sector, especially in technical roles, and has launched an initiative to address recruitment and retention. The foundation promotes educational opportunities, fundraising, networking, and public awareness for women working in water, wastewater, and sanitation, as well as women interested in pursuing careers in these fields. This year’s scholarship recipients are: S Leah Werth, who is earning a master’s degree in civil engineering with a concentration in water resources at the University of South Florida. S Alexandra Smith, who is earning a doctorate in integrative biology with a concentration in environmental biology at the University of South Florida. S Aki Densmore, who is studying chemical engineering with a focus on nanotechnology and sustainability at the Florida Institute of Technology. S Natchaya Luangphairin, who is earning a doctorate in civil engineering at the University of South Florida. “Personally, this program is near and dear to my heart. I was raised by an incredible mother, and I’m proud to honor her by recognizing the ‘Women of Water.’ It also doesn’t hurt that ‘WOW’ upside down spells ‘MOM,’” Stutler said. For more information about the S foundation visit wowscholarship.com.
Alexandra Smith
34 October 2026 • Florida Water Resources Journal
Leah Werth
Continued from page 33 Keeping some flexibility in piping, controls, and treatment capacity also becomes useful as source water conditions and regulatory requirements change since the next modification may have to be integrated into the same facility rather than constructed as a completely new plant.
References 1. City of Tampa Water Department, 2018. David L. Tippin Water Treatment Facility Master Plan, Final, Volume 1. Tampa, Fla. 2. City of Tampa Water Department, 2024. Suspended Ion Exchange (SIX) Pilot Report: David L. Tippin Water Treatment Facility. Tampa, Fla. 3. City of Tampa Water Department, 2026. “Tampa Water Department Advances Cutting Edge Technology.” City of Tampa, June 29, 2026. 4. Water Collaborative Delivery Association. “David L. Tippin Water Treatment Plant Upgrade (Florida).” Project case study. 5. Florida Water Resources Journal, 2022. “Suspended Ion Exchange: City of Tampa Demonstrates Exciting Alternative for Total Organic Carbon Removal.” October 2022. 6. City of Hollywood, 2025. Resolution No. R-2025-396: Water Treatment Plant Per- and Polyfluoroalkyl Substances Phase 2A Design of a Membrane Softening Train Addition. Hollywood, Fla. 7. City of Sanford, 2024. Fiscal Year 2025 Final Budget: Capital Item Detail—Main WTP Improvements, 1,4-Dioxane. Sanford, Fla. 8. City of Sanfor,. 2026. “Water Quality: 1,4-Dioxane.” City of Sanford, Fla. 9. Florida Department of Environmental Protection, 2026. Drinking Water State Revolving Fund, Emerging Contaminants Project Priority List/Intended Use Plan. Tallahassee, Fla. 10. U.S. Environmental Protection Agency, 2026. “Overview of Drinking Water Treatment Technologies.” Office of Water, Washington, D.C. 11. U.S. Environmental Protection Agency. “Reducing PFAS in Drinking Water With Treatment Technologies.” Office of Research and Development, Washington, D.C. 12. The Water Research Foundation, 2026. Reliability of Bench-Scale Testing to Predict Pilot-Scale or Full-Scale PFAS Removal From Groundwater Using IX or Alternative Adsorbents. Project 5153. Denver, Colo. 13. The Water Research Foundation, 2025– 2027. Available Options for Regeneration or Disposal of PFAS-Laden Drinking Water Residuals, Media, and Waste. Project 5285. S Denver, Colo.
SAVE THE DATE FOR 2027 FWRC
April 18-21, 2027
Orlando World Center Marriott
EXHIBITORS
Select your booth today! Your next connection. Your next customer. Your next impact starts here. Put your company at the center of the action at FWRC. The Exhibit Hall is where Florida’s water professionals come together to discover solutions, build relationships, and find what’s next for the industry. Showcase your products, connect face-to-face with decision-makers, and turn conversations into opportunities. Visit fwrc.org to reserve your booth today!
SPONSORS
Sponsorship Opportunities are now available! Your brand. Your presence. Your impact starts here. Go beyond visibility and put your brand at the heart of the FWRC experience. Sponsorship opportunities connect your company with Florida’s water professionals through high-impact moments, meaningful experiences, and memorable engagement. Stand out, build recognition, and make an impression that lasts beyond the conference. Visit fwrc.org to become a sponsor today!
MARK YOUR CALENDARS
2027 Attendee and Hotel Reservations open December 8
Are you excited to purchase your tickets for the largest water conference in the Southeast? Attendee and hotel registrations for 2027 FWRC opens online December 8, 2026. Mark your calendars to take advantage of the early-bird ticket pricing. Visit fwrc.org to keep informed of all key dates! Florida Water Resources Journal • October 2026 35
FSAWWA SPEAKING OUT
The FSAWWA Operators and Maintenance Council: Services and Support to the Water Operator Community our operators and maintenance teams that are critical for ensuring that our systems are providing drinking water to our communities.
Tyler Tedcastle Chair, FSAWWA
M
ost residents do not know how the water gets to their faucets, nor do they care— until they have an issue. When an issue does arise, crews from the water system providers are sent out to the field to determine the cause and find the solution. Once the problem is corrected, the utility crews go back to what they are great at: quietly maintaining our water systems both in treatment plants and throughout the distribution systems. The water industry is mostly considered a silent industry, with the occasional storage tank or hydrant visible to the public. It is
Operators and Maintenance Council Offers Assistance to Many Water Utility Personnel The goal of the FSAWWA Operators and Maintenance Council (OMC) is to increase member services to water and distribution system operators and maintenance personnel through increased opportunities, including association leadership, participation, local networking, and expanded awards and recognition programs. The OMC is not just for operators and maintenance personnel; the council also includes those who work in utility laboratories, field staff, and customer service personnel as well. Operations and administrative membership is for operations and administrative staff working below the
Top Ops Competition at the 2025 FSAWWA Fall Conference.
Audience at the Top Ops Competition at the 2025 FSAWWA Fall Conference.
36 October 2026 • Florida Water Resources Journal
supervisory level at utilities with more than 1,000 service connections or any staff member employed at a utility with fewer than 1,000 service connections. If you have any questions, please reach out to our great Membership Committee! A significant portion of the FSAWWA membership is represented by operators in the water industry. The OMC provides specialized services and resources to support these members while facilitating exposure to emerging technologies, products, and industry practices. These efforts increase visibility, encourage active participation and representation within FSAWWA, and underscore the importance of long-term planning to address the evolving needs of the operator community. We encourage operators and maintenance personnel to join our council and provide input on how to make it the best that it can be. The OMC members regularly participate in training sessions and workshops designed to support regulatory compliance, maintain and enhance operator competencies, and keep members informed of changes in regulations and industry requirements. Through the collaborative efforts of the Manufacturers and Associates Council and the Technical and Education Council, FSAWWA members also have access to training seminars and networking opportunities that promote continued professional development and knowledge sharing. In addition, FSAWWA has approved a $25 membership rate for operators, further encouraging participation and engagement within the organization.
Council Sponsors Conference Competitions, Awards, and Grants At this year’s Florida Water Resources Conference (FWRC), the OMC hosted a Top Ops competition in a practice format that was open to all members interested in participating. Bonita Springs Utilities, last year’s winning team, represented the Florida Section at the 2026 American Water Works Association Annual Conference and Exhibition (ACE26) in Washington, D.C. The competition will again be held at the Fall Conference this year, with the winner representing FSAWWA at ACE27 in San Diego. Members who have not previously attended a Top Ops competition are strongly encouraged to participate as spectators and show their support for the teams while also testing their own knowledge.
The OMC also has the privilege of recognizing outstanding achievements in the water treatment profession through several annual awards presented at FWRC. These include Outstanding Water Treatment Plant, Most Improved Water Treatment Plant, Meritorious Water Treatment Plant Operator, and Outstanding Water Treatment Plant Operator. Members are encouraged to begin preparing and submitting nominations well in advance of FWRC to ensure deserving individuals and facilities receive appropriate recognition. Ultimately, the water industry depends on skilled and dedicated operators. Their expertise is essential to maintaining safe, reliable, and sustainable water services for the communities they serve. As the industry continues to evolve, supporting and developing the next generation of water professionals remains a critical priority. To further support professional development, grants are available to help operators offset the costs associated with training and licensing. These opportunities reflect FSAWWA’s commitment to investing in the continued education and professional advancement of its operator community.
We are in the process of expanding these grants, but the current program offers: S License Upgrade Grant: Four reimbursement grants of up to $500 per eligible student for upgrade of a drinking water treatment or distribution system operator license. S Industry College Grant: Two grants of $1,000 per eligible student pursuing a college degree relating to the drinking water industry.
Please make sure to support your local operators at the FSAWWA Fall Conference, being held November 29-December 2. We will be hosting the Backhoe Rodeo, Tapping Competition, Meter Challenge, Top Ops Competition, and Best Tasting Water Competitions! Always remember: No operators, no water! S
Region IV Technical Luncheon.
Florida Water Resources Journal • October 2026 37
FWRJ READER PROFILE Work title and years of service. I was appointed director of Orange County Utilities in July 2026 after serving as deputy director over the water and water reclamation divisions since 2019. I have over 35 years of industry experience, including more than 11 years with Orange County.
Marc Cannata
Orange County Utilities, Orlando
What does your job entail? In my role as director, I have the honor of overseeing a department of over 1,000 employees in Orange County who provide essential services and improve the quality of life for a population of 1.5 million residents and more than 76 million annual visitors. I provide leadership, vision, and guidance
Driving the message to the community that even our vehicles at Orange County Utilities promote innovation.
Hiking with my family in the scenic Colorado mountains.
38 October 2026 • Florida Water Resources Journal
to Orange County Utilities in accordance with the mission and goals established by the mayor, county commissioners, and administration. Long-term goals include planning for the future water needs for this community while maintaining efficient water, wastewater, reclaimed water, and solid waste services. What education and training have you had? A licensed professional engineer in Florida, I earned both bachelor’s and master’s degrees in environmental engineering and an Executive MBA from the University of Central Florida (UCF). In my career, I have extensive engineering, construction, and financial management experience. Prior to joining Orange County, I was vice president and chief financial officer with Reiss Engineering Inc. Other career highlights include time as an environmental engineer at Parsons Engineering Science, and I initially started my career as a draftsman (we actually drew plans by hand!) and construction inspector with MWH. What do you like best about your job? I find the altruistic nature of my job in utilities the most rewarding. The projects we work on enhance the lives of the community we have the honor of serving. To accomplish our goals, I encourage innovation, collaboration, education, and telling our utility story throughout the organization—all while giving back to our community. Many projects also keep resiliency and renewable resources at the forefront, which can have a profound environmental impact. This includes our fleet of vehicles, such as the electric F-150 where we can tell our story as a rolling billboard (and might even have people singing “The Electric Slide” line dance lyrics!). There is also the human connection we foster, such as our stewardship efforts to pay it forward with the next generation through our H2O Pipeline, a wastewater and water treatment operator apprenticeship program for high school students, as well as our operator trainee, field specialist trainee, and industrial mechanic/electrician apprentice programs. There are so many ways our teams make an impact in our community while delivering essential services. What professional organizations do you belong to? I am an active member of several professional organizations, including the
Test Yourself
What Do You Know About Drinking Water Arithmetic? Charlie Lee Martin Jr., Ph.D. American Water Works Association and its Florida Section, Water Environment Federation, National Society of Professional Engineers, and Florida Engineering Society, and I serve on the Florida Water Environment Association Utility Council board. When I was with Reiss Engineering, I was regularly an instructor teaching continuing education courses for the Florida Water and Pollution Control Operators Association. How have the organizations helped your career? I value these organizations and the opportunity to work with and learn from operations personnel, peers, and colleagues at other utilities, collaborating and coordinating with each other on local, regional, and statewide partnerships. What do you like best about the industry? Every day, I see employees across our organization demonstrate their commitment to public service and delivering safe, reliable, essential utility services to our community. That shared purpose truly makes it enjoyable to work in such a remarkable industry and I am proud to continue serving alongside dedicated utility individuals, peers, and colleagues. As essential services providers, we are always evolving and innovating, which I have always enjoyed about the sector. Routinely, we use technology and our abilities to create more efficiencies to meet new regulations and challenges. Each day brings new opportunities to make a real difference in our community and industry. What do you do when you’re not working? As a proud UCF Knight, I like cheering on my hometown team during sporting events. I also enjoy time with my family making new memories together on cruises or outdoor adventures. Our family participates in volunteer work with the Sea Turtle Preservation Society (seaturtlespacecoast. org), United Way, and Second Harvest Food Bank of Central Florida. S
1. The percent of product finished and used for backwashing where the volume of water filtered is 15 million gallons per day (mgd) and the backwashed volume is 75,000 gallons is a. 0.5 percent. b. 2 percent. c. 1.5 percent. d. 0.6 percent. 2. The chlorine dose in mg/l where the chlorinator is set to feed 25 pounds of chlorine with a flow of 650,000 gallons per day (gpd) is a. 3 mg/l. b. 4.6 mg/l. c. 5.5 mg/l. d. none of the above. 3. The chlorine demand in mg/l if the chlorine dose is 6.5 mg/l and the resulting dose is 1.8 mg/l is a. 1.7 mg/l. b. 4.7 mg/l. c. 2.7 mg/l. d. none of the above. 4. The pounds of chlorine used to disinfect water if 200 gallons of hypochlorite is at 3 percent chlorine solution is a. 35 lbs of chlorine. b. 45 lbs of chlorine. c. 50 lbs of chlorine. d. none of the above. 5. The flow pumped by a hypochlorinator in gpd where it pumped 17 inches of hypochlorite during an eight-hour period from a croc that has a diameter of 30 inches is a. 140 gpd. b. 160 gpd. c. 156 gpd. d. none of the above.
6. The desired strength (as percent chlorine) of a hypochlorite solution that delivers 120 gpd with a dose of 13 pounds of chlorine per day is a. 1.30 percent. b. 1.50 percent. c. 2 percent. d. none of the above. 7. The gallons of water that must be added to 13 gallons of 5 percent hypochlorite solution to produce a 1.25 percent hypochlorite solution is a. 29 gallons. b. 49 gallons. c. 39 gallons. d. none of the above. 8. The Langelier Index for a water with a calculated pHs value of 8.56 and an actual pH of 7.98 is a. -0.80. b. -0.70. c. -0.58. d. none of the above. 9. The backwash flow required in gallons per minute (gpm) to backwash a 30-feet-wide by 35-feet-long filter given that the desired backwash flow rate is 25 gpm per square feet (sq ft) is a. 10,250 gpm. b. 26,250 gpm. c. 8,750 gpm. d. none of the above. 10. The filtration rate in gpm of a 35-feet-wide by 40-feet-long rapid sand filter treating a flow of 5,000 gpm is a. 3.6 gpm/sq ft. b. 4.0 gpm/sq ft. c. 7.0 gpm/sq ft. d. none of the above. Answers on page 58 References used for this quiz: Formulas can be found in the appendix of California State University at Sacramento Water Treatment Plant Operation Volume I, 4th edition
Send Us Your Questions Readers are welcome to submit questions or exercises on water or wastewater treatment plant operations for publication in Test Yourself. Send your question (with the answer) or your exercise (with the solution) by email to: charmartin@msn.com
Florida Water Resources Journal • October 2026 39
40 October 2026 • Florida Water Resources Journal
42 October 2026 • Florida Water Resources Journal
Florida Water Resources Journal • October 2026 43
>> Click here to sign up your team https://forms.gle/cCfoaQcf9x5WWnTZ9
>> Click here to sign up your team https://forms.gle/xHB8Ww8JRtQ4TtMk8
44 October 2026 • Florida Water Resources Journal
Florida Water Resources Journal • October 2026 45
46 October 2026 • Florida Water Resources Journal
AWWA Florida
--- 2026 FALL CONFERENCE
Operation: WetVet Military Meeting & Social
Have you served in the U.S. Military? Connect with fellow veterans and help introduce military professionals to careers in the water industry. Please join us! >> Tuesday, December 1, 2026 I Continental Breakfast
10:00 -11:00 a.m. I Wekiwa 4
>> RSVP is required:
Kim Kowalski I kim@fsawwa.org
L ET’ S TA LK S A FE TY This column addresses safety issues of interest to water and wastewater personnel, and will appear monthly in the magazine. The Journal is also interested in receiving any articles on the subject of safety that it can share with readers in the “Spotlight on Safety” column.
A
Climb Into Confined-Space Safety
confined space is any area with limited entry and exit that contains known or potential hazards and is not intended for continuous human occupancy. In the
water industry, these spaces include manholes, trenches, storage tanks, wells, vaults, and tunnels. Hazards within a confined space include: S Oxygen deficiency by displacement with
other gases and the introduction of nitrogen from cable pressurization S Toxic gases from decomposing soil, chemical spills, and engine combustion exhaust (from vehicles and equipment) S Combustible or flammable vapors and gases from underground storage or piping facilities S Moving equipment parts, structural hazards, entanglement, slips, and falls S Temperature extremes, including atmospheric and surface S Shifting or collapse of bulk material S Barrier failure resulting in a flood or release of free-flowing solids S Uncontrolled energy, including electrical shock or water pressure S Visibility S Biological hazards The buildup of gases, including carbon monoxide and radon, poses one of the most common and lethal dangers in confined spaces. If an oxygen deficiency or hazardous atmosphere may exist in the work area, the air must be tested before employees enter and also while the work is being conducted. If necessary, ventilation must be provided and continued as long as the manhole or vault is open. If the confined space is vacated for any period of time, such as a lunch break, the atmosphere should be retested before re-entry is allowed.
Safety Equipment Several pieces of equipment are required for safe entry into a confined space: S Work-area protection devices, such as traffic (reflective) vests, traffic cones, manhole guards, work protection signs S Manhole cover lifter and manhole hook S Atmospheric tester for combustible gas, oxygen deficiency, and other toxic substances S Power ventilator (blower) S Pump to remove water S First aid kit S Portable fire extinguisher (dry chemical) Continued on page 50 Let’s Talk Safety is available from AWWA; visit www.awwa.org or call 800.926.7337. Get 40 percent off the list price or 10 percent off the member price by using promo code SAFETY20. The code is good for the Let’s Talk Safety book, dual disc set, and book + CD set.
48 October 2026 • Florida Water Resources Journal
Florida Municipal Water and Wastewater Process Equipment
Contact your local representative
Jim Murphy Sales Engineer & Branch Manager (863) 999-4692 | jmurphy@tencarva.com www.tencarva.com Florida Water Resources Journal • October 2026 49
Continued from page 48
Atmospheric Conditions The air within the confined space must be tested prior to entry into the space. Atmospheric conditions are considered unacceptable if oxygen levels are less than 19.5 percent or greater than 22 percent. The following levels of other hazards are unacceptable: S A flammable gas, vapor, or mist greater than 10 percent of its lower flammable limit (LFL). The LFL means the minimum concentration of the flammable material
that will ignite if an ignition source is present. S Airborne combustible dust at a concentration that obscures vision at a distance of 5 feet or less. S An atmospheric concentration of a substance greater than the allowed limit in the Safety Data Sheet for that substance.
Testing Procedures After all work-area protection devices are in place and the atmospheric test equipment has been tested as operational, workers can do the following:
S L ower the sampling hose approximately 6 inches through the hold in the manhole cover to make the first pre-entry test. If no combustible gas is found, remove the cover and proceed. If the flammable gas concentration is above 60 percent lower explosive limit (LEL), suspend operations and follow company procedures. S After the manhole cover is removed, continue to test for combustible gas by lowering the sampling tube within 12 inches of the manhole or vault floor. If no flammable gas is found, purge the manhole with the power blower for the period of time based on the blower capacity and manhole configuration, following company procedures.
Ventilation If flammable gas is detected and is above 10 percent (but below 60 percent) LEL, purge and ventilate the manhole for a minimum of 10 minutes, depending on the manhole or vault size. If combustible gas was detected and subsequently cleared, continue to monitor and ventilate to maintain the flammable gas level below 10 percent LEL. When ventilating a manhole, insert the blower hose in the manhole opening, positioning the blower hose to direct the flow of air horizontally, midway between the manhole’s floor and roof toward an end wall and away from the work area, if possible. To minimize the intake of exhaust fumes from passing vehicles, the blower intake should be positioned away from the flow of traffic. Wind direction also must be considered. Ventilation of the manhole must continue as long as the manhole is open to avoid the possible development of a hazardous atmosphere. Again, if the confined space is vacated for any period of time, the atmosphere of the confined space should be retested before re-entry is permitted. Further testing should be conducted with ventilation systems turned on to ensure that contaminants are removed and the ventilation system is not causing a hazardous condition. A disciplined approach to confined space entry protects workers from hazards that can develop quickly and without warning. By testing the atmosphere, using the right equipment, ventilating effectively, and retesting whenever a space is reopened, crews create a safer environment for themselves and their coworkers. Confined space safety isn’t a single action— it’s a continuous commitment to vigilance, preparation, and adherence to proven procedures. For more information go to the Occupational Safety and Health Administration website at osha.gov/SLTC/confinedspaces. S
50 October 2026 • Florida Water Resources Journal
Operators: Take the CEU Challenge! Members of the Florida Water and Pollution Control Operators Association (FWPCOA) may earn continuing education units through the CEU Challenge! Answer the questions published on this page, based on articles in this month’s issue. Circle the letter of each correct answer. There is only one correct answer to each question! Answer 80 percent of the questions on any article correctly to earn 0.1 CEU for your license. Retests are available. This month’s editorial theme is New Facilities, Expansions, and Upgrades. Look above each set of questions to see if it is for water operators (DW), distribution system operators (DS), or wastewater operators (WW). Mail the completed page (or a photocopy) to: Florida Environmental Professionals Training, P.O. Box 33119, Palm Beach Gardens, Fla. 33420-3119, or scan and email a copy to memfwpcoa@gmail.com. Enclose $15 for each set of questions you choose to answer (make checks payable to FWPCOA). You MUST be an FWPCOA member before you can submit your answers!
EARN CEUS BY ANSWERING QUESTIONS FROM PREVIOUS JOURNAL ISSUES! Contact FWPCOA at membership@fwpcoa.org or at 561-840-0340. Articles from past issues can be viewed on the Journal website, www.fwrj.com.
Modernizing Existing Water Treatment Facilities Through Emerging Technologies Oscar Serrato see page 26 (Article 1: CEU = 0.1DS/DW02015476) 1. What was one significant benefit of reduced ferric sulfate use in the suspended ion exchange (SIX) pilot? a. Increased bromate formation b. Reduced chemical sludge production c. Increased filter headloss d. Elimination of ozone treatment 2. Why is SIX not considered a standalone per- and polyfluoroalkyl substances (PFAS) treatment process? a. It increases PFAS concentrations. b. It removes only a portion of PFAS present. c. It requires chlorine addition. d. It only works on groundwater. 3. Which treatment technologies are used at the Hollywood Water Treatment Plant as barriers to PFAS? a. Ultraviolet (UV) and ozone b. Granular activated carbon and chlorine c. Reverse osmosis and nanofiltration d. Lime softening alone 4. What contaminant is the primary target of Sanford’s ultraviolet advanced oxidation (UV/AOP) system? a. Perfluorooctane sulfonate (PFOS) b. Perfluorooctanoic acid (PFOA) c. Bromate d. 1,4-dioxane 5. Which PFAS compounds are generally adsorbed most effectively by granular activated carbon (GAC)? a. Long-chain compounds such as PFOS and PFOA b. Short-chain PFAS only c. All PFAS equally d. PFAS cannot be adsorbed by GAC
__________________________________________________ SUBSCRIBER NAME (please print)
Article 1 ____________________________________ LICENSE NUMBER for Which CEUs Should Be Awarded
Article 2 ____________________________________ LICENSE NUMBER for Which CEUs Should Be Awarded
__________________________________________________ Credit Card Number
__________________________________________________ CVV Number
__________________________________________________ Expiration Date
Fast-Tracking Field Inspections and Leveraging Statistical Analysis: Reducing “Unknowns” for Tallahassee’s Service Line Inventory Jennifer E.C. Porter, Diane Quigley, and Eric Balon see page 12 (Article 2: CEU = 0.1DS/DW02015477) 1. What federal regulation prompted Tallahassee to develop a service line inventory? a. Safe Drinking Water Act amendments b. Per- and Polyfluoroalkyl Substances Rule c. Lead and Copper Rule Improvements d. Surface Water Treatment Rule 2. According to U.S. Environmental Protection Agency requirements, what is the minimum number of service line validations needed for systems with 10,001 to 50,000 unknowns? a. 361 b. 371 c. 381 d. 384 3. Which field tests were primarily used to identify service line materials? a. Magnet test and scratch test b. X-ray and pressure testing c. Swab test only d. U ltrasonic testing and excavation 4. W hat was discovered regarding lead service lines during the field investigation program? a. Six lead services were found. b. One lead service was confirmed. c. Several suspected lead services were identified. d. No service lines were suspected or confirmed to be lead. 5. What additional operational benefit resulted from the inspection program? a. Discovery of active leaks requiring repair b. Lower energy consumption c. R educed water treatment costs d. Reduced meter reading staff
FWEA FOCUS
New Facilities, Expansions, and Upgrades: Infrastructure and Workforce Investment David Hernandez President, FWEA
I
n this month’s issue my focus turns to a topic that continues to shape the future of Florida’s water environment profession: new facilities, expansions, and upgrades. Across our state, communities are making significant investments in water, wastewater, stormwater, and reclaimed water infrastructure to accommodate growth, improve resiliency, and meet increasingly complex regulatory and operational challenges. Florida’s continued growth places tremendous demands on our utilities. Population increases, aging infrastructure, climate impacts, evolving water quality requirements, and rising customer expectations all require thoughtful planning and sustained investment. While these challenges are significant, they also create tremendous opportunities for innovation and collaboration throughout our industry. Across the state, utilities are advancing major capital improvement programs that will serve their communities for decades to come:
S Treatment plant expansions are increasing capacity to meet future demands. S Advanced treatment technologies are being implemented to improve water quality and support reuse goals. S Collection and conveyance systems are being modernized to improve reliability and reduce risks associated with aging infrastructure. S Stormwater improvements are helping communities become more resilient to flooding and extreme weather events. These projects represent far more than concrete, steel, and equipment. They represent investments in public health, environmental stewardship, and the quality of life enjoyed by Florida’s residents and visitors. What continues to impress me is the level of collaboration required to bring these projects to life. Owners, engineers, contractors, operators, regulators, manufacturers, and suppliers all play critical roles in delivering successful outcomes. From planning and permitting through design, construction, start-up, and long-term operation, these efforts demonstrate the strength of our profession and our shared commitment to protecting Florida’s water resources. These investments also highlight an important responsibility we have as industry leaders: preparing the workforce that will operate,
maintain, and continuously improve these facilities in the future. New treatment processes, digital technologies, automation systems, and data-driven decision tools require new skills and expertise. As projects become more sophisticated, the importance of training, knowledge transfer, and professional development continues to grow. Through FWEA’s committees, training programs, conferences, and networking opportunities, we help ensure that our members are equipped to meet these evolving challenges. Many of the facilities currently under design or construction will serve communities well beyond our careers. When we invest in infrastructure, we are making decisions that impact future generations. That long-term perspective is one of the most rewarding aspects of working in the water sector. Whether we are upgrading a pump station, expanding a treatment plant, implementing nutrient reduction technologies, or enhancing resiliency against future storms, our work creates lasting benefits that extend throughout the communities we serve. As we celebrate the achievements represented by these new facilities, expansions, and upgrades, let us also recognize the people behind them. The success of every project depends upon dedicated professionals who are committed to excellence, innovation, and service. Their efforts strengthen our utilities, protect our environment, and help ensure a sustainable future for Florida.
FWEA Events This fall we will continue to provide excellent opportunities for learning, networking, and professional growth throughout the association. I encourage you to participate in your local chapter activities, engage with one of FWEA’s many committees, and take advantage of upcoming educational programs and technical events. As we look ahead, planning is already underway for another exciting year of conferences, workshops, leadership development opportunities, and technical training programs. These events not only enhance our professional knowledge, but also strengthen the relationships that make FWEA such a valuable organization. Continued on page 54
52 October 2026 • Florida Water Resources Journal
GO FROM A CONVENTIONAL WWTP TO
CUTTING EDGE
The Factory-Built Membrane System Solution that Rapidly Upgrades Activated Sludge Plants to MBRs - Without Constructing New Concrete Tanks
• Easily add capacity and greatly improve effluent quality • Drastically reduce project timelines and costs for existing and new plants • Factory-built and tested membrane system delivers straight to plant site • Robust hollow fiber membrane and instrumentation • S&L provides significant MBR experience & system integration project support
Ideal for alternative delivery to small WTTP’s Represented in Florida by:
(863) 450-3595 1-800-898-9122 www.SmithAndLoveless.com
www.ees-fl.com
Continued from page 52 Save the Date: 14th Annual Wastewater Process Committee Seminar Before I close, I’d like to highlight one of
my favorite technical events of the year: the FWEA Wastewater Process Seminar, scheduled for Nov. 9, 2026, at the University of Florida in Gainesville. The seminar consistently delivers outstanding technical content and provides a
unique opportunity for operators, engineers, and utility professionals to learn directly from industry experts and each other. This year’s theme is Emerging Technology and Process Optimization. If you’re looking to sharpen your process knowledge, discover new approaches to operational challenges, or simply reconnect with colleagues from around the state, I encourage you to join us. You can learn more through the FWEA Wastewater Process Seminar event page at fwea.org.
Advancing Our Mission
University of Florida in Gainesville.
As always, thank you for your continued involvement and support of FWEA. Whether you are a student, operator, engineer, scientist, manufacturer, contractor, regulator, or utility leader, your contributions help advance our mission and strengthen Florida’s water environment community. I welcome your thoughts, ideas, and feedback. I look forward to seeing many of you at upcoming events and continuing our work together to protect and improve Florida’s water S resour
View all courses and register online at go.ufl.edu/FWRJTREEO
UPCOMING COURSES Oct. 12-15 | Train the Trainer: How to Design & Deliver Effective Training Gainesville, FL | $899 | CEUs 3.2 DS DW WW Oct. 19-21 | Water Distribution Systems Level 1 Live Virtual Training | $699 | CEUs 3.2 DS DW WW Oct. 19-22 | Activated Sludge Process Control & Troubleshooting Live Virtual Training | $710 | CEUs 2.5 WW Nov. 16-19 | Water Distribution Systems Level 2&3 Live Virtual Training | $699 | CEUs 3.2 DS DW WW
54 October 2026 • Florida Water Resources Journal
GO.UFL.EDU/CCC2027
MARCH 14-16 ORLANDO, FLORIDA
October
1.................Backflow Tester recert..........................................................Gulfport..................................$115 5-7.................Backflow Repair....................................................................Deltona...................................$355 7.................Backflow recert......................................................................Deltona...................................$115 12-15.................Utility Maintenance 3...........................................................Deltona...................................$355 19-22.................Backflow Tester .....................................................................Bonita Springs.........................$425 22.................Backflow Tester recert..........................................................Bonita Springs.........................$115 26-29.................Wastewater Collection Level 3............................................Deltona...................................$375 26-30.................Wastewater Collection level 3.............................................Region 11................................$375 26-30.................Wastewater Collection level 2.............................................Region 11................................$375 26-28.................Backflow Repair....................................................................Gulfport..................................$355 28.................Backflow recert......................................................................Gulfport..................................$115
November
2-5.................Backflow Tester......................................................................Deltona...................................$425 5.................Backflow Tester recert..........................................................Deltona...................................$115 9.................Backflow recert......................................................................Gulfport..................................$115 16-19.................Water Distribution Level 2...................................................Deltona...................................$375 20.................Exam Only..............................................................................Deltona...................................$100 30- Dec. 3............Wastewater Collection Level 2............................................Deltona...................................$375
Statement of Ownership, Management, and Circulation (All Periodicals Publications Except Requester Publications) 1. Publication Title: Florida Water Resources Journal 2. Publication Number: 6. 9. 7. 7. 0 3. Filing Date: 9/08/2026 4. Issue Frequency: Monthly 5. Number of Issues Published Annually: 12 6. Annual Subscription Price: 24 7. Complete Mailing Address of Known Office of Publication (Not printer) (Street, city, county, state, and ZIP+4®): 1402 Emerald Lakes Street, Lake County, Clermont, Fl. 34711 Contact Person: Mike Delaney Telephone (Include area code): 352-241-6006 8. Complete Mailing Address of Headquarters or General Business Office of Publisher (Not printer): 1402 Emerald Lakes Street, Clermont, Fl. 34711 9. Full Names and Complete Mailing Addresses of Publisher, Editor, and Managing Editor (Do not leave blank) Publisher (Name and complete mailing address) Buena Vista Publishing - 1402 Emerald Lakes Street, Clermont, Fl. 34711 Editor (Name and complete mailing address) Rick Harmon - 1402 Emerald Lakes Street, Clermont, Fl. 34711 Managing Editor (Name and complete mailing address) Rick Harmon - 1402 Emerald Lakes Street, Clermont, Fl. 34711 10. Owner (Do not leave blank. If the publication is owned by a corporation, give the name and address of the corporation immediately followed by the names and addresses of all stockholders owning or holding 1 percent or more of the total amount of stock. If not owned by a corporation, give the names and addresses of the individual owners. If owned by a partnership or other unincorporated firm, give its name and address as well as those of each individual owner. If the publication is published by a nonprofit organization, give its name and address.) Full Name: Florida Water Resources Journal, Inc. Complete Mailing Address: 3 St. Giles Road, Palm Beach Gardens, Fl. 33418 11. Known Bondholders, Mortgagees, and Other Security Holders Owning or Holding 1 Percent or More of Total Amount of Bonds, Mortgages, or Other Securities. If none, check box T None Full Name Complete Mailing Address 12. Tax Status (For completion by nonprofit organizations authorized to mail at nonprofit rates) (Check one) The purpose, function, and nonprofit status of this organization and the exempt status for federal income tax purposes: T Has Not Changed During Preceding 12 Months o Has Changed During Preceding 12 Months (Publisher must submit explanation of change with this statement) 13. Publication Title: Florida Water Resources Journal 14. Issue Date for Circulation Data Below: October 2026 15. Extent and Nature of Circulation Average No. Copies Each Issue No. Copies of Single Issue Published During Preceding 12 Months Nearest to Filing Date a. Total Number of Copies (Net press run) 8164 8187 b. Paid Circulation (By Mail and Outside the Mail) (1) Mailed Outside-County Paid Subscriptions Stated on PS Form 3541 (Include paid distribution above nominal rate, advertiser’s proof copies, and exchange copies) 8095 8136 (2) Mailed In-County Paid Subscriptions Stated on PS Form 3541 (Include paid distribution above nominal rate, advertiser’s proof copies, and exchange copies) 69 51 (3) Paid Distribution Outside the Mails Including Sales Through Dealers and Carriers, Street Vendors, Counter Sales, and Other Paid Distribution Outside USPS® 0 0 (4) Paid Distribution by Other Classes of Mail Through the USPS (e.g., First-Class Mail®) 0 0 c. Total Paid Distribution [Sum of 15b (1), (2), (3), and (4)] 8164 8187 d. Free or Nominal Rate Distribution (By Mail and Outside the Mail) – – (1) Free or Nominal Rate Outside-County Copies included on PS Form 3541 – – (2) Free or Nominal Rate In-County Copies Included on PS Form 3541 0 0 (3) Free or Nominal Rate Copies Mailed at Other Classes Through the USPS (e.g., First-Class Mail) 69 51 (4) Free or Nominal Rate Distribution Outside the Mail (Carriers or other means) 69 51 e. Total Free or Nominal Rate Distribution (Sum of 15d (1), (2), (3) and (4)) 8233 8238 f. Total Distribution (Sum of 15c and 15e) 0 0 g. Copies not Distributed (See Instructions to Publishers #4 (page #3)) 8233 8238 h. Total (Sum of 15f and g) 99.16 99.38 i. Percent Paid (15c divided by 15f times 100) * If you are claiming electronic copies, go to line 16. If you are not claiming electronic copies, skip to line 17. Average No. Copies Each Issue No. Copies of Single Issue Published 16. Electronic Copy Circulation During Preceding 12 Months Nearest to Filing Date a. Paid Electronic Copies 0 0 b. Total Paid Print Copies (Line 15c) + Paid Electronic Copies (Line 16a) 8164 8187 c. Total Print Distribution (Line 15f) + Paid Electronic Copies (Line 16a) 8233 8238 d. Percent Paid (Both Print & Electronic Copies) (16b divided by 16c Í 100) 99.16 99.38 T I certify that 50% of all my distributed copies (electronic and print) are paid above a nominal price. 17. Publication of Statement of Ownership T If the publication is a general publication, publication of this statement is required. Will be printed in the October 2026 issue of this publication. o Publication not required. 18. Signature and Title of Editor, Publisher, Business Manager, or Owner: Mike Delaney Date: 9/08/26 I certify that all information furnished on this form is true and complete. I understand that anyone who furnishes false or misleading information on this form or who omits material or information requested on the form may be subject to criminal sanctions (including fines and imprisonment) and/or civil sanctions (including civil penalties).
PS Form 3526, July 2014 (Page 3 of 4) PRIVACY NOTICE: See our privacy policy on www.usps.com.
56 October 2026 • Florida Water Resources Journal
CLASSIFIEDS
CLASSIFIED ADVERTISING RATES - Classified ads are $22 per line for a 60 character line (including spaces and punctuation), $60 minimum. The price includes publication in both the magazine and our Web site. Short positions wanted ads are run one time for no charge and are subject to editing. ads@fwrj.com
POSITIONS AVAILABLE
LICENSED PLANT OPERATORS Wastewater & Water
Supervising Utility Engineer
Gainesville Regional Utilities (GRU) is seeking a Supervising Utility Engineer to join our Water/Wastewater Systems Engineering Department’s Pipeline Infrastructure group. Salary range: $111,935.25 - $167,902.36. Please apply online at Career Opportunities: Water / Wastewater Supervising Engineer (717)
The City of Daytona Beach is seeking Licensed Wastewater and Water Plant Operators. Pay starts at $ 26.00 per hour with add-on incentives, excellent benefits and MORE!!! APPLY: daytonabeach.gov/1468/Apply-Now
DIRECTOR OF UTILITIES CITY OF NEWBERRY, FL
Seeking an experienced leader to oversee electric, water, and wastewater utilities while leading a $120.1 million Utility Capital Improvement Program. Candidates must have seven years of related experience, including three years in a management role. View details and apply: https://newberry. applicantstack.com/x/detail/a2zhml96a6w2
ENGINEER II
The City of Daytona Beach seeks an ENGINEER II to serve as the day-to-day lead for various Utilities Department Capital Improvement Projects assigned and execute all phases of project management for the department. State of Florida P.E. required or able to obtain licensure within 6 months. Salary Range: $ 78,577.68-$ 146,710.12 (DOQ) APPLY NOW: https://www.daytonabeach.gov/1468/Apply-Now
Technical Sales Specialist
Salary: $60,000 - $80,000 plus commission. Includes company vehicle. Job Description: Supporting the sale of all Odyssey Manufacturing products and services, but primarily focusing on Magnesium Hydroxide. Odyssey is the Florida distributor for Martin Marietta (formerly Premier Magnesia). A qualified candidate will be tasked with business development in chemical sales and Odyssey’s existing products and services in the State of Florida, cultivating strategic relationships, bridging the gap between statewide sales growth, and technical production execution. An ideal candidate should be a licensed water/wastewater operator or a have extensive experience in water treatment systems and be located within two hours of Tampa, Florida. Please send your resume to Patrick Allman, General Manager: pallman@odysseymanufacturing.com
NEWS BEAT The St. Johns River Water Management District is expanding mapping and monitoring efforts at some of the region’s most iconic springs, collecting detailed scientific information to help protect these treasured waters, unique habitats, and popular destinations where millions of people swim, paddle, snorkel, and experience Florida’s natural beauty. The governing board approved a contract with Trutta Environmental Solutions LLC to map and monitor eight springs and their spring runs across the district, including Alexander, Blue, Juniper, Rock, Salt, Silver, Silver Glen, and Wekiwa springs. Using a specialized survey boat equipped with above-and-below
water cameras, high-resolution global positioning system, and sonar and water quality monitoring instrumentation, scientists will collect detailed information about spring and spring run conditions. The system records underwater channel bottom depths and substrate hardness, water quality, aquatic vegetation, and other environmental characteristics, establishing a valuable baseline for future monitoring and helping scientists better evaluate longterm trends, habitat conditions, and water quality. These insights will help guide future management decisions to protect these iconic Florida springs for wildlife and the people who depend on them. There are 148 springs across the
district’s 18-county region. It has partnered with local governments and utilities to fund 180 springs projects, investing over $71 million to help protect these important natural resources. Collectively, these projects conserve approximately 60 million gallons of water per day, reduce nitrogen by more than 434,652 pounds per year, and reduce phosphorus by more than 152,654 pounds per year. S
Florida Water Resources Journal • October 2026 57
SERVING FLORIDA’S WATER AND WASTEWATER INDUSTRY SINCE 1949
Test Yourself Answer Key January 2016
Editorial Calendar
January...............Wastewater Treatment February..............Water Supply; Alternative Sources March................... Energy Efficiency; Environmental Stewardship April.....................Water Conservation and Reuse May......................Operations and Utilities Management June..................... Biosolids Management and Bioenergy Production July...................... Stormwater Management; Emerging Technologies August.................Disinfection; Water Quality September.......... Emerging Issues; Water Resources Management October............... New Facilities, Expansions, and Upgrades November...........Water Treatment December............Distribution and Collection Technical articles are usually scheduled several months in advance and are due 60 days before the issue month (for example, January 1 for the March issue). The closing date for display ad and directory card reservations, notices, announcements, upcoming events, and everything else including classified ads, is 30 days before the issue month (for example, September 1 for the October issue). For further information on submittal requirements, guidelines for writers, advertising rates and conditions, and ad dimensions, as well as the most recent notices, announcements, and classified advertisements, go to www.fwrj.com or call 352-241-6006.
Display Advertiser Index Barnes.........................................................................................................................11 Blue Planet Environmental Systems....................................................................... 59 CEU Challenge........................................................................................................... 51 FJ Nugent..................................................................................................................... 5 Florida Aquastore...................................................................................................... 20 Florida Water Resources Conference..................................................................... 35 FSAWWA............................................................................................................... 40-47 FWPCOA Training Calendar..................................................................................... 55 Gerber........................................................................................................................... 9 Heyward........................................................................................................................ 2 Hudson Pump and Equipment................................................................................. 49 Hydro International.................................................................................................... 13 Lakeside Equipment Corporation.............................................................................. 7 PCL Construction...................................................................................................... 21 Sedivision................................................................................................................... 27 Smith & Loveless....................................................................................................... 53 UF TREEO Center...................................................................................................... 54 U.S. Submergent........................................................................................................ 31 Veolia.......................................................................................................................... 60 Water Treatment & Controls Technology................................................................ 37
58 October 2026 • Florida Water Resources Journal
Continued from page 39 1. A ) 0.5 percent.
The percent of product finished and used for backwashing where the volume of water filtered is 15 mgd and the backwashed volume is 75,000 gallons is 0.5 percent.
2. B) 4.6 mg/l.
The chlorine dose in mg/l where the chlorinator is set to feed 25 pounds of chlorine with a flow of 650,000 gpd is 4.6 mg/l.
3. B) 4.7 mg/l.
The chlorine demand in mg/l if the chlorine dose is 6.5 mg/l and the resulting dose is 1.8 mg/system is 4.7 mg/l.
4. C) 50 lbs of chlorine.
The pounds of chlorine used to disinfect water if 200 gallons of hypochlorite is at 3 percent chlorine solution is 50 lbs of chlorine.
5. C ) 156 gpd.
The flow pumped by a hypochlorinator in gpd where it pumped 17 inches of hypochlorite during an eight-hour period from a croc that has a diameter of 30 inches is 156 gpd.
6. A) 1.30 percent.
The desired strength (as percent chlorine) of a hypochlorite solution that delivers 120 gpd with a dose of 13 pounds of chlorine per day 1.30 percent.
7. C ) 39 gallons.
The gallons of water that must be added to 13 gallons of 5 percent hypochlorite solution to produce a 1.25 percent hypochlorite solution is 39 gallons.
8. C ) -0.58.
The Langelier Index for a water with a calculated pHs value of 8.56 and an actual pH of 7.98 is -0.58.
9. B ) 26,250 gpm.
The backwash flow required in gpm to backwash a 30-feet-wide by 35-feet-long filter given that the desired backwash flow rate is 25 gpm per sq ft is 26,250 gpm.
10. A) 3.6 gpm/sq ft.
The filtration rate in gpm of a 35-feet-wide by 40-feet-long rapid sand filter treating a flow of 5,000 gpm is 3.6 gpm/sq ft.
Experience, Expand, Evolve with ZeeWeed* 500 Membrane Veolia’s immersed ZeeWeed 500 membrane is specifically designed for difficult-to-treat water sources
Reduce membrane tank footprint by up to 50% Longer membrane life means fewer membrane replacements Lower energy usage by 20% and reduce chemical consumption Best available technology for water recycling
*Trademark of Veolia; may be registered in one or more countries. ©2025 Veolia. All rights reserved.
Wastewater, water reuse, and industrial applications can all benefit from Veolia’s strongest ZeeWeed membrane to produce water with very high purity and low silt density.