Business Office: 1402 Emerald Lakes Drive, Clermont, FL 34711
Web: www.fwrj.com
General Manager: Michael Delaney
Editor: Rick Harmon
Graphic Design Manager: Patrick Delaney
Mailing Coordinator: Buena Vista Publishing
Published by BUENA VISTA PUBLISHING for Florida Water Resources Journal Inc.
President: Richard Anderson (FSAWWA) Peace River Manasota Regional Water Supply Authority
Vice President: Joe Paterniti (FWEA) Clay County Utility Authority
Treasurer: Rim Bishop (FWPCOA) Seacoast Utility Authority
Secretary: Rim Bishop (FWPCOA) Seacoast Utility Authority
Moving?
The Post Office will not forward your magazine. Do not count on getting the Journal unless you notify us directly of address changes by the 15th of the month preceding the month of issue. Please do not telephone address changes. Email changes to changes@fwrj.com or mail to Florida Water Resources Journal, 1402 Emerald Lakes Drive, Clermont, FL 34711
Membership Questions
FSAWWA: Casey Cumiskey – 407-979-4806 or Casey@fsawwa.org
FWEA: Laura Cooley, 407-574-3318, admin@fwea.org
FWPCOA: Darin Bishop – 561-840-0340
Training Questions
FSAWWA: Donna Metherall – 407-979-4805 or Donna@fsawwa.org
FWPCOA: Shirley Reaves – 321-383-9690
For Other Information
FDEP Operator Certification: Ron McCulley – 850-245-7500
FSAWWA: Kim Kowalski – (407) 979-4814
Florida Water Resources Conference: 267-884-6292
FWPCOA Operators Helping Operators: John Lang – 772-559-0722, oho@fwpcoa.org
FWEA: Laura Cooley – 407-574-3318, admin@fwea.org
Websites
Florida Water Resources Journal: www.fwrj.com
FWPCOA: www.fwpcoa.org
FSAWWA: www.fsawwa.org
FWEA: www.fwea.org and www.fweauc.org
Florida Water Resources Conference: www.fwrc.org
News and Features
4 University Researchers Reveal Safer Way to Manage Chemical Sewage Sludge Using Pyrolysis
6 David Hernandez Takes Office as 2026-2027 FWEA President
8 Shaping Tomorrow: Coral Springs Improvement District Hosts Junior Achievement Students
10 FSAWWA at 100: The 1970s
20 Prepare for August National Water Quality Month!
22 2026 Florida Water Industry Survey: Insights From Readers
42 Florida Puts an End to Class B Land Application: How SEBA Is Leading Utilities Into the Next Era of Biosolids Management—Megan Ross
43 Researchers Show a New, Sustainable Way to Remove Toxic Chemicals in Water
46 Contractors Roundup: Collaboration is the Backbone of Successful Water and Wastewater Projects— Martin Gonzalez
51 EPA Recognizes Excellence and Innovation in Florida Water Infrastructure Project
Technical Articles
16 A Water Utility’s Path Toward Coagulant Switch and Sludge Residual Reduction—Veronica Llaneza and Steve Giordano
26 Operational Strategies for Bioenergy Facilities With Strict Nutrient Limits—Lee Kimbell, Chris Andres, Chris DeBarbadillo, and Milad Ebrahimi
48 Unlocking the Potential of Publicly Owned Treatment Works: Generating Renewable Energy and Maximizing Its Value—Jeff VanVoorhis, Jim Postiglione, and John Dinneen
Education and Training
13 FWPCOA Training Calendar
34 FSAWWA Fall Conference Exhibitor Registration
35 FSAWWA Fall Conference Exhibitor Booth Spaces
36 FSAWWA Fall Conference Sponsorship Opportunities
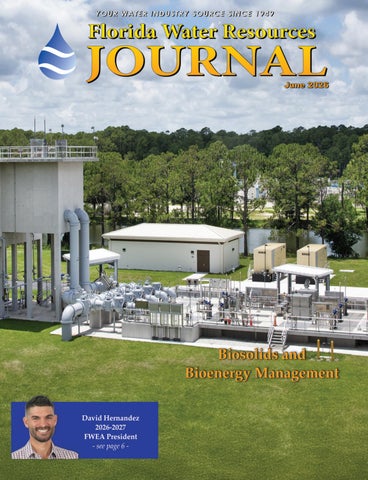
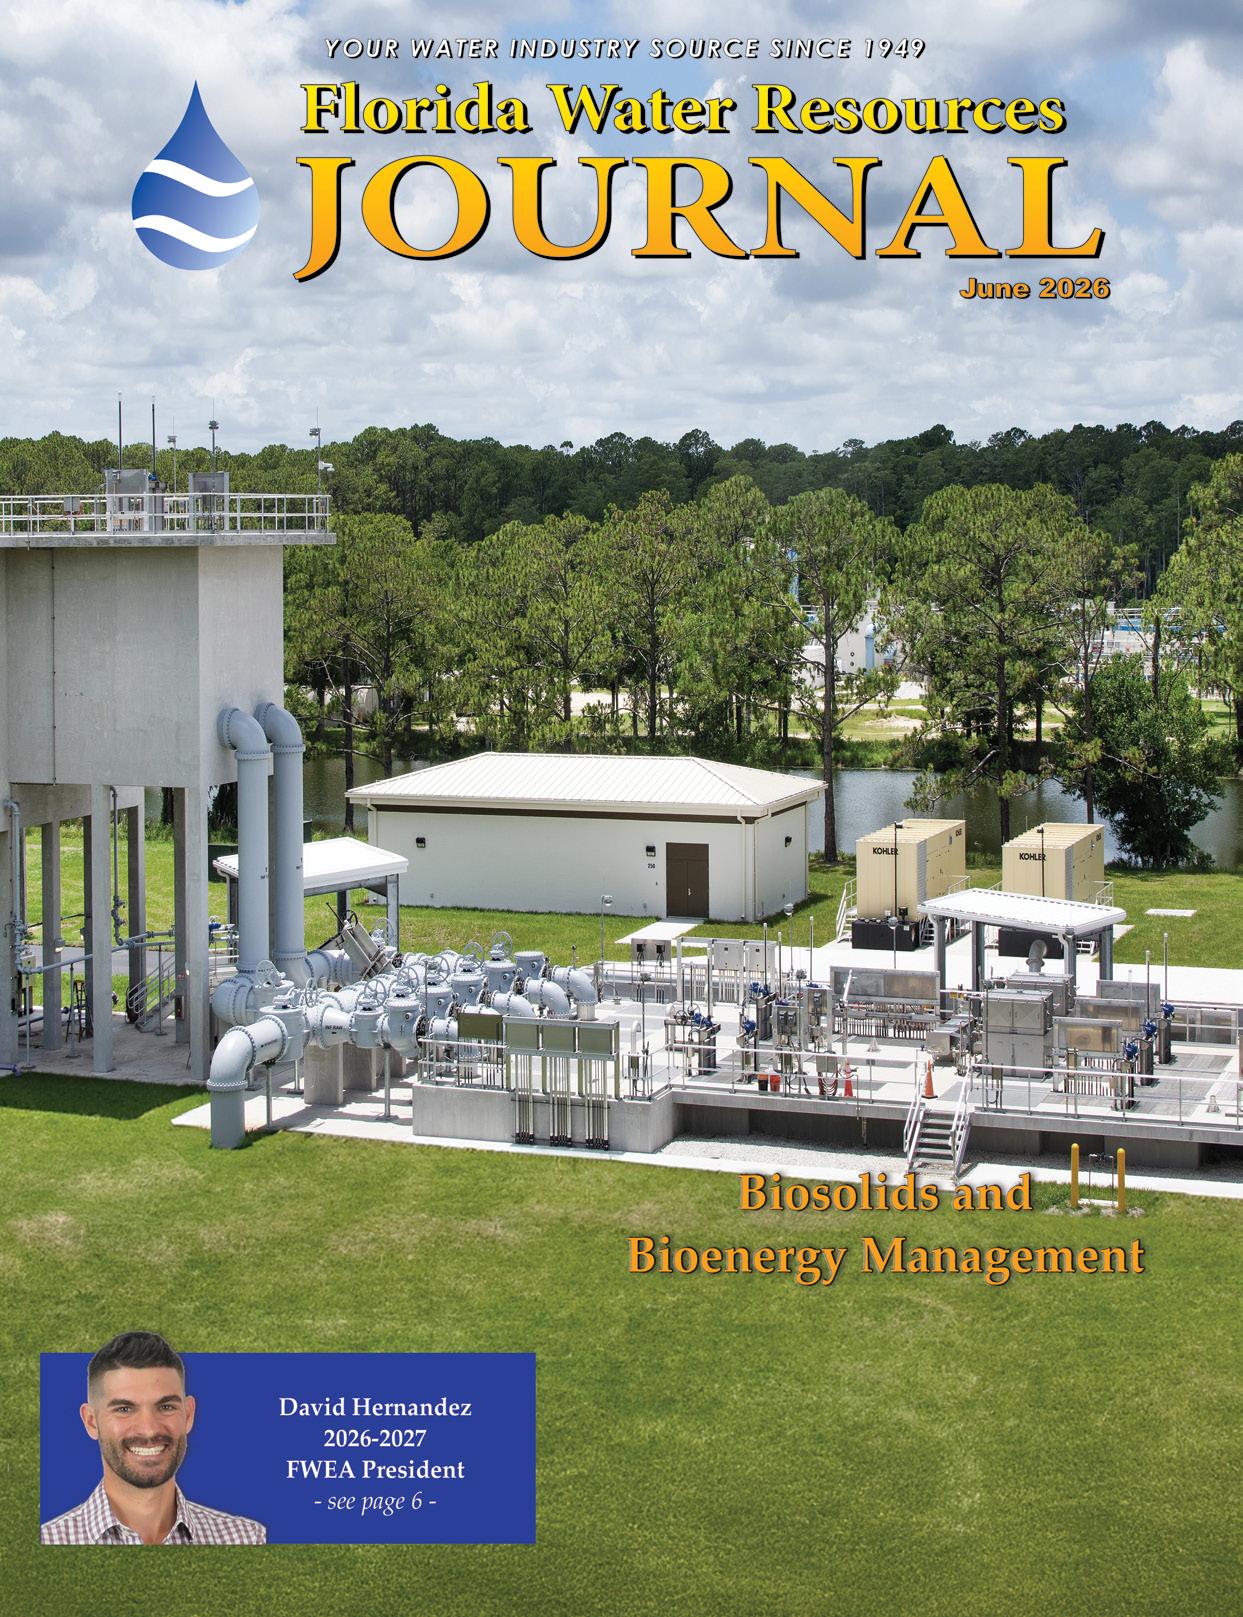
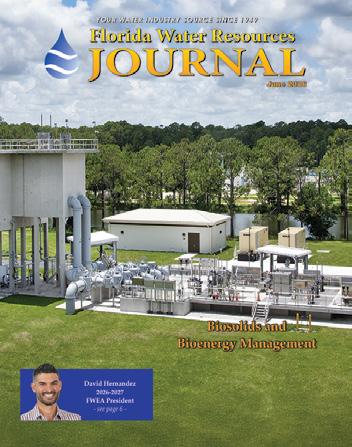
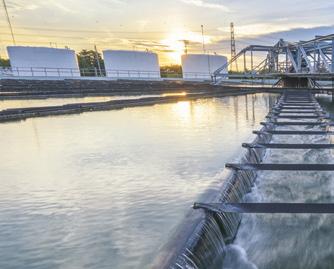
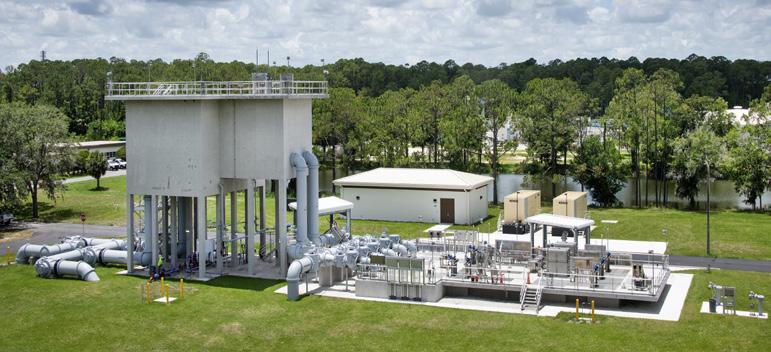
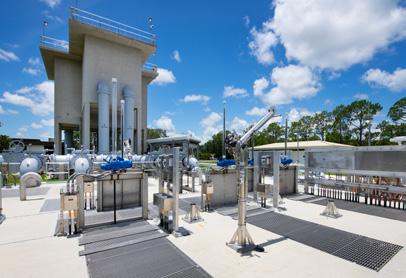
54 Display Advertiser Index ON THE COVER: The Daytona Westside Water Reclamation Facility (WRF) project consisted of the construction of a new influent pump station and headworks for the City of Daytona Beach Westside Regional WRF. The project expanded the city’s wastewater treatment capacity and addressed reliability issues, safety concerns, and future growth needs, and aligns with the city’s commitment to fortifying infrastructure to withstand increasing threats from hurricanes. For more information see page 46. (photo: Ben Tanner Photography)
University Researchers Reveal Safer Way to Manage Chemical Sewage Sludge Using Pyrolysis
Study
shows how controlling pyrolysis temperature can help reduce environmental risks of chemical sewage
To handle increasing wastewater loads, sewage treatment plants are adopting more advanced treatment processes. Many of these approaches, however, require additional space and energy, highlighting the need for more efficient alternatives. Chemical-enhanced primary treatment (CEPT), which uses chemicals, instead of microorganisms, to promote flocculation and coagulation of sewage, has attracted significant attention for reducing energy consumption and operation costs in sewage treatment plants.
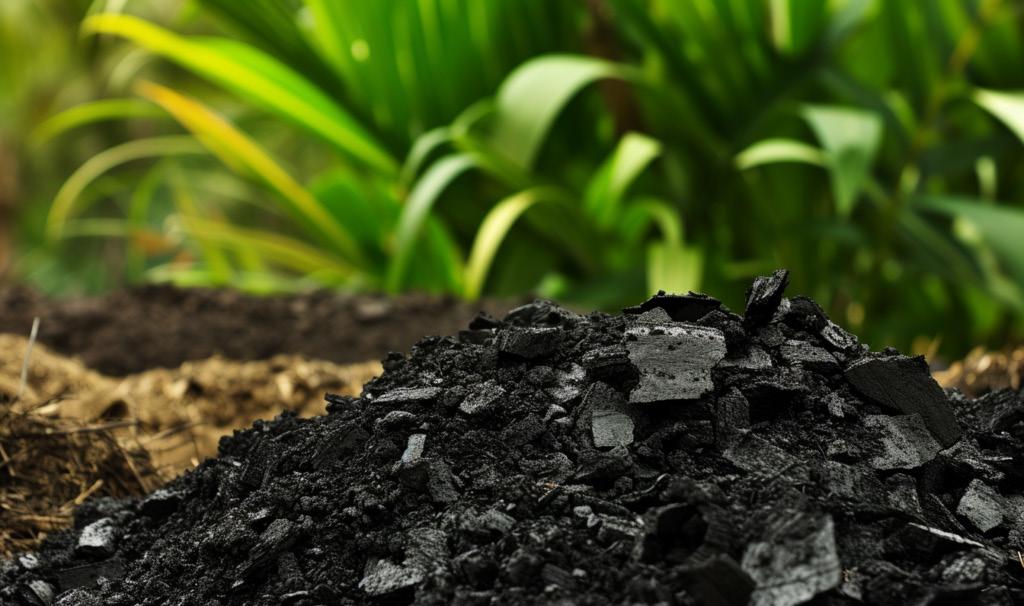
The sewage sludge produced during treatment can be further processed through pyrolysis, a high-temperature process that can reduce sludge volume, degrade pollutants, and produce value-added materials. Biochar, which is a product of pyrolysis derived from CEPT sewage sludge (CS), differs from that produced by conventional biological treatment sewage sludge (BS). These differences can influence how heavy metals behave and remain stable in the biochar, potentially increasing environmental risks.
Published Research on Biochar
Until now, limited information has been
sludge, supporting sustainable sewage treatment
available on heavy metal behavior in CS-derived biochar.
To address this gap, a research team led by Professor Kitae Baek, from the Department of Environment and Energy and Soil Environment Research Center at the Jeonbuk National University in South Korea, investigated the properties of heavy metals in CS-derived biochar with those of conventional BS-derived biochar. Their study was made available online in December 2025 and published in Volume 206 of Process Safety and Environmental Protection in January 2026.
“While CEPT can reduce energy consumption, it is necessary to consider not only treatment performance, but also the environmental impact of its byproducts. Our study clarifies the potential risks associated with CS-derived biochar and highlights the need for appropriate countermeasures as CEPT adoption increases,” says Professor Baek.
Research Methods
The researchers collected CS and BS samples from two sewage treatment plants in
Hong Kong. Both sludge types were pyrolyzed at different temperatures, and the resulting biochars were analyzed to compare their heavy metal content and stability.
The biochar yield of CS ranged between 32.1 and 40.9 percent, notably lower than that of BS, which ranged between 43.9 and 75.2 percent. Heavy metal content analysis showed that a smaller proportion of heavy metals remained trapped in CS-derived biochar across all temperatures. This suggests that thermal treatment of CS can lead to secondary heavy metal pollution in the surrounding environment.
Further tests revealed that CS-derived biochar had lower heavy metal stability, especially at high temperatures above 800°C. At such high temperatures the mobility of heavy metals also increased significantly and could be easily leached out, increasing environmental safety concerns. Based on these results, the researchers recommend using lower pyrolysis temperatures when treating CEPT sludge.
Interestingly, at an optimized temperature of 550°C, heavy metals in both types of biochar showed long-term stability. This suggests that, when properly treated, CS-derived biochar can be safely used for applications, such as soil amendment or fertilizer, similar to biochar from conventional sludge.
“Our findings show that an appropriate thermal treatment is necessary to enhance sustainability of the CEPT process. With proper sludge management, CEPT can support efficient sewage treatment while reducing carbon emissions and environmental impacts. This will have a long-term positive impact on people’s lives and environmental conservation,” concludes Professor Baek.
The proposed approach reduces computational cost while maintaining high predictive accuracy, making it suitable for large-scale applications. S
David Hernandez Takes Office as 2026-2027
FWEA President
Hello everyone! My name is David Hernandez and I am excited to serve as your Florida Water Environment Association (FWEA) president for 2026-2027. As I step in to this role, I want to acknowledge and thank the many incredible past presidents who have served before me. I am forever grateful for your mentorship and guidance!
My Water Story
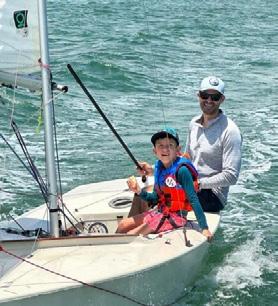
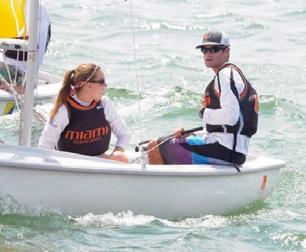
My water story began on Biscayne Bay in Miami. My parents are avid sailors and shared their love of the water with my sister and me. From an early age, we sailed our 34-foot boat to the Bahamas and around the bay. As I got older, I started racing, and that mix of water and competition became a lifelong passion. I raced throughout my childhood, qualified for the 2008 Olympics trials, and won the High School Singlehanded National Championship as a senior. In college, I sailed for the University of
Miami team. I still sail today and now share that love of the water with my children.
Turning My Love of Water Into a Career
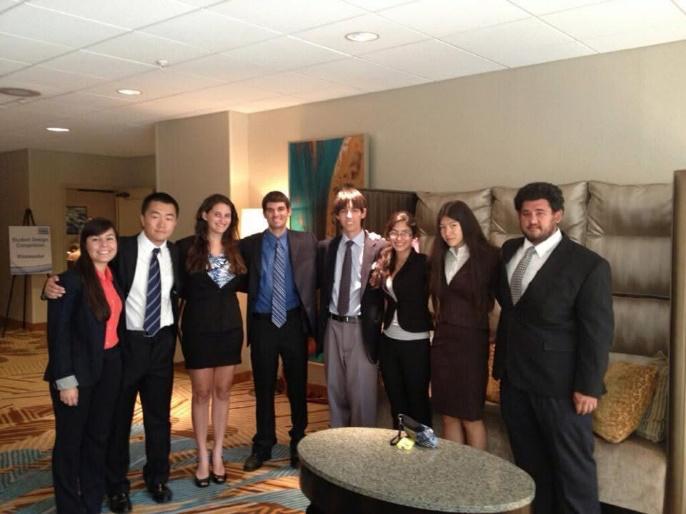
I am a proud graduate of the University of Miami where I studied environmental engineering. In addition to sailing and studying, I was also a member of our FWEA Student Chapter. During our senior year, we had the opportunity to compete at the FWEA Student Design Competition at the Florida Water Resources Conference.
Though we didn’t win, our chapter still got to attend the Water Environment Federation Technical Exhibition and Conference. At the career fair, I met representatives from Hazen and Sawyer and later joined Hazen as an intern on an indirect potable reuse pilot, assessing advanced treatment of secondary wastewater for
groundwater recharge to the Floridan aquifer. That first experience in the industry hooked me, and I’ve been with Hazen ever since—fully immersed in the world of water!
My FWEA Journey
My FWEA journey started at the University of Miami and has continued throughout my
Continued on page 8
Competing at the College Sailing National Championships.
Interning with Hazen and Sawyer.
Running the 2026 FWEA Leadership Development Workshop.
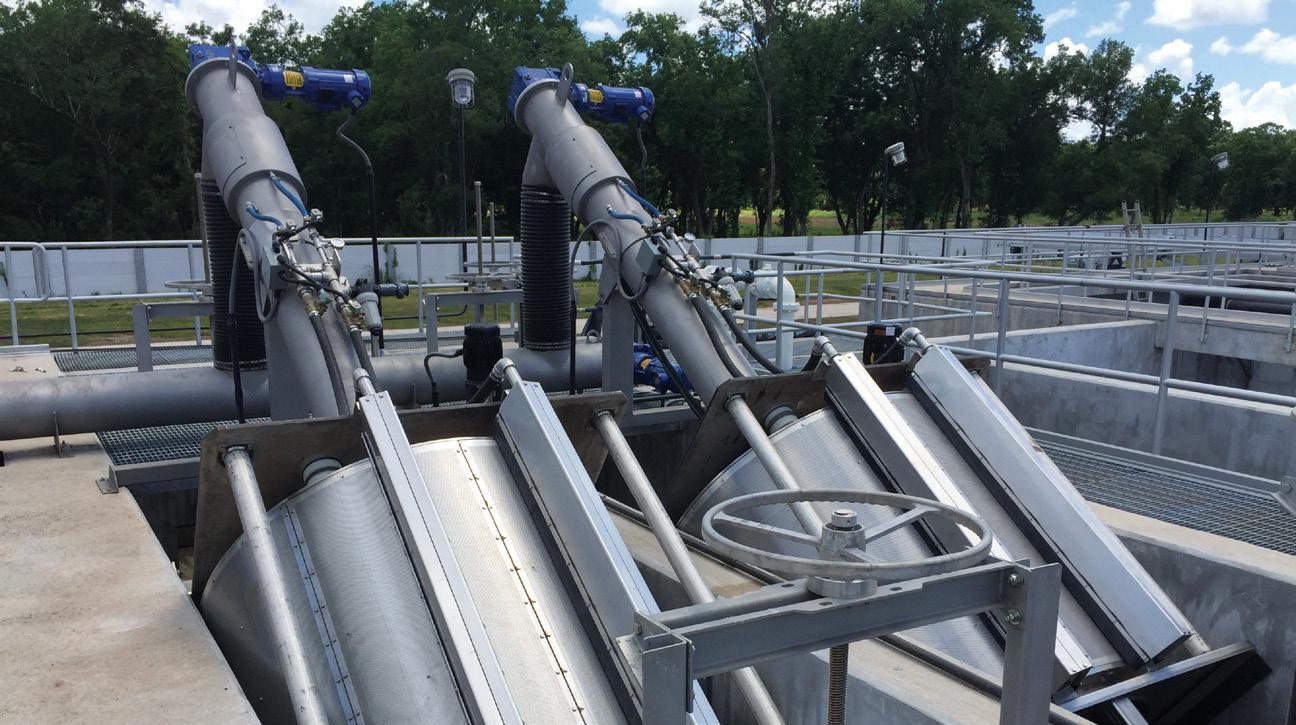
WE TAILOR OUR SCREENING EQUIPMENT TO FIT YOUR NEEDS.
All wastewater treatment plants are not alike. That’s why plant designers prefer our Raptor® line of screening products, the innovative all-in-one units that screen, wash, convey and dewater screenings efficiently, capturing more fine solids and long fibers than other available screens. Raptor® products are adaptable to a wide range of configurations, giving you more choices for better performance in your unique application. They are preferred among plant operators for their simple operation, ease of use, and minimal maintenance. When performance counts, count on the industry leader for more than 90 years—Lakeside Equipment Corporation.
Cleaner Water for a Brighter Future®
Speak to one of our experts at 630.837.5640, email us at sales@lakeside-equipment.com, or visit www.lakeside-equipment.com for more product information.
Shaping Tomorrow: Coral Springs Improvement District Hosts Junior Achievement Students
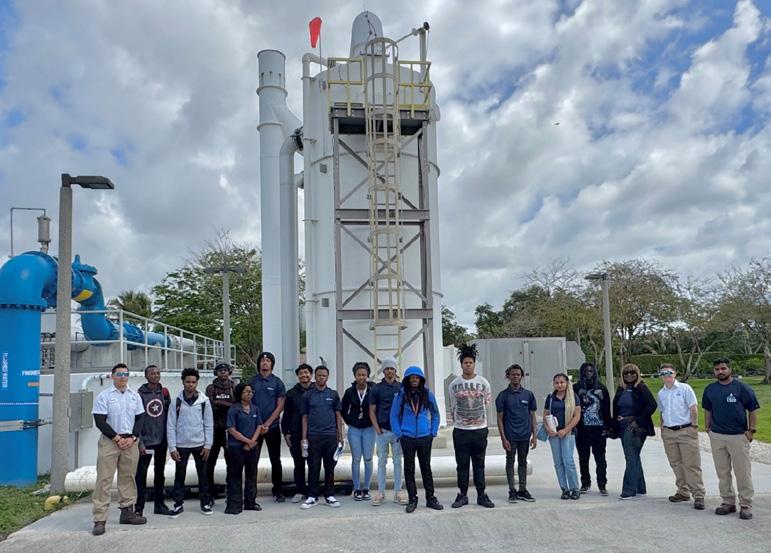
On April 10, the Coral Springs Improvement District had the pleasure of hosting students from Broward County’s Junior Achievement program for a tour of its utility facility. This program introduces high school students to a variety of career opportunities available after graduation.
During their visit, several career paths within the district were highlighted, including many entry-level positions that require only a high school diploma, a valid Florida driver’s license, and a satisfactory background check.
Students learned about various roles at the utility, including drinking water plant operator, wastewater treatment plant operator, water distribution and wastewater collection technician, and customer service and billing representative. Employees also shared information on salaries and wages and how to apply for a position.
The district looks forward to welcoming back some of these students as future applicants and employees. S
to bring the ice.” Being a young engineer in the industry, I was happy to have the opportunity to “bring the ice.” From there, I was fortunate to take on leadership roles, serving as chair of the Student and Young Professional Committee and chair of the South Florida Chapter. I then served as a director at large, before being nominated to join the Executive Committee. I am incredibly grateful for the doors that FWEA has opened for me, both professionally and personally.
Our FWEA Journey
This past year has been very exciting for FWEA. So many incredible initiatives are well underway, and the future of our organization looks bright!
A few highlights from this last year include:
S Enhancing our mentorship program
S Issuing over 350 professional development hours and over 250 continuing education units (May 2025 - February 2026)
S Continuing the growth of our podcast: Making Waves With FWEA
S Second year of our INFLOW Program, which introduces promising students from underrepresented backgrounds to careers in the water industry
This next year, we are going to keep the foot on the pedal and keep the momentum going. When it comes to the road ahead, Greg Chomic, another FWEA past president, gave me some great advice: Consider our strategic goals. They are as follows:
S Member Engagement
S Public Awareness and Outreach
S Partnerships and Sound Science-Based Public Policy
S Workforce Development and Professional Development
With our strategic goals in mind, and building off the momentum already in motion, I am excited to share a few of the many great things we can continue to look forward to in the next year:
S Continued growth of our INFLOW Program
S Exploring ways to expand how FWEA provides scholarships
S Continue to provide professional development opportunities through our chapters and committees, as well as bringing national conferences to Florida.
S Raising public awareness of our industry with the help of our Public Communications and Outreach Committee
Thank you for letting me share my story with you, and thank you for being part of the FWEA journey. I am looking forward to an incredible year! S
FSAWWA at 100: The 1970s
100 years goes faster than you think!
As the Florida Section of the American Water Works Association (FSAWWA) celebrates is 100th anniversary this year, we’ll be publishing several articles in the magazine in 2026 to give you some history of the section, highlight several important people and places, and take a step back in time to explore some fun facts and milestones about what was happening in Florida and across America during FSAWWA’s 100-year journey.
1970s: Growth, Environmental Awareness, Regulation, and Section Changes
The 1970s saw an era of rapid growth in the state of Florida. With approximately 90 percent of Florida’s population relying on underground aquifers for drinking water, the implementation of the Clean Water Act and Safe Drinking Water Act led to increased protections developed by the newly established regulations.
Although cities across Florida, such as Miami, St. Petersburg, and Apopka, as well as Pinellas County, were expanding their use of these groundwater resources, by the late 1970s the threat of contamination of groundwater from sewage, industrial wastes, and pesticides was recognized as a major problem, leading utilities to begin seeking out alternative water supply sources.
In 1976 Florida voters approved a constitutional amendment allowing water management districts (WMDs) to levy taxes up to $1 million, providing dedicated funding for water supply planning, water quality programs, and wetlands protection. This led to increased funding for the state’s WMDs and impacted environmental regulation on water policy.
Section Progress
experienced rapid growth in areas such as Dade County, Tampa, Sarasota, and Orlando, leading to increased focus on water supply, infrastructure development, and water quality standards.
under the broader national AWWA guidance,
with focus shifting in late 1976 to new funding models for sections to develop more focused programs tailored to meet local needs. This led to FSAWWA membership growth, increased professionalization of water/wastewater operations, and new education and training opportunities for Florida water professionals.
City of Venice Also Celebrates a Centenary
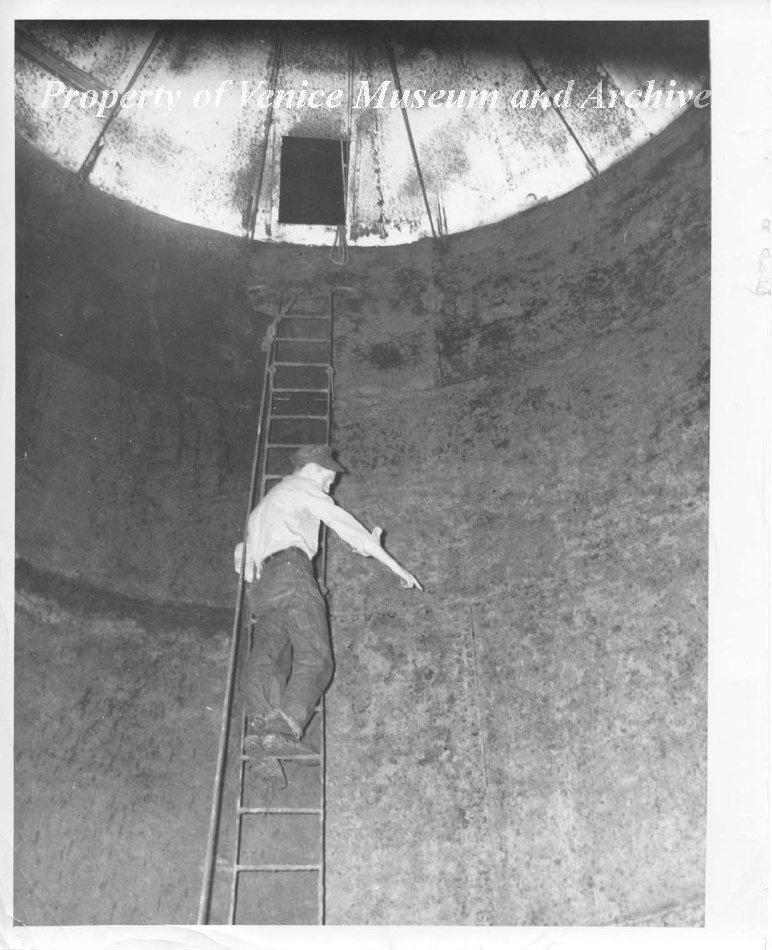
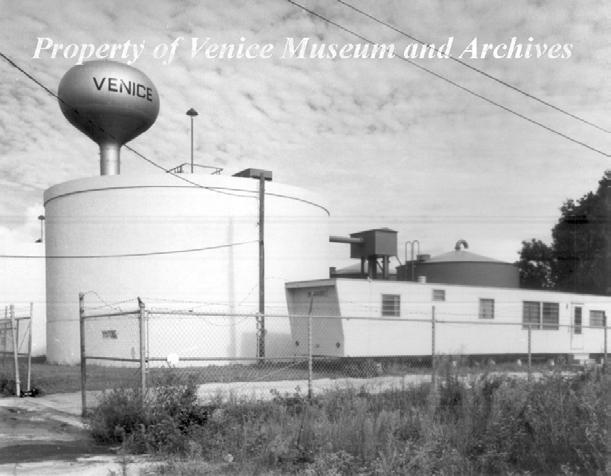
The City of Venice was incorporated in 1926, the year of the FSAWWA’s inception, and it operates a water system dating back almost 100 years.
Today, the City of Venice Utilities Department provides high-quality drinking water to approximately 14,900 connections and services over 29,000 customers. The department is responsible for the repair and maintenance of more than 432 miles of underground water, sewer, and reuse mains. The water plant utilizes reverse osmosis treatment, producing an annual average daily flow of 2.3 million gallons of potable water. The city plans to expand its reclaimed water system over the next decade to provide service to all homeowners in the city.
Some historical photos of the water system are included at the end of the article.
Where Were You 50 Years Ago in 1976?
This month we look back at 1976 as America celebrates its Bicentennial. Here are some interesting people and facts from that year.
S Curtis H. Stanton, a member of FSAWWA since 1947 and a former Florida Section chair and director, served as the AWWA vice president
S Richard P. Vogh was Florida Section chair
S Florida’s population was 8.7 million
S Michael and Jennifer were favorite baby names
S 6.7 billion gallons per day of groundwater were used for public supply
S Groundwater was the primary source for municipal supply
S The Pittsburg Steelers were the Super Bowl X champs
S Gasoline cost $.59 cents a gallon
S The Florida Section had approximately 1400 members
S Eggs cost $.97 cents a dozen
S Vero Beach, Tallahassee, and Fiesta Village were first in the state to use reclaimed water for irrigation and industrial cooling
S The average American consumed only 1 bottle of bottled water per month, compared to roughly 20 bottles per month today
S Florida WMDs were approved to levy value-based ad valorem taxes
S The Walter E. Peele Dixie Water Treatment Plant in Fort Lauderdale was the first Florida Section Water Landmark awardee
S Apple Computer Co. was founded by Steve Jobs
S Nadia Comaneci scored a perfect 10 in gymnastics at the Summer Olympics in Montreal
S The Viking I touched down on Mars
S The first VHS tape was introduced for home video use
S “Rocky” was the top-grossing film of the year
S Red M&Ms disappeared due to Red Dye #2 concerns
S Hank Aaron hit his 755th and final home run
S The average cost of a new home was $43,000
S Jack Nicholson won the Best Actor Oscar for “One Flew Over the Cuckoo’s Nest”
Next Article Coming
The third article in this series will provide more section information and take a look back 75 years.
Continued on page 12
Richard Vogh
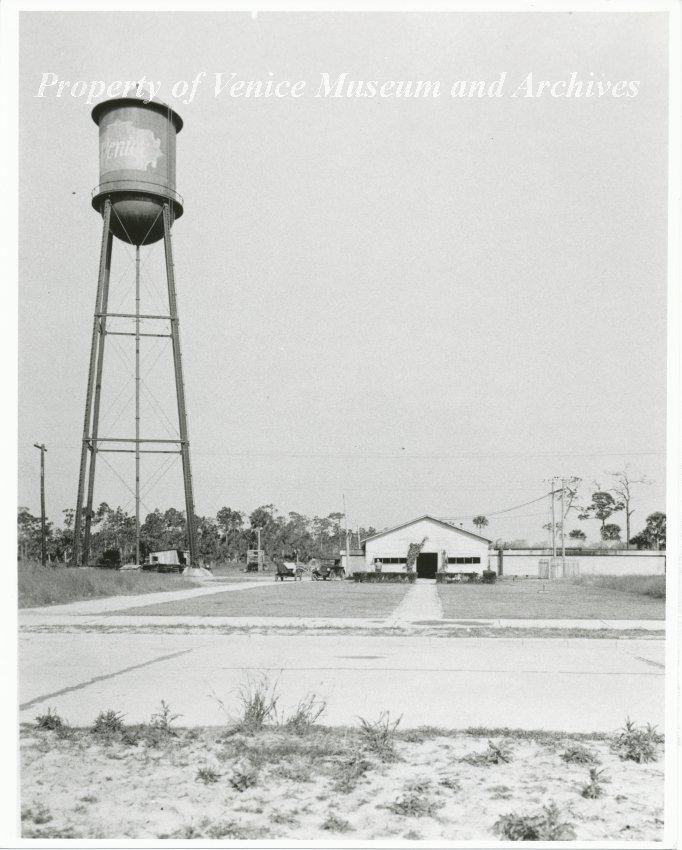
Water tower inspection circa 1947. Venice water plant.
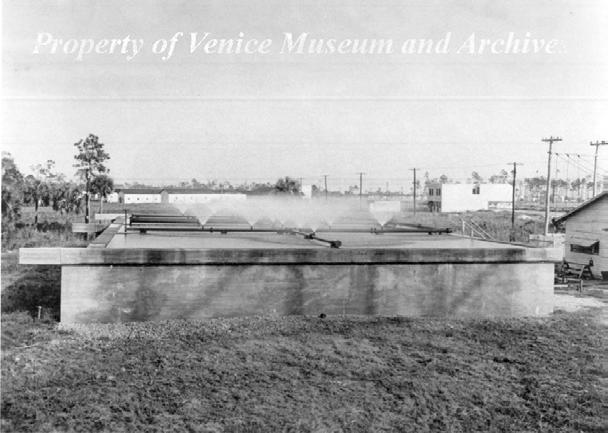
A water plant aerator.
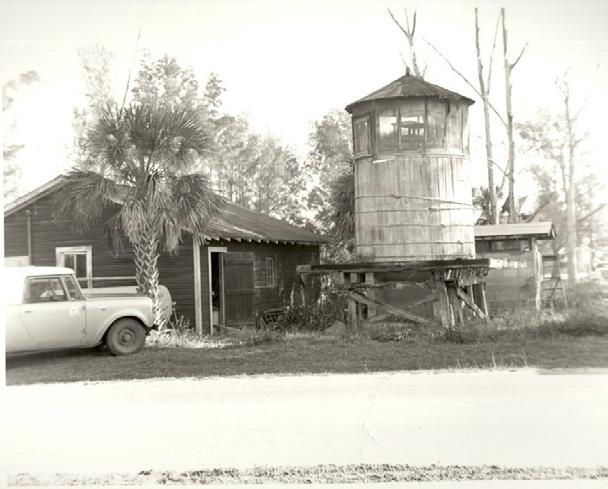
Old water tower at Inlet Circle in Venice.
Original Venice water plant and tower.
AWWA Water Matters Fly-In: FSAWWA Participation and Focus for 2026
ITyler Tedcastle Chair, FSAWWA
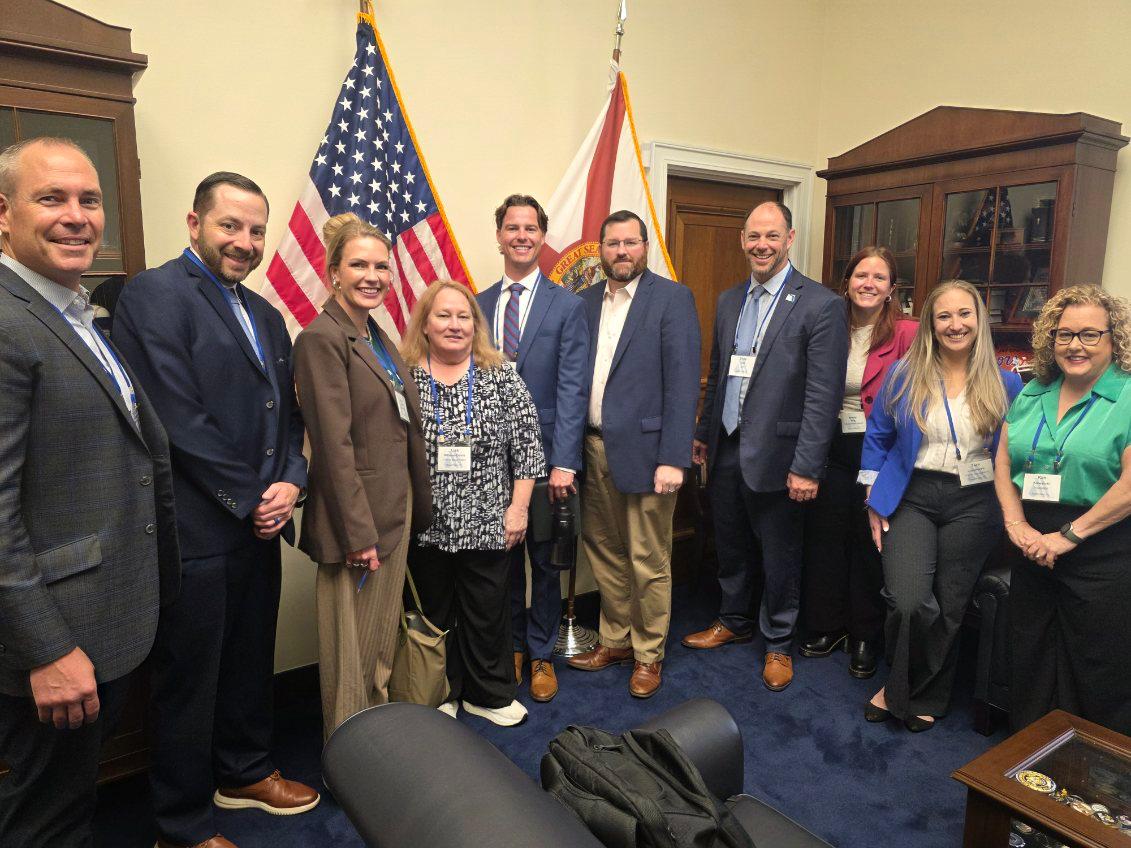
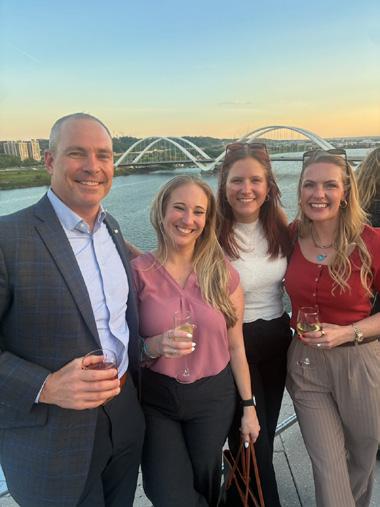
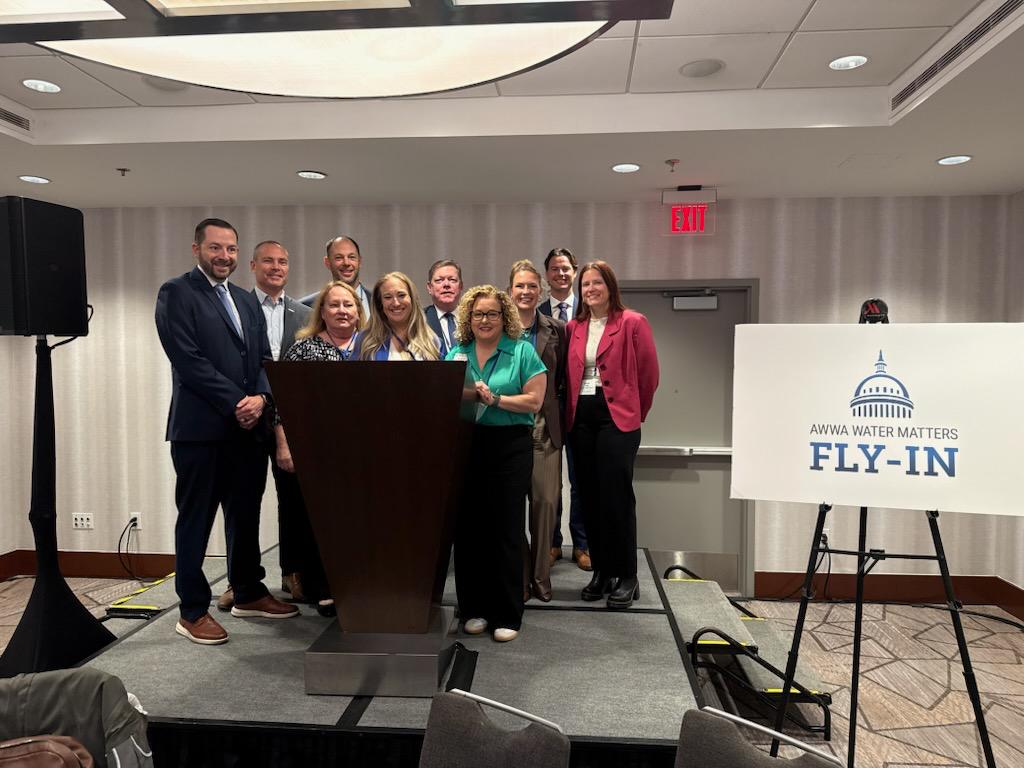
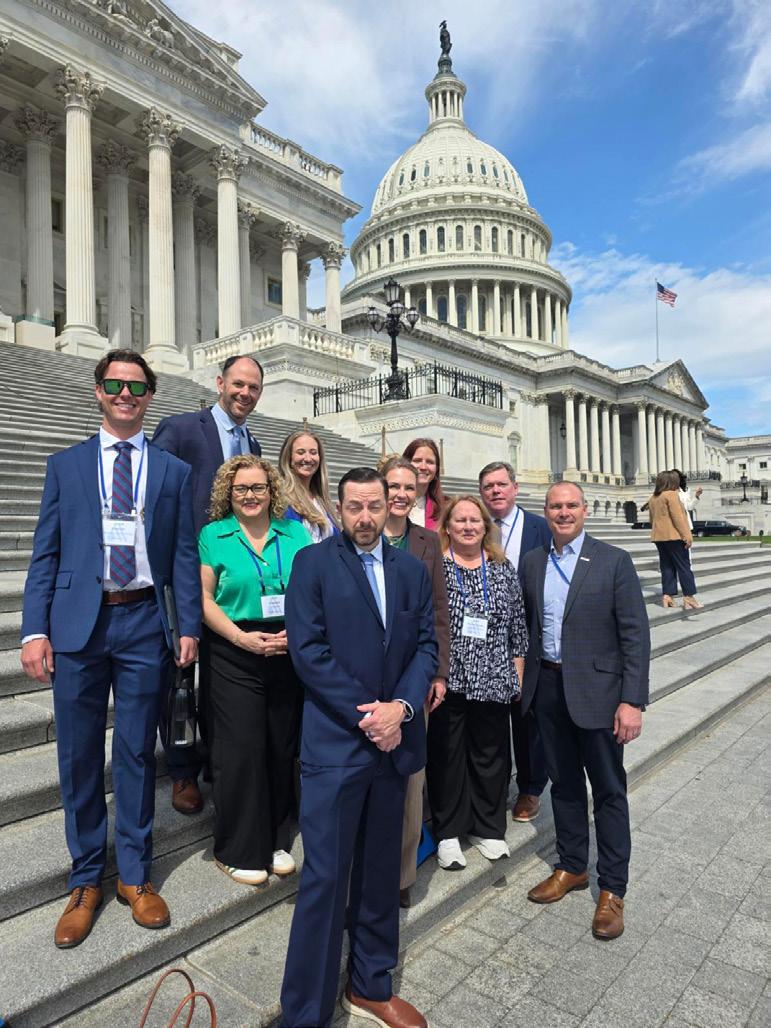
n April, FSAWWA had the pleasure of joining other water-focused organizations in Washington, D.C., for meetings with our congressional representatives to discuss water policy and its impact on the state of Florida during the 2026 AWWA Water Matters Fly-In. In all, FSAWWA was able to meet 13 members of Congress and both Florida senators.
Ten volunteers from FSAWWA represented the following Florida utilities and organizations taking part in the meetings:
S City of Casselberry
S Pinellas County
S City of Boca Rato
S Broward County
S JEA (Jacksonville and surrounding areas)
S City of Winter Haven
S Kimley-Horn and Associates
S Carter VerPlanck, a DXP Company
S FSAWWA
Key Topics at the Fly-In
Understanding that every city, county, state, utility, organization, etc., all have their own needs and asks, AWWA focused on four key topics to discuss with our representatives.
The key topics for the 2026 legislative session were:
Strengthening the Nation’s Water Infrastructure
AWWA is asking for the reauthorization and funding for the Drinking Water State Revolving Fund and Clean Water State Revolving Fund at $3.25 billion each. It’s also recommending reauthorization and full funding for the Water Infrastructure Finance and Innovation Act program at $80 million. While the programs have not seen a significant increase since 2018 (aside from the Infrastructure Investment and Jobs Act funding), AWWA estimates $100 to 120 billion will be needed just to meet per- and polyfluoroalkyl substances (PFAS) standards and requirements for the Lead and Copper Rule Improvements.
Water systems also face trillions in other infrastructure needs over the next 25 years. Currently, the proposed federal budget shows an 85 to 90 percent cut from these programs. If approved, these cuts could have serious
implications on available federal funds for capital improvement projects.
Supporting “Polluter Pays” Principle for PFAS Clean-Up
AWWA supports the bipartisan Water Systems PFAS Liability Protection Act, which ensures that PFAS manufacturers and polluters pay to clean up environmental PFAS contamination—not water systems and their ratepayers. In 2024, The U.S. Environmental Protection Agency (EPA) designated two PFAS chemicals—perfluorooctanoic acid and perfluorooctanesulfonic acid—as hazardous substances under the Comprehensive Environmental Response, Compensation, and Liability Act. This action enables EPA to recover costs for the cleanup of sites contaminated with these PFAS.
While EPA intended to target PFAS manufacturers and other polluters, the designation also exposes water systems and the communities they serve to significant financial liability unless Congress acts. Supporting this allows for the costs of remediation to not to be passed on to water provider and consumers.
Ensuring Water Affordability for All Americans
AWWA supports the bipartisan Low-
Improving Water System Cybersecurity and Resilience
AWWA encourages our legislators to support a variety of bipartisan legislation that will strengthen the security, resilience, and sustainability of the nation’s water systems. As foreign and domestic cyber threats continue to intensify, AWWA recognizes the need to improve cybersecurity practices across the water sector to protect the critical infrastructure that we all rely on. A variety of free tools and guidance documents have been developed by AWWA to help water systems improve their cyber posture. While these
A Water Utility’s Path Toward Coagulant Switch and Sludge Residual Reduction
Veronica Llaneza and Steve Giordano
Purpose and Background
Waterbury Water Treatment Plant (WTP) and other utilities across the United States encounter challenges in managing and disposing large volumes of sludge production. Conventional WTPs traditionally consume large quantities of coagulant and produce even greater volumes of sludge residuals. Efforts to improve process operations relating to water quality parameters, residual reduction, and chemical dosing, as well as treatment cost savings, were addressed for this project.
Waterbury WTP, located in Thompson, Conn., serves more than 125,000 residents in three different communities. The conventional plant was constructed in 1987 with a design capacity of 38 mil gal per day (mgd), with a current average daily demand of approximately 15 mgd and a maximum flow rate of 20 mgd.
Veronica Llaneza, Ph.D., P.E., is senior water technologist, and Steve Giordano is project manager–operations management and facilities services, at Jacobs in Miami.
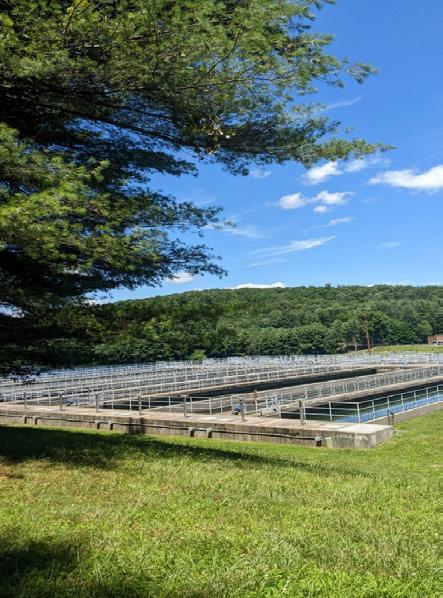
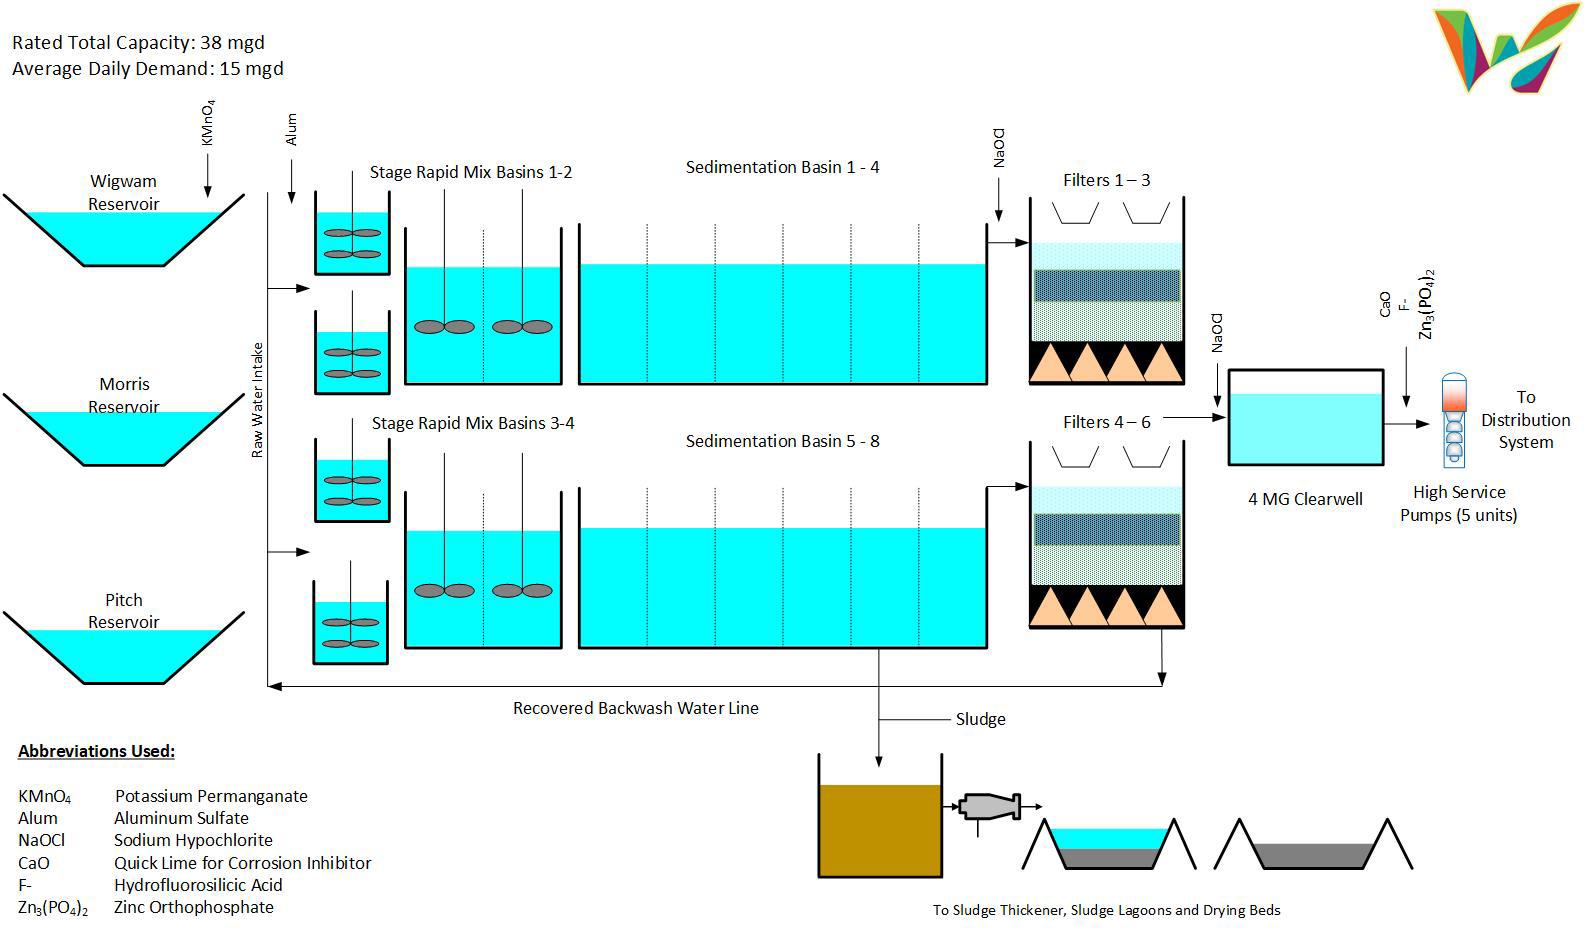
Raw water is pumped from three different reservoirs surrounding the facility: Pitch, Morris, and Wigwam. The treatment process involves coagulation, flocculation, sedimentation, filtration, and disinfection. The primary coagulant, aluminum sulfate (alum), is added in the rapid mixing chamber to enhance settling and total organic carbon (TOC) removal. Figure 1 illustrates the rapid mix and sedimentation basins. After flocculation, the water enters the eight flocculation settling basins equipped with two-level basins for enhanced settling rates, and settled water flows into the gravity filters where it’s dosed with sodium hypochlorite (NaOCI). The six filters are four dual-media filters (layers of gravel, sand, and anthracite) with an average run time of 72 hours prior to the required
Figure 1. Waterbury Water Treatment Plant rapid mix and sedimentation basins.
Figure 2. Waterbury’s process flow diagram.
backwashing. The filtered water is dosed again with NaOCI prior to entering the clearwells. As the water enters the clearwell, lime and phosphate are added for corrosion control, and fluoride is added prior to being pumped to distribution. Figure 2 presents a process flow diagram for this facility.
Some key treated water quality parameters and targets include:
S Treated water pH: 7 to 8
S Treated water free chlorine residual range: 1.3 to 1.8 mg/L
S Treated water TOC: <1.5 mg/L (35 percent TOC removal requirement)
S Treated water iron and manganese: <0.02 mg/L
S Filter effluent turbidity: < 0.2 nephelometric turbidity units (NTUs)
Sludge produced in the eight sedimentation basins is collected by chain and flight sludge collectors and raked into hoppers at the end of each basin, then pumped into two decanting residual basins. The facility contains two lagoons in rotation, with recent upgrades to the residual hanging area.
To improve sludge management and address limited space in the residual lagoons, an innovative method for solids drying and storage was provided. Crews cleared a three-acre plot of land within the facility site and constructed drying beds with geotubes to contain additional solids. The three 200-ft geotubes enable solids dewatering and management for longterm beneficial reuse. This upgrade provides additional solids handling and drying capacity to support up to five more years of solids backlog.
In addition to increasing the residual holding capacity area to reduce sludge production within the treatment process, bench- and full-scale feasibility studies were conducted to evaluate the performance of various coagulants: three polyaluminum chloride (PACl) products with varying basicity and an aluminum chlorohydrate (ACH) product compared to alum, the current coagulant used. The data were used to determine the effectiveness of each coagulant and develop recommendations for future treatment enhancements at the WTP.
Results indicated that ACH offered an effective approach to coagulation, resulting in cost and operational efficiencies, highquality water, and reduced sludge production. It was concluded that switching to ACH could potentially yield many benefits compared to other metal-based coagulants, such as:
S Lower coagulant dosage requirement
S Less pH reduction and alkali usage
S Increased total organic carbon removal
S Decreased sludge generation
S Improved operation and maintenance efforts
Sample Characterization
Water quality characterization on each reservoir was conducted to provide a baseline and control sample. During bench testing, clarified water from each trial was analyzed for turbidity, pH, temperature, UVA254, total alkalinity, and hardness.
The UVA254 absorbance is a useful method to indicate the general character of dissolved organic matter in a water sample and evaluate the disinfectant byproducts (DBPs) formation potential. A correlation between UVA254 absorbance and dissolved organic carbon (DOC) levels at a variety of times throughout the year from the different raw water sources was established. Turbidity was also recorded during the trial; however, results are not indicative of full-scale plant performance due to hydraulic limitations in bench-scale testing. Coagulant addition can also have an impact on pH and
alkalinity, so both parameters were closely measured throughout the evaluation, along with total hardness.
Coagulant Evaluation Approach
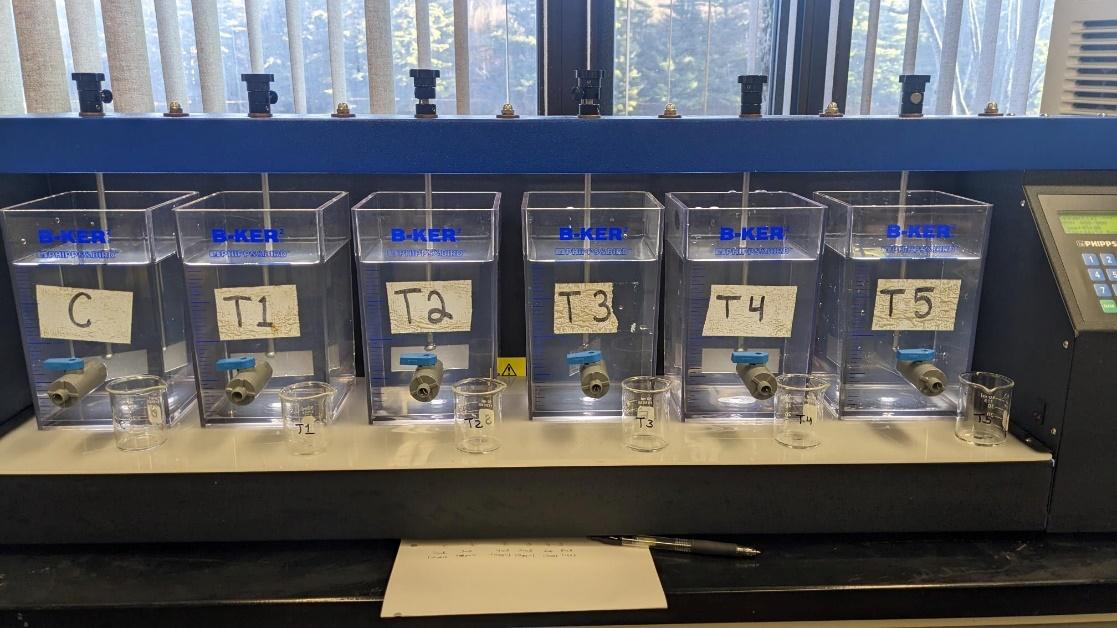
Several jar testing series—each comprised of six independent test conditions—were used to determine optimum dosing conditions in varying raw water conditions, such as source water and water quality parameters. Figure 3 shows the jar testing equipment and sequence. During the bench-scale evaluations, the current coagulant alum was tested as a performance baseline, along with an ACH product and three PACl products. Once all five trials were complete and the best-performing coagulant was identified, additional trials were done with other raw water sources during different seasons
Continued on page 18
Figure 3. Waterbury Water Treatment Plant jar testing sequence.
Figure 4. Coagulant UVA254 adsorption results.
because of monthly water quality deviations, including water viscosity, turbidity, types of TOC characterization, and levels. Full-scale implementation of the selected coagulant at the facility proceeded.
Feasibility Results
The bench-scale test objective was to determine coagulant alternatives to improve existing treatment operations. When comparing all coagulants tested on an equivalent dose basis, ACH outperformed all PACl and alum in UVA254 removal. Figure 4 illustrates the results for coagulants dose and UVA254 levels. The UVA254 target level is 0.025 cm-1 while the limit is 0.035 cm-1, which relates to acceptable TOC levels in an overall correlation graph. The ACH is below the UVA254 limit at a dose of 0.45 mg/L as aluminum (Al) and below the target UVA254 at 0.54 mg/L as Al. Optimal dosing for other coagulants is higher compared to ACH.
As previously mentioned, UVA254 is a good surrogate for organic carbon in both source and drinking water. Another objective was to improve DOC removal responsible for DBP formation in the distribution system during chlorination.
While turbidity is an important parameter in terms of filter performance, results in these bench-scale tests may not mimic full-scale conditions due to hydraulic restrictions; however, it can indicate potential trends with turbidity removal. Results showed PACl (PCH180) having the lowest overall turbidity of 1.28 NTUs, followed by ACH with a turbidity level of 1.56 NTUs, with alum having the highest overall average turbidity of 1.97 NTUs.
Waterbury’s overall raw water total alkalinity is relatively low, approximately 13 to 16 mg/L as calcium carbonate (CaCO3); thus, with low buffering capacity, alum (zero basicity), and low basicity, coagulants can significantly depress the pH and further reduce alkalinity, compared to high basicity coagulants like ACH and a high basicity PACl (PCH 180). Results demonstrated that excess dosing of coagulants with low basicity reduces the pH in the rapid mix basins, and posttreatment lime addition for subsequent final pH correction is needed.
The pH is important in coagulation, not only in the removal of organics, color, and turbidity, but also in maintaining satisfactory minimum levels of dissolved residual Al in the clarified water. The optimum pH for coagulation of surface waters is usually in the range of 6.5 to 7.2, since the aluminum hydroxide (Al[O])₃) floc solubility varies with the source of the raw water.
Overall, ACH works well over a higher pH range—anywhere from 6.5 to 7.5—while alum’s operating dosed water pH is around 5.8 to 6.5 and the average raw water has a pH of 7.2. In some cases, this means coagulation can be achieved at a pH that avoids the need for post-treatment alkali dosing. The treated water pH also gets a slight increase from the Na0Cl addition for disinfection.
The ACH has minimal impact on the pH of treated water because it’s less acidic than other coagulants; it also has a high degree of neutralization of hydrochloric acid (HCl) and alum has no basicity, thus significantly affecting pH.
Discussion Summary
The ACH was the preferred coagulant of choice to meet all water quality and sludge production objectives compared to other coagulants evaluated as it has the highest reagent concentration percentage: 24 percent w/w aluminum oxide (Al2O3). Having a higher active reagent also corresponds to dosing less to achieve the targeted water quality goals, which leads to lower sludge production rates that meet or exceed removal targets.
Table 1 summarizes results for alum and ACH. The optimal coagulant dose for ACH is approximately a third of that required when using alum, thus producing less sludge, as well and having no significant effect on the pH while achieving comparable organic carbon removal from the water based on the UVA254 measurement results. Since ACH has a higher positive charge, it’s more efficient in coagulating negatively charged contaminates, such as organic matters.
Preliminary full-scale result trends, along with several references, demonstrate that ACH will produce less sludge, so an approximate sludge
production comparison between alum and ACH at equivalent dosing was conducted. Calculated sludge production was derived from preliminary full-scale results, jar testing scenarios, and literature review. Twenty percent total solids and an average flow rate of 15.8 mgd were assumed, with the following sludge production:
S Alum coagulant sludge production: 221 dry tons/years and 1,105 wet tons/year
S ACH coagulant sludge production: 107 dry tons/years and 534 wet tons/year
Coagulant-produced sludge is composed of metal hydroxide together and colloidal matter removed from raw water; the less coagulant used, the less coagulant-based sludge is produced. Since suspended solids and turbidity are relatively low in all Waterbury reservoirs, most of the sludge produced is generated from the coagulant dosing. The resulting Al(O)₃ species, or coagulant sludge, is such that 1 mg/L of alum will produce approximately 0.26 mg/L of sludge and consume 0.5 mg/L of alkalinity as CaCO3.
The ACH contains more reactive Al and produces more sludge than alum pound for pound: 1 mg/L ACH to produce 0.35 mg/L of sludge, according to the literature; however, since a lower dosage/feed rate is required, less sludge is produced. The ACH contains more reagent concentration (24 percent as Al2O3) with a dosage of about one-third that for liquid alum (8 percent as Al2O3), and produces less sludge at equivalent doses.
Significant sludge production is trending in the full-scale demonstration testing, when ACH is used as the coagulant. In addition, full-scale demonstration testing has shown that the solids generated by ACH dewater more efficiently, further decreasing handling and disposal costs. Long-term field sludge handling will confirm dewatering efficiency; however, ACH is not affected by temperature since it forms a stronger, compacted, and denser floc that settles faster and more readily than the fluffier jellylike flocs of traditional inorganic coagulants, such as alum. This is important in winter when water is colder and more viscous, as hydrolysis reactions slow and less-dense floc carries over to the filters.
The ACH has the least effect on raw water alkalinity levels of any inorganic coagulant, so it decreases or eliminates pH depression and the corresponding need for alkali dosing. Both bench- and full-scale results confirm the amount of lime addition needed to reach finished water parameter targets related to corrosion control, which are reduced when switching from alum to ACH. Since ACH impacts pH slightly, it only requires approximately one-third of the lime added to reach the finished water targets. The reduction of post-treatment chemical
Table 1. Alum and Aluminum Chlorohydrate Water Quality Results Summary
Table 1. Alum and Aluminum Chlorohydrate Water Quality Results Summary
usage is an added benefit since maintenance of lime equipment can be laborious due to the corrosivity of lime, along with sludge disposal energy (and polymer) expenditure. Preliminary full-scale results suggest that the change from alum to an ACH-type coagulant would yield a smaller dosing volume, resulting in lower to no lime addition, with a reduction in sludge production to still meet and/or improve water quality parameter requirements.
In addition, filter operation and maintenance costs that reduce solids loading on the media filters are not concluded during this assessment, as well as DBP formation impact in the distribution system. It’s projected, however, that filter performance improves slightly due to the lower turbidity yield by ACH in the clarified water, thus increasing run times and unit filter run volumes. Public perception and risk management impacts were not considered in this assessment, but are projected to have a positive effect on the project and the community Waterbury WTP serves.
Conclusion and Recommendations
The assessment was conducted to improve the treatment process of the flocculation/
sedimentation units by evaluating various coagulants. Overall, bench-scale trials established the performance and optimal dosing for alum, ACH, and different PACl products for UVA254 removal, turbidity reduction, pH suppression, and alkalinity/hardness impact. The preliminary full-scale demonstration results suggest that the change from alum to ACH for coagulant type would yield a smaller dosing volume, resulting in lower to no lime addition and a reduction in sludge production, yet still be able to meet and/or improve water quality parameter requirements.
Based on these results, it was concluded that ACH surpassed all other coagulants when treating various reservoir source water, along with seasonal changes where temperatures fluctuate and turbidity and the nature of DOC levels tend to be higher in the summer.
The ACH advantages as a coagulant include:
S Reduces the required coagulant dosage to meet optimal DOC removal
S Produces less sludge and greatly reduces the generation of scheduled waste
S Produces clean water with undetectable residue Al
S Reduces or eliminates lime addition for corrosion control
In addition, when applying a holistic cost benefit analysis, monetary benefits are also anticipated, even though ACH is generally more costly than alum.
References
• Coagulation/Flocculation Workshop Course #307 (2022). Fleming Training Center, Department of Environment & Conservation, 1-148.
• E.I., D. Y. (2011). A Comparison of Aluminum and Iron-Based Coagulants for Treatment of Surface Water in Sarasota County, Florida. Orlando Florida: Department of Civil, Environmental, and Construction Engineering, UCF.
• Freese, P. L. (2009). A Simple Guide to the Chemistry, Selection and Use of Chemicals for Water and Wastewater Treatment. Gezina: Water Science.
• S.Q, O. I. (2021). Optimization of ACH Coagulant, Settling Time and Powdered Activated Carbon as Coagulant Aid With Economic Analysis. Global Nest, 1-11. S
Prepare for August National Water Quality Month!
Water is used every day in a variety of ways: drinking, household use, recreation, irrigation, transportation, industry, agriculture, and manufacturing, to name a few. Just try to imagine what life would be like for your utility customers without easy access to clean and plentiful water. There would be no fountains to quench their thirst when out on a hot day. No more swimming pools, and no lakes and rivers clean enough for recreational activities. No more long showers at home, or any running water for their businesses.
National Water Quality Month reminds us to take a moment to consider how important water sources are to humans and all of the other inhabitants of the planet. By thinking about the little things that your customers do on a daily basis that could have a negative impact on water quality, and getting them to change their habits, you’ll be a step closer to improving water quality—for everyone.
History
The history of National Water Quality Month originated when two United States congressional acts were passed in the early 1970s in an effort to protect water sources. Starting with the Clean Water Act (CWA), passed in 1972, the federal government began taking steps to curb water pollution by making it illegal to dump high amounts of toxic materials into bodies of water. This set the standard for making sure that surface water was up to certain standards before being
U.S. Environmental Protection Agency (EPA) and backed by the United Nations to promote conservation and protection of natural water sources by starting conversations on what households and communities can do to ensure access to safe, clean drinking water for generations to come.
What is Water Quality?
Water quality is based on a set of standards and criteria that describe the desired conditions or levels of protection and how the required conditions will be established in waters of the United States in the future. These standards and criteria are provisions of state, territorial, authorized tribal, or federal law approved by EPA. Although the majority of water is regulated and safe to drink, you and your customers should still be cautious about what could potentially be in pipes, faucets, and local waterways contaminating the water. According to the National Resources Defense Council, contaminated water could have higher concentrations of lead, atrazine, pathogens, chlorine, arsenic, nitrates, radioactive material, vinyl chloride, perchlorate, per- and polyfluoroalkyl substances, and pharmaceuticals.
Standards of Water Quality
Water quality standards must include the following items:
agricultural irrigation, industrial uses, and navigation.
Criteria for Protection of Designated Uses
States, territories, and authorized tribes must adopt criteria that protect the designated uses. These criteria can be numeric or narrative, but most entities typically adopt both types.
Antidegradation Requirements
These provide the framework of water quality protection by maintaining the current uses of the water and protecting the quality that has already been achieved.
General Policies for Implementation
Based on EPA approval, all states, territories, and authorized tribes are allowed to adopt policies and provisions for implementation of water quality standards.
Water quality standards are developed using federal guidelines of the CWA. All entities develop their own legal and administrative procedures for adoption of their standards. Generally, they use the following steps:
S Work groups or informal public meetings are held to develop the standards, which are then put out for public comment.
S Public hearings are scheduled to gather input from the public.
S Water quality criteria must be included to provide sufficient coverage and be stringent enough to protect the designated uses.
This requires states, territories, and authorized tribes to specify the goals and objectives about how each water body will be used, including fishing, recreating, drinking,
The water quality standards for each entity must be approved by EPA prior to implementation. If the standards are approved, they become applicable. After approval, entities must do a review of their standards at least once every three years. If all or part of an entity’s standards are not approved based on the requirements in the CWA, then EPA will outline necessary changes to meet the requirements.
Ways to Protect and Celebrate Water
National Water Quality Month reminds us to take a long, hard look at what households, businesses, farmers, and communities are doing to protect sources of fresh water, which is important to everyone in many ways. Research done by the American Chemical Society, for instance, demonstrates that showering leads to greater exposure to toxic chemicals in tap water than drinking the water does. A person can absorb up to eight glasses of water through the skin during
a quick 10-minute shower. Due to this fact, it’s imperative that all of the water that enters homes and businesses is safe and free from contaminants.
Your utility can help individuals, families, and businesses prevent water pollution from entering their homes, stores, and offices, especially during National Water Quality Month.
Protecting Water
Ways to protect water include:
S Not using antibacterial soaps or cleaning products; regular soap and water will do the trick. Much of the antibacterial soaps contain a registered pesticide that is known to harm marine life.
S Not flushing unwanted or out-of-date medications or “flushable” wipes down the toilet or putting them down the drain.
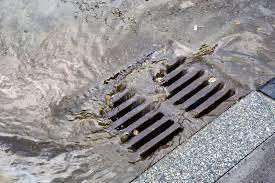
S Not putting anything but water down storm drains because they carry water to local waterways.
S Fixing leaks that drop from cars, vans, and trucks and putting liners in driveways and garages to collect oil and other materials.
S Avoid using pesticides or chemical fertilizers, which can run off the soil and contaminate the waterways that feed drinking water supplies.
S Choose nontoxic cleaning products when possible.
S Pick up after pets as stormwater could wash the animal waste into waterways and contaminate the water.
S Don’t pave properties.
S Use a car wash. Washing a car at home can flush chemicals down the storm drains that flow into lakes and streams. Professional car washes are required to drain into sewer systems so that wastewater plants can treat the water before it’s reused.
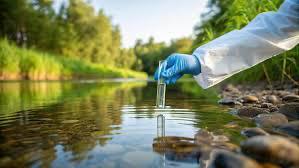
S Have a private well tested and cleaned regularly. There can be bacteria buildup in wells.
S Encourage customers to read your water quality reports so that they know what the water quality is in their area.
Celebrating Water
Help your employees and customers make a difference in your community:
S Adopt a local watershed to monitor and improve water quality.
S Plant a tree to help prevent erosion and supports healthy watersheds.
S Use social media with hashtags like
#NationalWaterQualityMonth to educate your customers and the public.
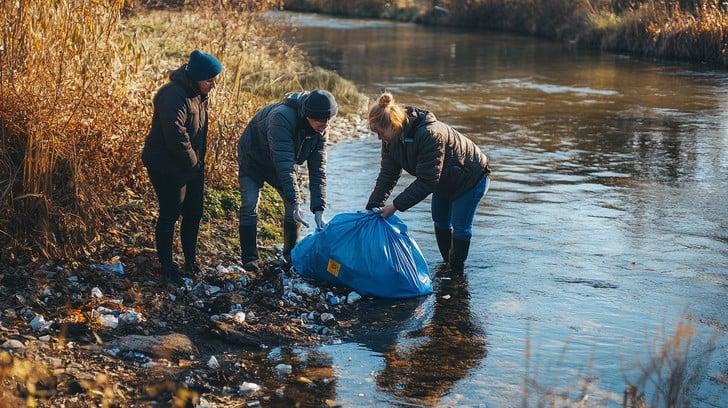
Another option for your employees and customers could be for them to gather a group of family, friends, coworkers, or neighbors and volunteer to clean streets, beaches, rivers, and wetlands. They could bring a picnic and hold a contest to see who can clean up the most trash and debris, offering a prize to the winning team. It’s a great way to get everyone in a community together and enjoy an outdoor day full of fun doing something that’s good for the environment. Have someone take photos or videos of the event and share them on social media.
Be Aware Every Day!
Water that enters household, storm, and other drains goes into waterways before entering the treatment plants. Practicing these little changes in all communities can make a big difference.
Together we can all make a big impact. Spread the word to your customers, the media, and the public that August is National Water Quality Month! S
2026 Florida Water Industry Survey: Insights From Readers
The second annual Florida Water Industry Sector Survey, managed by Sedivision and Hill Research for the Florida Water Resources Journal (FWRJ), provides a detailed snapshot of how water professionals view the health, challenges, and future direction of the state’s water systems. Conducted online from March 2 to April 15, 2026, the study gathered the perspectives of individuals working inside or providing services to Florida’s water sector. The sample of respondents used nonprobability, where participants are
selected based on particular criteria rather than random selection, and is not intended to represent the entire sector. The results offer a valuable cross section of sentiment from managers, engineers, contractors, operators, and other professionals across the state.
Respondent Profile
The 2026 sample reflects a notable shift toward leadership participation. The report highlights that the 2026 survey saw a significant increase in executive/manager participation and commensurate decline in operation/ maintenance participation.
Key characteristics of the respondents include:
S Experience – 47 percent have worked in Florida’s water sector for more than 20 years, while 12 percent have fewer than five years of experience.
S Roles in the Industry – 38 percent work in operations or maintenance, and 36 percent serve in executive or management roles.
S Education – Nearly half (49 percent) hold a four-year or professional degree.
S Organization Size – Respondents represent a mix of small (23 percent), medium (45 percent), large (11 percent), and very large (21 percent) systems.
These demographics shape many of the attitudes reflected in the findings.
Health of Florida’s Water Industry
Overall sentiment toward the health of Florida’s water industries is strongly positive.
Current Conditions
When rating the health of Florida’s water industries today:
S 58 percent rated statewide conditions as good
S 9 percent rated them excellent
S 30 percent said only fair
S 3 percent rated them poor
Respondents viewed their nearest systems even more favorably, with 56 percent rating them good and 13 percent excellent.
Differences Across Groups
Executives and managers consistently expressed more-positive views than frontline workers. Groups most likely to rate industry health as excellent or good included:
S Those who consume news from four or more sources
S Medium sized organizations
S Combined water/wastewater utilities
S Readers of FWRJ
Conversely, higher rates of fair/poor ratings came from:
S Wastewater utility personnel
S Operations and maintenance staff
S Individuals with a high school education or less
S Small organizations
Outlook for 2031
Looking ahead five years, respondents were cautiously optimistic about the future of the industry:
S 43 percent expect conditions to improve
S 35 percent expect them to stay the same
S 22 percent expect them to worsen
This represents a more optimistic outlook than expressed in the 2025 survey, when only 36 percent expected improvement.
Top Issues and Challenges
The survey identifies two dominant concerns:
S Aging infrastructure
S Population growth
When asked to name the single most important issue facing Florida’s water industries today, respondents said:
S Aging infrastructure – 35 percent
S Population growth – 23 percent
S Attracting and retaining employees – 19 percent
S Government mandates – 12 percent
S Financing operations – 6 percent
S Cybersecurity – 1 percent
Emerging Issues
When asked to identify the emerging issues likely to soon become urgent, respondents highlighted the following:
S Replacing retiring workers – 66 percent
S Dealing with per- and polyfluoroalkyl substances – 63 percent
S Meeting new biosolids requirements – 40 percent
S Supply chain delays and shortages – 21 percent
The prominence of workforce concerns aligns with the sector’s aging labor profile.
Cybersecurity: A Slow-Moving Priority
Cybersecurity remains a secondary concern for many organizations. The report notes that it is still not on the front burner for most systems, but shows a slight upward trend from last year.
The respondents gave the issue the following prioritization levels:
S Immediate priority – 49 percent
S Not an immediate priority – 51 percent
S High priority in 5 to 10 years – 22 percent
S Medium priority needing more support – 20 percent
S Low priority or not previously considered – 9 percent
Larger systems and executives are more likely to view cybersecurity as an immediate priority, while small systems and operations staff are more likely to say it is not.
Human Resource Strategies
The survey asked respondents to rate several workforce strategies. The strongest support went to high school internships and veteran hiring, while artificial intelligence (AI) and robotics were viewed skeptically.
The ratings for the strategies were:
Continued on page 24
S High school internships – 63 percent excellent, 25 percent good
S Recruiting military veterans – 48 percent excellent, 36 percent good
S Interstate reciprocity – 36 percent excellent, 38 percent good
S Recruiting inmates upon release – 13 percent excellent, 32 percent good
S AI and Robotics – 8 percent excellent, 20 percent good; 72 percent rated them fair or poor
The report states that AI as a substitute for personnel is not seen as useful.
News and Information Sources
Professionals rely heavily on peer networks and industry publications. The survey notes that FWRJ and professional colleagues top the list of news sources.
Regularly used sources include:
S Florida Water Resources Journal – 54 percent
S Professional colleagues/coworkers – 53 percent
S Association newsletters – 41 percent
S Email newsletters – 39 percent
S Conferences and other training – 36 percent
S Internet discussion boards – 7 percent
Those who consume information from multiple sources tend to express more positive views about industry health and organizational performance.
Access to Capital
Self-reported access to capital has improved since the 2025 survey. Current assessments are as follows:
S Better than five years ago – 34 percent
S Same – 40 percent
S Worse – 15 percent
S Not sure – 11 percent
Mid size systems reported the greatest improvement, followed by combined water/wastewater utilities and organizations with active professional information networks.
Conclusion
The 2026 Florida Water Industry Sector Survey paints a picture of a sector that is generally optimistic about its current condition and future trajectory, yet deeply aware of the challenges ahead. Aging infrastructure, population growth, and workforce transitions dominate the near-term agenda, while cybersecurity and AI adoption remain slower-moving priorities. Access to capital shows encouraging signs of improvement, particularly among midsized systems.
The findings underscore the importance of continued investment in infrastructure, workforce development, and information sharing—areas where Florida’s water sector appears both engaged and increasingly active. S
Operational Strategies for Bioenergy Facilities With Strict Nutrient Limits
Lee Kimbell, Chris Andres, Chris deBarbadillo, and Milad Ebrahimi
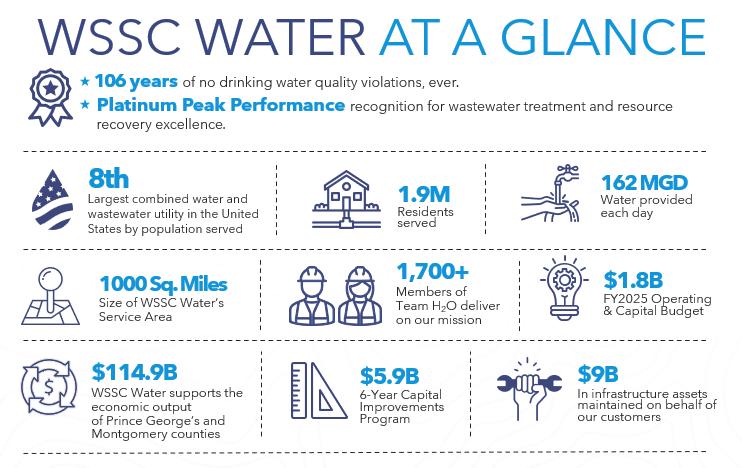
The Washing Suburban Sanitary Commission (WSSC Water) provides water and wastewater services to almost 2 million people in Montgomery and Prince George counties in Maryland. Some key information about the organization is highlighted in Figure 1.
WSSC Water is investing in a regional bioenergy project that modernizes solids handling practices by eliminating lime stabilization, reducing sludge volume, lowering disposal costs, and significantly reducing greenhouse gas emissions. The bioenergy facility includes cake receiving,
predewatering, thermal hydrolysis (THP), anaerobic digestion, and final dewatering. Designed to serve the community for the next century, it will receive and process biosolids from six water resource recovery facilities (WRRFs) and transform the material into a Class A biosolid product. Methane produced during anaerobic digestion will generate up 4.5 megawatts of power via renewable natural gas.
The bioenergy facility is sited at the Piscataway WRRF, with the mainstream final effluent discharged to a tributary of the Chesapeake Bay. The liquid stream
Step 1: Simulate "typical" conditions for six WRRFs; Output = Sludge characteristics
Lee Kimbell, Ph.D., EIT, is process engineer at Black & Veatch in Miami. Chris Andres, CWP, P.E., is division manager at City of Orlando. Chris deBarbadillo, Ph.D., P.E., is practice lead and director at Black & Veatch in Gaithersburg, Md. Milad Ebrahimi, Ph.D., is enterprise asset strategy manager at Washington Suburban Sanitary Commission in Laurel, Md.
process must meet stringent nutrient limits of total nitrogen (TN) = 4.0 mgN/L and total phosphorus (TP) = 0.18 mgP/L on an average annual basis. The combination of strict National Pollutant Discharge Elimination System (NPDES) discharge limits and a regional biosolids facility that produces a nutrient-rich sidestream load is uniquely challenging.
To prepare for the potential operational changes, WSSC Water engaged Black & Veatch to evaluate both startup and longterm impacts on the mainstream treatment process. Process modeling tools were used to simulate commissioning conditions, quantify sidestream loads, and assess impacts on aeration requirements, chemical demand, and effluent quality. Ultimately, the analysis was intended to inform the development of a robust transition plan to ensure the facility continues to meet its strict nutrient discharge criteria throughout startup and steady-state operation.
Technical Approach
The evaluation involved a robust process modeling effort comprised of five separate BioWin models and over 30 different
Step 4: Summarize output, create Operations Guidance / Transition Plan
Figure 1. About Washing Suburban Sanitary Commission.
Figure 2. Simulation approach.
simulations. Figure 2 summarizes the approach, which can be segregated into four main steps:
S Characterize the sludge streams produced from the six facilities.
S Estimate bioenergy facility performance and resulting sidestream water quality.
S Quantify the impact of that sidestream load on the Piscataway mainstream process.
S Identify what actions could be taken to maintain NPDES permit compliance.
Sludge Characterization Across Six Water Resource Recovery Facilities
The bioenergy facility will receive native primary sludge (PS) and waste activated sludge (WAS) from Piscataway WRRF, plus dewatered cake from Western Branch, Seneca, Parkway, Damascus, and Hyattstown WRRFs. Each facility differs in influent strength, process configuration, and chemical use. Individual process models of each facility were developed or adapted to simulate 2022 average annual conditions and generate resulting sludge production state variables. Table 1 summarizes the sludge characterization for each facility, including the total mass produced by each facility and key parameters detailing solids, biomass, carbon, nutrient, and metal content.
Piscataway’s sludge is a blend of PS and WAS produced under a conventional activated sludge process with a long solids retention time (SRT). This results in a biomass dominated by ordinary heterotrophic organisms (OHOs), ammonia oxidizing bacteria (AOB), and elevated endogenous products (End prod). Piscataway also employs chemical phosphorus (Chem-P) removal via alum addition. As shown, the facility has the highest alum content in the sludge of all contributing facilities.
Among the WRRFs sending solids to the bioenergy facility, only Piscataway and Parkway operate primary clarifiers, and the modeling work accurately accounted for the distinct characteristics of a PS-WAS blend versus WAS only. Western Branch sludge quality is shaped by its high-rate activated sludge system and Chem-P removal strategy. It produces a large fraction of short SRT biomass dominated by OHOs and is also alum laden. In contrast, Seneca and Parkway employ enhanced biological phosphorus (BioP) removal and so produce sludges with higher fractions of phosphorus
Continued on page 28
Biomass - AOB [lb/d]
Biomass – End prod [lb/d]
Biomass - OHOs [lb/d]
Biomass - PAOs [lb/d]
Note:
1Damascus sludge quality was assumed to be like Seneca. Specific aspects beyond total mass were not estimated.
2DTPD = dry ton per day
3LB/D = pound per day
Scenarios Piscataway Solids Imported Sludge SST Value / Implications
Scenario 1 THP + AD + Piscataway Sludge
Scenario 2 THP + AD + Piscataway Sludge
Scenario 3 THP + AD + Piscataway Sludge
Scenario 4 THP + AD + Piscataway Sludge
None O;line First step in commissioning, higher NH4-N loading from native sludge
Yes O;line Highest NH4-N loading scenario prior to startup of SST
Assess operating envelope of SST
Assess operating envelope of SST
Scenario 5 Scenario 4 with Seneca and Parkway operating at full BioP; Piscataway operating in BioP with Chem-P polishing
Potential impacts from implementation of BioP, reduced alum usage at WRRFs
Table 1. Sludge Characteristics
Table 2. Bioenergy Operating Scenarios Considered
Table 3. Treated Sidestream Characteristics
accumulating organisms (PAO) and greater magnesium and calcium availability. The contrasting use of BioP versus Chem-P removal across the facilities leads to significant differences in aluminum content, phosphorus release, and struvite formation behavior in the digesters.
Bioenergy System Modeling
A detailed BioWin model was built to represent the full bioenergy system inclusive of predewatering, THP, anaerobic digestion, postdewatering, and sidestream treatment (SST). Because none of the systems were operational at the time, calibration of THP and digestion processes was conducted with 2018 Bucknell University laboratory scale data. The Bucknell bench-scale study was conducted to support evaluation and design of the THP and digestion processes. Consultant design criteria and mass balances were utilized for the remaining systems. A strong match between reported and simulated variables was achieved.
The THP conversions in the process model were adjusted to match observed solubilization and recalcitrant dissolved organic nitrogen (rDON) and dissolved organic phosphorus (rDOP) formation. This was critical to quantify, as rDON and rDOP will pass through the mainstream activated sludge process unchanged and contribute directly to effluent TN and TP concentrations, respectively. Anaerobic digestion performance was tuned to match volatile solids reduction (43 to 46 percent),
as well as ammonia release. A simplified model for SST was used to represent AnitaMOX performance. This model was tuned to achieve the specified design criteria of 85 percent NH₄-N and ~75 percent total inorganic nitrogen (TIN) removal through the reactor and ~98 percent solids removal in the SST clarifier.
After the bioenergy model was calibrated, specific operating conditions were simulated. Five scenarios were considered and these are summarized in Table 2. The scenarios reflect milestones of commissioning the bioenergy system and the anticipated status of key systems, including the operational status of THP and anaerobic digesters, whether sludge is being imported, and the operation status of the SST process. The combination of these factors was anticipated to result in different sidestream water quality and therefore have a different impact on the Piscataway WRRF mainstream process. Scenario 5 was added later to explore the impact of WRRFs shifting from a Chem-P phosphorus removal strategy to BioP.
Table 3 summarizes key characteristics of the resulting sidestream being returned to the Piscataway WRRF mainstream for each scenario including water chemistry, solids, and various types/species of carbon, nitrogen, and phosphorus. Simulations confirmed the anticipated total Kjeldahl nitrogen (TKN) and rDON loading trends across the commissioning period. Undiluted postdewatering filtrate contained high concentrations of ammonia (1,500 to 1,700 mgN/L), soluble COD (~8,000 mgCOD/L), and phosphorus (up to 645 mgP/L in Scenario
5). After sidestream treatment, ammonia is reduced, but rDON, soluble COD, and phosphorus remain largely unchanged. The model predicted struvite formation would increase if WSSC expanded BioP removal strategies across the WRRFs (Scenario 1: ~620 mg/L while Scenario 5: ~1,658 mg/L). This reflects higher Mg2+, Ca2+, and PO₄-P release occurring in the digesters, which attributed to a greater fraction of BioP sludge being processed.
Mainstream Liquid Treatment Impacts
With sidestreams characterized, evaluation of mainstream impacts and potential operational adjustments to maintain discharge limits of TN = 4.0 mgN/L and TP = 0.18 mgP/L could be explored. Twenty four simulations were conducted to evaluate combinations of bioenergy commissioning scenarios, average annual and maximum month raw influent loads, and seasonal wastewater temperature variations.
The following observations were made:
Nitrogen Removal
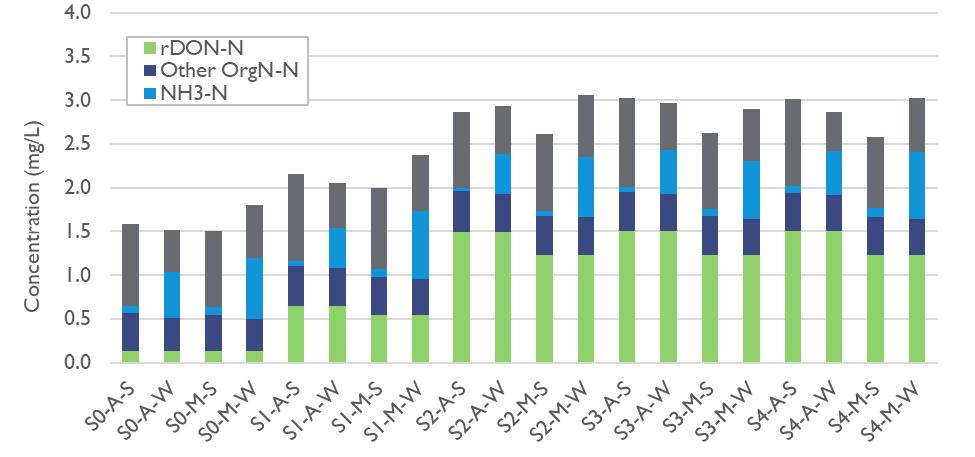
Simulations showed the plant can meet TN ≤ 3 mgN/L in all scenarios considered; however, rDON becomes a major contributor to final effluent TN. Prior to THP operation, rDON made up <0.25 mgN/L of final effluent TN. At full-scale operation of the bioenergy system, rDON contributes 1.2–1.5 mgN/L. Figure 3 illustrates the predicted final effluent TN by N-species and simulation run. This observation puts more emphasis on TIN removal in the activated sludge process. Simulations also showed winter nitrification is challenging; aerobic solids retention time (aSRT) must increase to 12 to 14 days and this results in higher mixed liquor suspended solids (MLSS) at 3800 to 4500 mgTSS/L. At higher flow rates, this MLSS concentration risks clarifier overload. Higher dissolved oxygen (DO) setpoints are also required to support winter nitrification.
The Piscataway WRRF uses supplemental carbon to support denitrification. Simulations showed methanol demand increases sharply with higher sidestream ammonia, nearly doubling from 600 gal per day (gpd) to 1000 to 1250 gpd at full bioenergy system operation. In the long term, it is recommended WSSC evaluate increasing aerobic volume (e.g., repurposing swing zones) and review diffuser layout to confirm air distribution capacity.
Figure 3. Predicted final effluent total nitrogen by nitrogen species and simulation run. Continued on page 30
Continued from page 28
Phosphorus Removal
Simulations showed the plant can meet TP ≤ 0.1 mgP/L with a multipoint alum dosing strategy. Alum must be dosed in the recycle stream to precipitate phosphorus in the primary clarifiers and before it reaches the activated sludge process. If the current single-point dosing strategy upstream of secondary clarifiers is maintained, it will result in accumulation of inert material in the aeration basins. The resulting high MLSS concentration and secondary clarifier solids loading cannot be controlled without risking negative impacts to nitrification. Alum demand increases with higher sidestream TP and dosing alum in sidestream at ~1:1 metal:TP ratio was shown to be adequate.
Capacity Analysis
State point analysis was performed in combination with process simulations to determine activated sludge treatment capacity. The maximum month capacity is
~38 mil gal per day (mgd), corresponding to 30.6 mgd average annual flow. Clarifiers approach both settling and thickening failure at this flow rate and aeration blowers appear to have adequate firm capacity. Chemical storage is adequate, but may require expansion for operational flexibility. To avoid stressing secondary clarifiers, it is recommended raw flow equalization diversion practices occur earlier (~30 mgd) once bioenergy is online.
BioP Implications
Scenario 5 evaluated the effect of implementing BioP at the Seneca, Parkway, and Piscataway WRRFs. Simulations showed that this results in higher struvite formation in digesters and higher TP loads to the sidestream and mainstream; however, it did result in ~18 percent reduction alum demand in the mainstream and comparable TN and TP concentrations in the final effluent. BioP is feasible, but it requires careful management of digester scaling and sidestream P loads. If WSSC pursues BioP, it is recommended that
it considers phosphorus recovery or targeted chemical dosing in the digesters to mitigate struvite issues.
Conclusions
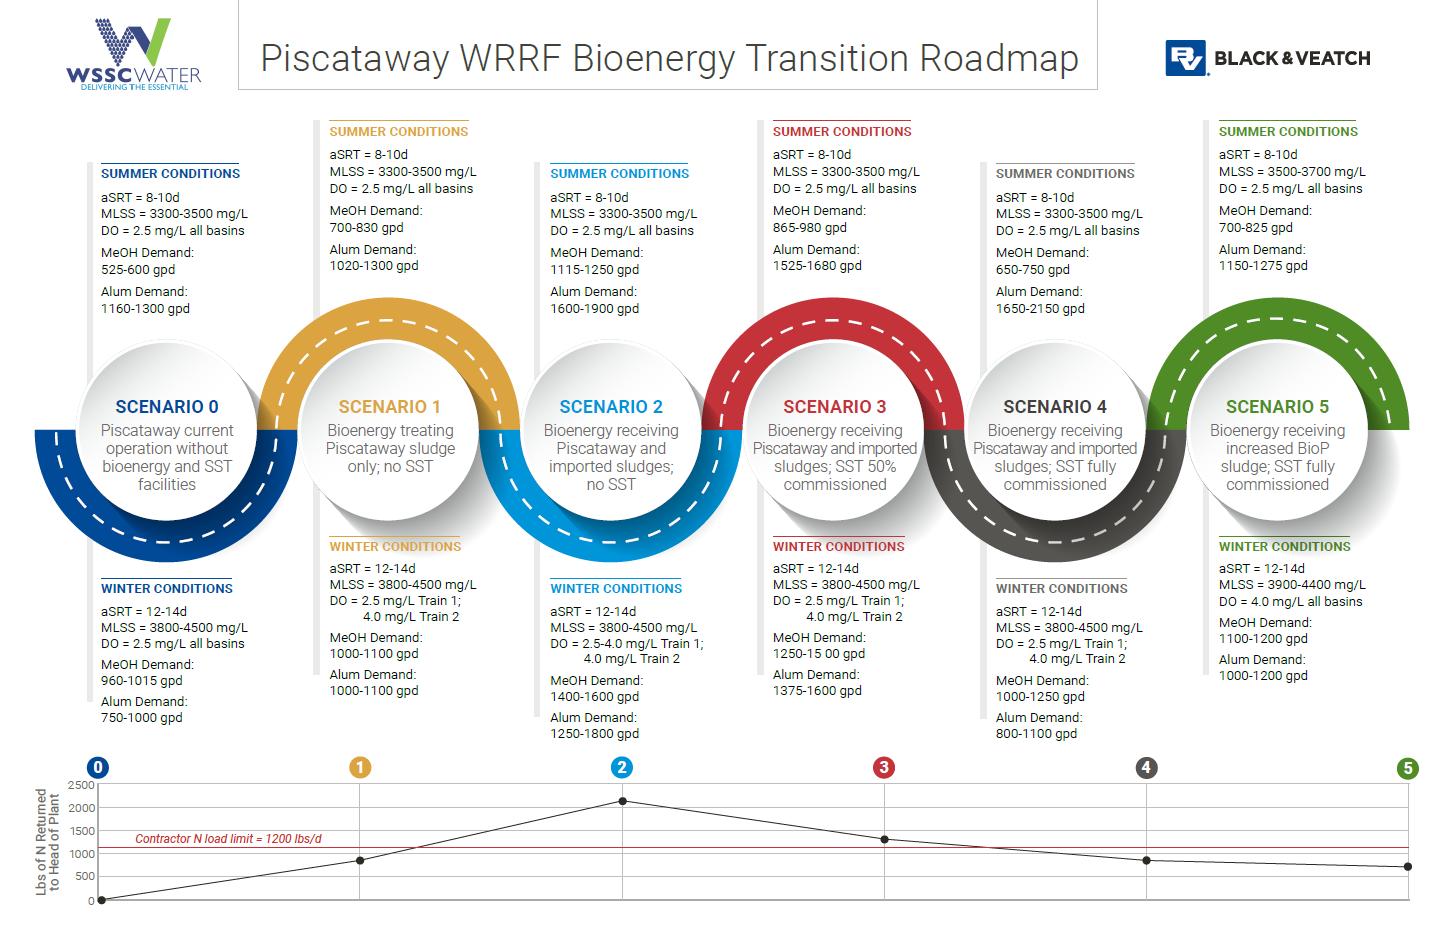
The modeling effort provides a comprehensive understanding of how the new bioenergy system will affect Piscataway WRRF. While the WRRF can meet TN and TP limits under all commissioning scenarios, doing so requires careful control of aSRT, DO, chemical dosing, and clarifier loading. The most significant long-term constraints are winter nitrification capacity and secondary clarifier solids loading. With appropriate operational strategies and potential infrastructure adjustments, Piscataway can successfully transition to full bioenergy operation while maintaining regulatory compliance. The bioenergy transition roadmap, shown in Figure 4, was created to serve as a reference during commissioning activities. S
Figure 4. Bioenergy transition roadmap.
FWEA CHAPTER CORNER
Welcome to the FWEA Chapter Corner! The Member Relations Committee of the Florida Water Environment Association hosts this article to celebrate the success of recent association chapter activities and inform members of upcoming events. To have information included for your chapter, send details to Melody Gonzalez at gonzalezm@bv.com.
FWEA Central Florida Chapter 2025-2026 Event Highlights
The FWEA Central Florida Chapter
sponsorship goal by 12 percent, the chapter emphasized more quality events while providing many opportunities for members
Current and Returning Events
The FY started with our Annual Fishing Tournament, where we got very lucky with great fishing weather in the morning, with thunderstorms brewing just as we finished docking for the day. This year, we began using the revenue from the event to go directly to the University of Central Florida (UCF) Gabe Delneky Scholarship Fund.
We then brought back happy hour events cohosted by local utilities. Brevard County Utilities was able to host a happy hour in Cocoa with us and it resulted in a great turnout, with over 50 attendees. We kept the momentum going by teaming up to raise money for Engineers Without Borders by running a trivia night, which focused on FWEA and water industry facts. This event also had a turnout of over 50 attendees, marking a strong start to the first quarter of the FY.
In September, the chapter held its 25th Annual Scholarship Golf Tournament at Falcons Fire Golf Club. The tournament also had great weather throughout the day
Colten Brickler
Melody Gonzalez
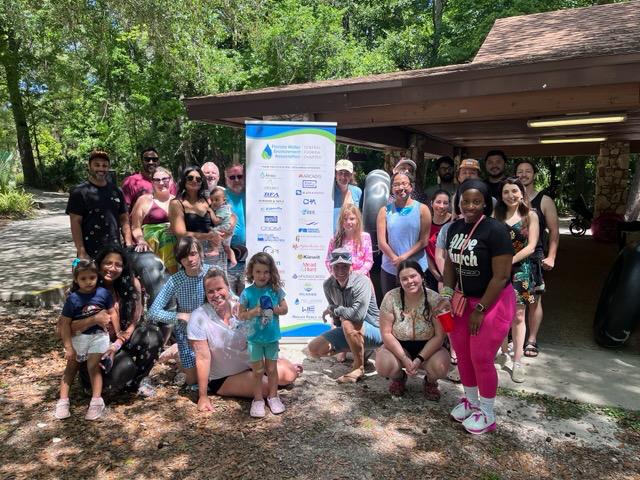
Above: Central Florida Chapter members and their families enjoy a morning at Rock Springs with tubing and a picnic.
Chapter members at a family-friendly networking event at the Burrow Cafe.
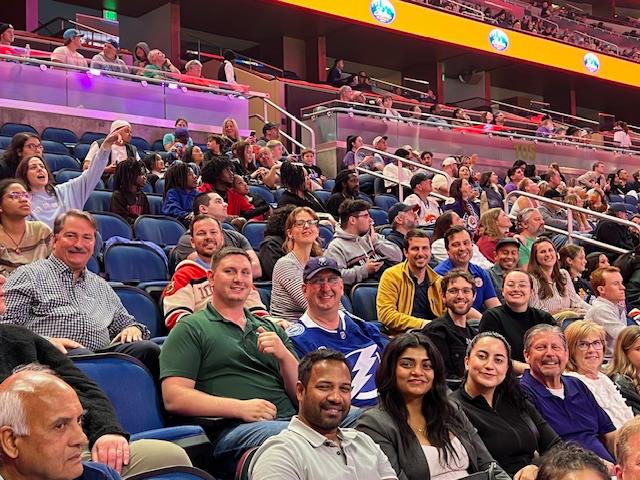
Members of the chapter catch a blowout win by the Orlando Solar Bears.
where we asked what upcoming goals the local utilities are rallying behind. We also brought back our Walk in Their Shoes panel, which focused on the intimate stories of how some of our industry’s women leaders grew in their careers.
Family Events
The chapter then focused on new events by emphasizing more “family-friendly” opportunities for professionals to network while their kids can be supervised and entertained.
We held a tubing event in Rock Springs/ Kelly Park where we spent the morning and afternoon floating through the springs.
We were able to provide a trio of sporting events this year, too. We saw the Orlando Magic win with a buzzer beater by draining a three-pointer with just 0.5 seconds left in the game, and watched a blowout by the Orlando Solar Bears with a strong 5-1 victory. Our luck ran out, however, when we supported the Daytona Tortugas, but they came up short after attempting a comeback.
These events had great turnout from utility members and families alike and are planned to be held in the following FY.
Student Events
Our student engagement also retained high energy by getting students to tour multiple treatment facilities, volunteer to do a beach cleanup at Satellite Beach (over 60 attendees), and team up with multiple student organizations at UCF for a student picnic.
Giving Back
Finally, CFC organized multiple civic events to give back to the community. We teamed up with the Seminole Education, Restorative, and Volunteer (SERV) program to plant aquatic vegetation around Lake Lily and teamed up with City of Maitland to clean up litter around Lake Sybelia. In April, we worked with FSAWWA Region III the weekend of Earth Day to clean up De Leon Springs, and during the holiday season to do a toy drive happy hour, where four boxes of toys were donated to the Toys 4 Tots program.
Overall, CFC was able to provide 30 opportunities to engage by providing quality events and expanding our reach to more operators, parent professionals, and students through networking, friendly competition, and various ways to volunteer.
Colten Brickler, P.E., is a water/wastewater engineer at Kimley-Horn in Daytona Beach. S
What Do You Know About the Pounds Formula? Test Yourself
Charlie Lee Martin Jr., Ph.D.
1. The daily pounds of phosphorus discharged within Lake Okeechobee by the Kings Bay Wastewater System that discharges 205 million gallons per day (mgd) with a total phosphorus concentration of 0.1 mg/l is
a. 514 lbs/day.
b. 171 lbs/day.
c. 1,434 lbs/day.
d. 574 lbs/day.
2. The daily pounds of total nitrogen discharged within Lake Okeechobee by the Okee-Tantie Park Wastewater Treatment Facility that discharges 320 mgd with a total nitrogen concentration of 15 mg/l is
a. 15,012 lbs/day.
b. 40,032 lbs/day.
c. 125 lbs/day.
d. 112 lbs/day.
3. The daily pounds of carbonaceous biochemical oxygen demand (CBOD) received by the MetroDade Central District Wastewater Treatment Plant with an influent flow of 550 mgd and a CBOD concentration of 150 mg/l is
a. 68,880 lbs/day.
b. 6,880 lbs/day.
c. 688,050 lbs/day.
d. none of the above.
4. The daily pounds of total suspended solids (TSS) received by the Metro-Dade South District Wastewater Treatment Plant with an influent flow of 389 mgd and a TSS concentration of 120 mg/l is
a. 1,570 lbs/day.
b. 9,570 lbs/day.
c. 389,311 lbs/day.
d. 38,931 lbs/day.
5. The concentration of 85,700 lbs of CBOD in the 50 mgd of effluent discharged by the North District Regional Wastewater Treatment Plant in the Atlantic Ocean is
a. 206 mg/l.
b. 150 mg/l.
c. 400 mg/l.
d. none of the above.
6. The concentration of 5,947 lbs of TSS in the 45 mgd of effluent discharged by the City of Orlando Wastewater Treatment Plant is
a. 10 mg/l.
b. 5 mg/l.
c. 16 mg/l.
d. none of the above.
7. The concentration of the 15,060 lbs of total nitrogen in the 45 mgd of influent received by the City of Orlando Wastewater Treatment Plant is
a. 5 mg/l.
b. 40 mg/l.
c. 10 mg/l.
d. none of the above.
8. The effluent of flow per day with 500 lbs of total nitrogen at a concentration of 2 mg/l received by the reuse system in St. Petersburg from its Southwest Water Reclamation Facility is
a. 15 mgd. b. 35 mgd.
c. 10 mgd. d. 30 mgd.
9. The effluent of flow per day with 700 lbs of total phosphorus at a concentration of 1 mg/l received by the reuse system in St. Petersburg from its Northeast Wastewater Treatment Plant is
a. 250 million gallons (MG).
b. 84 mgd.
c. 100 MG.
d. none of the above.
10. The influent flow per day with 33,000 lbs of CBOD at a concentration of 100 mg/l received by the Escambia County Wastewater Treatment Plant is
a. 10 mgd. b. 26 mgd.
c. 30 mgd. d. 49 mgd.
Answers on page 54
References used for this quiz: Pounds Formula (Flow MGD X CONC X 8.34 lbs/gal)
Questions
Readers are welcome to submit questions or exercises on water or wastewater treatment plant operations for publication in Test Yourself. Send your question (with the answer) or your exercise (with the solution) by email to: charmartin@msn.com
Operators: Take the CEU Challenge!
Members of the Florida Water and Pollution Control Operators Association (FWPCOA) may earn continuing education units through the CEU Challenge! Answer the questions published on this page, based on articles in this month’s issue. Circle the letter of each correct answer. There is only one correct answer to each question! Answer 80 percent of the questions on any article correctly to earn 0.1 CEU for your license. Retests are available.
This month’s editorial theme is Biosolids and Bioenergy Management. Look above each set of questions to see if it is for water operators (DW), distribution system operators (DS), or wastewater operators (WW). Mail the completed page (or a photocopy) to: Florida Environmental Professionals Training, P.O. Box 33119, Palm Beach Gardens, Fla. 33420-3119, or scan and email a copy to memfwpcoa@gmail.com. Enclose $15 for each set of questions you choose to answer (make checks payable to FWPCOA). You MUST be an FWPCOA member before you can submit your answers!
EARN CEUS BY ANSWERING QUESTIONS FROM PREVIOUS JOURNAL ISSUES! Contact FWPCOA at membership@fwpcoa.org or at 561-840-0340. Articles from past issues can be viewed on the Journal website, www.fwrj.com.
Operational Strategies for Bioenergy Facilities With Strict Nutrient Limits
Lee Kimbell, Chris Andres, Chris deBarbadillo, and Milad Ebrahimi
see page 26 (Article 1: CEU = 0.1WW02015470)
1. What process is used to generate methane in the system?
a. Thermal hydrolysis
b. Aerobic digestion
c. Chemical oxidation
d. Anaerobic digestion
2. Which nitrogen component becomes a major contributor to effluent total nitrogen during full operation?
a. Dissolved organic nitrogen
b. Nitrate
c. Ammonia
d. Nitrite
3. What operational challenge occurs during winter nitrification?
a. Increased phosphorus removal
b. Decreased sludge production
c. Need for higher solids retention time
d. Reduced oxygen demand
4. What chemical is used to support denitrification?
a. Chlorine b. Methanol
c. Lime d. Ferric chloride
5. What condition can lead to clarifier overload at high flows?
a. Low mixed liquor suspended solids (MLSS)
b. High MLSS
c. Low pH
d. Low temperature
A Water Utility’s Path
Toward
Coagulant Switch and Sludge Reduction
Veronica Llaneza and Steve Giordano
see page 16 (Article 2: CEU = 0.1DS/DW02015471)
1. What is the primary goal of the Waterbury Water Treatment Plant project?
a. Increase filtration capacity
b. Reduce sludge production and improve treatment efficiency
c. Expand distribution pipelines
d. Improve customer billing systems
2. What parameter does UVA254 primarily indicate?
a. Chlorine residual
b. Turbidity
c. Dissolved organic matter
d. Iron concentration
3. What is the treated water turbidity goal?
a. < 0.5 nephelometric turbidity units (NTUs)
b. < 1.0 NTUs
c. < 0.2 NTUs
d. < 2.0 NTUs
4. What was the approximate ratio of the aluminum chlorohydrate (ACH) dose compared to alum?
a. Twice as much
c. About one-third
b. The same amount
d. Half
5. What additional benefit does ACH provide in terms of operations?
a. Increased chemical storage requirements
b. Reduced need for lime addition
c. Higher turbidity levels
d. Increased sludge handling complexity
FWEA FOCUS
FWEA Highlights at the Florida Water Resources Conference
David Hernandez President, FWEA
The Florida Water Resources Conference (FWRC) continues to serve as a
development, collaboration, and workforce advancement within Florida’s water sector.
The FWEA is honored to collaborate with FSAWWA and FWPCOA to organize such an incredible conference!
I’d like to use this month’s FWEA column to highlight some of the amazing FWEA events at FWRC.
Student Design Competition
focused events at FWRC is the 2026 FWEA Student Design Competition (SDC), held in conjunction with the conference and designed to promote real-world design experience for students interested in pursuing an education and/or career in water engineering and sciences. This year, the competition brought together six teams from four universities across Florida, competing in either the wastewater or environmental categories, and culminated in live presentations at the conference.
Wastewater Category
The first-place wastewater award was earned by the University of South Florida team, known as Dune Engineering. Team members Alana Ward, Ella Barnes, Mahad Niazi, and Kyle Fitzpatrick presented their project titled, “Plant City Water Reclamation Facility: Sand Filtration Retrofit and Expansion.” The team evaluated three tertiary treatment alternatives: continuous backwash filtration, dual-media anthracite filtration, and cloth media disc filtration. The team evaluated these alternatives against criteria including regulatory compliance, operational reliability, maintenance requirements, and lifecycle cost.
Environmental Category
In the environmental category, Florida Gulf Coast University captured first place with a project presented by Zach Hudson and Carter Baker titled, “Integrated Air Sparging and Soil Vapor Extraction System Design for Remediation of a Petroleum-Impacted Site.” The team developed a site-specific remediation strategy for a Florida Department of Environmental Protection (FDEP) Petroleum Restoration Program site in Miami-Dade County, focusing on subsurface conditions, radius of influence optimization, and regulatory closure considerations. Their solution demonstrated a strong integration of technical analysis with practical implementation
Both first-place teams received the $1,000 Norm Casey Scholarship and will have the opportunity to submit their projects for consideration in the national Student Design Competition at the Water Environment Federation Technical Exhibition and Conference (WEFTEC), to be held this fall in New Orleans. Please join me in congratulating our
Judges at the Student Design Competition.
Ryan Bermingham (left) receives his scholarship from David Hernandez.
David Hernandez presents the scholarship to Jordan Pardo (left).
InFLOW Program and Young Professionals Utility Workers Scholarship Recipients
The continued commitment of FWEA to workforce development was also on display through the InFLOW Program and the Young Professionals (YP) Utility Workers Scholarship.
InFLOW Program
The InFLOW Program is designed to introduce students, particularly those from technical and community colleges, to career paths within the water industry by providing financial support and structured exposure to FWRC programming, including conference sessions and young professionals events.
Young Professionals Utility Workers Scholarship
Complementing the student program, FWEA recognized recipients of the YP Utility Workers Scholarship during FWRC. Among the recipients was Ryan Bermingham, an FDEP-licensed Class C wastewater treatment plant operator at Martin County’s North Jensen Wastewater Treatment Plant. Ryan was
Together, these programs reinforce FWEA’s mission to strengthen the future of Florida’s water workforce by supporting both students entering the field and operators already serving in critical utility roles.
Operations Challenge
The FWEA Operations Challenge once again delivered a high-energy and competitive showcase of operator skills, teamwork, and technical proficiency. The challenge simulates real-world utility scenarios through a series of timed events that test participating teams across multiple operational disciplines.
Known as the “Wastewater Olympics,” the Operations Challenge brings together four-
member utility teams to compete in five timed events that reflect the real-world demands of wastewater operations: process control, maintenance, laboratory, safety, and collection systems. Each team is scored in every event using established criteria, and the combined results determine the overall champion. The regional competition also serves as a pathway for Florida’s top team to advance and represent the state at the national competition during WEFTEC.
Congratulations to all participating teams for their dedication, preparation, and outstanding performance, and special recognition to Polk County for earning top honors this year.
InFlow Program participants.
One of the teams at the Operations Challenge.
Florida Puts an End to Class B Land Application: How SEBA Is Leading Utilities Into the Next Era of Biosolids Management
Megan Ross
Florida has long been a national leader in biosolids management, balancing environmental stewardship, agricultural benefit, and the demands of rapid population growth; however, the regulatory and public-perception landscape surrounding biosolids has shifted significantly in recent years. With the passage of Senate Bill 290 (SB 290) and additional legislation that has passed the House and Senate impacting biosolids management, Florida is entering a new era—one that will fundamentally change how biosolids are managed and will ultimately phase out Class B land application.
In this period of transition, the Southeast Biosolids Association (SEBA) has emerged as a critical voice, engaging with utilities, regulators, and stakeholders to navigate increasingly complex challenges.
The Growth and Influence of SEBA
Founded to provide a regional platform for collaboration, education, and advocacy, SEBA has experienced substantial growth over the past few years. What began as a relatively small network of professionals has evolved into a strong and diverse organization representing utilities, consultants, contractors, regulators, and academic institutions across the southeastern United States.
This growth reflects a rising need for coordinated dialogue around biosolids management, particularly as regulatory pressures intensify, and SEBA has distinguished itself by fostering open communication among stakeholders who often have competing priorities. Through committees and policy discussions, the organization has created a space where science, regulation, and operational realities intersect.
The leadership of SEBA reflects the diversity of the industry it serves, bringing together public utilities, private sector partners, and technical experts.
The current board of directors includes: Officers
President – Megan Ross, Kiewit
Vice President – Tyler Hewitt, AtkinsRealis
Treasurer – Giovanna Forti Portiolli, Charlotte Water
Secretary – Lorrie Rossiter, Orege
Members
Mark Darmanin, Broward County
Glenn Dowling, Denali
Kurt Pfeffer, Hazen and Sawyer
Ahmad Bitar, AECOM
Andrew Hogan, PCL Construction
Shannon Kennedy, Merrell Bros
Scott Trainor, Solid Waste Authority of Palm Beach County
In Florida, SEBA’s role has been especially important. The state’s unique combination of sensitive water bodies, karst geology, and dense population makes biosolids management particularly challenging. SEBA has helped elevate technical understanding while also advocating for practical, science-based solutions that utilities can realistically implement.
Tackling Tough Legislative Challenges
The passage of SB 290 represents one of the most consequential regulatory shifts for biosolids management in Florida in decades. While public discussion has often framed the bill as a broad restriction on land application, the statutory language reveals a more targeted, but ultimately transformative, mandate.
At its core, SB 290 amends Florida Statute 403.0855 to significantly tighten requirements for biosolids land application. The legislation requires that all new or renewed biosolids land application permits only allow the application of Class AA biosolids. This change effectively eliminates the ability to permit new or continuing Class B land application sites under standard regulatory pathways.
The bill establishes clear compliance deadlines. By July 1, 2028, all biosolids land application permits statewide must comply with the Class AA-only requirement. Local governments that land-apply biosolids only within their own county boundaries are granted an extension until July 1, 2031, to meet this requirement.
Importantly, the legislation does not prohibit the generation or transport of Class B biosolids outright; instead, it allows continued transport of Class B material to Class AA treatment facilities or waste-to-energy facilities, including those located in other jurisdictions.
The End of Class B Land Application: Implications
The effective phaseout of Class B land application presents both challenges and opportunities. For decades, land application has been a cornerstone of biosolids management in Florida, offering a beneficial reuse pathway that recycles nutrients and supports agricultural productivity.
Without this option, utilities must pivot toward alternative management strategies, many of which come with significantly higher costs and operational complexities. Advanced treatment to produce Class AA biosolids will become a primary pathway, requiring investments in technologies such as heat drying, composting, or other stabilization processes. While these approaches can produce marketable products, they also introduce new challenges related to product distribution and market demand.
Thermal technologies, including incineration, gasification, and pyrolysis, are gaining attention as long-term solutions. These technologies can reduce biosolids volume and research suggests they can destroy or reduce contaminants, but they require substantial capital investment and face regulatory and public acceptance hurdles.
Landfilling, once viewed as a reliable fallback option, is becoming increasingly difficult to depend on. Utilities across the region are finding that fewer facilities are willing to accept biosolids, and as population growth continues, available landfill capacity is under increasing pressure. While landfill disposal may still play a role in the near term for some utilities, it is unlikely to serve as a sustainable long-term solution for the volume of biosolids currently produced. Regionalization is also likely to play a larger role, particularly for smaller utilities that may lack the resources to develop independent advanced treatment facilities.
Addressing Emerging Contaminants and Public Perception
In addition to nutrient management, biosolids are increasingly scrutinized for the presence of emerging contaminants, particularly per- and polyfluoroalkyl substances (PFAS). While regulatory standards for PFAS in biosolids are still
evolving at the federal level, public concern has already influenced policy decisions and regulatory direction.
In Florida, this issue has further complicated the future of land application. Even in the absence of definitive regulatory thresholds, utilities must contend with uncertainty, evolving science, and potential liability.
Both SEBA and its members have taken a proactive role by prioritizing education and transparency. The organization has hosted technical sessions on PFAS, supported research initiatives, and encouraged open dialogue among utilities, regulators, and the public. By promoting a science-based understanding of risk, SEBA is helping to inform policy decisions and avoid reactionary approaches that could unnecessarily limit viable management options.
Public perception remains a critical factor. Biosolids management often faces opposition driven by concerns over odors, health risks, and environmental impacts. Utilities that invest in proactive communication and community engagement are in a better position to maintain public trust and implement sustainable solutions.
The Future of Biosolids in Florida
As Florida moves forward, the future
of biosolids management will be defined by innovation, collaboration, and adaptability. Utilities will need to invest in treatment processes that produce higher-quality end products and reduce biosolids volume. Resource recovery approaches, combined with regional collaboration, will become increasingly important. Partnerships between utilities and private-sector providers can offer cost efficiencies and greater resilience in a rapidly changing regulatory environment.
Regulations will continue to evolve as new research emerges and public pressure continues to increase. Maintaining flexibility and staying engaged in the rulemaking and legislative process will be critical for utilities and industry organizations alike. Active voices from utilities and education of their legislators has been immensely impactful in shaping legislation.
In this evolving landscape, SEBA is well positioned to remain a leader. Its commitment to education, advocacy, and collaboration will be essential as the industry navigates uncertainty and change.
Conclusion
The passage of SB 290 represents a turning point for biosolids management in Florida. By
requiring a transition to Class AA biosolids for land application, the legislation fundamentally reshapes how utilities approach biosolids handling, treatment, and reuse.
While the effective phaseout of Class B land application presents significant challenges, it also creates opportunities for innovation and advancement. The path forward will require substantial investment, thoughtful planning, and continued collaboration among stakeholders.
The Southeast Biosolids Association has proven to be an invaluable resource during this transition. By bringing together diverse perspectives, promoting science-based decision making, and advocating for practical solutions, SEBA is helping to shape the future of biosolids management in Florida and the broader Southeast.
References
• Florida Senate Bill 290 (2026), Chapter 20263, amendments to Section 403.0855, Florida Statutes, Biosolids Management.
Megan Ross, P.E., Assoc. DBIA®, is business development manager with Kiewit in Tampa and SEBA president. S
Researchers Show a New, Sustainable Way to Remove Toxic Chemicals in Water
Researchers at the University of Birmingham in the United Kingdom have demonstrated a new method to break down toxic pollutants in wastewater using sunlight and molecular-thin catalysts created using an innovative mechanical approach.
Nondegradable dyes originating from industries such as textiles, cosmetics, food, pharmaceuticals, and printing, are among the most prominent sources of industrial pollution. Left untreated, they disperse in both land and water, leading to contamination that poses serious risks to human health and the environment.
Most industries use a combination of techniques to remove these chemicals from wastewater, but dye-polluted water persists. Textile dyes alone are the second-largest contributor to water pollution worldwide; they can contaminate drinking water, disrupt ecosystems, reduce photosynthesis in freshwater and marine plants, and alter the life cycles of fish and other aquatic animals.
Photocatalysis, which uses a
light-activated catalyst to accelerate decomposition, has shown promise as a sustainable method for breaking down these harmful pollutants; however, largescale manufacture of suitable catalysts that can be activated by sunlight has proved challenging, and current methods use toxic solvents, which creates a further waste stream to deal with.
Dr. Jason Stafford, from the department of mechanical engineering at the Birmingham Centre for Mechanochemistry and Mechanical Processing, collaborated with researchers specializing in analytical chemistry and biosciences to demonstrate that catalysts produced by a novel, waterbased mechanical method can degrade pollutants, including those containing the tough-to-break carbon-fluorine bonds that are in many sources of persistent pollution.
The method uses high-intensity turbulent shear stresses to exfoliate molecular-thin sheets of material and also assemble them into heterostructures, which are made of two semiconductor materials, with bespoke photoelectronic properties.
The most recent work shows it can be used to significantly enhance photocatalytic performance in under 90 minutes without using toxic chemicals.
The manufactured catalysts are comprised of ultra-thin layers of the raw material and atomic edge creation, increasing the surface area on which the chemical decomposition reaction takes place. This simultaneously preserves the electronic structure of the material and maintains the charge generation and transport, which are essential for the catalyst to work.
The study demonstrated these sustainably produced 2D catalysts increased the degradation performance on the model pollutants by up to 2.5 times, compared to the bulk raw material. Notably, the process rapidly achieves these levels of performance after only 10 minutes of mechanical treatment.
A method for the mechanical synthesis of materials is the subject of a patent application submitted by University of Birmingham Enterprise. S
Orlando World Marriott
8701 World Center Dr. Orlando, FL 32821
West Palm Beach Convention Center 650 Okeechobee Blvd, West Palm Beach, FL 33401
Daytona Beach Ocean Center 101 N Atlantic Ave., Daytona Beach, FL 32118
Orlando World Marriott
8701 World Center Dr. Orlando, FL 32821
West Palm Beach Convention Center 650 Okeechobee Blvd, West Palm Beach, FL 33401
Collaboration is the Backbone of Successful Water and Wastewater Projects
Martin Gonzalez
Across the construction industry, and from firsthand experience in the water and wastewater sector, projects are becoming more complex with every passing year. Aging infrastructure, expanding regulatory requirements, evolving treatment technologies, and heightened expectations for reliability are all placing greater demands on project teams. At the same time, facilities are often being constructed or expanded while existing systems remain in operation, adding additional complexity. In this environment, project success depends on more than technical expertise or well-prepared drawings; it requires strong, consistent collaboration from the owner, the design team, and the general contractor. The relationship among these entities forms the backbone of any successful project. Regardless of whether the project is delivered through design-bid-build, construction manager at risk (CMAR), or design-build, a culture of collaboration and shared problem solving is critical. While each delivery method structures these relationships differently, the underlying principle remains the same: The earlier and more effectively the project team works together, the better the outcome.
The Collaborative Challenge of Design-Bid-Build Projects
Hard bid remains one of the most common delivery methods in municipal water and wastewater construction. Because the contractor enters the process after the design is complete, this delivery method has potential to create an unintended adversarial mentality where team members operate in separate lanes and challenges are treated as contractual disputes. Even on design-bid-build projects, success depends on the project team’s ability to move beyond that adversarial framework and approach challenges collaboratively. When unforeseen conditions arise, the most effective teams focus less on assigning fault and more on developing the best technical solution.
A good example of this occurred recently on the Eastern Water Reclamation Facility Phase 6A expansion project. During construction, the project team encountered significant utility conflicts that required the relocation of a critical motorized 42-inch ball valve. The original location conflicted with existing underground utilities that could not be relocated and were not fully apparent during the design phase, making the planned installation infeasible.
Relocating a valve of that size within a treatment facility is not a simple adjustment. The change required coordinated redesign across multiple disciplines, including structural
modifications to supporting infrastructure, mechanical revisions to process piping, and associated electrical and controls changes.
With a traditional construction approach, a situation like this could quickly become contentious, with each party focused on protecting contractual positions. Instead, the owner, engineer, and construction team approached the issue collaboratively. Field observations were shared openly, alternatives were evaluated together, and the design team worked closely with the contractor to develop a practical relocation that could be constructed efficiently while preserving functionality.
Equally important was the level of transparency throughout the process. Because all stakeholders were engaged in developing the solution, there was a shared understanding of the technical challenges involved and the scope of the modifications required. This shared perspective made the change order process smoother than it might otherwise have been. Rather than debating the necessity of the work, the conversation focused on how best to implement the solution and move the project forward.
Construction Manager at Risk: Collaboration by Design
The CMAR takes a more proactive approach to collaboration by bringing the contractor into the project earlier in the process. For complex water and wastewater facilities, this early involvement is invaluable. Treatment plants often contain complex piping networks, specialized process equipment, and significant electrical and instrumentation components. Small design decisions can have large impacts on construction sequencing, maintenance considerations, and long-term operability.
An example of the importance of collaboration in CMAR is a project at the Toho Reservoir Surface Water Treatment Facility, which will deliver advanced ceramic membrane filtration water treatment. Projects that incorporate emerging treatment technologies like ceramic membrane filtration often carry a higher level of design complexity, as the process systems, mechanical equipment, structural components, and controls architecture must all integrate seamlessly.
Daytona Westside Water Reclamation Facility headworks and influent pump station.
As construction progressed on the facility, the project team encountered several instances where the design needed to be refined or adjusted to address real-world conditions, optimize equipment layout, or better align with the owner’s long-term operational goals. Rather than viewing these adjustments as disruptions, the CMAR framework allows the owner, engineer, and contractor to work through the redesign process together. Working through these changes collaboratively allows the team to evaluate impacts across the entire facility and to jointly make decisions that are in the best interest of the project—not one party.
Equally important is maintaining alignment with the owner’s expectations. Treatment facilities of this scale represent major long-term investments, and operational considerations, such as maintenance accessibility, operational flexibility, plant expansion, and system reliability, must remain central to the design. Through ongoing collaboration, the owner is able to remain actively engaged in decision making while engineers and contractors provide technical and practical insight into how those decisions affect construction and long-term operation.
This collaborative process is also critical to maintaining schedule commitments. When design refinements occur in isolation, they can easily create downstream delays in procurement, installation sequencing, or commissioning activities. By addressing these issues collectively and early, the team can adjust the construction plan in parallel with design updates, allowing the project to continue progressing efficiently.
Design-Build: Integrating Design and Construction
Design-build represents the most integrated form of collaboration among the three main delivery methods. Because the contractor and designer work side by side, constructability considerations become part of the design process, rather than a postdesign review. Equipment procurement strategies, site logistics, and construction sequencing can be incorporated directly into the design approach.
A recent design-build that highlights the value of this collaborative model is the headworks and influent pump station project at the Daytona Westside Water Reclamation Facility. From design, through startup and commissioning, the project team relied heavily on open communication and shared
Other views of the facility.
problem solving between the owner and design builder.
One of the most significant collaborative efforts involved a major instrumentation and controls redesign that emerged at the start of construction. As the design was finalized, the owner also finalized changes to the supervisory control and data acquisition standards and wanted them to be implemented on the project. This update required a shift in the design of the instrumentation and control (I&C) architecture to state-of-theart technology. Rather than allowing the issue to become a disruptive redesign, the project team members worked together to quickly evaluate changes and coordinate among the controls integrator, equipment manufacturers, and contracting teams to develop a revised solution. The collaborative approach allowed the team to implement the revised I&C design with minimal cost impacts, and more importantly, no schedule impacts to the overall project.
Another example of collaboration occurred during startup and commissioning of the new headworks and influent pump station. As the team prepared to bring the new facility online, commissioning challenges arose due to the unexpected accumulation of solids within the owner’s existing force main. The buildup created concerns about system reliability and performance during the critical transition period.
Plant operators and the design builder worked side by side to evaluate the conditions in real time and develop an approach to manage the accumulated sludge while maintaining system stability. Through coordinated planning, careful sequencing, and constant communication among all parties, commissioning was successfully executed. The new headworks facility was brought online, the existing headworks was taken offline, and the startup was completed without operational disruptions.
Experiences like this reinforce the true
value of the design-build model. While the delivery method provides the contractual framework, it is the collaborative culture among the owner, engineer, and contractor that ultimately enables teams to respond effectively to challenges that inevitably arise during complex infrastructure projects.
A Shared Commitment to Project Success
While design-bid-build, CMAR, and design-build differ in structure, they all rely on the same fundamentals: trust, communication, and mutual respect. The most effective teams recognize that each participant brings unique expertise to the table, such as:
S Owners understand the operational and community needs the facility must serve.
S Engineers bring technical design expertise and regulatory knowledge.
S Contractors contribute practical construction experience and an understanding of how complex facilities come together in the field.
When all of these perspectives are shared openly, the entire project benefits.
In an industry where projects are often constrained by tight budgets, aging infrastructure, and growing regulatory requirements, collaboration is not simply a professional courtesy—it is a necessity. By fostering strong relationships across the project team and encouraging early, honest dialogue, facilities can meet the needs of their communities today while standing ready to serve them for decades to come.
If you are interested in learning more about the Contractors Council or would like to request support, please visit the FSAWWA website at www.fsawwa.org.
Martin Gonzalez, is senior project manager at Wharton-Smith Inc. in Orlando. S
Unlocking the Potential of Publicly Owned Treatment Works: Generating Renewable Energy and Maximizing Its Value
Jeff VanVoorhis, Jim Postiglione, and John Dinneen
Codigestion of high-strength waste (HSW) with biosolids from municipal wastewater treatment facilities (WWTFs) can be a significant revenue source through tipping fees and biogas modernization. Review of a dated data file from the Florida Department of Environmental Protection (2014 update) indicates that approximately 20 WWTFs in the state have anaerobic digesters and about 60 percent utilized the generated biogas.
Examples of codigestion in Florida include:
S Pinellas County South Cross Bayou Water Reclamation Facility - Codigestion of fats, oils, and grease (FOG) since 2008 1 S Orlando, Reedy Creek Improvement District Wastewater Treatment PlantCodigestion of FOG and source-separated food waste 2
Adding HSW to the anaerobic digestion process can utilize excess system capacity, and in some cases, divert HSW from the plant service area directly to the anaerobic digesters (AD), reducing the load on the WWTFs. Sources of HSW can also be obtained from commercial or industrial operations outside the service area.
Planning for the addition of HSW should consider many factors, including AD system capacity, the type and amount of HSW available, HSW storage and pretreatment needs, improvements to AD monitoring, additional
processing of digestate, estimating increased biogas production, biogas storage and treatment, and selecting the biogas use with the best return on investment: heat, combined heat and power, or sale of renewable natural gas (RNG).
This article discusses these planning factors, as well as the funding mechanisms available to support codigestion biogas projects.
High-Strength Waste Screening Assessment
A screening assessment is necessary to evaluate the availability and characteristics of HSW near a WWTF. Examples of potential HSW are shown in Table 1, along with the relative strength measured in chemical oxygen demand (COD). Other important factors to consider include pH, nutrient content, potential inhibitory substances, and physical properties. The concentrations of nitrogen (N), phosphorus (P), and sulfur (S) should be evaluated to assess potential impacts, such as additional loads from digestate recycling, P mineral precipitation or scaling, and biogas treatment needs. Physical properties, like COD, solids content, aqueous solubility/miscibility, and temperature, will help determine the plant’s requirements for receiving, storage, and pretreatment. Waste rich in carbon (C) and energy, such as FOG from grease trap cleaning, is a common HSW; however, FOG may require a concentration step and heated storage. Possible sources for HSW include local
Jeff VanVoorhis is vice president of EPC project delivery, Jim Postigline is senior process engineer, and John Dinneen is wasteto-energy project developer at Mead & Hunt Inc. in Milwaukee, Wis.
food manufacturers, waste brokers, and thirdparty service providers that support anaerobic digestion operations by supplying onsite maceration and storage systems for food waste at grocery stores, hotels, and other facilities. Other factors in screening HSW include:
S The HSW availability, cost/revenue, and tipping fees (where feasible) can be a significant source of revenue. Project economics should also consider potential energy and maintenance savings from diverting waste from WWTF influent directly to the digesters.
S Storage and pretreatment requirements may include mixing, heating, or a grinding or macerating step. Using off-spec food waste requires depackaging equipment.
S Digester feed carbon-to-nitrogen (C:N) ratio is important. The HSW with low C:N and high protein content may create ammonia inhibition in the digester, and the additional digestate N generated may require pretreatment before being recycled to the head of the plant. Maintaining a combined feed near 20:1 C:N is recommended.
S Reaction speed should be considered for fast-reacting HSW containing soluble sugars, alcohol, glycerin, or other readily digestible organics. These fast-to-digester substrates require controlled addition and increased monitoring to prevent upset from the production of excess volatile fatty acids (VFA). Converting to a two-phase digester system may offer better control with highloading, fast-reacting HSW.
S Testing HSW is recommended to measure biogas generation potential and digester toxicity; best management practices testing
Continued on page
Table 1. Common High-Strength Waster and Relative Strength
and anaerobic toxicity assays are also recommended.
Codigestion Capacity Assessment
After HSW sources are screened, the design and capacity of the existing anaerobic digestion system must be assessed. Organic loading rate (OLR) and hydraulic detention time (HRT) are commonly used to evaluate digester capacity. Standard OLR values recommended for digesting municipal biosolids are listed in Table 2, and Table 3 presents volatile solids (VS) removal versus HRT. Codigestion studies at bench and full scale have shown that digester systems with added HSW can operate at significantly higher loadings than those listed in Table 2. The HSW addition at rates twice the control COD loading has resulted in biogas production exceeding double that of the control, with OLRs exceeding 5 kg/m3-d 1,10 The increased VS destruction and biogas output demonstrate the potential synergy of codigestion. The biosolids stream can supply macro- and micronutrients and heightened activity of the digester biology can increase biosolids VS destruction. As HSW addition ramps up, the bacteria population in the digester also grows, enabling a higher COD loading without causing an upset. A specific energy loading rate (SELR) has been used to look at digester capacity and stability by dividing the OLR by the digester biomass. When VS represents digester biomass, the units of SELR are gCOD/d per gVS and stable operation has been observed at SELR below 0.5 11 .
Bench or pilot studies are recommended to plan for adding HSW to measure digester capacity, reactivity, and biogas potential. Simulation models can also be helpful in assessing these parameters, as well as assessing P mineral precipitation, increases in sludge generation, biogas sulfide concentration, and future nutrient loading to the liquid treatment from digestate. Codigestion projects can be designed to include nutrient recovery (Struvite) and/or N removal systems (Anammox) 1 to handle the increased nutrient loads.
Monitoring Codigestion Systems
Planning for the addition of HSW to the digester system should include recommendations for additional monitoring to ensure optimal operation. Routine testing of HSW feeds helps track OLR, nutrient loading, and C:N ratio. The frequency and parameters for HSW monitoring will depend on the type and variability of HSW. Monitoring the digester system is essential for achieving stable high VS conversion to biogas. In addition to standard tracking of digester feed flow, temperature, and bigas flows, it is important to monitor digester pH, VFA, alkalinity, total
solids, VS, soluble P, total P, and ammonia. Biogas monitoring should include flow (standard cubic ft per minute), methane concentration, and hydrogen sulfide concentration. Depending on biogas use, it may also be necessary to measure siloxane concentration. As the digester system loading increases, especially when fast-reacting HSW is added, it is helpful to monitor the VFA/alkalinity ratio to avoid VFA inhibition of methanogenesis. The VFA/alkalinity ratios greater than 0.1 indicate potential instability in the digester 1 .
Biogas Project Funding
Funding mechanisms are crucial for the financial success of biogas projects at publicly owned treatment works (POTWs). Key drivers include renewable portfolio standards, renewable identification number (RIN) credits, Renewable Fuel Standards (RFS), incentives such as the Production Tax Credit (PTC), and provisions from the Inflation Reduction Act. These programs can significantly enhance the economics of both RNG and combined heat and power (CHP) biogas projects.
Case studies from operational facilities demonstrate how POTWs have leveraged these incentives to advance implementation. For example, a 72-mil-gal-per-day POTW anaerobic-digester-to-compressed-natural-gas project using RFS and PTC makes the project financially viable by improving cash flow, offsetting capital costs, and reducing financial risk over the project life cycle.
Additionally, there has been a trend toward public-private partnerships (P3s) in recent years, where private partners can utilize available tax incentives and alternative financing structures, while public entities benefit from reduced upfront costs and increased long-term operational certainty.
Biogas Utilization: Renewable Natural Gas or Combined Heat and Power?
options for biogas use: RNG and CHP. The RNG projects involve upgrading raw biogas using technologies such as water washing, amine scrubbing, pressure swing adsorption, membrane separation, or cryogenic distillation, followed by delivery to a utility natural gas pipeline or other compressed natural gas vehicle fuel end use. Examples of operating facilities show how they assess capital costs, biogas quality, and upgrading requirements to ensure successful RNG implementation. By comparison, CHP projects focus on onsite energy recovery through the utilization of biogas to generate electricity while also capturing the heat generated during this process. Benefits can include offsetting facility electrical demand, maintaining POTW operations during utility outages through island-mode capability, and capturing thermal energy for digester heating and other process needs. In some cases, facilities may also pursue net metering opportunities by sending electricity onto the utility grid, further improving overall project value.
Project Delivery and Contracting
Biogas projects at POTWs are increasingly being delivered through nontraditional project delivery methods, such as design-build and P3s. Examples of implementation demonstrate how alternative methods can streamline project execution, align incentives across stakeholders, and support successful long-term outcomes for complex biogas utilization projects.
For P3s arrangements, a revenue share or guaranteed annual payment is offered to the municipality in exchange for the biogas produced. A typical contract structure requires no capital investment from the municipality for the upgrades needed to implement the project, and the private entity usually owns and operates the biogas utilization equipment. Risk and exposure to potentially volatile credit prices can be divided based on the municipality’s preferences and desired revenue share, but, in general, most of the risk lies with the P3s partner.
Table 2. Recommended Organic Loading Rate for Municipal Biosolids Digesters
Table 3. Volatile Solids Removal Versus Hydraulic Detention Time for Municipal Biosolids Digesters 9
Emerging Trends and Considerations
As biogas utilization continues to evolve, POTWs are monitoring several emerging trends that can influence project value and long-term strategy. These include changes in renewable fuel credit pathways, such as distinctions between D5 and D3 RIN generating feed sources, which can affect the economics of RNG projects. Recent rulings allow codigestion projects to apportion their biogas RINs based on the percentage generated from biosolids (the more lucrative D3 RIN) versus codigestion (the less lucrative D5 RIN). Facilities are also exploring opportunities to integrate multiple renewable technologies, including pairing RNG with solar generation in microgrid configurations to enhance resiliency and optimize overall energy portfolios.
Taken together, these considerations emphasize a growing focus on flexible, integrated methods that allow POTWs to maximize their biogas resources, evaluate
various renewable energy options, and align project development with available incentives and long-term operational goals. Ultimately, success starts with clarity. Municipalities can unlock the full potential of their POTWs by beginning with a feasibility study that assesses digester capacity, viable feedstock, revenue opportunities, capital costs, and financial arrangements, including P3s or self-owned models.
References
1. The Anaerobic Biodegradability of Municipal Sludge, Fat, Oil, and Grease at Mesophilic Conditions. John C Kabouris, Water Environment Research, Vol 80 No. 3, pp 212-220.
2. Codigestion in Central Florida. Meredith Sorensen, Biocycle, March/April 2014.
3. Effect of High-Strength Food Wastes on Anaerobic Codigestion of Sewage Sludge. Ramola Vaidya, Water Environment Research, pp 293-306, April 2018.
4. Municipal Anaerobic Digesters for Codigestion, Energy Recovery, and Greenhouse Gas Reductions, Daniel H. Zitomer, Water Environment Research, Volume 80 No. 3, pp 229-237, March 2008.
5. Monitoring data from off-spec beverage management company, 2025.
6. Grind-to-energy presentation, system overview, and analytical data.
7. WEF/ASCE, Design of Water Resource Recovery Facilities, 6th Edition, WEF Manual of Practice No. 8, McGraw-Hill, 2018.
8. Recommended Standards for Wastewater Facilities. 10 State Standards, 1997 Edition.
9. Metcalf & Eddy Inc. Wastewater Engineering Treatment and Reuse, McGraw-Hill, 2003.
10. Effect of Food Waste Codigestion on Digestion Dewatering and Cake Quality, Matthew Higgins, Water Environment Research, January 2017.
11. Codigestion Research Builds Facility Operator Confidence. David L. Parry, Biocycle, May 2013. S
EPA Recognizes Excellence and Innovation in Florida Water Infrastructure Project
The U.S. Environmental Protection Agency (EPA) recently recognized 48 water infrastructure projects for excellence and innovation, including two awards for the American Beach Water and Sewer District (district) in Nassau County. These projects, financed in part by state revolving fund (SRF) programs, demonstrate the importance of water infrastructure for supporting Americans’ health and laying a foundation for economic prosperity.
“Across the country, states are putting SRF resources to work in ways that deliver real, lasting benefits for communities by modernizing aging systems, strengthening resilience, and ensuring families can rely on safe, clean water every day,” said Jessica Kramer, EPA assistant administrator for water. “These projects show that when we pair federal investment with state leadership, we can protect human health, support local economies, and reach communities that have too often been left behind.”
“These awards prove that smaller communities can execute big ideas when it comes to improving water infrastructure,” said Kevin McOmber, EPA regional administrator. “I am thrilled to see commu-
nities utilizing SRF programs to strengthen their water utilities for the protection of human health and the environment.”
The Clean Water State Revolving Fund (CWSRF) and Drinking Water State Revolving Fund (DWSRF) programs have provided a foundation of federal investment in water infrastructure for decades. The SRF programs directly support EPA’s Powering the Great American Comeback Initiative, which emphasizes the need for clean air, land, and water for every American and the importance of cooperative federalism.
The EPA AQUARIUS program celebrates drinking water projects, financed in part by the DWSRFs, that are innovative, resilient, and protective of public health. Twenty-two projects carried out by state or local governments and drinking water utilities were recognized by the 2026 AQUARIUS program.
In partnership with Nassau County, the district used a $1.32 million DWSRF loan, plus two federal grants, as well as state and local funding, to build a centralized water and wastewater service that allowed it to deliver reliable, affordable drinking
water and retire failing wells and septic systems.
The EPA George F. Ames PISCES program celebrates innovation demonstrated by wastewater and stormwater projects financed by CWSRF programs. Twenty-six projects carried out by state or local governments, public utilities, and private entities were recognized by the 2026 PISCES program, including the Community Engagement Award for the district.
See the full lists of recognized projects and learn more about the AQUARIUS and PISCES programs at www.epa.gov. S
C FACTOR
Biosolids, Volunteering, and the Road Less Traveled
Kevin Shopshire President, FWPCOA
“Two roads diverged in a wood, and I—I took the one less traveled by, and that has made all
This time of year is a busy one in my world. The organizations I am involved with hold conferences, trainings, workshops, youth tournaments (soccer), etc. Right now, I’m trying to get my professional feet back under me after coaching a youth soccer team two days in the hot Florida sun, and then presiding over an organization’s semiannual training and workshop on the opposite side of the state for a couple of days.
I just returned from presiding over one such workshop for the Florida Industrial Pretreatment Association (FIPA) in Sarasota Beach. Getting there and back utilized one of my lesser-enjoyed technologies, artificial intelligence (AI). Online mapping is one of the only places I accept AI’s
assistance. I enter the destination, then select “avoid tolls.” I know, I can do this myself. I’m old enough to even have a paper map book in my dashboard compartment, and my grandmother trained me to memorize city names as I passed through them. Regardless, this “avoid tolls” selection has repeatedly sent me on some nice, scenic drives across the state, sometimes down “roads” that had me rechecking my route. More often than not, my drive down the “road less traveled” has me arriving in less time than the predicted time for the other, crowded-traffic, toll-highway route.
Accepting the Call
You all have chosen me to lead a couple of organizations: FWPCOA and FIPA. These are positions that were asked of me. Those of you who know me, you know that I will make efforts to help where help is needed. I do not do it for my benefit, as these positions are volunteer, but because there is a need.
Accepting nominations and volunteer duties seems to be the “road less traveled” these days. We’re all busy, I get that. Our volunteer organizations need help. More and more, we end up paying individuals to do jobs that were previously done by volunteers. Our lack of time to volunteer is driving up costs in an already expensive world.
Some organizations that cannot afford to pay individuals are falling behind. We need you to accept the call when we nominate you to fill a volunteer position; not only in FWPCOA, but any volunteer organization. You’d be surprised to find out that you actually do have time to “drive the route without tolls” to help an organization, and take the road less traveled.
Writing these columns in my own style is also a road less traveled. I’m sure some of you have looked back and said “What the heck does this have to do with the magazine’s theme?”
This month, it’s biosolids, so now I’ll address it.
Biosolids: Where Do They Go?
If you’re in the “biz” you are well aware that our ever-increasing population is creating ever-increasing biosolids. Some politicians in Tallahassee feel we can make this byproduct of population growth magically disappear. In my across-Florida drive, I passed many sites that I know are land-application sites for such biosolids. This byproduct is being used in a beneficial manner; however, with our population increase, these lands are wanted for city expansions, and some politicians don’t want this in their future backyards. What are we supposed to do?
Politicians don’t give suggestions or assistance, just regulatory demands. It’s up to us, in our career fields, to find the answer. I am not trained in biosolids, but I’ve seen many interesting answers to this situation over the years being tested in many interesting ways.
Open lands are disappearing and landfills are filling. We need to encourage and support those researching the answers to this need.
Where do your biosolids go? How long will they continue to go there? We don’t want to wait until the “crap hits the fan”—literally!
Let’s take the road less traveled and help find an answer.
FWPCOA
Committee Spotlight: Florida Water Resources Conference Committee
This committee includes several FWPCOA trustees: Glenn Whitcomb, Scott Ruhland, and myself; as well as committee members Patrick Murphy, Al Monteleone, Bob Case, and Mike Darrow.
The committee is responsible for working hand in hand with our sister organizations, FSAWWA and FWEA, to set up the annual FWRC. We just finished this year’s conference in Daytona Beach, and I must say, it seemed
very successful. I don’t have final numbers yet, but I know we had over 3,100 attendees and approximately 484 vendors. It was a wonderful training and networking opportunity for several days! S
C L A S S I F I E D S
CLASSIFIED ADVERTISING RATES - Classified ads are $22 per line for a 60 character line (including spaces and punctuation), $60 minimum. The price includes publication in both the magazine and our Web site. Short positions wanted ads are run one time for no charge and are subject to editing. ads@fwrj.com
POSITIONS AVAILABLE
Chief Utilities Treatment Plant Operator
$71,970 - $101,269/yr.
Utilities Treatment Plant Operator II
$62,171 - $87,479/yr.
Utilities Treatment Plant Trainee or Operator I
$53,705 - $86,314/yr. Heavy Equipment Operator
$53,705 - $75,567/yr.
Utilities System Operator Trainee, I, II, or III
$44,184 - $75,567/yr.
Utilities Treatment Plants Mechanic I
$51,148 - $71,970/yr.
Lift Station Operator II
$62,170 - $87,478/yr.
Lift Station Operator I
$53,705 - $75,567/yr.
Apply Online At: http://pompanobeachfl.gov
Open until filled
NOW HIRING!
Water & Wastewater Positions
• Utilities Director
• Operations Manager
• Utilities Maintenance Supervisor
• Plant Operator I -II
Apply Online Today! -www.davie-fl.gov
Full-time, Part-time or Temporary Work Opportunities!
Woodard & Curran supports utilities that need experienced water/ wastewater treatment operators and maintenance professionals throughout Florida and the rest of the country.
W&C wants to find you a job that works with your schedule! We even have short-term roles that let you mentor younger operators, stay engaged and make an impact – and only when it works for you…No commitment – travel covered – You decide when (or if) you say yes!
Interested in learning more about these opportunities or being added to our operator database? Please reach out to Lizzie Dovich to learn more! Ldovich@woodardcurran.com or 207-558-3906. https://www.woodardcurran.com/careers/
Test Yourself Answer Key
Editorial Calendar
January
February
March
Environmental Stewardship
April ....................Water Conservation and Reuse
May .....................Operations and Utilities Management
June ....................Biosolids Management and Bioenergy Production
July .....................Stormwater Management; Emerging Technologies
August ................Disinfection; Water Quality
September..........Emerging Issues; Water Resources Management
October ..............New Facilities, Expansions, and Upgrades
November...........Water Treatment
December ...........Distribution and Collection
Technical articles are usually scheduled several months in advance and are due 60 days before the issue month (for example, January 1 for the March issue).
The closing date for display ad and directory card reservations, notices, announcements, upcoming events, and everything else including classified ads, is 30 days before the issue month (for example, September 1 for the October issue).
For further information on submittal requirements, guidelines for writers, advertising rates and conditions, and ad dimensions, as well as the most recent notices, announcements, and classified advertisements, go to www.fwrj.com or call 352-241-6006. Januar y 2016 Januar 2016
Continued from page 33
1. B) 171 lbs/day.
The daily pounds of phosphorus discharged within Lake Okeechobee by the Kings Bay Wastewater System that discharges 205 mgd with a total phosphorus concentration of 0.1 mg/l is 171 lbs/day.
2. B) 40,032 lbs/day.
The daily pounds of total nitrogen discharged within the Lake Okeechobee by the OkeeTantie Park Wastewater Treatment Facility that discharges 320 mgd with a total nitrogen concentration of 15 mg/l is 40,032 lbs/day.
3. C) 688,050 lbs/day.
The daily pounds of CBOD received by the Metro-Dade Central District Wastewater Treatment Plant with an influent flow of 550 mgd and a CBOD concentration of 150 mg/l is 688,050 lbs/day.
4. C) 389,311 lbs/day.
The daily pounds of TSS received by the MetroDade South District Wastewater Treatment Plant with an influent flow of 389 mgd and a TSS concentration of 120 mg/l is 389,311 lbs/ day.
5. A) 206 mg/l.
The concentration of 85,700 lbs of CBOD in the 50 mgd of effluent discharged by the North District Regional Wastewater Treatment Plant in the Atlantic Ocean is 206 mg/l.
6. C) 16 mg/l.
The concentration of 5,947 lbs of TSS in the 45 mgd of effluent discharged by the City of Orlando Wastewater Treatment Plant is 16 mg/l.
7. B) 40 mg/l.
The concentration of the 15,060 lbs total nitrogen in the 45 mgd of influent received by the City of Orlando Wastewater Treatment Plant is 40 mg/l.
8. D) 30 mgd.
The effluent of flow per day with 500 lbs of total nitrogen at a concentration of 2 mg/l received by the reuse system in St. Petersburgh from its Southwest Water Reclamation Facility is 30 mgd.
9. B) 84 mgd.
The effluent of flow per day with 700 lbs of total phosphorus at a concentration of 1 mg/l received by the reuse system in St. Petersburgh from its Northeast Wastewater Treatment Plant is 84 mgd.
10. D) 49 mgd.
The influent flow per day with 33,000 lbs of CBOD at a concentration of 100 mg/l received by the Escambia County Wastewater Treatment Plant is 49 mgd.
Biosolids Volume Reduction
Creating Reuse Opportunities
Veolia offers biosolids technologies focused on performance enhancement, renewable energy, beneficial reuse, and the reduction of sludge.
The BioCon™ thermal sludge drying system can reduce the weight and volume of sludge, lowering hauling costs significantly. In addition, the BioCon™ dryer provides beneficial reuse for dried sludge by meeting Class A requirements.
With the addition of the ERS (Energy Recovery System), a biomass gasifier, to the BioCon™, the excess heat from the ERS can be beneficially used for heating the dryer process, and further volume reduction of the sludge.
BioCon™ is exclusively represented in Florida by MTS Environmental.