Business Office: 1402 Emerald Lakes Drive, Clermont, FL 34711
Web: www.fwrj.com
General Manager: Michael Delaney
Editor: Rick Harmon
Graphic Design Manager: Patrick Delaney
Mailing Coordinator: Buena Vista Publishing
Published by BUENA VISTA PUBLISHING for Florida Water Resources Journal Inc.
President: Richard Anderson (FSAWWA) Peace River Manasota Regional Water Supply Authority
Vice President: Joe Paterniti (FWEA) Clay County Utility Authority
Treasurer: Rim Bishop (FWPCOA) Seacoast Utility Authority
Secretary: Rim Bishop (FWPCOA) Seacoast Utility Authority
Moving?
The Post Office will not forward your magazine. Do not count on getting the Journal unless you notify us directly of address changes by the 15th of the month preceding the month of issue. Please do not telephone address changes. Email changes to changes@fwrj.com or mail to Florida Water Resources Journal, 1402 Emerald Lakes Drive, Clermont, FL 34711
Membership Questions
FSAWWA: Casey Cumiskey – 407-979-4806 or Casey@fsawwa.org
FWEA: Laura Cooley, 407-574-3318, admin@fwea.org
FWPCOA: Darin Bishop – 561-840-0340
Training Questions
FSAWWA: Donna Metherall – 407-979-4805 or Donna@fsawwa.org
FWPCOA: Shirley Reaves – 321-383-9690
For Other Information
FDEP Operator Certification: Ron McCulley – 850-245-7500
FSAWWA: Kim Kowalski – (407) 979-4814
Florida Water Resources Conference: 267-884-6292
FWPCOA Operators Helping Operators: John Lang – 772-559-0722, oho@fwpcoa.org
FWEA: Laura Cooley – 407-574-3318, admin@fwea.org
Websites
Florida Water Resources Journal: www.fwrj.com
FWPCOA: www.fwpcoa.org
FSAWWA: www.fsawwa.org
FWEA: www.fwea.org and www.fweauc.org
Florida Water Resources Conference: www.fwrc.org
News and Features
4 Happy 250th Birthday to the United States From the Florida Water Industry
6 Emerging Technologies Can Forecast Water Levels and Weather Events
19 FWEA 2025-2026 School Video Contest Winners Announced
20 The Deliberate Manager: Seven Steps to Scheduling Yourself for Success—Kate Zabriskie
23 Latest AWWA State of the Water Industry Report Now Available
24 Emerging Technologies: Transforming the Water Industry
34 Florida Forever Conserves More Than 10,000 Acres in Gulf County, Supporting Military Readiness in Northwest Florida
36 Decentralized Treatment in Hurricane-Prone Regions: Designing for Faster Recovery and Phased Growth—Eric Arfalk
37 Researchers Show New, Sustainable, Way to Remove Toxic Chemicals in Water
Wastewater Infrastructure Backlog Fueling America’s Beach Bacteria Hot Spots
44 NEMA Issues Guides on Evaluating Damaged Electrical Equipment After Natural Disasters and Extreme Weather Events
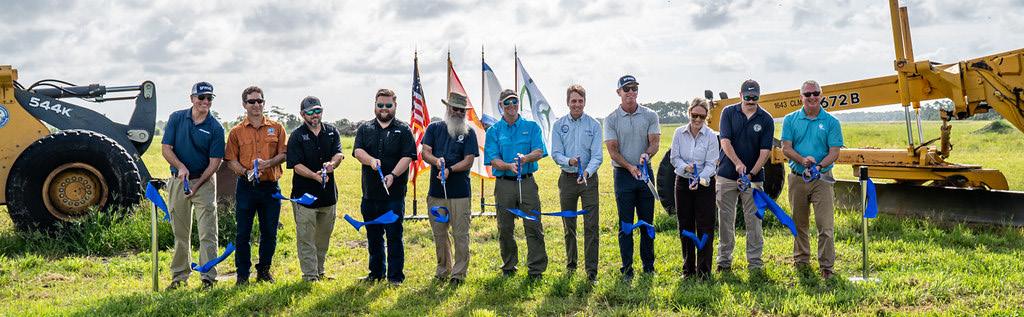
49 Cypress Creek Restoration Project Completed
Technical Articles
12 Enhancing Parking Lot Runoff Treatment Using Biochar-Amended Bioretention—Chase Royall, Kidanya Favaro, Sarina J. Ergas, Mahmood H. Nachabe, and Ananda S. Bhattacharjee
Education and Training
Columns
Happy 250th Birthday to the United States
From the Florida Water Industry
On your 250th birthday, the water industry proudly raises a glass—of clean, safe drinking water—to celebrate your remarkable journey. For two and a half centuries, you have grown, innovated, and reinvented yourself, and the story of water has quietly flowed alongside your own.
From the earliest public wells of colonial towns to today’s advanced treatment facilities, water has been the constant companion of American progress. It powered the mills that fueled the Industrial Revolution, sustained the farms that fed the nation, and supported
often unseen and unheralded, but always essential—protects public health, strengthens communities, and ensures that every home, business, factory, farm, and fire hydrant has the water it needs.
We also celebrate the spirit of innovation that defines you. America’s leadership in water conservation and reuse, desalination, advanced treatment, green infrastructure, and source protection reflects your enduring belief that challenges are invitations to build something better. As technology changes, climate pressures grow, and populations shift, the water sector stands ready to meet those
Emerging Technologies Can Forecast Water Levels and Weather Events
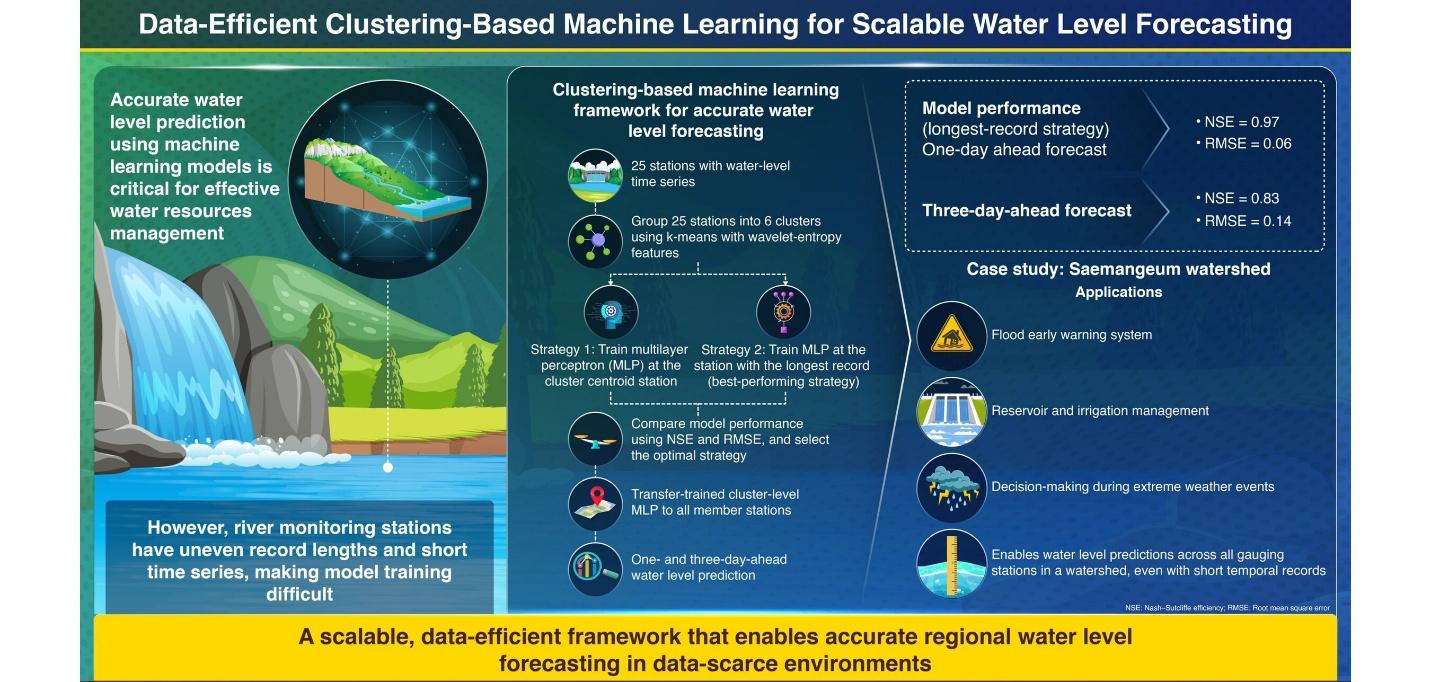
The proposed approach reduces computational cost while maintaining high predictive accuracy, making it suitable for large-scale applications
Reliable and scalable water-level prediction is crucial in hydrology for effective water resources management, especially when considering challenges owing to climate change, urbanization, improper land use, and high water demand. It directly impacts the availability and distribution of freshwater in rivers and reservoirs; therefore, accurate forecasting via early warning systems is a highly useful technique for flood mitigation, agricultural irrigation, ecosystem and environmental sustainability, and numerous other applications.
In this regard, physically-based hydrodynamic river models can be used. These tools, however, require enormous amounts of data, making them less useful in data-scarce regions.
Recently, scientists have successfully utilized data-driven approaches, especially advanced machine learning techniques to overcome these limitations. In river networks, monitoring stations often have uneven record lengths, and many have time series that are too short to effectively train artificial Intelligence (AI) models for water-level prediction, necessitating innovative approaches that enable predictions at all available monitoring stations and support the development of reliable watershed-scale early warning systems.
In a new development, SangHyun Lee, assistant professor, and Taeil Jang, professor, at the
department of rural construction engineering at Jeonbuk National University, Republic of Korea, have introduced a clustering-based machine learning framework that can accurately forecast water levels across all available stations, even when many have limited records. Their novel findings were made available online earlier this year and were published in Environmental Modelling & Software in March 2026.
Notably, instead of training separate AI models for every station, the proposed method groups stations with similar hydrological behavior and trains only one model per cluster. Specifically, the researchers select the station with the longest historical record in each cluster, train the model using that station, and apply the trained model to the remaining stations within the same cluster, reducing computational cost while maintaining high predictive accuracy. This approach enables a scalable, data-efficient AI system capable of accurately predicting water levels across an entire watershed using only a few representative stations.
This research has immediate practical value for water resource managers, emergency planners, and agricultural stakeholders. Said Lee, “By providing accurate short-term water level forecasts, even in areas with limited historical data, the framework can support flood early-
warning systems, optimize reservoir and irrigation management, and improve decision making during extreme weather events.”
Since the method reduces computational demands and does not require long-term records for all monitoring networks, it can also help agencies expand forecasting coverage across the watershed. In particular, regions that lack longterm hydrological records could still benefit from reliable forecasts using only a few representative monitoring stations.
Over the next five to 10 years, this type of approach could fundamentally improve how societies prepare for water-related risks under increasing climate variability. As floods and droughts become more frequent and unpredictable, scalable and data-efficient forecasting systems could enable real-time water management, automated infrastructure operation, and more-resilient watershed planning. The ability to generate reliable predictions with limited data also means that advanced forecasting technology could become accessible worldwide, including in developing countries.
Ultimately, such systems could enhance public safety, support sustainable agriculture, protect ecosystems, and strengthen long-term climate adaptation strategies for communities that depend on reliable water resources. S
(source: Jeonbuk National University)
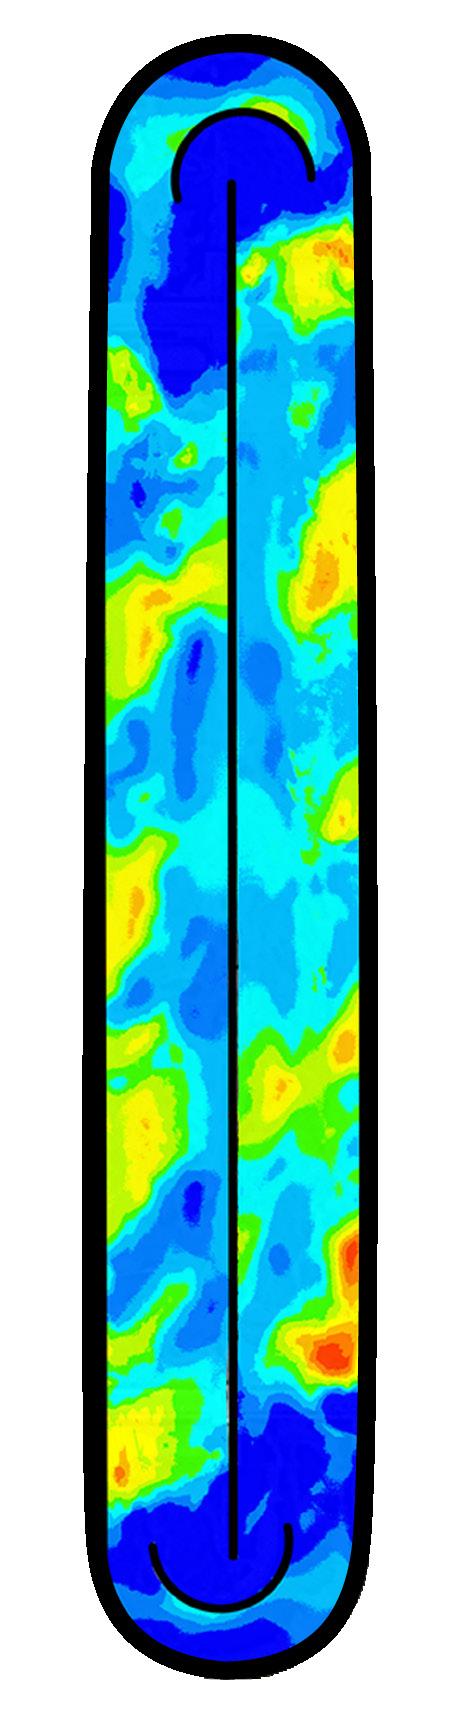
LOOP REACTOR PROCESS.
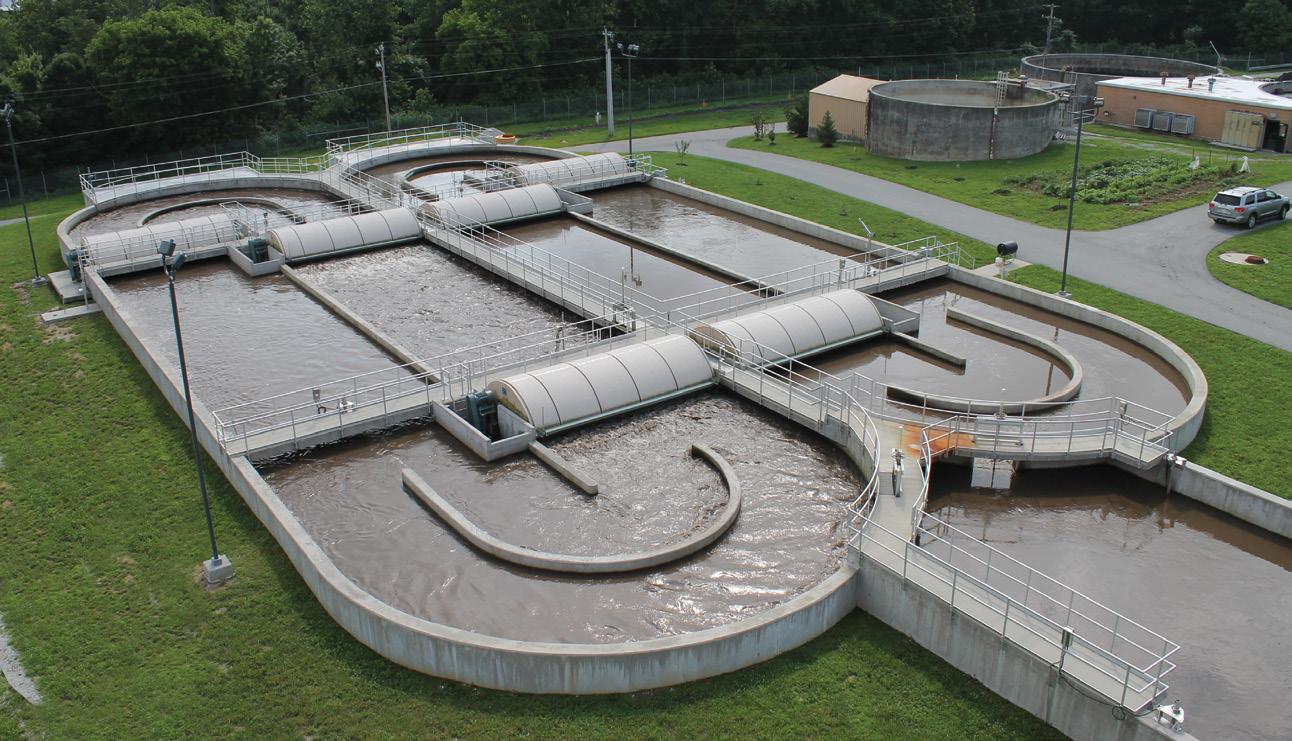
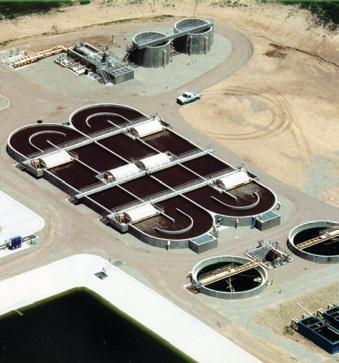
We have more than 60 years of experience in oxidation ditch technology and more than 2000 installations. Lakeside’s CLR process offers a variety of wastewater treatment options, including several operational modes, nitrogen and phosphorus removal, and an adaptable configuration, providing maximum flexibility with consistently high quality effluent. The CLR process is simple to operate and can be configured in several shapes, including the conventional racetrack, folded U-shape or concentric multichannel designs. Lakeside’s staff delivers full service from initial concept through construction to plant operation. The result: reliable results with minimal operator attention and maintenance. When performance counts, count on the industry leader for more than 90 years!
Happy Independence Day: Freedom to Educate Yourself
Kevin Shopshire President, FWPCOA
“I didn't understand anything because of my hunger. I wasn't dumb. It wasn’t lack of interest. My social condition didn't allow me to have an education. Experience showed me once again the relationship between social class and knowledge. Education is freedom.”
— Paulo Freire, Brazilian educator and philosopher
Last month, while networking at the Florida Water Resource Conference, I had an interesting conversation with a colleague. He had obtained a C level wastewater operator certification license, and was “good with that.” This individual was not near retirement age, nor new to the field. This statement triggered my curiosity and I continued talking to him.
“Why do you not want to advance to a B level?”
“I don’t want to. I don’t want the responsibility.”
“Will your boss give you more work?” “No.”
“Will you get paid more?”
“Yes.”
“ Then why do you not want more money for not doing more work?”
“I only have 10 more years until retirement.”
“So why not make more money for the next 10 years?”
“I don’t know. They probably won’t pay for me to go to school.”
“Did you ask?”
“No.”
“What if I told you about a scholarship that you could apply for to get the class paid for?”
“No thanks. I’m good with my C.”
At this point I could see the individual’s mind was set and closed to my ideas. I recognize and respect we all have our own priorities, so I gave him my contact information in case he reconsidered.
What is Freedom to You?
In today’s society, a lot of us look at the freedom allotted to those more financially secure, but we’re hesitant to take steps to increase our own financial independence—often, “Just because.” My parents always put me on the spot when I said that with “Because what?”
As I said, we all have our priorities, and sitting in a class isn’t always high on the list.
What if that class got you a certification, which then got you a raise? Over the years, I’ve seen coworkers ignore the chance for certification classes, fully knowing there is a 6, 8, or even 10 percent raise guaranteed. Many municipalities have contracts, unions, or employee position descriptions that spell out exactly how much of a raise you will get, just for getting educated and improving yourself.
In all fairness, I have also seen coworkers take every class available to them, and grow exponentially in their careers.
Sometimes the motivation to increase your education isn’t immediate financial advancement. I started my environmental career, not just in pretreatment, but also overseeing stormwater systems. Much to the chagrin of our organization’s training coordinator, I obtained both my pretreatment and stormwater certifications as quickly as possible. Later, in another municipality, when my career primarily focused on pretreatment, I approached my manager about obtaining my Stormwater A license. He immediately denied the request, saying, “That’s not part of your job.” This wasn’t good enough for me.
I was active in my FWPCOA region at the time, and found out about an application
for the Pat Robinson Scholarship Award (more information follows). Every region submits one member to receive a full scholarship to obtain education at one of our state short schools. I applied, and received it. I approached my manager again, with the option of me attending without cost to the city; I just needed the time out of office. He didn’t say no! He did require I write a justification, which was no problem; then after consideration, he approved my request.
Adding this A certification to my resume didn’t equate to a pay increase, but it did increase my knowledge and involvement in other projects normally outside the scope of my job duties. This increased my personal freedom to take more enjoyment out of my career.
What is your personal freedom you can enjoy from your career? Is it financial freedom, freedom to move on, freedom to be involved with other job situations, or something else? Don’t let your social conditions, or misconceptions, dictate your obtainment of knowledge, and thus, your own personal freedom.
That being said, our next short school is scheduled for August 3-7 in Fort Pierce! For more information go to www.fwpcoa.org.
FWPCOA Spotlight: Pat Robinson Award
I’m going to shift away from a committee spotlight this month to mention the details of the Pat Robinson Award.
The FWPCOA State Training Scholarship Program each year issues the Pat Robinson Award to deserving members of the association to attend the state spring or fall short school held the calendar year the award is presented. The scholarship consists of a fee waiver for attendance at the annual state short school and reimbursement of travel costs up to $800.
Get involved with your regional meetings to find out specifics. The application form is available on our website. Under the “About” menu, you’ll see “Awards” and this award is listed. While you’re there, check out the other awards. Do you know anyone else deserving one of the awards listed?
Our next Education Committee and board of directors meetings will be held the weekend prior to the next short school in Fort Pierce in August. I hope to see you there and Happy 4th of July! S
Paulo Freire
Operators: Take the CEU Challenge!
Members of the Florida Water and Pollution Control Operators Association (FWPCOA) may earn continuing education units through the CEU Challenge! Answer the questions published on this page, based on articles in this month’s issue. Circle the letter of each correct answer. There is only one correct answer to each question! Answer 80 percent of the questions on any article correctly to earn 0.1 CEU for your license. Retests are available.
This month’s editorial theme is Stormwater Management and Emerging Technologies. Look above each set of questions to see if it is for water operators (DW), distribution system operators (DS), or wastewater operators (WW). Mail the completed page (or a photocopy) to: Florida Environmental Professionals Training, P.O. Box 33119, Palm Beach Gardens, Fla. 33420-3119, or scan and email a copy to memfwpcoa@ gmail.com. Enclose $15 for each set of questions you choose to answer (make checks payable to FWPCOA). You MUST be an FWPCOA member before you can submit your answers!
Emerging Technologies: Transforming the Water Industry
see page 24
(Article 1: CEU = 0.1DS/DW02015472)
1. What is a key benefit of predictive maintenance driven by artificial intelligence (AI)?
a. Increasing emergency repairs
b. Detecting early-stage equipment deterioration
c. Reducing data collection
d. Eliminating the need for maintenance
2. Which technology is used to detect leaks using pressure and acoustic
a. Digital twins
b. Manual inspections
c. AI-enhanced analytics
d. Laboratory sampling
3. Which treatment technology is commonly used for per- and polyfluoroalkyl substances (PFAS) removal?
a. Precipitation
b. Ion exchange resins
c. Sand filtration
d. Disinfection
4. What is the primary goal of smart water networks?
a. Eliminating sensors
b. Providing real-time monitoring of system conditions
c. Reducing data collection
d. Removing automation
5. What is direct potable reuse?
a. Discharging untreated wastewater
b. Using stormwater only
c. Treating wastewater to drinking water standards
d. Pumping groundwater
Enhancing Parking Lot Runoff Treatment Using Biochar-Amended Bioretention
Chase Royall, Kidanya Favaro, Sarina J. Ergas, Mahmood H. Nachabe, and Ananda S. Bhattacharjee
Stormwater management is critical for reducing nonpoint source pollutant discharges from urban areas. During rainfall, stormwater mobilizes pollutants, including nutrients nitrogen (N) and phosphorus (P), fecal indicator bacteria, solids, organic matter, and oil and grease, that accumulate on roads, parking lots, and landscaped areas. These pollutants are carried into stormwater systems and ultimately into receiving waters. This causes a variety of environmental and health impacts, such as algal blooms, anoxic conditions, ecotoxicity, and disease. Conventional gray stormwater infrastructures, such as retention/ detention ponds, primarily focus on managing flood risk and provide minimal treatment for these pollutants. Future solutions must simultaneously control flooding and improve water quality closer to the source.
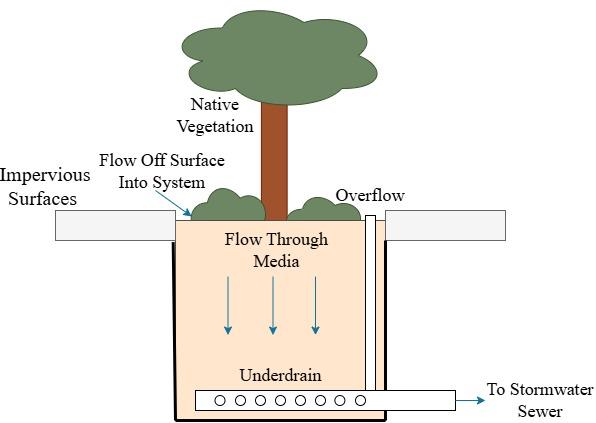
A promising stormwater treatment technology is bioretention. Bioretention systems are shallow depressions that contain a media mix, vegetation, and an underdrain. Formally introduced in the early 1990s, the technology uses physical, chemical, and biological processes within the media to remove a broad spectrum of pollutants (Winogradoff & Coffman, 1999). Early systems relied solely on natural media materials, such as soil, gravel, or mulch, achieving high removal of total suspended solids (TSS) and
reducing overall stormwater flow into storm sewers (Mahmoud et al., 2019). More recently, bioretention systems have been designed to remove other pollutants, such as nutrients, oil and grease, and bacterial contaminants (Hong et al., 2006; Rahman et al., 2020). This has led to bioretention systems becoming a popular best management practice (BMP) for general stormwater management.
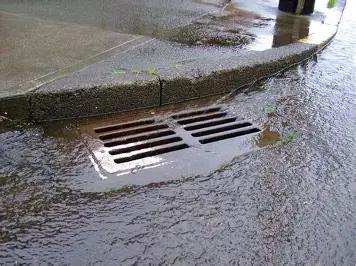
In ultra-urban settings where space for stormwater infrastructure is limited, prefabricated concrete boxes containing highpermeability media (HPM) materials can serve as decentralized stormwater treatment throughout the network. The HPM allows rapid flow conveyance to support flood management goals (Furen et al., 2025). These flow-through planters or tree box filters can be retrofitted into conventional stormwater infrastructure, or installed in new developments in place of curb, drop, or grate inlets, as shown in Figure 1 (Rutgers Cooperative Extension, 2013; Nissen et al., 2025). This is especially useful in ultra-urban areas, where the lack of open green spaces often presents a barrier to implementing conventionally sized infiltration-type bioretention units. Additionally, these systems can be planted with vegetation to enhance nutrient removal and offer aesthetic, shade, and habitat benefits to the community.
Chase Royall is a graduate student in environmental engineering and working as a research assistant; Kidanya Favaro is an undergraduate student and working as a paid researcher; Dr. Sarina J. Ergas, P.E., BCEE, is a professor of civil and environmental engineering; Dr. Mahmood H. Nachabe, P.E., is a professor of civil and environmental engineering; and Dr. Ananda S. Bhattacharjee is a research professor in the department of civil and environmental engineering at the University of South Florida in Tampa.
A significant challenge, however, to large-scale implementation of HPM bioretention systems has been the inconsistency in water quality performance, particularly under high loading conditions (Wang et al., 2017; Biswal et al., 2022).
Figure 1. Tree box stormwater filter.
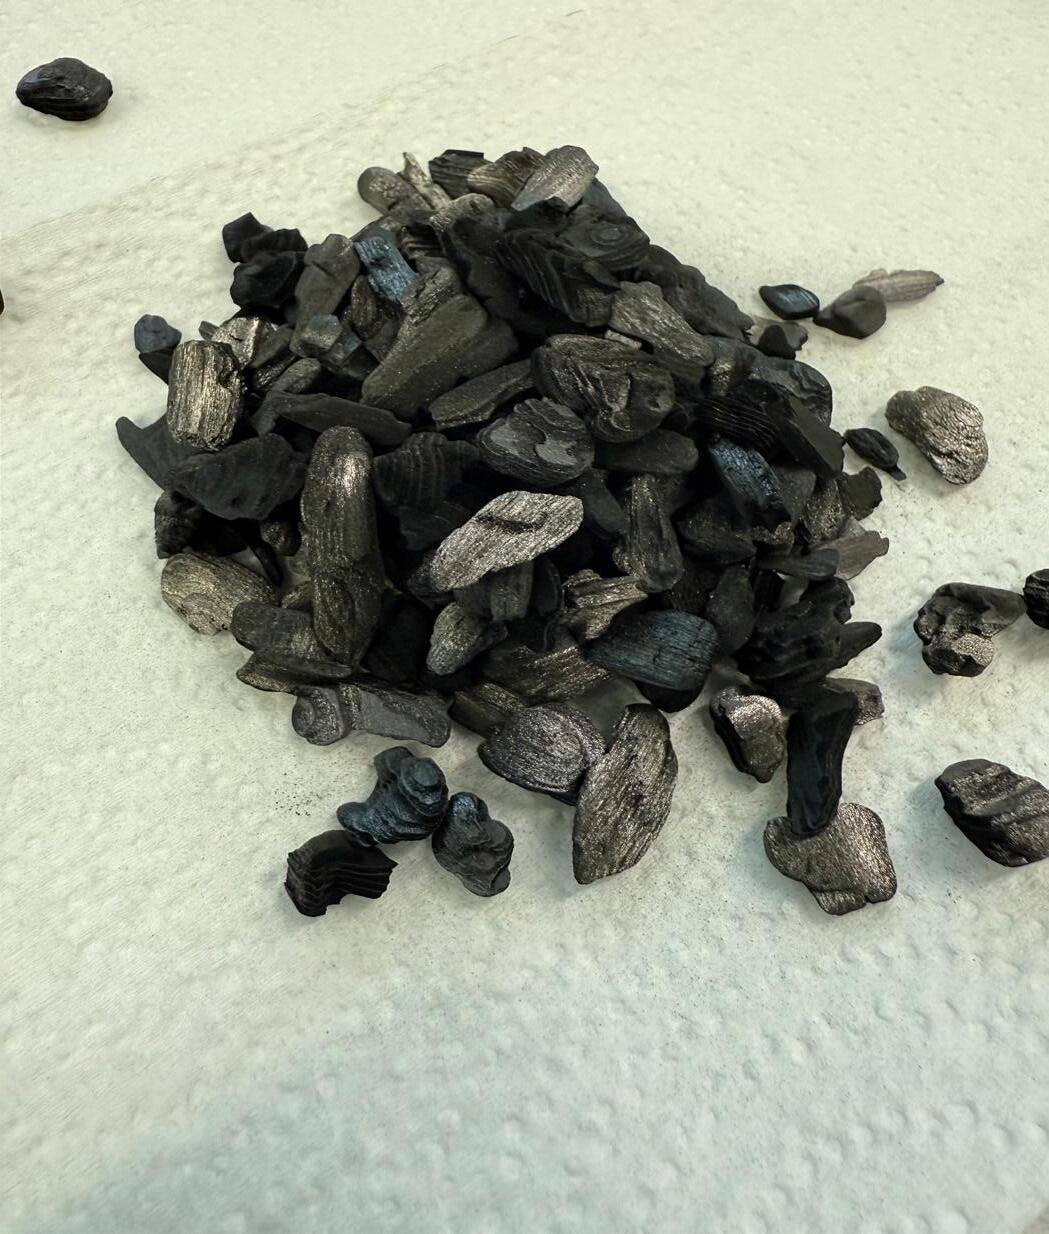
woodchips, in an oxygen-limited environment (Figure 2) and has emerged as a promising amendment in bioretention systems (Ulrich et al., 2024). Biochar has several beneficial characteristics, such as favorable surface chemistry for the removal of nonpolar chemicals, surface functional groups, and dual porosity that enables the removal of a broad range of pollutants from stormwater with short contact times (Lehmann & Joseph, 2024). Additionally, biochar has been shown to have desirable hydraulic characteristics, making it an ideal candidate for ultra-urban applications (Akpinar et al., 2023); however, most prior research on biochar-amended bioretention has focused either on a narrow pollutant profile, such as nitrogen removal, or on traditionally sized, large, low HLR retention systems (Ulrich et al., 2024; Richardson et al., 2025). Biochar also has the advantage over engineered media of being sustainably sourced from waste products and of comparable or lower price than alternatives.
This study evaluated the performance of biochar-amended bioretention media under high HLR conditions representative of ultra-urban stormwater systems. Specifically, the objectives were to:
S Quantify the removal of a broad spectrum of pollutants, including nutrients, organic matter, suspended solids, and fecal indicator bacteria.
S Assess the impact of biochar amendment on hydraulic performance, including hydraulic conductivity and resistance to clogging, in comparison to HPM without biochar.
Materials and Methods
Laboratory flow-through column studies were conducted in the environmental engineering laboratories at the University of South Florida (USF), comparing a bioretention system incorporating engineered HPM and a system with HPM with biochar amendment.
Materials
Media mixes tested in each column are summarized in Table 1. Biochar was donated by Sunshine Organics (Jacksonville, Fla.). The raw product was crushed and sieved to obtain a product passing a 1.90-cm. sieve and retained on a No. 4 sieve. Wood chips were derived from oak clippings, obtained from a local tree service (Tampa, Fla.), and sorted to be between 0.60 cm and 5 cm in length. Woodchips were added to the bulk mix to provide oil and grease removal capacity and an organic carbon source for nitrification (Hong et al., 2006; Richardson et al., 2025). The same wood chips were also added as a top mulch layer to reduce clogging after the fifth storm event, as described. The HPM was obtained
Table 1. Summary of Media Composition in Laboratory Columns
Control Column (Con.) Experimental Column (Exp.)
20% Woodchips
80% HPM
No Biochar
20% Woodchips
40% HPM
40% Biochar
Pollutant Mean (+/- Standard Deviation)
COD (mg/L) 279 (+/- 351) 9.14-484 (International) Song et al., 2019
PO43 -P (mg/L) 1.34 (+/- 0.556) 0.82 (Florida)
TIN (mg/L) 1.43 (+/- 0.877) 0.28-10.11 (Florida)
E. coli (CFU/100 ml) 40,000 (+/- 29,600) 100-240,000 (Wisconsin)
COD - chemical oxygen demand; TIN - total inorganic nitrogen; (CFU) - colony forming units
from a manufacturer of stormwater infrastructure. For each mix, the components were measured by volume and agitated. After five simulated storm events, and after significant clogging of the control media was observed, a 7.5-cm layer of wood chips was added to the top of both columns.
Column Construction and Operation
Two columns were constructed to test the performance of HPM bioretention systems with (experimental) and without (control) biochar
Toor et al., 2017
Jani et al., 2020
Salmore et al., 2006
Song et al. 2019
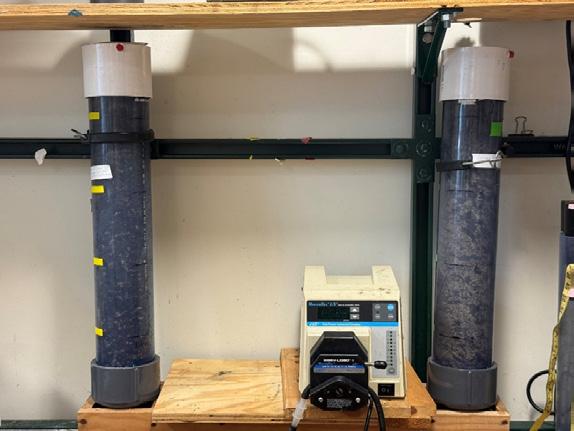
amendment. Each column was 9.5 cm in diameter and had a treatment depth of 61 cm with 5 cm of freeboard. The columns were constructed of clear polyvinyl chloride pipe (Figure 3).
First-flush stormwater runoff was collected from a parking lot on the USF campus during the first 20 minutes of each storm; thus, the contaminants present in the runoff closely mimicked those entering a real-world bioretention system, as shown in Table 2. Influent was spiked
Continued on page 14
Table 2. Influent Stormwater Characteristics
Figure 3. Laboratory columns control media mix on the right and experimental mix on the left.
Continued from page 13
with 1 percent (v/v) municipal wastewater to increase the influent nutrient and fecal indicator bacteria concentrations. Additionally, phosphate concentrations were enhanced by adding an orthophosphate solution to achieve a target concentration of 1 mg/L (as P). It is important to note that influent parameters were highly variable due to the nature of stormwater, which can be affected by storm intensity and an antecedent dry period.
The HLRs were designed to closely mimic real-world ultra-urban bioretention implementation. Using design guidance from the industry, a hypothetical real-world implementation for a Tampa-area parking lot was created (Oldcastle Infrastructure, n.d). Using meteorological data obtained from an oncampus weather station, runoff modeling, with the rational method a representative HLR, was found, representing a median storm event for the area. The events were scaled to represent the first 40 percent of the median storm volume. The target HLR was 0.26 cm/s applied for 9.7 minutes. This resulted in a volume of 10.7 L treated per column for each storm event.
The study began in mid-August, with tests conducted weekly during the wet season (August through mid-October) and biweekly during the dry season (mid-October through November). A total of 10 paired trials were carried out comparing the control and experimental columns.
Analytical Methods
During each test, two composite samples
were collected: one representing the first pore volume, approximately 2 L, and one representing the remaining test duration, approximately 8.7 L. Water quality parameters were analyzed using standard analytical protocols. The TSS and orthophosphate (PO₄³-) were measured according to “Standard Methods for the Examination of Water and Wastewater” (APHA et al., 2023) using Methods 2540D, and 4500P E. Nitrate plus nitrite (NOx) and ammonia (NH₃) concentrations were measured using a Timberline ammonia analyzer (Method Ammonia-001). The COD was measured using Standard Methods 5220 D (APHA et al., 2023).
Microbial indicators, including Escherichia coli (E. coli) and total coliforms, were quantified using U.S. Environmental Protection Agency (EPA) Method 1604. Columns were also monitored for hydraulic performance. Constant head-saturated hydraulic conductivity tests were performed on cleaned media mixes at various times throughout the column’s lifetime (ASTM D2434).
Data Analysis
Influent and effluent for each storm event was calculated on a mass basis as:
Where:
M = total mass of constituent for a storm event (mg)
Qi = flow rate during interval i (L/min)
∆ti = time length of interval i (min)
Ci = Concentration during interval i (mg/L)
n = number of intervals
Performance of the columns was compared using a paired Wilcoxon signed-rank test. Weekly composite removal percentages were treated as paired observations, with each pair representing concurrent measurements from the control and biochar-amended columns under identical experimental conditions. Statistical significance was considered p <= 0.05.
Results and Discussion
The laboratory results are divided into both water quality and hydraulic (quantity) performance. Both aspects are important to stormwater management, and thus, both must be considered to properly assess design enhancements.
Water Quality Performance
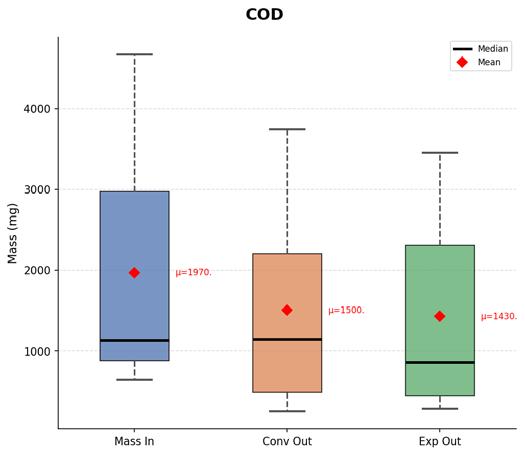
Figures 4, 5, and 6 show box plots (mean, median, and interquartile range [IQR]) of column influent and effluent on a mass basis. The influent COD mass load ranged widely across tests (Figure 4), with a median value near 1,100 mg and a mean of 1,970 mg, corresponding to a mean influent concentration of 180 mg/L. The extreme variability from test to test was due to the nature of collecting real parking lot runoff. The COD removal was slightly greater in the experimental column than the control column; however, these differences were not significant (p = 0.31). The control system produced a mean effluent COD mass of approximately 1,500 mg, while the experimental system produced approximately 1,430 mg, representing a similar
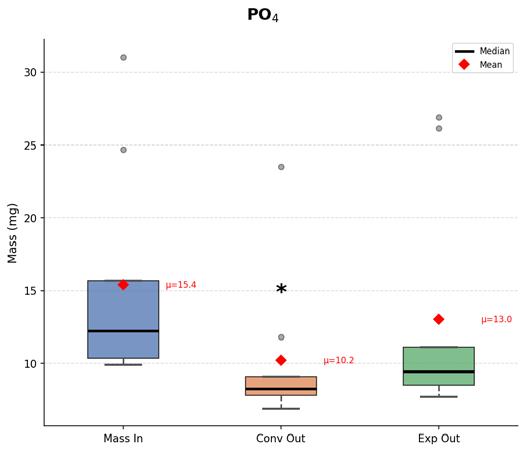
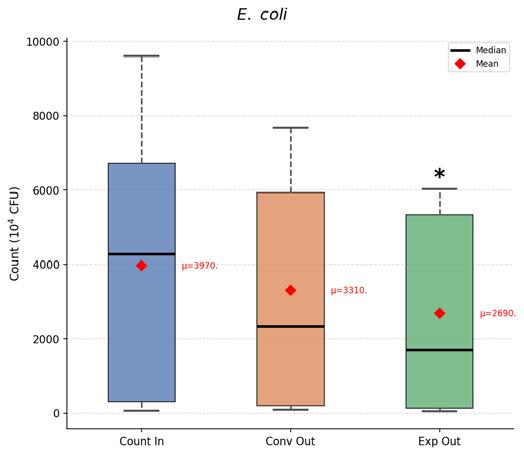
4. Box plots of per-test incremental mass (mg) for COD (left) and PO₄ (right), showing mass input and output for the control and experimental systems. The box represents the IQR, the horizontal line denotes the median, and the diamond (w) denotes the mean. Whiskers extend to 1.5× IQR; individual points beyond this range are shown as outliers. * indicates a statistically significant decrease in mass out relative to the other treatment (Wilcoxon signed-rank test, p =< 0.05).
Figure
See
apparent removal efficiency of about 25 percent. Although significant variability is present in the data, both systems reduced the COD on a pertest basis.
Phosphate (PO₄3--P) mass also decreased between influent and effluent samples (Figure 4). Influent PO43--P mass had a median value of approximately 12 mg and a mean of approximately 15.4 mg. Effluent PO₄ mass from the control system was significantly lower than for the experimental column (p = 0.05), with a mean effluent PO43--P mass of 10.2 mg (34 percent removal) for the control column and 13 mg (15 percent removal) for the experimental column. This was likely due to the HPM’s affinity for PO43- adsorption (Cooper, 2025). Replacing some of the HPM with biochar likely reduced the PO43- removal capacity of the media.
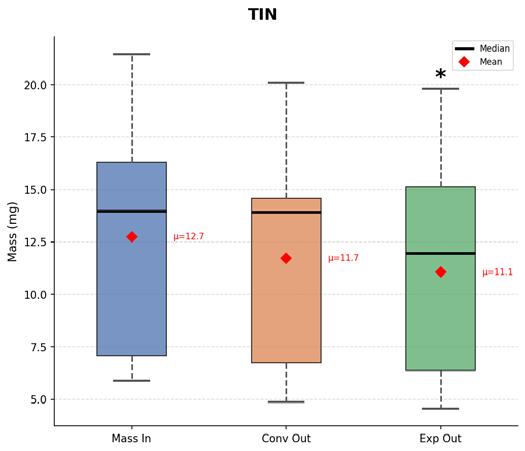
Box plots of TIN mass and E. coli CFU are shown in Figure 5. Both systems were less effective at treating TIN than PO43- and COD. Influent TIN mass had a median value near 14 mg, and a mean of approximately 12.7 mg. Effluent TIN masses were slightly lower for both systems, with mean values of approximately 11.7 mg (8 percent removal) for the control system and 11.1 mg (12 percent removal) for the experimental system. The removal efficiency from the experimental system was significantly higher than the control system (p = 0.05).
The E. coli concentrations decreased in both columns following treatment (Figure 5). Influent had a mean E. coli concentration of approximately 3,970 × 104 CFU. Significantly greater removal of E. coli was observed in the experimental system compared with the control system (p
= 0.03). Effluent concentrations were reduced to approximately 3,310 × 104 CFU (12 percent removal) for the control system and 2,690 × 104 CFU (38 percent removal) for the experimental system.
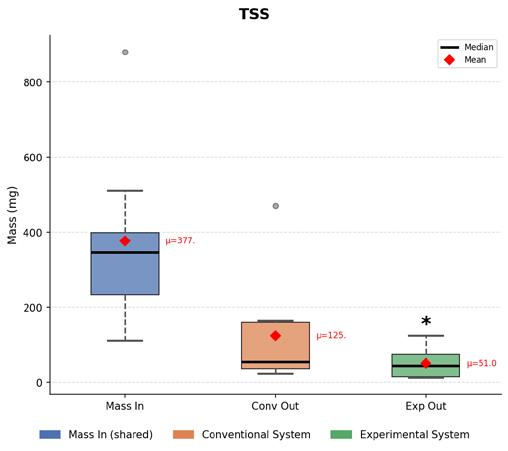
The TSS mass results are shown in Figure 6. Influent TSS mass loading showed substantial variability across tests, with a median of approximately 350 mg and a mean of approximately 377 mg; both units demonstrated excellent TSS removal. The control system produced a mean effluent TSS mass of approximately 125 mg (79 percent removal), while the experimental system produced a lower mean value of approximately 51 mg (88 percent removal). The TSS mass reduction was significantly greater in the experimental system than in the control (p = 0.03). Additionally, the experimental column produced more consistent results, with lower data variability.
Removal efficiencies observed in this study were lower than have been observed in prior bioretention studies (Ulrich et al., 2024; Richardson et al., 2025). Bioretention systems are often quoted as being optimally sized at 2 to 5 percent of the drainage basin; however, this is often not possible in ultra-urban settings (Minnesota Pollution Control Agency, 2021). The system modeled in this study was designed for a footprint encompassing 0.12 percent of the drainage basin. In addition, the columns were top-loaded and free-draining; therefore, water drained through the media in less than 2 minutes, and not all the media surface area was in contact with the stormwater as it moved through the columns. Hydraulic
regime enhancements, such as inverted elbow drainage, may enhance media contact by producing a saturated zone (Donaghue et al., 2021).
The greater performance of the experimental system for TSS, TIN, and E. coli was likely due to the enhanced porosity and unique surface chemistry of the biochar added to the media mix (Lehmann & Joseph, 2024; Lima et al., 2025). The diversity of pore sizes in biochar leads to morecomprehensive solids removal. Additionally, the negative surface charge of biochar enhances TIN removal by capturing positively charged NH4+ even at short contact times (Lehmann & Joseph, 2024). The enhanced surface area of biochar also improves the adsorption and subsequent die off of E. coli (Rahman et al., 2020). Biochar’s enhanced water retention also allows for increased contact time between contaminated water and the media and biofilms. This is particularly relevant for processes, such as nitrification and denitrification, that take place on longer time scales than the very short retention time characteristic of stormwater systems. Note that the HMP mix used in this research is specifically targeted at removing PO43- with the incorporation of aluminum oxide (Cooper, 2025).
Hydraulic Characteristics
The hydraulic conductivity of the clean media in both columns was high, as shown in Figure 7, approximately 0.95 cm/s in the control column and 1.2 cm/s in the experimental column. The most critical difference was
Continued on page 16
Figure 5. Box plots of per-test incremental mass (mg) for TIN (left) and CFU count for E. coli (right).
Figure 4 for full description of plot elements and statistical notation.
Figure 6 Box plots of per-test incremental mass (mg) TSS. See Figure 1 for a full description of plot elements and statistical notation.
Figure 6. Box plots of per-test incremental mass (mg) TSS. See Figure 1 for a full description of plot elements and statistical notation.
Continued from page 15
observed after use. After five storm events, the hydraulic conductivity in the control media decreased by 57 percent and the column became inoperable due to ponding and overflow. In contrast, the hydraulic conductivity in the experimental column decreased by only 25 percent. After clogging was observed, both columns were backwashed and a 5-cm layer of top mulch was added to each column to prevent further decay of hydraulic conductivity. No clogging was observed for the rest of the study period.
Conclusions and Implications for Practice
The following are implications from this study for stormwater system designers:
S Biochar is a sustainable material produced by pyrolysis of wastes, contributing to a circular water economy. Several Florida facilities produce biochar from wastes, including Sunshine Organics (Jacksonville) and Biotech Applied Research (Zolfo Springs).
S Due to its unique surface chemistry and high specific surface area, biochar can enhance removal to TIN, E. coli, and TSS while COD removal was similar in both systems.
S Reducing the amount of HPM can negatively impact PO43- removal if the HPM being replaced by biochar is designed for PO43adsorption. The use of biochar that has been modified for the removal of PO43- could help address this problem (Qin et al., 2022).
S The large particle size and multiporosity of biochar improved the hydraulic performance of the biochar-amended column. This effectively prevented any noticeable clogging
Figure 7. Bar chart of control and experimental media-saturated hydraulic conductivity, both on used media after five consecutive tests and clean media. Tests were performed using an elevated drain and a constant head to assure media saturation.
or surface ponding in the experimental column, while the control column required maintenance and cleaning to continue operating. This is especially relevant given the importance of volume management and maintenance costs in stormwater BMP.
S The modest pollutant removal observed in this study was likely due to the short contact time between the HPM and the stormwater. The current research is directed at enhancing water quality performance using an upturned elbow configuration.
S While individual systems exhibited relatively modest pollutant removal, biocharamended bioretention installations may provide substantial water quality benefits if numerous units are deployed throughout a distributed stormwater network as part of a treatment train in conjunction with traditional stormwater BMP.
S Results from this study are especially relevant considering recent Florida regulations requiring nutrients reductions upwards of 95 percent for new developments in impaired watersheds within Outstanding Florida Waters regions. These requirements are far greater than any technology can provide on its own.
Acknowledgments
This project has been funded by the U.S. Environmental Protection Agency (EPA) under assistance agreement number MX-02D47623 to the University of South Florida. The contents of this document do not necessarily reflect the views and policies of EPA, nor does EPA endorse trade names or recommend the use of commercial products mentioned in this article.
References
• Akpinar, D., Tian, J., Shepherd, E., & Imhoff, P. T. (2023). Impact of wood-derived biochar on the hydrologic performance of bioretention media: Effects on aggregation, root growth, and water retention. Journal of Environmental Management, 339, 117864.
• American Public Health Association, American Water Works Association, and Water Environment Federation. (2023). “Standard Methods for the Examination of Water and Wastewater” (24th ed.). APHA Press.
• Biswal, B. K., Vijayaraghavan, K., Adam, M. G., Tsen-Tieng, D. L., Davis, A. P., & Balasubramanian, R. (2022). Biological nitrogen removal from stormwater in bioretention cells: A critical review. Critical Reviews in Biotechnology, 42(5), 713–735. https://doi.org/10.1080/07388551.2021.19698 88.
• Cojoc, Lorena, Núria de Castro-Català, Ioar de Guzmán, Julene González, Maite Arroita, Neus Besolí-Mestres, Isabel Cadena, Anna Freixa, Oriol Gutiérrez, Aitor Larrañaga, Isabel Muñoz, Arturo Elosegi, Mira Petrovic, and Sergi Sabater. 2024. Pollutants in Urban Runoff: Scientific Evidence on Toxicity and Impacts on Freshwater Ecosystems. Chemosphere 369: 143806. https://doi. org/10.1016/j.chemosphere.2024.143806.
• Cooper, R. (2025) Managing Diffuse Phosphorus Pollution with Sorbents: Integrating Theory, Characterization, and Application, Ph.D. Dissertation, Department of Civil and Environmental Engineering, University of South Florida, https:// digitalcommons.usf.edu/.
• Donaghue, A. G., Beganskas, S., & McKenzie,
E. R. (2021). Inverted versus raised: The impact of bioretention underdrain height on internal water storage hydraulics. Journal of Sustainable Water in the Built Environment, 8(1). https:// doi.org/10.1061/JSWBAY.0000974.
• Furén, R., Lange, K., Beryani, A., Viklander, M., & Blecken, G.-T. (2025). Metal treatment in stormwater bioretention systems with high hydraulic conductivity—Designed for more efficient runoff volume capture and cold climates. Journal of Contaminant Hydrology, 274, 104654. https://doi.org/10.1016/j. jconhyd.2025.104654.
• Hong, E., Seagren, E. A., & Davis, A. P. (2006). Sustainable oil and grease removal from synthetic stormwater runoff using benchscale bioretention studies. Water Environment Research, 78(2), 141–155. https://doi. org/10.2175/106143005x89607.
• Jani, J., Yang, Y.-Y., Lusk, M. G., & Toor, G. S. (2020). Composition of nitrogen in urban residential stormwater runoff: Concentrations, loads, and source characterization of nitrate and organic nitrogen. PLOS ONE, 15(2), Article e0229715. https://doi.org/10.1371/ journal.pone.0229715.
• Kim, H., Seagren, E. A., & Davis, A. P. (2003). Engineered bioretention for removal of nitrate from stormwater runoff. Water Environment Research, 75(4), 355–367. https://doi. org/10.2175/106143003X141169.
• Lehmann, J., & Joseph, S. (Eds.). (2024). Biochar for Environmental Management: Science, Technology and Implementation (3rd ed., pp. Chapter 6: Characteristics of Biochar: Microand Nano-Chemical Properties). Routledge. https://doi.org/10.4324/9781003297673.
• Li, L., Zhang, Y.-J., Novak, A., Yang, Y., & Wang, J. (2021). Role of biochar in improving sandy soil water retention and resilience to drought. Water, 13(4), 407. https://doi.org/10.3390/ w13040407.
• Lima, M. A., Islam, M. H., Neogi, S., Nasrin, K., Sen, A., Masood, A., David, G. S., Pathan, M. M., Olalekan, B. A., Bordin, C., & Hridoy, M. A. A. M. (2025). Recent advances in biochar technology for aquatic pollution control: A critical review of applications, barriers, and future opportunities. Discover Sustainability, 6, Article 980. https://doi.org/10.1007/s43621025-01581-3.
• Liu, L., Wang, F., Xu, S., Sun, W., Wang, Y., & Ji, M. (2021). Woodchips bioretention column for stormwater treatment: Nitrogen removal performance, carbon source and microbial community analysis. Chemosphere, 285, 131519. https://doi.org/10.1016/j. chemosphere.2021.131519.
• Mahmoud, A., T. Alam, M. Yeasir A. Rahman, A. Sanchez, J. Guerrero, and K. D. Jones. 2019. Evaluation of field-scale stormwater
bioretention structure flow and pollutant load reductions in a semi-arid coastal climate. Ecol. Eng. X, 1 (April). https://doi.org/10.1016/j. ecoena.2019.100007.
• Masoner, J. R., Kolpin, D. W., Cozzarelli, I. M., Barber, L. B., Burden, D. S., Foreman, W. T., Forshay, K. J., Furlong, E. T., Groves, J. F., Hladik, M. L., Hopton, M. E., Jaeschke, J. B., Keefe, S. H., Krabbenhoft, D. P., Lowrance, R., Romanok, K. M., Rus, D. L., Selbig, W. R., Williams, B. H., & Bradley, P. M. (2019). Urban stormwater: An overlooked pathway of extensive mixed contaminants to surface and groundwaters in the United States. Environmental Science & Technology, 53(17), 10070–10081. https://doi. org/10.1021/acs.est.9b02867.
• Minnesota Pollution Control Agency. (2021). Design criteria for bioretention. Minnesota Stormwater Manual. https://stormwater. pca.state.mn.us/design_criteria_for_ bioretention.
• Nissen, K. A., Borst, M., Fassman-Beck, E., & Sousa, R. (2026). Bioretention flowthrough planter performance and design considerations. Journal of Sustainable Water in the Built Environment, 12(2), 04025018. https://doi.org/10.1061/JSWBAY. SWENG-582.
• Qin, Y., Wu, X., Huang, Q., Beiyuan, J., Wang, J., Liu, J., Yuan, W., Nie, C., & Wang, H. (2022). Phosphate removal mechanisms in aqueous solutions by three different Femodified biochars. International Journal of Environmental Research and Public Health, 20(1), 326. https://doi.org/10.3390/ ijerph20010326.
• Rahman, M. Y. A., Nachabe, M. H., & Ergas, S. J. (2020). Biochar amendment of stormwater bioretention systems for nitrogen and Escherichia coli removal: Effect of hydraulic loading rates and antecedent dry periods. Bioresource Technology, 310, 123428. https:// doi.org/10.1016/j.biortech.2020.123428.
• Richardson, N., Luangphairin, N., Bhattacharjee, A. S., Nachabe, M. H., & Ergas, S. J. (2025). Nursery runoff treatment by novel biochar-amended bioretention systems. Water, 17(3), 330. https://doi. org/10.3390/w17030330.
• Rutgers Cooperative Extension. (2013). Green infrastructure practices: Tree boxes (FS1209). Rutgers, The State University of New Jersey. https://njaes.rutgers.edu/fs1209/.
• Salmore, A. K., Hollis, E. J., & McLellan, S. L. (2006). Delineation of a chemical and biological signature for stormwater pollution in an urban river. Journal of Water
and Health, 4(2), 247–262. https://doi. org/10.2166/wh.2006.0022.
• Song, Y., Du, X., & Ye, X. (2019). Analysis of potential risks associated with urban stormwater quality for managed aquifer recharge. International Journal of Environmental Research and Public Health, 16(17), Article 3224. https://doi.org/10.3390/ ijerph16173224.
• Sweeney, L. C., Knappenberger, T., Brantley, E. F., & Shaw, J. N. (2022). Zeolite amended bioretention media improves nitrogen removal from stormwater. Agricultural & Environmental Letters, 7(1), e20060.
• Toor, G. S., Occhipinti, M. L., Yang, Y.-Y., Majcherek, T., Haver, D., & Oki, L. (2017). Managing urban runoff in residential neighborhoods: Nitrogen and phosphorus in lawn irrigation driven runoff. PLOS ONE, 12(6), e0179151. https://doi.org/10.1371/ journal.pone.0179151.
• Ulrich, B. A., Weelborg, K., Haile, T. M., Singh, U. B., & Magner, J. (2024). Field evaluation of a biochar-amended stormwater filtration system for retention of nutrients, metals, and Escherichia coli. Environmental Science: Water Research & Technology, 10, 2546. https://doi.org/10.1039/D4EW00390J.
• U.S. Environmental Protection Agency. (2023, June 6). The effects: Dead zones and harmful algal blooms. EPA. https://www.epa.gov/ nutrientpollution/effects-dead-zones-andharmful-algal-bloomsnjmhv.
• Wang, J., Chua, H. C. C., & Shanahan, P. (2017). Evaluation of pollutant removal efficiency of a bioretention basin and implications for stormwater management in tropical cities. Environmental Science: Water Research & Technology, 3(1), 78-91. https:// doi.org/10.1039/C6EW00285D.
• Wang, Y., Liu, J., Liu, Y., Xu, Y., Guo, X., & Zhou, Y. (2024). Research status, trends, and mechanisms of biochar adsorption for wastewater treatment: A scientometric review. Environmental Sciences Europe, 36(1), 86. https://doi.org/10.1186/s12302-024-00859-z.
• Winogradoff, D. A., & Coffman, L. S. (1999). Bioretention: Water quality performance data and design modifications. In Proceedings of the 26th Annual Water Resources Planning and Management Conference. American Society of Civil Engineers. https://doi. org/10.1061/40430(1999)164.
• Wolfand, J. M., Bell, C. D., Boehm, A. B., Hogue, T. S., & Luthy, R. G. (2018). Multiple pathways to bacterial load reduction by stormwater best management practices: Tradeoffs in performance, volume, and treated area. Environmental Science & Technology, 52(11), 6370–6379. https://doi.org/10.1021/acs. est.8b00408. S
FWEA FOCUS
Emerging Technologies Transforming Stormwater Management in Florida
David Hernandez President, FWEA
Growing up, I actually wanted to be a meteorologist. I spent a lot of time on the water, and as a sailor, dodging rain and trying to outrun summer storms was just part of
the routine. Storms felt different back then. Hurricanes, especially, had a certain excitement to them. I remember flying down my street on a skateboard, pulled by a kite I made out of two hockey sticks and a bedsheet (probably not the safest idea).
Today, storms mean something very different. Instead of chasing them, I’m thinking about whether my house might flood, how systems will perform under stress, and what the long-term impacts will be. It’s amazing how we look at the world through a different lens as
That shift in perspective is something many of us in the water industry can relate to. As we gain experience, we start to see just how complex and important stormwater management really is.
Emerging Technologies
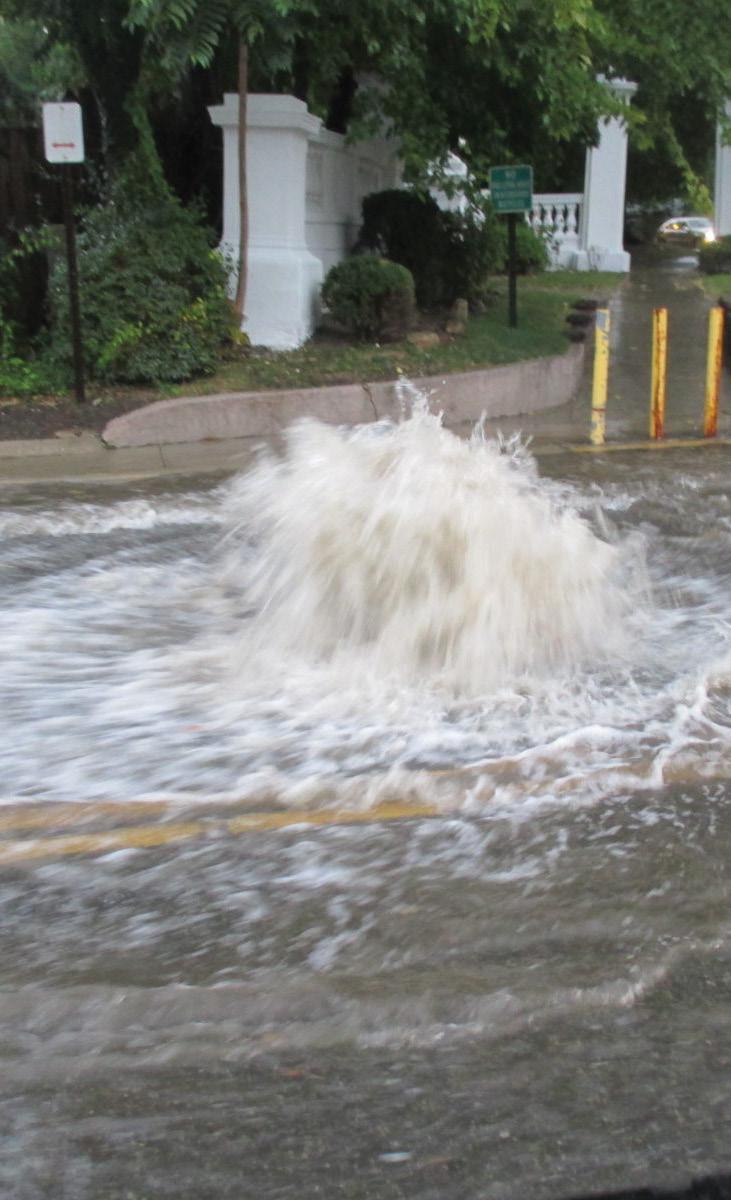
Across Florida, utilities are dealing with continued growth, aging infrastructure, and more-intense rainfall events. In coastal areas, high groundwater and sea level rise add another layer of complexity. It seems like every day there are videos of cars driving down flooded streets, whereas taking a kayak down the road may make more sense! These challenges aren’t new, but they are getting harder to manage with traditional approaches alone.
The good news is the tools available to us are improving.
Integrated Digital Modeling and Decision Tools
Advanced hydraulic and inundation models, combined with data visualization platforms, allow us to evaluate system performance under a wide range of storm and climate scenarios and support more-informed planning decisions.
Data-Driven Stormwater Management
Leveraging geographic information systems, system data, and analytics enables better understanding of system behavior, supports prioritization of capital improvements, and improves overall program effectiveness.
Real-time System Monitoring and Performance Tracking
Monitoring of stormwater controls and infrastructure provides continuous insight into system performance, helping operators respond more effectively during storm events and supporting long-term optimization.
Connected Data and Planning Platforms
Integrated data management systems are improving access to information across planning, modeling, asset management, and operations, enabling a more coordinated and adaptive approach to stormwater management. Individually, these tools add value; together, they support a more proactive and informed approach to managing stormwater systems.
Stormwater Management
Stormwater management in Florida has always required balancing flood control, water quality, and environmental protection. That balance is becoming more difficult.
In south Florida, systems are closely tied to groundwater, canals, and regional infrastructure. When groundwater is high or tides are elevated, available capacity is reduced. At the same time, regulatory expectations continue to evolve, particularly around water quality.
Expanding traditional infrastructure is not always feasible due to cost, space, and constructability constraints. This creates a need to get more out of existing systems while being strategic about future investments.
Bridging Technology and Practice
The real shift is in how these technologies are being applied. Real-time data can support more active system management during storm events. Predictive tools can provide early warning before issues occur. Digital twins allow us to evaluate alternatives and understand tradeoffs before making capital decisions.
We’re also seeing better integration between technology and green infrastructure. Monitoring and data analytics can help track performance and support more-adaptive management over time.
This isn’t about replacing traditional infrastructure; it’s about making it work smarter.
A Final Thought
Stormwater challenges in Florida aren’t going away, and in many cases they’re becoming more complex. What’s changing is our ability to respond.
Our industry plays such a vital role in advancing these conversations and helping move ideas into practice. I am so excited to spotlight our FWEA Emerging Water Technology Committee, which focuses on exploring innovative approaches and supporting the development of solutions to Florida’s evolving water challenges.
The committee brings together utilities, consultants, vendors, researchers, and regulators to exchange knowledge and promote collaboration across the industry. Efforts like this help bridge the gap between innovation and implementation.
If you’re interested in being part of this committee, please reach out to Jennifer Nyfennegger (jstokke@carollo.com) and Randy Brown (randy.brown@eagleutilitymanagement. com). S
FWEA 2025-2026 School Video Contest Winners Announced
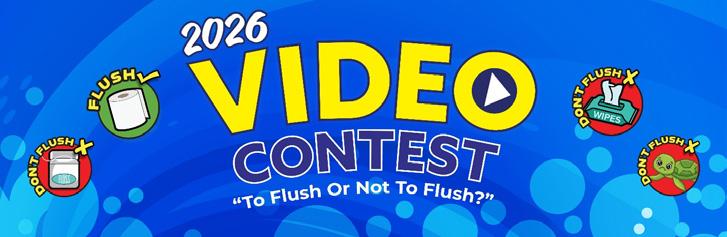
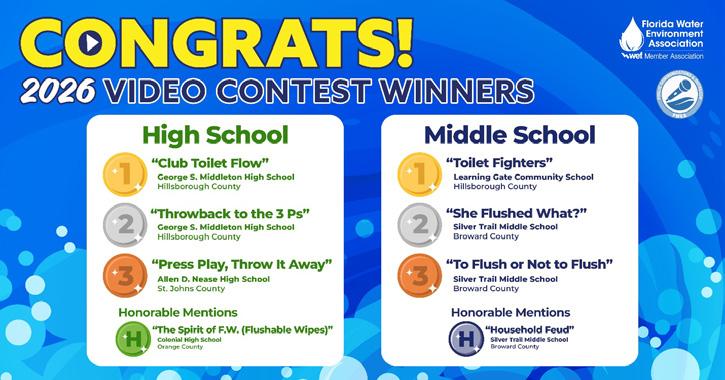
The FWEA Public Communications and Outreach Committee (PCOC) wrapped up another successful video contest this school year! Middle and high school students were challenged to submit a family-friendly video between 30 and 45 seconds in length that explains what items are safe and unsafe to flush. The 56 entries were ranked according to creativity, originality, and how well they accurately promoted the “To Flush or Not to Flush” theme, with an emphasis on the 3 Ps.
The winning students and their teachers were awarded for their efforts with prize money. The four students from George S. Middleton High School in Hillsborough County will split the firstplace prize of $550 and their teacher won a $500 prize to use in her classroom. In a similarly collaborative fashion, the four middle school students from Learning Gate Community School in Hillsborough
County will share a $450 first-place prize and their teacher will also get a $500 prize for use in her classroom. Prizes were also distributed for second- and third-place winners at the high school and middle school levels.
To view the creative winning entries, visit the FWEA contest website at fwea. org/video_contest.php.
The 2026-2027 video contest is under development by the PCOC and details will be posted to the contest website this fall. If you are interested in getting your school district involved and promoting the contest, please email Debbie.Sponsler@ocfl.net.
Debbie Sponsler is the communications section manager at Orange County Utilities and chairs the FWEA Public Communications and Outreach Committee. S
The Deliberate Manager: Seven Steps to Scheduling Yourself for Success
Kate Zabriskie
Most of us become managers because we excelled at our previous jobs, not because we had a grand vision for leadership. One day we’re individual contributors, and the next we’re juggling endless meetings, urgent emails, and last-minute crises while trying to develop our teams in whatever slivers of time we can find. Sound familiar?
actually productive, and how much of your day is spent in real, meaningful conversations with your team.
The results might be sobering. Many managers discover they’re dedicating little to no time to actual leadership. That’s okay. This exercise isn’t about guilt; it’s about identifying the problem so you can fix it.
Ask yourself: Where am I spending time that doesn’t align with my priorities as a manager?
Step Two: Block Your Calendar Like You Mean It
Being a Great Manager
Here’s the hard truth: Great management doesn’t happen in the margins of your day; it requires deliberate time and attention. But here’s the good news—you don’t need a management degree to get it right. With a few practical steps, you can carve out the time to lead effectively and still keep your sanity.
Step One: Figure Out Where Your Time Actually Goes
Before you can fix anything, you need to know what’s broken. Start by tracking your time for one week—every single thing you do, from impromptu hallway chats to late-night email marathons. Look honestly at how much time is going toward reactive firefighting, how much is lost to email and administrative work, how much of your meeting time is
Once you know where your time is going, it’s time to reclaim it. Treat management time as non-negotiable, just like a critical client meeting or a project deadline. That means blocking time for weekly planning (30 to 60 minutes to review priorities and get organized), brief daily check-ins with yourself each morning, regular one-on-ones with each team member, and dedicated space for team development.
One-on-ones in particular deserve a standing spot on your calendar, not just a slot you fill when something goes wrong. The same goes for team development, whether that’s a workshop, a group discussion, or time to share skills across the team.
Ask yourself: Is my calendar reflecting my role as a leader, or am I letting other priorities take over?
Step Three: Learn to Let Go
You can’t do it all, and you shouldn’t try. Delegation isn’t about offloading work you don’t want to do; it’s about empowering your team while freeing up your own time to focus on higher-level priorities. Before you delegate, think through a few things:
S What tasks are you currently doing that someone else could handle?
S Who on your team is ready for more responsibility?
S Are you providing clear instructions and expectations?
S How will you check progress without micromanaging?
Done well, delegation is one of the most powerful tools in a manager’s toolkit. It builds capability on your team and gives you back the time you need to lead.
Ask yourself: Am I delegating effectively, or am I holding on to tasks my team could manage?
Step Four: Stop Playing Whack-a-Mole With Problems
Reactive management is a time and energy drain. It’s like bailing water out of a boat without plugging the leak—you stay busy but never make real progress. The antidote is proactive management: looking for patterns in recurring problems, building systems or processes to prevent issues from arising in the first place, and fostering a culture where team members feel safe raising concerns early—before they become crises.
This shift takes time to build, but it pays dividends. Every fire you prevent is time you get to spend actually leading.
Ask yourself: Am I spending more time fixing problems or preventing them?
Step Five: Make Development Conversations Count
Conversations about growth aren’t just nice to have; they’re essential for your team’s success and, over time, for reducing your own workload. When your team is developing skills, fewer fires land on your desk.
Come to one-on-ones prepared. Review recent work, know your team members’ goals, and ask about their aspirations and challenges. Set clear, actionable next steps and follow up on them—show that these conversations aren’t just lip service. At the team level, encourage peer learning, share skills across the group, and
give stretch assignments that challenge people without overwhelming them.
Ask yourself: Am I dedicating enough time to helping my team grow?
Step Six: Guard Your Time
Your time is one of your most valuable resources, and it’s your job to protect it. Let your team know when you’re available and when you need uninterrupted focus time. Clearly define what counts as an emergency, set boundaries for interruptions, and train your team to handle certain situations on their own.
This isn’t about being inaccessible; it’s about being intentional so that when you are present, you can give your full attention to what matters most.
Ask yourself: Am I setting and enforcing boundaries that allow me to focus on highpriority work?
Step Seven: Check Your Progress Regularly
Management is a constant learning process, and regular self-assessment is essential. Schedule time to reflect on what’s working, what isn’t, and what needs to change.
S Are you consistently holding to your management time?
S Is your team performing better?
S Do you feel more in control, or are you still overwhelmed?
These questions don’t have permanent answers—check in on them often.
The Last Idea
Becoming a better manager isn’t about working more hours or saying yes to everything; it’s about being intentional with your time and energy. Start small. Block time for one-on-ones. Carve out 30 minutes each week for planning. Build from there.
Your team members don’t need another firefighter; they need a leader who knows how to manage time, build trust, and drive progress. The first step is deciding to be deliberate about it.
Ask yourself: What’s the first thing you’re going to block time for this week?
Kate Zabriskie is president of Business Training Works Inc., a Virginia-based talent development firm. She and her team provide onsite, virtual, and online soft-skills training courses and workshops to clients in the United States and internationally. For more information, visit www.businesstrainingworks.com. S
What Do You Know About Distribution Arithmetic? Test Yourself
Charlie Lee Martin Jr., Ph.D.
1. The reading of a flowmeter in gallons per minute on a 12-inch-diameter water main that is being flushed at a velocity of 6 feet/second is a. 5872 gallons per minute (gpm).
b. 2114 gpm.
c. 2500 gpm.
d. 1000 gpm.
2. The number of gallons needed for a 5.25 percent sodium hypochlorite solution to disinfect a well that is 250 feet deep where there is 150 feet of water in the well with a 20-inch-diameter casing and a well screen with a chlorine dose of 100 mg/l is
a. 3 gallons.
c. 2.5 gallons.
b. 4.7 gallons.
d. none of the above.
3. The number of gallons needed for a 5.25 percent sodium hypochlorite solution needed to disinfect 800 feet of an 18-inch-diameter water main with a chlorine dose of 400 mg/l is a. 81 gallons. b. 70 gallons.
c. 75 gallons. d. none of the above.
4. The number of gallons needed for a 12 percent sodium hypochlorite solution to disinfect a service storage tank with a chlorine dose of 100 mg/l that is 100 feet in diameter and 10 feet deep is
a. 600 gallons. b. 625 gallons.
c. 490 gallons. d. none of the above.
5. The number of gallons of hypochlorite solution pumped by a hypochlorinator when it’s held within a croc with a diameter of 3.5 feet and the solution level drops 20 inches is
a. 120 gallons.
b. 110 gallons.
c. 90 gallons.
d. none of the above.
6. The desired strength (as a percent of chlorine) of a hypochlorite solution pumped by a hypochlorinator delivering 100 gallons per day into water treated at a chlorine feed rate of 10 pounds of chlorine per day is a. 6 percent. b. 1.2 percent. c. 3 percent. d. none of the above.
7. The number of gallons of water that is to be added to 7 gallons of 5 percent hypochlorite solution to produce a 1.5 percent hypochlorite solution is
a. 7.3 gallons. b. 10.3 gallons.
c. 16.3 gallons. d. none of the above.
8. The number of gallons of water that will flow through a meter with a flow rate of 9 gallons per minute in 10 hours and 30 minutes is
a. 6000 gallons.
b. 5670 gallons.
c. 5000 gallons.
d. none of the above.
9. The time it will take to fill a chemical solution tank 20 feet in diameter and 6 feet deep when it is being filled at a rate of 10 gallons per minute is
a. 23 hours and 30 minutes.
b. 20 hours and 40 minutes.
c. 30 hours and 05 minutes.
d. none of the above.
10. The accuracy of a water meter as a percentage given that the meter reads 315 gallons per minute where the actual tested volume is 6 feet of water within a 3-feet-diameter tank is
a. 98.5 percent.
b. 90.5 percent.
c. 99.4 percent.
d. none of the above.
Answers on page 50
References used for this quiz: Formulas can be found in the appendix of CSUS Wate Distribution System Operation and Maintenance, 6th edition
AWWA and FSAWWA: Association Development
STyler Tedcastle Chair, FSAWWA
omehow, it’s already July! I don’t know how this happened, but here we are.
In all the excitement of the year assisting with the D.C. Water Matters Fly-In and the Florida Water Resources Conference (FWRC), I hadn’t had time to tell you about some amazing training and leadership opportunities for the Florida Section that took place in February: the FSAWWA Leadership/Business Practices Workshop
FSAWWA Leadership/Business Practices Workshop
Since I joined the Region II Planning Committee in 2009, I have had the opportunity to take part in this event. Back then, the event was a one-day seminar held at FSAWWA headquarters, which also happens to be in the St. Cloud City Hall. Since then, the workshop has evolved into a two-day training session focused on working with the 12 regions and seven councils: Contractors, Manufacturers and Associates, Membership Engagement and Development, Operators and Maintenance, Public Affairs, Technical and Education, and Water Utility.
This year, the event was held February 12-13 at the Omni at ChampionsGate. We welcomed volunteers from all our councils, committees, and regions who attended. If you would like to attend in the future, please let your respective region chair know.
Key topics that are typically covered included finances, training requirements, membership, and events hosting. This year, we also discussed hosting events with the collaboration of other organizations. Over the past year, FSAWWA and FWEA have worked together to provide a template for joint events between our two organizations. Understanding that many of our volunteers are members of both organizations, we felt this would allow for the streamlining of event management.
We also held a region- and councilsharing activity lead by Terri Holcomb, our chair-elect. This activity allowed for the different regional volunteers to meet with the council chairs to learn about how the regions and councils can collaborate more effectively. We also hope this will allow for more regional engagement and volunteering within the councils.
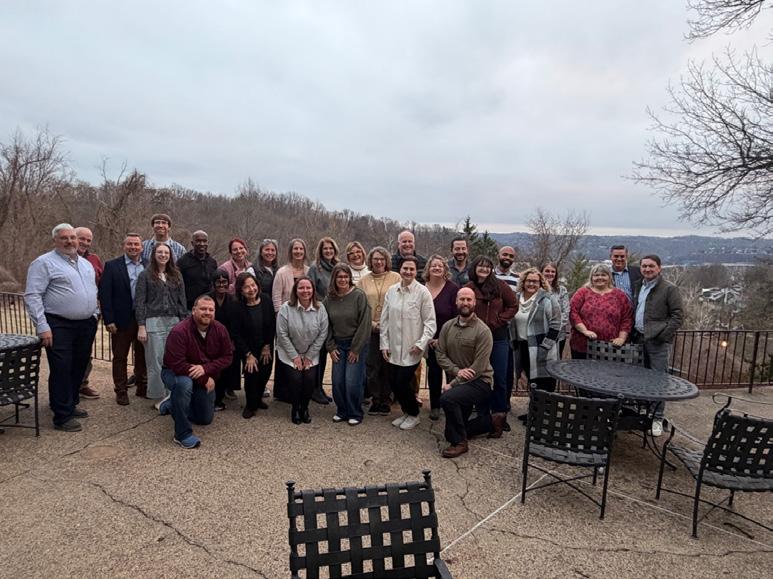
Attendees at the FSAWWA Leadership and Business Practices Workshop.
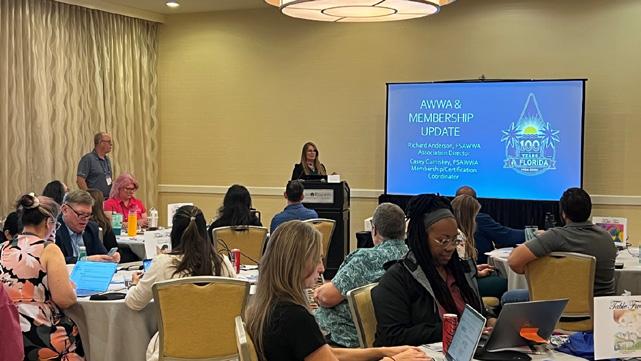
Casey Cumiskey (at podium) provides an update on FSAWWA membership.
Florida Section members at the Regional Meeting of Section Officers.
Shea Dunifon, the FSAWWA secretary, also utilized our Project WET Foundation of Water Education Guide to show us a fun activity that can be used with youth education. For this, everyone was provided with a water drop and explored the water cycle of that drop, including the states of water (groundwater, rivers, lakes, rain, glaciers). This was different from other activities because the water doesn’t always move in a typical cycle—sometimes you get stuck in a glacier, which never melts (hopefully).
We would like to thank our volunteers and their employers for allowing them to take the time to attend.
AWWA Regional Meeting of Section Officers
At the end of February, members of our Executive Committee and staff had the opportunity to attend the AWWA Regional Meeting of Section Officers (RMSO) in Charleston, W.V. Hosted by the West Virigina Section of AWWA, we were greeted with a warm welcome in the Appalachias (well, maybe not warm to us Floridians) with a fresh West Virginia “Hot Dog.” Members from the Region II sections attended, which includes West Virginia, Virginia, North Carolina, South Carolina, Georgia, Alabama/ Mississippi, Missouri, Southwest (Louisiana, Arkansas, and Oklahoma), Kentucky/ Tennessee, and Florida.
The two-day training included an update on the state of AWWA, membership, education and training programs, and collaboration with other organizations. I personally found the collaboration and discussions among the sections to be very beneficial. It’s at these times where we have the opportunity to share the successes of other sections and learn where improvements can be made.
Florida’s signature events, such as our BBQ at the Fall Conference, numerous events held by the regions, FWRC, and our Leadership and Business Practices Workshop, were all highlighted as examples of amazing events put on by our volunteers. Thank you Shea, Terri, Kim, and Peggy for making the trip!
Get Involved!
As you can tell, membership has been a very important topic recently for both the section and AWWA. We are constantly looking for ways to provide better value for our members and to increase our presence in the water industry. If you are interested in volunteering or joining, please let us know! S
Emerging Technologies: Transforming the Water Industry
Water and wastewater utilities are operating in an increasingly complex environment shaped by aging infrastructure, climate variability, regulatory tightening, and persistent workforce shortages. Traditional operational approaches—largely manual, reactive, and equipment-centric—are no longer sufficient to maintain reliability or meet rising performance expectations. At the same time, rapid advancements in digital tools, automation, and treatment processes are creating new opportunities for utilities to modernize their systems and improve long-term resilience.
Over the last decade, the water sector has shifted from slow, incremental adoption of new technologies to a more-accelerated pace of innovation. Digital twins, artificial intelligence, advanced treatment systems, robotics, and smart networks are moving from pilot projects into mainstream utility operations. These technologies are enabling utilities to optimize processes, reduce operational risk, enhance water quality, and better manage limited resources.
This article examines the most influential emerging technologies shaping the modern water industry, highlighting their operational value, implementation considerations, and the ways in which they are redefining utility management and service delivery.
Digital Twins and Advanced System Modeling
Digital twins are representations of a physical object, system, or process. They serve as a virtual counterpart to a physical entity, enabling simulation, integration, testing, monitoring, and maintenance, and have evolved from conceptual models into operational decision support systems.
Digital twins integrate hydraulic modeling,
supervisory control and data acquisition (SCADA), geographic information system layers, asset condition information, and realtime sensor inputs into a continuously updated virtual representation of a utility’s infrastructure.
Expanded Benefits
Operational Foresight for Pressure, Water Age, and Tank Cycling
Digital twins allow operators to visualize how pressure zones, tank levels, and water age will respond to changes in demand, pump operations, or valve adjustments. This predictive capability helps utilities maintain disinfectant residuals, avoid low pressure events, and optimize tank turnover without relying on trial-and-error adjustments in the field.
Scenario Testing for Capital Planning
Engineers can evaluate the hydraulic impacts of proposed pipeline replacements, pump upgrades, or treatment plant expansions before committing to construction. This reduces design uncertainty, improves cost estimation, and supports more-defensible capital improvement plans.
Emergency Response Modeling for Main Breaks or Contamination
When a main break or contamination event occurs, digital twins can simulate flow reversals, pressure drops, and potential contaminant pathways in real time. This enables faster isolation of affected areas and targeted public notifications.
Energy Optimization Through Pump Scheduling
By integrating real-time energy pricing and system demand, digital twins can recommend pump schedules that minimize energy use while maintaining operational constraints. Utilities
often achieve measurable reductions in peak hour energy consumption.
Artificial IntelligenceDriven Analytics and Predictive Maintenance
Artificial Intelligence (AI) refers to the development of computer systems capable of performing tasks that typically require human intelligence. These tasks include recognizing speech, making decisions, identifying patterns, and solving problems. It encompasses a wide range of technologies, including machine learning, deep learning, and natural language processing
It’s rapidly becoming a core operational tool. Machine learning models can analyze millions of data points from SCADA, sensors, maintenance logs, and weather feeds—far beyond human capacity.
Applications
Predictive Maintenance for Pumps, Blowers, and Membranes
The AI models detect subtle changes in vibration, motor current, flow, or pressure that indicate early stage equipment degradation. This allows maintenance teams to intervene before failures occur, reducing emergency repairs and extending asset life.
Process Optimization for Aeration and Chemical Dosing
Machine learning algorithms continuously adjust aeration rates, coagulant dosing, or nutrient removal processes based on influent characteristics and real-time performance data. This reduces energy use, stabilizes effluent quality, and improves regulatory compliance. Continued on page 26
Leak Detection Using Pressure and Acoustic Signatures
The AI-enhanced leak detection systems analyze pressure transients, acoustic noise patterns, and flow anomalies to identify leaks that may not be visible at the surface. This accelerates repair timelines and reduces nonrevenue water.
Demand Forecasting for Distribution System Balancing
Predictive models incorporate weather patterns, seasonal trends, and historical consumption to forecast demand. Utilities use these forecasts to optimize tank cycling, pressure management, and pump operations.
Advanced Treatment Technologies
As global concerns about water quality and availability grow, advanced water treatment technologies have emerged to enhance the purification process and tackle various contaminants that traditional methods may not effectively remove.
As regulations tighten and water scarcity grows, treatment technologies are evolving to meet new challenges.
Treatment Innovations
Ion Exchange Resins for Per- and Polyfluoroalkyl Substances Removal
Modern resins offer high selectivity for per- and polyfluoroalkyl substances (PFAS) compounds and can be regenerated or disposed of with lower long-term costs than granular activated carbon. Utilities are increasingly using resin systems as primary or polishing treatment steps.
High Pressure Membranes for PFAS and Microconstituents
Reverse osmosis and nanofiltration provide robust removal of PFAS, pharmaceuticals, and other trace contaminants. Advances in
membrane materials are reducing energy consumption and extending membrane life.
Supercritical Water Oxidation, Plasma
Reactors,
and Electrochemical Destruction
These emerging technologies aim to destroy PFAS rather than merely concentrate them. Early pilot studies show promising destruction efficiencies, offering utilities a potential long term solution to PFAS disposal challenges and expenses.
Forward Osmosis and Capacitive Deionization for Low-Energy Desalination
These processes reduce the energy burden of desalination by leveraging osmotic gradients or electrostatic forces rather than high pressure pumps.
Granular Sludge Systems and Shortcut Nitrogen Removal
These biological processes reduce aeration demand, improve settling characteristics, and support more-compact treatment footprints.
Membrane-Aerated Biofilm Reactors
Membrane-aerated biofilm reactors systems deliver oxygen directly through membranes, improving oxygen transfer efficiency and reducing energy use in biological treatment.
Advanced Oxidation Processes
Advanced oxidation processes generate highly reactive radicals that break down microconstituents, taste and odor compounds, and pathogens. They are increasingly used in potable reuse and surface water treatment.
Smart Water Networks and Internet of Things Integration
Smart water networks are comprehensive, digital ecosystems designed to enhance the efficiency, reliability, and sustainability of water systems. They integrate physical assets, such as
pipes, pumps, tanks, and treatment facilities, with sensors, meters, and control devices to collect and transmit data across the network. These networks enable utilities and businesses to monitor water flow, pressure, quality, and consumption in real time.
The Internet of Things (IoT) is a network of connected devices that collect, share, and analyze data to enable smarter decision making and automation across industries and daily life. It refers to physical devices, vehicles, appliances, and other objects embedded with sensors, software, and network connectivity, allowing them to collect and exchange data with other devices and systems over the internet or private networks.
This is transforming water systems into realtime, data-rich networks.
Expanded IoT Deployments
Smart Meters With High
Resolution Consumption
Data
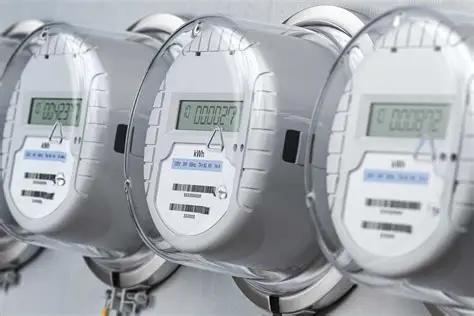
Hourly or 15-minute interval data helps utilities identify customer leaks, improve billing accuracy, and support conservation programs. Customers gain visibility into their own usage patterns.
Acoustic Leak Sensors in Distribution Mains
Permanent acoustic sensors continuously monitor pipe noise to detect leaks early. These systems reduce the time between leak formation and repair, lowering water loss and minimizing pavement damage.
Water Quality Sensors
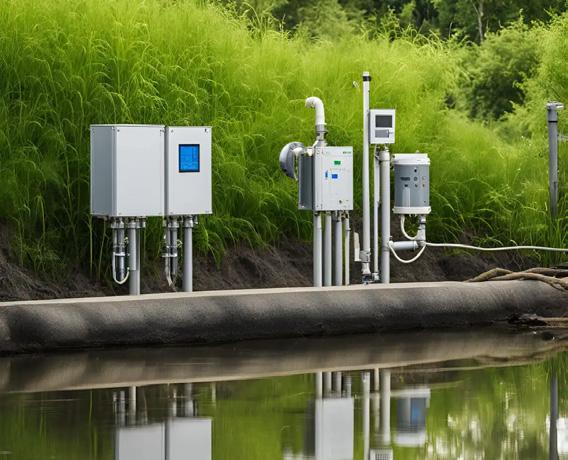
Real-time water quality monitoring for chlorine, turbidity, oxidation-reduction potential, and pH in the distribution system allows utilities to identify water quality degradation before it reaches customers. This supports proactive flushing and reduces regulatory risk.
Continued on page 28
Remote Lift Station Monitoring
The IoT-enabled lift stations provide continuous data on pump performance, wet well levels, and power status. This reduces the need for manual inspections and improves response times during storms or power outages.
Robotics and Automation
Robotics is a branch of engineering and computer science that involves the conception, design, manufacture, and operation of robots. The objective of the robotics field is to create intelligent machines that can assist humans in a variety of ways.
Robotics can take on a number of forms. A robot might resemble a human or be in the form of a robotic application, such as robotic process automation, which simulates how humans engage with software to perform repetitive, rules-based tasks.
Automation describes a wide range of technologies that reduce human intervention in processes, mainly by predetermining decision criteria, subprocess relationships, and related actions, as well as embodying those predeterminations in machines. Automation has been achieved by various means, including mechanical, hydraulic, pneumatic, electrical, electronic devices, and computers, usually in combination.
Robotics and automation are increasingly used to perform tasks that are hazardous, laborintensive, or difficult to access.
Applications
Pipe Inspection Robots for Small-Diameter Mains
These robots navigate pipes that are too small or fragile for traditional closed-circuit television equipment. They provide highresolution imagery and condition data without requiring service disruptions.
Drones for Tank and Reservoir Inspections
Drones capture detailed imagery of tank roofs, coatings, and structural components without the need for scaffolding or draining. This reduces inspection costs and improves safety.
Sludge Handling Robots Reducing Confined Space Entry
Robots can remove sludge from tanks and basins, eliminating the need for staff to enter confined spaces. This reduces safety risks and improves operational efficiency.
Automated Sampling Systems for Regulatory Compliance
Automated samplers collect consistent and time- or flow-based samples, improving data quality and reducing labor demands.
Water Reuse and Resource Recovery Technologies
Water reuse and resource recovery are key strategies for sustainable water management, aiming to close the water cycle by treating wastewater and recovering valuable resources instead of simply discharging it.
Water reuse (also called water recycling or reclamation) involves treating wastewater— such as municipal wastewater, stormwater, or industrial effluent—and repurposing it for alternative uses like landscape irrigation, industrial processes, and even drinking water.
Resource recovery goes further, extracting valuable materials, such as nutrients, metals, and energy, from wastewater streams to reduce environmental impact and create revenue.
Water and wastewater utilities are shifting from linear “treat and discharge” models to these circular systems that recover water, energy, and nutrients.
Innovations
Multibarrier Advanced Treatment for Direct Potable Reuse
Direct potable reuse systems combine microfiltration, reverse osmosis, advanced oxidation, and real-time monitoring to produce potable quality water. Automated shutdown protocols ensure the health and safety of users.
Struvite Recovery Systems
Struvite recovery systems are engineered to capture and reuse the crystalline mineral struvite that naturally forms in wastewater treatment plants and anaerobic digesters. While struvite can cause operational problems, such as pipe blockages, equipment damage, and process instability, its recovery offers significant environmental and economic benefits. These systems capture phosphorus in the form of struvite pellets, reducing maintenance issues in pipes and pumps while producing a marketable fertilizer.
Ammonia Stripping and Phosphorus Capture
Ammonia stripping and phosphorus capture are complementary nutrient recovery technologies that can be combined to simultaneously recover nitrogen and phosphorus from wastewater, turning waste streams into valuable fertilizers. These nutrient recovery technologies reduce chemical use, improve effluent quality, and support circular nutrient management.
Anaerobic Digestion With Biogas-to-Energy Systems
Anaerobic digestion is a biological process in which microorganisms break down biodegradable organic matter in the absence of oxygen, producing biogas (mainly methane and carbon dioxide) and a nutrient-rich residue called digestate.
Modern digesters produce biogas that can be converted to electricity or renewable
natural gas, offsetting energy costs and reducing greenhouse gas emissions.
Heat Recovery From Wastewater
Wastewater heat recovery involves extracting heat from domestic, commercial, or industrial wastewater before it’s discharged, using it to preheat water or provide space heating and cooling. This process leverages the principle of sewage thermal energy utilization.
This thermal energy can be captured and used for district heating or facility heating, improving overall energy efficiency.
Cybersecurity and Resilient Infrastructure Technologies
Cybersecurity for drinking water and wastewater systems is critical because these systems are increasingly connected to the internet, making them vulnerable to remote attacks that can disrupt water supply, wastewater treatment, and public health.
Water and wastewater utilities rely on digital systems for monitoring, control, and communication. Threat actors—including state-sponsored hackers and criminal or terrorist groups—can exploit these connections to tamper with valves, pumps, chemical dosing, and flow controls, potentially causing environmental harm, service outages, or public health risks.
Resilient infrastructure is designed to withstand, adapt to, and recover from disasters and disruptions while ensuring continuity of critical services and supporting long-term sustainability goals.
As utilities digitalize, cybersecurity and resilient infrastructure become core operational requirements.
Cybersecurity Tools
AI-Based Intrusion Detection
The AI systems monitor network traffic for
unusual patterns that may indicate cyberattacks. These tools provide faster detection and response than manual monitoring.
Network Segmentation
Separating operational technology from information technology reduces the risk that a breach in one system will compromise another.
Zero Trust Frameworks
Zero trust architectures require continuous verification of users and devices, reducing the risk of unauthorized access.
Real-Time Threat Monitoring
Continuous monitoring platforms provide alerts for suspicious activity, enabling utilities to respond quickly to potential threats.
Resilient Infrastructure: Principles and Guidelines
Sustainable and resilient infrastructure is designed to withstand extreme weather events, socioeconomic shocks, and other disruptions and is guided by a set of global principles developed by the United Nations Office for Disaster Risk Reduction.
Continuity of Critical Services
Energy, transportation, water, wastewater, waste, and digital communications underpin the health, education, and economic activities of every community, and continuity of these services is essential.
Risk-Informed Planning and Investment
Ensures that both public and private sectors make decisions that account for potential hazards and climate risks. Financing mechanisms should be developed that are available to support resilience investments, adapting infrastructure to the economic and social environment.
Social Engagement and Goal Setting
Actively involve communities to enhance understanding and participation in preventing and responding to disruptions. Align infrastructure development with long-term sustainability goals, reducing vulnerability to climate change and natural hazards.
Integration
of Resilience From the Outset
Rather than retrofitting after damage occurs, protect infrastructure investments to ensure long-term service continuity by incorporating resilience measures during planning, development, maintenance, and upgrades.
Conclusion
Emerging technologies are reshaping the water industry in ways that directly improve operational reliability, regulatory compliance, and long-term sustainability. Digital tools, such as AI, digital twins, and IoT networks provide unprecedented visibility into system performance. Advanced treatment processes enable utilities to meet evolving water quality standards and expand reuse opportunities. Robotics and automation reduce safety risks and support workforce efficiency while cybersecurity technologies protect increasingly connected systems.
The utilities that benefit most from these innovations are those that integrate technology into strategic planning, staff training, and daily operations. As climate pressures intensify and infrastructure ages, the ability to operate proactively rather than reactively will become a defining characteristic of resilient water systems.
Emerging technologies are no longer optional enhancements—they are essential tools for building the next generation of reliable, efficient, and future-ready water and wastewater utilities. S
Florida Forever Conserves More Than 10,000 Acres in Gulf County, Supporting Military Readiness in Northwest Florida
The Florida Department of Environmental Protection (FDEP) has secured a conservation easement over approximately 10,023 acres in Gulf County within the Northwest Florida Sentinel Landscape, furthering ongoing efforts to align land conservation with military readiness and national defense.
Situated in Florida’s panhandle, the unique coastal geography of the Northwest Florida Sentinel Landscape contains rural and agricultural lands, iconic longleaf pine forests, and threatened and endangered species habitat. The landscape is also home to nine military installations and ranges: Eglin Air Force Base, Tyndall Air Force Base, Naval Air Station Pensacola, Naval Air Station Whiting Field, Naval Support Activity Panama City, Eglin Gulf Test and Training Range, Hurlburt Field, Saufley Field, and Corry Station. These installations are integral to military training, weapons testing, special operations, joint cyber warfare, and aviation pilot training for the Air Force, Navy, Marine Corps, and Coast Guard. The coastal installations in northwest Florida are ideally located with direct access to special-use airspace over the Eglin Gulf Test and Training Range.
The acquisition will help maintain compatible land use near the nine military installations and training ranges in the region while preserving working forests and natural resources in a rapidly developing area.
Sentinel Landscapes
Florida is one of only a few states with multiple federally designated sentinel landscapes and is tied for the most in the United States. Through strategic investments in northwest Florida and the Avon Park Air Force Range region, Florida has expanded conservation partnerships among state, federal, and private entities to support national defense, sustain rural economies, and protect natural resources.
“The continued success of Florida Forever reflects Florida’s commitment to forwardthinking policy and strong partnerships that deliver lasting results,” said Alexis A. Lambert, FDEP secretary. “By preventing incompatible development and preserving mission-supportive landscapes, these efforts
(photo: sentinellandscapes.org)
help strengthen military readiness while maintaining the character and ecology of surrounding communities.”
Since its designation in 2022, more than 83,000 acres have been protected within the Northwest Florida Sentinel Landscape. Recent additions include Shoal River Headwaters State Park, Sandy Creek State Forest, and Telogia Creek Wildlife Management Area.
Beyond northwest Florida, nearly 35,000 acres have been protected within the Avon Park Air Force Range Sentinel Landscape between Orlando and Lake Okeechobee. An additional 25,000 acres have been conserved through partnership with the U.S. Department of War’s Readiness and Environmental Protection Integration Program.
“The Northwest Florida Sentinel Landscape has been key in mission assurance, increased readiness, and overall sustainability of aviation pilot training at the Naval Air Station Whiting Field,” said Randy Roy, the Field’s community planning and liaison officer. “Through this partnership, employment of Readiness Environmental Protection Integration, and partner match funding, The Field has been able to safeguard over 20,000 acres from incompatible development, which has been critical in supporting the busiest aviation complex in the world.”
Conservation and Preservation
Through the Florida Forever Program, the state conserves land that provides environmental, recreational, and preservation benefits, including water quality and quantity safeguards, resilience from storm impacts, habitat and species protections, national security, and outdoor recreation opportunities. Since 2019, the state has committed more than $1.5 billion to the Florida Forever Program. This funding has enabled FDEP to acquire over 500,000 acres for conservation, 55 percent of which are conservation easements.
For more information about the Florida Forever Program, visit FloridaForever.org. S
Decentralized Treatment in Hurricane-Prone Regions: Designing for Faster Recovery and Phased Growth
Resilience planning requires systems that can withstand storms and restart quickly
Erik Arfalk
When Florida’s water and wastewater utilities recover from hurricanes it’s not one facility at a time, but as interconnected systems. Treatment plants, lift stations, backup power, storage capacity, emergency crews, and more all affect how quickly essential services can be restored, often days or weeks after a major storm.
Recent hurricanes have shown how quickly those system connections can falter. In September 2022, Hurricane Ian caused more than $109 billion in damage and left over 2.4 million people without power, underscoring just how quickly storms can disrupt interconnected infrastructure systems across Florida.
Flooding, storm surge, wind damage, and power loss disrupt coastal and inland communities alike, and low-lying areas face
groundwater and saltwater intrusion. Florida’s resilience planning reflects that reality, with emergency preparedness spanning pre-storm planning through post-storm assessment, including repair readiness, mutual aid, and continuity of service. The Resilient Florida Program from the Florida Department of Environmental Protection offers grants to analyze and plan for such vulnerabilities, as well as implement adaptation and mitigation measures.
Why Scale Can Slow Recovery
Large, centralized systems remain appropriate for many service areas, but their scale concentrates operational risk; when part of one large system fails, the problem affects the entire network. A damaged treatment plant, flooded lift station, broken force main, or inaccessible pump station can disrupt service far beyond the point of failure because so many users depend on the same network.
Even when the main plant survives,
recovery depends on the rest of the system. Essential tasks like power restoration, pump restarts, pipe network checks, and overflow containment take time, and damaged assets may be inaccessible until roads are cleared and debris removed. All the while, communities experience secondary impacts as they wait for service restoration. Hurricane Ian made those effects visible. Communities along the coast and inland faced wastewater disruptions, as heavy rainfall overwhelmed sewers and forced residents to limit water use. While centralized infrastructure has its place, decentralized strategies help compartmentalize risk, allowing utilities to localize disruptions when failures occur.
Decentralized Treatment as a Resilience Strategy
Decentralized treatment places smaller, scaled-to-fit water or wastewater facilities closer to the demand centers they serve. By reducing reliance on long pipeline runs to distant centralized plants, distributed infrastructure can provide utilities with more-localized recovery options. The same logic can reduce capital and operating costs because shorter pipe runs lower construction, pumping, and long-term maintenance
Decentralized capacity can help resilience planners manage disaster risk in several ways. Smaller facilities can be sited, elevated, protected, or isolated more easily than large, regional assets. Localized systems also allow partial service restoration when nearby assets remain functional. In regions where storm effects vary sharply from one neighborhood or island to another, decentralized systems build a more resilient
Decentralized and modular treatment strategies have already been used in hurricane-prone and island environments where continuity of service and rapid recovery
are critical considerations. In some cases, facilities have been designed to meet recognized infrastructure resilience standards for wind and seismic exposure.
Hardening, Adaptability, and Restart
Traditional resilience programs often focus on hardening: elevating assets, protecting electrical systems, and reinforcing buildings. These measures, however, do not address every recovery challenge when a utility depends on long networks and sequential restarts.
Adaptability adds another layer. Modular systems, redundant process trains, simplified commissioning, and rapid restart procedures can help utilities design for both recovery and resistance. Strategic placement can keep critical assets out of vulnerable zones, while phased deployment can preserve options as population, demand, and risk conditions change.
Planners no longer need to choose between strength and flexibility. Strong local assets, distributed placement, and expandable treatment capacity can work together, especially where growth patterns and storm exposure remain difficult to forecast.
Planning for Storms and Growth Together
Hurricane resilience and growth planning often compete for the same capital, land, and staff attention, and decentralized treatment can connect these priorities. Instead of building all capacity at once in one location, utilities and developers can phase infrastructure as demand materializes and preserve room for expansion.
For hurricane-prone regions, that phased approach supports a practical shift in thinking. Recovery speed, service continuity, and longterm growth can be integrated. The flexibility of decentralization enables both faster recovery and more-adaptive long-term planning.
Erik Arfalk is chief growth officer at Seven Seas Water Group in Tampa. S
Researchers Show a New, Sustainable, Way to Remove Toxic Chemicals in Water
Sunlight can be used to activate sustainable 2D materials capable of degrading toxic pollution in water
Birmingham researchers have demonstrated a new method to break down toxic pollutants in wastewater, using sunlight and molecularthin catalysts created using an innovative “mechanical” approach.
Nondegradable dyes originating from industries, such as textiles, cosmetics, food, pharmaceuticals, and printing, are among the most prominent sources of industrial pollution. Left untreated, they disperse in both land and water, leading to contamination that poses serious risks to human health and the environment.
Most industries use a combination of techniques to remove these chemicals from wastewater, but dye-polluted water persists. Textile dyes alone are the second-largest contributor to water pollution worldwide. Like contaminating drinking water, they can disrupt ecosystems, reduce photosynthesis in freshwater and marine plants, and alter the life cycles of fish and other aquatic animals.
Photocatalysis, which uses a light-activated catalyst to accelerate decomposition, has shown promise as a sustainable method for breaking down these harmful pollutants; however, largescale manufacture of suitable catalysts that can be activated by sunlight has proved challenging, and current methods use toxic solvents, which creates a further waste stream to deal with.
Dr. Jason Stafford from the department of mechanical engineering and the Birmingham Centre for Mechanochemistry and Mechanical Processing collaborated with researchers specializing in analytical chemistry and biosciences to demonstrate that catalysts produced by a novel, water-based mechanical method can degrade pollutants, including those containing the tough-to-break carbon-fluorine bonds that feature in many sources of persistent pollution.
The method uses high-intensity turbulent shear stresses to exfoliate molecular-thin sheets of material and also assembles them into heterostructures, which are made of two semiconductor materials with bespoke photoelectronic properties. The most recent work, which is published in “2D Materials and Applications,” shows it can be used to significantly enhance photocatalytic performance in under 90 minutes without using toxic chemicals.
The research team chose graphitic carbon nitride (g-C3N4) and molybdenum disulfide (MoS2) as the raw material for making catalysts. These compounds are known for their visible-light responsiveness, high stability, and low cost, making them ideal for solar-to-chemical energy conversion.
The manufactured catalysts are comprised of ultra-thin layers of the raw material and atomic edge creation, increasing the surface area on which the chemical decomposition reaction takes place while simultaneously preserving the electronic structure of the material and maintaining charge generation and transport, which are essential for the catalyst to work.
They tested the effectiveness of the catalysts using Indigo Carmine, Rhodamine B, and Acid Red 266 as “model pollutants.” All three are synthetic chemicals used in textile dying, industrial processes or biotechnology research, and Acid Red 266 contains carbon-fluorine bonds.
Their study demonstrated these sustainably produced 2D catalysts increased the degradation performance on the model pollutants by up to twoand-a-half times compared to the bulk raw material. Notably, the process rapidly achieves these levels of performance after only 10 minutes of mechanical treatment.
Dr. Stafford explained, “While there are several methods for mopping up, coagulating, or filtering to remove pollutants from water, a more desirable option is to degrade them to simpler, nontoxic compounds. In the case of synthetic dyes, the products of degradation are carbon dioxide, water, and inorganic salts. A major roadblock to pursuing this approach has been the lack of sustainable and scalable ways of making catalysts in a format that enables efficiency in the chemical reaction. We have shown this is possible, and are confident that the method could be used to produce photocatalysts at an industrial scale.”
A method for the mechanical synthesis of materials is the subject of a patent application submitted by the University of Birmingham Enterprise. The researchers are interested in speaking to commercial companies who are interested in advanced materials and wastewater treatment technologies and want to explore partnership or licensing to bring new products, processes, or services to market. S
April 18 - 21, 2027 | World Marriott | Orlando
CALL FOR PAPERS
It’s almost time to upload your submissions!
Seize the opportunity to share your knowledge and solutions with the water industry.
Join professionals dedicated to improving and sustaining Florida’s water. The website will open late July to upload your submissions.
Visit fwrc.org/learn for technical session updates.
WEBSITE UPDATES
2027 Conference Updates are LIVE!
Have you visited the FWRC website lately? Visit fwrc.org today to view the 2026 Technical Session presentations and to stay up-to-date on the 2027 conference.
STAY UP-TO-DATE
Connect with us on social today!
fwrc_official
fwrc_official
florida-water-resources-conference
Wastewater Infrastructure Backlog Fueling America’s Beach Bacteria Hot Spots
The Surfrider Foundation has released its annual Clean Water Report, a comprehensive look at the state of America’s coastal water quality and wastewater infrastructure that increasingly cannot keep up. The 2025 report documents how an estimated $630 billion backlog in wastewater infrastructure repairs—paired with morefrequent extreme weather and a federal proposal to eliminate the only dedicated federal program for beach water quality monitoring—is putting millions of beachgoers at risk.
More than 100 million visitors flock to America’s beaches every year to enjoy the sand, sunshine, and water. Beyond rest and recreation, the coasts are the foundation of valuable coastal tourism and ocean recreation industries that sustain 2.5 million jobs and contribute $240 billion in gross domestic product to the United States economy each year. Despite the immense value of these natural resources, the Centers for Disease Control and Prevention estimates that more than 5 million people get sick from
swimming in contaminated water each year. While many beaches are safe for swimming and recreation, Surfrider’s 2025 data identifies some concerning beach pollution hot spots.
Aging Pipes, Bigger Storms
Beneath the postcard image of America’s coastlines is a wastewater system in disrepair. Years of neglect and underfunding have left the country with an estimated $630 billion backlog in needed wastewater infrastructure repairs and upgrades. Over 900 billion gallons of untreated sewage pour into U.S. surface waters every year, and nearly 10 trillion gallons of untreated stormwater runoff carry road dust, oil, animal waste, fertilizers, and other chemicals into waterways.
The system’s fragility was on full display on Jan. 19, 2026, when a section of the Potomac Interceptor—a 72-inch sewer line built in 1962—collapsed just upstream of Washington, D.C., releasing more than 240 million gallons of untreated sewage into the Potomac River in one of the largest sewage spills in U.S. history. The levels of E. coli in the river spiked to hundreds of times above the U.S. Environmental Protection Agency (EPA) safety thresholds, prompting recreational advisories across multiple downstream counties. Climate change is making the problem worse. More-frequent and more-intense storms generate volumes of stormwater that overwhelm aging wastewater systems, triggering infrastructure failures and sewage spills. In March 2026, back-to-back Kona storms dropped a 1,000year deluge—roughly 2 trillion gallons of water— across the Hawaiian Islands, with the summit of Haleakala recording 33 inches of rain in 24 hours, nearly doubling the previous record. These kinds of storms that used to be rare are arriving more often, and the systems built to handle them weren’t designed for this new climate reality.
10,157 Samples, 620 Beaches: Inside the Data
The encouraging news, captured in the report, is that the majority of America’s ocean beach sampling sites tested clean most of the
time. The data, however, also reveal persistent “hot spots” where contamination is chronic— frequently at beaches the government doesn’t test. The Blue Water Task Force, the largest volunteer-run beach water testing program in the U.S., aims to fill in these testing gaps and processed 10,157 water samples at 620 locations through a national network of 60 chapter-led labs in 2025, working at more sampling sites and conducting more tests than in any previous year. Of those samples, 23 percent measured bacteria levels that exceeded state health standards for recreational waters. At 400 of the 620 beaches tested (65 percent), at least one sample failed to meet state health criteria over the course of the year. At two beaches in Hawaii, Punaluu Beach Park on Oahu and the mouth of the Moloaa Stream on Kauai,100 percent of samples collected by Surfrider volunteers failed.
“Most of America’s ocean beaches test clean most of the time, but our data is revealing hot spots where families are being exposed to dangerous levels of bacteria, often in communities where the government isn’t testing,” said Mara Dias, Surfrider’s Clean Water Initiative associate director. “That’s exactly the gap our chapters are stepping up to fill. From Los Angeles to Honolulu, from Long Island to Puerto Rico, Surfrider volunteers are turning water quality data into positive action and bringing communities together, partnering with local leaders, and driving the pollution solutions our coastal economies and healthy beaches depend on. The U.S. House overwhelmingly passed the American Water Stewardship Act earlier this year by a bipartisan vote of 378 to 32 to reauthorize and modernize the Beaches Environmental Assessment and Coastal Health (BEACH) Act for another five years. We’re calling on the Senate to do the same and inviting every beachgoer to join us in protecting the coasts we all love.”
Filling the Gaps, Driving Solutions
Surfrider’s community-driven work is delivering results from coast to coast. In Imperial Beach, Calif., Surfrider’s Clean Border Water Now campaign has helped secure $604 million over the last two years to address the decades-long Tijuana River sewage crisis. Infrastructure solutions are now being implemented, and U. S. and Mexican officials are expanding their diplomatic and financial commitments to respond to this worsening public health and environmental catastrophe. In Manhattan Beach, Calif., decades of Blue Water Task Force monitoring data made the case for a major stormwater infiltration project, and after a successful city vote, construction is underway.
In Hawaii, the Kauai Chapter mobilized more than 100 community members to demand stronger bacteria limits in the renewal
of the Wailua Wastewater Treatment Plant permit, prompting the county council to open formal discussions on treatment upgrades. Meanwhile, after years of chapter advocacy on cesspool pollution, HB 1618, which establishes a low-interest revolving loan fund for cesspool conversion, passed the Hawaii Legislature in 2026 and awaits the governor’s signature.
In parallel with its water testing and advocacy work, Surfrider also leads the nationwide Ocean Friendly Gardens program, which advances nature-based solutions to soak up and filter polluted runoff before it reaches local waterways. In 2025, Surfrider chapters registered 49 ocean-friendly gardens covering 26.4 acres that collectively filter more than 23 million gallons of runoff each year, which is a small but growing piece of the larger climate-
resilient infrastructure agenda that coastal communities urgently need.
Significant investments must be made now to prepare coastal communities for moreextreme weather and to repair the wastewater systems already overwhelmed and failing. Congress should take immediate steps to fund important clean water programs at EPA, like the Clean Water State Revolving Fund and the BEACH Act grants program.
Surfrider is urging supporters to contact their senators in support of extending funding for the BEACH Act and to join their local chapter in the fight for clean water—because no one should get sick from spending a day at the beach.
The full 2025 Clean Water Report is available at surfrider.org. S
LET’S TALK SAFETY
CPR and AEDs Can Save Lives
Sudden cardiac arrest (SCA) is the sudden, unexpected loss of heart function, breathing, and consciousness. An SCA occurs when the heart’s electrical function—its ventricular fibrillation— is interrupted and stops the heart from pumping blood. It can also occur with a heart attack, which occurs when blood flow to a portion of the heart is blocked. Either way, without medical attention, the victim will die.
Of the nearly 300,000 people in the United States who suffer an out-of-hospital SCA, 92 percent die, according to the Centers for Disease Control and Prevention. What survivors have in common are early intervention with cardiopulmonary resuscitation (CPR) and an automatic external defibrillator (AED), followed by rapid delivery of appropriate care—usually a trip to the emergency room.
An SCA can be caused by:
S Heart attack and other cardiac conditions
S Electrocution
S Asphyxiation (loss of consciousness and death caused by inadequate oxygen in the environment, such as in a confined space)
S Trauma, drowning, overdose, primary respiratory arrests, anaphylactic shock, and other noncardiac conditions
Many victims have no prior history of heart disease and are stricken without warning.
Remember the Four Cs
When someone goes down and suddenly loses consciousness, think the Four Cs: Clear, Check, Call, and Compress.
S Clear the area of other safety hazards. Make sure that the victim and you are safe from further harm.
S Check the victim for responsiveness. Has he stopped breathing or is he gasping irregularly for air? Does he respond at all to a hard slap on the shoulder blades?
S Call for help. If someone else is around, tell her to call 911 and find the nearest AED, if one is available. An AED provides an electric shock that can restore normal rhythm to a heart in ventricular fibrillation.
S Compress the chest hard and fast. Push down straight down on the lower sternum, using one hand on top of the other at the rate of 100 times a minute.
Compressions are the most important part of CPR. Recent American Heart Association (AHA) guidelines no longer require the rescuer to provide lifesaving breaths to the victim because compressions, done properly, will keep the blood circulating throughout the victim’s body. There is enough oxygen in the blood of the victim to keep the heart, brain, and organs alive if it’s circulated through chest compressions, and time spent assessing breathing is better spent compressing. This is known as hands-only CPR.
If you need to provide breaths and medical help isn’t immediately available, then do the following:
S Open the airway with a gentle head tilt and chin lift.
S Pinch the victim’s nose closed.
S Take a normal breath, cover the victim’s mouth with yours to create an airtight seal, and give
two breaths at one-second intervals as you watch for the chest to rise.
Staff Training is Vital
Staff members trained in CPR and the use of an AED can save precious time and improve survival odds because they provide aid before emergency medical service personnel arrive. Basic CPR can be learned in less than a day of training, and many businesses will either sponsor their staff members to attend CPR classes or bring a professional in for the training.
A person trained in CPR and AED use can use roleplay to determine if a victim needs to be treated with chest compressions and airway breaths, and then appropriately conduct the training procedures.
Here’s a step-by-step guide for the latest CPR:
S Slap the victim’s shoulder blades and call out to try to get the victim to respond. If the victim doesn’t respond, gently roll the person onto his or her back.
S Send someone to phone 911 and to get the nearest AED device.
S Start vigorous chest compressions in sets of 100; pause for no more than 10 seconds after two minutes or five cycles—or have someone else take over. Place the heel of your hand on the center of the victim’s chest. Put the other hand on top and interlace the fingers. Press down so you compress the chest at least 2 inches for an adult or a child and 1.5 inches for an infant (with an infant, use only the pressure of two or three fingers). Give compressions of approximately 100 a minute or more (about the
beat of the Bee Gees song “Stayin’ Alive”). Let the chest return to its normal position between compressions.
S Continue compressions until the AED or help arrives.
S When the AED arrives, turn it on and follow the audio prompts.
You Can’t Push Too Hard!
When doing CPR, some rib bones may crack or break if you are correctly compressing the heart.
Ribs are repairable, but when the heart stops, the absence of oxygenated blood can cause permanent brain damage within minutes and death will occur within eight to 10 minutes. For every minute that treatment is delayed, the survival rate drops 10 percent. The earlier CPR or AED is initiated, the greater the chances of survival.
If help is provided within four minutes, chances of survival are doubled. These few minutes can be the difference between life and death
The AHA recommends breaths with compressions for infants and children, victims of drowning or drug overdose, or people who collapse due to breathing problems.
Resources
For more information go to:
S www.heart.org
S www.redcross.org
S www.cpr.heart.org
S www.cpraedcourse.com
NEMA Issues Guides on Evaluating Damaged Electrical Equipment After Natural Disasters and Extreme Weather Events
The National Electrical Manufacturers Association (NEMA) has released five updated resources to help facility owners, inspectors, contractors, and other stakeholders assess electrical equipment damaged by natural disasters and extreme weather events. The guides provide structured evaluation criteria to determine whether affected and essential electrical equipment can be safely returned to service—reducing risk, minimizing unnecessary replacement costs, and supporting faster recovery after emergencies.
“Restoring power safely is critical to helping communities recover and get back to normal after disaster strikes,” said Patrick Hughes, senior vice president of technical affairs at NEMA. “These resources give decision makers clear, technically sound guidance to act confidently after a flood, fire, hurricane, or earthquake, helping restore essential electrical infrastructure so people can return to their homes, workplaces, and daily lives as soon as possible, without compromising safety.”
The NEMA guides include:
S Technical Position on Reconditioned Equipment (NEMA CS 70011-2026)
S Evaluating Water-Damaged Electrical Equipment (NEMA CS 70006-2026)
S Evaluating Fire- and Heat-Damaged Electrical Equipment (NEMA CS 700082026)
S Evaluating Earthquake Damaged Electrical Equipment Guide (NEMA CS 70007-2019)
S Cleaning and Disinfecting Guidance for Electrical Equipment (NEMA CS 700092025)
The guides are aligned with the National Electrical Code (NEC), ensuring the guidance reflects current requirements and uses the same language for all stakeholders: inspectors, contractors, and authorities having jurisdiction who rely on the NEC every day.
The guides provide clear, consistent criteria for evaluating affected electrical equipment, determining when manufacturer consultation is needed, and identifying what can safely return to service versus what needs to be replaced.
The organization is dedicated to advancing the safety, reliability, and performance of electrical products and systems, and these
new publications advance that mission by equipping industry stakeholders with the tools they need to manage risk—from installation through operation and recovery.
“As our world becomes increasingly electrified, the ability to respond quickly and effectively to events that threaten electrical infrastructure has never been more critical. The safety of workers, communities, and the public depends on it,” said Alan Manche, vice president of external affairs at Schneider Electric. “These NEMA resources give professionals in the field the technical foundation they need to make sound, confident decisions to restore power in a way that is both reliable and safe.”
Beyond individual recovery efforts, these guides reinforce something larger: public confidence in the safety and resilience of electrified systems—a foundation on which broader electrification goals depend.
These publications are available via the NEMA Standards and Publications Store at makeitelectric.org. S
View job description: go.ufl.edu/ProgramManager
NOW HIRING
Program Manager, Water Programs
Lead, teach, and help advance Florida’s water industry.
The University of Florida Training, Research, and Education for Environmental Occupations (UF TREEO) Center is seeking a knowledgeable and experienced professional to serve as Program Manager for Water Programs.
This role serves as the lead instructor and outreach coordinator for UF TREEO’s water programs. Responsibilities include delivering high-quality training to water and wastewater professionals, overseeing curriculum development, ensuring regulatory alignment, and building partnerships that support workforce development across the industry.
The position works with licensed operators, engineers, laboratory professionals, utility personnel, regulators, and other industry stakeholders while helping ensure training programs meet certification and continuing education requirements.
This role also includes opportunities to travel throughout Florida for contract courses, emergency response support, professional conferences, and industry engagement.
If you have a strong background in water systems, environmental regulations, and training and development, we invite you to apply and contribute to our mission of delivering essential education to the professionals who protect public health and the environment.
Learn more and apply today.
July 28-30 | Water Distribution Systems Operator Level 1 Training Course
Virtual | $575 | CEUs 2.4 DS DW WW
August 11- 12 | Wastewater Process Control Laboratory Operations Gainesville, FL | $595 | CEUs 01.6 WW
August 17-21 | Wastewater Class B Certification Review Virtual | $720
September 1-3 | Process Control of Advanced Waste Treatment Plants Virtual | $625 | CEUs 2.1 WW
September 9-10 | Pumping Systems Operation & Maintenance Gainesville, FL | $325 | CEUs: 1.6 DS DW WW
September 14-18 | Water Class B Certification Review Gainesville, FL | $720
Aqua-Aerobic Systems has completed extensive development and testing for the removal of PFAS with the new AquaPRS PFAS Removal System. The system consists of a unique separator technology and exclusive, carbon-based sorbent that is up to 600 times smaller than ion-exchange resin or granular activated carbon and 30 times that of powder activated carbon.
The system offers a viable alternative to existing PFAS technologies that can address military remediation applications, industrial discharges, and new and future drinking water and wastewater regulatory requirements. The technology significantly reduces sorbent requirements, which reduces disposal costs to facilitate ultimate removal of PFAS from the environment. The sorption technology can be coupled with pretreatment technologies, such as clarification/filtration, depending on the nature of the drinking water or waste streams. Drinking water is produced from high-quality, particulatefree effluent. In-plant reclamation or remediation efforts can also be attained due to the reduction of in-plant water demands.
Features of the system include a containerized, full-scale AquaPRS PFAS removal system. It utilizes exclusive Aqua PR-206 PFAS removal sorbent and the separator material is five times harder than the sorbent material, operating at a low pressure. It also includes sorption, settling, effluent tanks, feed and recycle pumps, automatic controls, remote process monitoring, and operation.
The system can be used in industrial manufacturing, including chemical, plating, and refining; municipal drinking water; groundwater remediation; landfill leachate with pretreatment; and surface water runoff. (aqua-aerobic.com)
R
Crane Pumps & Systems has introduced its E36 Frame, the latest addition to the envie3 product family. The envie3 series features dry-run submersible sewage pumps designed for versatility and efficiency. These pumps are available with both solids handling and chopper liquid ends, and they can be configured for submersible or dry-pit applications. Equipped with an IE3-rated, premium-efficient motor, envie3 pumps use a closed-loop cooling system to manage heat during operation.
This advanced cooling system keeps the motor cooler, extending the pump’s lifespan, which also allows for a lower minimum submergence compared to traditional oil-filled pumps. As a result, wet wells stay cleaner, and new installations require smaller designs, reducing both maintenance and installation costs. Additionally, the submersible motor provides protection against flooding in dry-pit setups, minimizing damage during high-water events and maximizing uptime.
NEW PRODUCTS
For applications prone to clogs, the envie3 chopper liquid end slices solids into manageable pieces. This prevents clogs in pumps or valves while still enabling solids to be captured by screens.
The new E36 Frame expands the envie3 series with larger discharge sizes, more-powerful motors, and an advanced sensing package. It features discharge sizes up to 12 inches and motors up to 125 horsepower. The innovative motor housing integrates the cooling jacket, eliminating potential leak paths and enhancing reliability. The product also comes with an extensive sensing package for improved monitoring and maintenance. Standard features include winding protection and seal failure sensing, with additional sensors for bearing temperature and vibration. These tools help monitor equipment health and detect potential issues early, offering peace of mind to pump operators. (cranepumps.com)
RThe MD50 Hazen Colorimeter from Thermo Fisher Scientific is ideal for use in municipal and industrial applications. It has an advanced optical system that analyzes the sample in less than three seconds, a green- or red-colored backlight that indicates if a sample is inside or outside method detection limits, and rubberized side panels that increase the durability and field-readiness of the instrument.
Its rugged industrial design, complete with rubber-protected sides and an IP67 rating, ensures unmatched durability and reliability, even in a demanding environment, and the innovative optical system delivers exceptional accuracy and speed, ensuring precise readings in record time.
All MD50 instruments come with preprogrammed methods for different types of reagents. Simply select the test needed, prepare the sample, and test. To simplify test selection, choose the reagent type from the settings and display only the desired methods in the methods list.
The product also allows a user-defined program method using PC software, which saves time by zeroing the instrument once for each sample. When testing a new sample, zero the instrument once and all subsequent tests of that sample do not require rezeroing. It automatically stores the last 100 readings and protocols with a time and date stamp and the results remain in storage, even during a battery exchange.
In the field, the compact size and side protections ensure a firm grip during use. In the laboratory, rubber feet on the bottom of the housing eliminate the need for two-handed operation or chasing the instrument around the workbench. To ensure data quality and integrity, the MD50 creates and saves a protocol for each change made during operation and it has a twoyear warranty. (thermofisher.com)
The HUBER Rotary Drum Fine Screen ROTAMAT® uses a unique system that integrates screening, washing, transport, compaction, and dewatering into a single unit. The throughput of the screen can be customized to meet specific site requirements, depending on the screen bar spacing (0.5 to 6 mm), perforation size (1 to 6 mm), and screen size (with a basket diameter of up to 9.8 feet/3,000 mm). The unit is fully constructed from stainless steel and undergoes acid treatment in a pickling bath for enhanced durability and resistance.
The screen units can be installed directly into channels or provided as tank-mounted units with a 35° inclination. Wastewater flows into the open end of the inclined screen basket and passes through the screen, where floating and suspended materials are retained. As the screen surface becomes clogged, an additional filtering effect is created, allowing solids smaller than the bar spacing or perforation to be captured.
When the upstream water level reaches a certain point due to screen blinding, the basket begins to rotate. The rotating screen drum lifts the screenings and deposits them into a centrally located trough. A scraper brush and spray nozzle bar assist in removing the screenings from the drum. A screw conveyor within the trough rotates in sync with the drum, transporting the screenings through a closed, inclined pipe. The screw conveyor dewaters, compacts, and conveys the screenings, which minimizes odor issues, and discharges them into a customer’s container or a downstream conveying system. (huber.com)
R
Federal Screen Products engineers longlasting and unique strainer baskets for water application needs. The baskets are fabricated individually for specific applications with stainless steel wedge wire and custom-made flanges and housings. The combination of highquality materials, accurate slots, and maximum open areas ensures optimum design for lowwear characteristics, resulting in longer service life. The strainer baskets are a great option for multiple applications where perforated baskets don’t provide a sufficient open area and where mesh-weave baskets aren’t suitable for the required pressure differential. Designed to meet a variety of replacement needs and pressure designs, baskets are available in high-nickel alloys for use in highly corrosive environments, with slot sizes ranging from 0.001 to 0.625 inch. The company specializes in supplying various types of strainers, including those used in self-cleaning, automatic backwashing, and inline Y and T strainers. (federalscreen.com) S
C L A S S I F I E D S
CLASSIFIED ADVERTISING RATES - Classified ads are $22 per line for a 60 character line (including spaces and punctuation), $60 minimum. The price includes publication in both the magazine and our Web site. Short positions wanted ads are run one time for no charge and are subject to editing. ads@fwrj.com
POSITIONS AVAILABLE
Full-time, Part-time or Temporary Work Opportunities!
Woodard & Curran supports utilities that need experienced water/ wastewater treatment operators and maintenance professionals throughout Florida and the rest of the country.
W&C wants to find you a job that works with your schedule! We even have short-term roles that let you mentor younger operators, stay engaged and make an impact – and only when it works for you…No commitment – travel covered – You decide when (or if) you say yes!
Interested in learning more about these opportunities or being added to our operator database? Please reach out to Lizzie Dovich to learn more! Ldovich@woodardcurran.com or 207-558-3906. https:// www.woodardcurran.com/careers/
Chief Utilities Treatment Plant Operator
$71,970 - $101,269/yr.
Utilities Treatment Plant Operator II
$62,171 - $87,479/yr.
Utilities Treatment Plant Trainee or Operator I
$53,705 - $86,314/yr.
Heavy Equipment Operator
$53,705 - $75,567/yr.
Utilities System Operator Trainee, I, II, or III
$44,184 - $75,567/yr.
Utilities Treatment Plants Mechanic I
$51,148 - $71,970/yr.
Lift Station Operator II
$62,170 - $87,478/yr.
Lift Station Operator I
$53,705 - $75,567/yr.
Apply Online At: http://pompanobeachfl.gov
Open until filled
Cypress Creek Restoration Project Completed
The South Florida Water Management District (SFWMD) and Ducks Unlimited, along with Florida Fish and Wildlife Conservation Commission, Palm Beach County, Martin County, and other partners, celebrated the completion of the Cypress Creek Restoration Project.
This project transforms 340 acres of former agricultural lands into a thriving, natural habitat. This important project hydrologically reconnects the Cypress Creek natural area to the Loxahatchee River by restoring historic flow ways and improving over 2,900 acres of wetlands and uplands in Palm Beach and Martin counties.
“Reviving this historic ecosystem is extremely important and I am grateful for our strong partnerships with Ducks Unlimited, Florida Fish and Wildlife Conservation Commission, Palm Beach County, and Martin
County, among many others, to bring this project to fruition,” said Thomas Hurley, SFMWD governing board member. “Together, we are bringing this landscape back to life.”
“We are proud to be working collaboratively with our partners at Cypress Creek Natural Area to restore invaluable wetland habitat,” said Elizabeth Guthrie, manager of Ducks Unlimited Conservation Programs for Florida.
“Through strong partnerships, we’re not just restoring wetlands, we’re ensuring clean water, healthy wildlife and waterfowl populations, and access to public lands for future generations.”
Historically, Cypress Creek was a major tributary feeding fresh water into the Loxahatchee River, one of Florida’s wild and scenic rivers. It flowed into the river just downstream of the Trapper Nelson Camp in Jonathan Dickinson State Park. Over the last
century, the river and its tributaries have been heavily altered, but now, the earthwork portion of this restoration project is complete.
The land was regraded to create natural elevations, marshes, and sloughs. The project also includes backfilling canals and ditches, and installed new water control structures. In addition, this project improves water quality, restores natural flow ways, and revives critical habitats for fish, birds, and other wildlife. S
January
October
November...........Water
December
Technical articles are usually scheduled several months in advance and are due 60 days before the issue month (for example, January 1 for the March issue).
The closing date for display ad and directory card reservations, notices, announcements, upcoming events, and everything else including classified ads, is 30 days before the issue month (for example, September 1 for the October issue).
For further information on submittal requirements, guidelines for writers, advertising rates and conditions, and ad dimensions, as well as the most recent notices, announcements, and classified advertisements, go to www.fwrj.com or call 352-241-6006. Januar y
Continued from page 21
1. B) 2114 gpm.
The reading of a flowmeter in gallons per minute on a 12-inch-diameter water main that is being flushed at a velocity of 6 feet/second is 2114 gpm.
2. B) 4.7 gallons.
The number of gallons needed of 5.25 percent sodium hypochlorite solution to disinfect a well that is 200 feet deep where there is 150 feet of water in the well with a 20-inch-diameter casing and a well screen with a chlorine dose of 100 mg/l is 4.7 gallons.
3. A) 81 gallons.
The number of gallons needed of 5.25 percent of sodium hypochlorite solution needed to disinfect 800 feet of an 18-inch-diameter water main with a chlorine dose of 400 mg/l is 81 gallons.
4. C) 490 gallons.
The number of gallons needed of 12 percent sodium hypochlorite solution to disinfect a service storage tank with a chlorine dose of 100 mg/l that is 100 feet in diameter and 10 feet deep is 490 gallons.
5. A) 120 gallons.
The number of gallons of hypochlorite solution pumped by a hypochlorinator when it’s held within a croc with a diameter of 3.5 feet and the solution level drops 20 inches is 120 gallons.
6. B) 1.2 percent.
The desired strength (as a percent of chlorine) of a hypochlorite solution pumped by a hypochlorinator delivering 100 gallons per day into water treated at a chlorine feed rate of 10 pounds of chlorine per day is 1.2 percent.
7. C) 16.3 gallons.
The number of gallons of water that is to be added to 7 gallons of 5 percent hypochlorite solution to produce a 1.5 percent hypochlorite solution is 16.3 gallons.
8. B) 5670 gallons.
The number of gallons of water that will flow through a meter with a flow rate of 9 gallons per minute in 10 hours and 30 minutes is 5670 gallons.
9. A) 23 hours and 30 minutes. The time it will take to fill a chemical solution tank that is 20 feet in diameter and 6 feet deep when it is being filled at a rate of 10 gallons per minute is 23 hours and 30 minutes.
10. C) 99.4 percent.
The accuracy of a water meter as a percentage, given that the meter reads 315 gallons per minute where the actual tested volume is 6 feet of water within a 3-feet-diameter tank, is 99.4 percent.
Bioactiflo™ Can Handle Wet Weather
The Bioactiflo™ system consists of the compact Actiflo® clarification process coupled with rapid soluble BOD uptake achieved when return activated sludge is combined with raw wastewater under aerobic conditions.