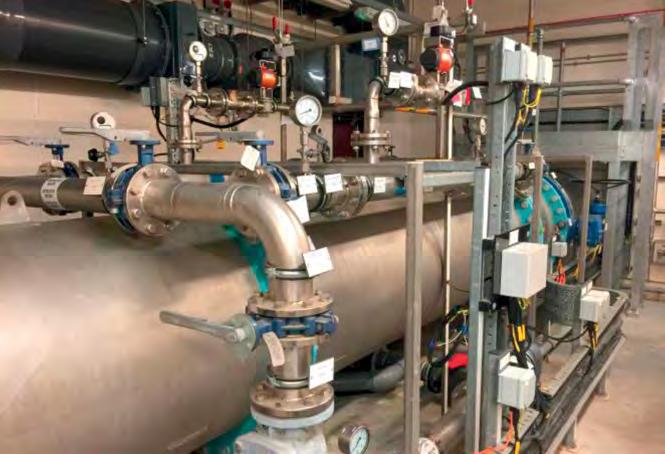
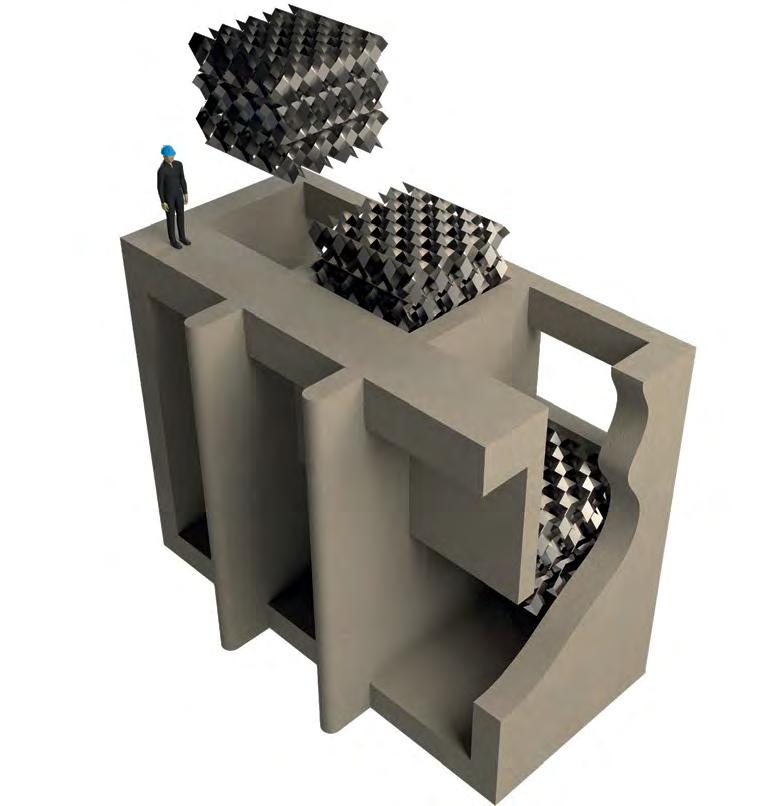
Static Mixing Technology with proven benefits
Through experience, innovation and inspiration Statiflo continues to strengthen its reputation as the world leaders in the design and manufacture of static mixers, channel mixers, gas dispersion systems and associated technologies.
Statiflo Motionless Mixers offer many key benefits for chemical dosing applications. They are efficient and economical, delivering precise, predetermined results every time.
Key benefits include:
• Highly efficient mixing meaning a low pressure drop and a short overall length
• Continuous performance over a wide flow range
• Reduced chemical consumption
• Available in all sizes and materials
• Custom designed for each application
• CFD verification is available
Editor’s Office and Advertiser Information:
Florida Water Resources Journal
1402 Emerald Lakes Drive
Clermont, FL 34711
Phone: 352-241-6006
Editorial, editor@fwrj.com
Display and Classified Advertising, ads@fwrj.com
Business Office: 1402 Emerald Lakes Drive, Clermont, FL 34711
Web: www.fwrj.com
General Manager: Michael Delaney
Editor: Rick Harmon
Graphic Design Manager: Patrick Delaney
Mailing Coordinator: Buena Vista Publishing
Published by BUENA VISTA PUBLISHING for Florida Water Resources Journal Inc.
President: Richard Anderson (FSAWWA) Peace River Manasota Regional Water Supply Authority
Vice President: Joe Paterniti (FWEA) Clay County Utility Authority
Treasurer: Rim Bishop (FWPCOA) Seacoast Utility Authority
Secretary: Rim Bishop (FWPCOA) Seacoast Utility Authority
Moving?
The Post Office will not forward your magazine. Do not count on getting the Journal unless you notify us directly of address changes by the 15th of the month preceding the month of issue. Please do not telephone address changes. Email changes to changes@fwrj.com or mail to Florida Water Resources Journal, 1402 Emerald Lakes Drive, Clermont, FL 34711
Membership Questions
FSAWWA: Casey Cumiskey – 407-979-4806 or Casey@fsawwa.org
FWEA: Laura Cooley, 407-574-3318, admin@fwea.org
FWPCOA: Darin Bishop – 561-840-0340
Training Questions
FSAWWA: Donna Metherall – 407-979-4805 or Donna@fsawwa.org
FWPCOA: Shirley Reaves – 321-383-9690
For Other Information
FDEP Operator Certification: Ron McCulley – 850-245-7500
FSAWWA: Kim Kowalski – (407) 979-4814
Florida Water Resources Conference: 267-884-6292
FWPCOA Operators Helping Operators: John Lang – 772-559-0722, oho@fwpcoa.org
FWEA: Laura Cooley – 407-574-3318, admin@fwea.org
Websites
Florida Water Resources Journal: www.fwrj.com
FWPCOA: www.fwpcoa.org
FSAWWA: www.fsawwa.org
FWEA: www.fwea.org and www.fweauc.org
Florida Water Resources Conference: www.fwrc.org

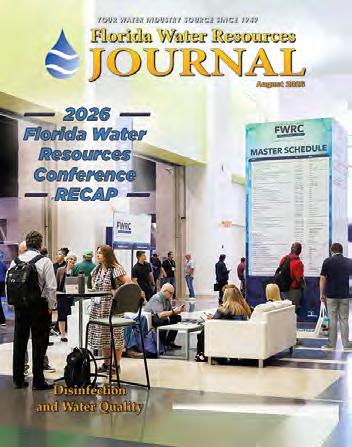
2026 Florida Water Resources Conference Recap
News and Features
Columns
Technical Articles
Can be Removed From Drinking Water— Viraj deSilva, Barbara Martinez, and Dilrika Weerapperuma 78 Screening Corrosion Control Inhibitors Using Traditional and Alternative BenchScale Methods—Sam Laing and Steven J. Duranceau
Education and Training
AWWA Promotes 2026 Source Water Protection Week
The American Water Works Association (AWWA) invites water utilities, its sections, and other partners to join in recognizing Source Water Protection Week, to be held this year from September 27 to October 3.
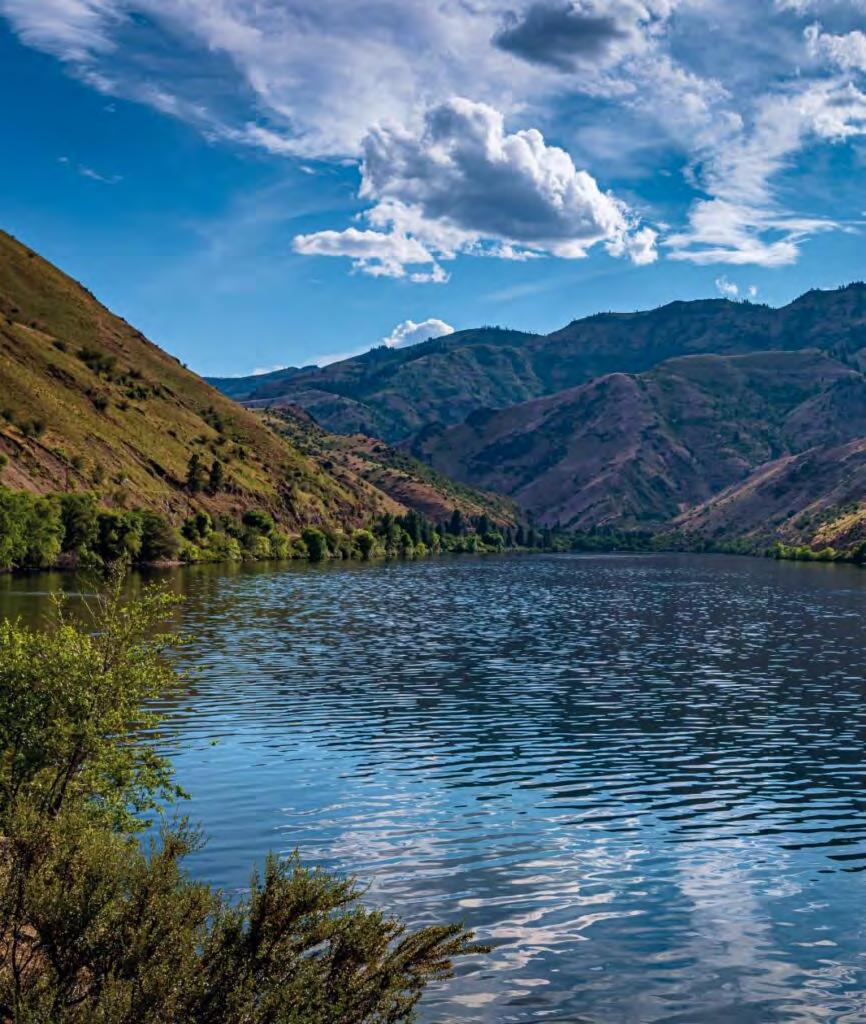
The week is dedicated to “Protect the Source,” emphasizing that keeping rivers, lakes, and underground wells free from pollution is the best way to ensure high-quality, safe drinking water. Protecting sources reduces treatment costs, improves public health, and strengthens consumer confidence
Throughout the week, AWWA will be raising awareness about the importance of caring for drinking water sources in the United
Why Source Water Protection Week?
The best way to assure there is high-quality drinking water at the tap is to protect all water sources. If rivers, lakes, and underground wells are free from pollution, it’s easier and less expensive to keep water safe and healthy.
Source Water Protection Week Materials
The association has a reservoir of information to help utilities, consumers, and others advance the protection of source water
What You Can Do
Whether you’re a water utility professional, a business leader, or a drinking water consumer, there are easy ways to protect water sources.
Ideas for Utilities
S Prepare an official proclamation declaring September 27 to October 3 as Source Water Protection Week in your community.
S Share a copy or link to your local source water assessment and/or protection plan, along with guidance on how to ask questions or provide feedback.
S Post information on social media related to drinking water sources and source water protection. Encourage viewer engagement through comments and interactive content.
S Take part in the #ShowYourSource social media contest.
S Share educational materials about source water protection; examples could include training courses, webinars, workshops, and K-12 school programs. The Source Water Collaborative Learning Exchange is a great place to start.
S Issue a newsletter, press release, or TikTok video that focuses on the importance of source water protection, how the utility approaches it, and actions everyone can take to protect drinking water supplies.
S Hold a poster, photo, or essay contest for kids to show what source water protection means to them.
S Host a live or virtual watershed tour to help people connect land use activities to the quantity and quality of water for drinking water supplies.
S Connect with local watershed and conservation organizations to discuss ways to partner on source water protection efforts.
S Host and/or participate in community volunteer activities that protect the environment, such as watershed cleanups, stenciling stormwater drains, and planting trees or riparian buffers.
Continued on page 6

S Consider applying for the AWWA Exemplary Source Water Protection Award.
S Get your operational guide to AWWA Standard G300, Source Water Protection and the AWWA Standard G300-22, Source Water Protection.
Ideas for Customers
S Manage household hazardous waste properly (cleaners, paints, vehicle fluids, fertilizers, pesticides, etc.). Only purchase what you need. Donate unused portions to friends or community organizations. Recycle leftovers when possible. To find recycling/disposal locations visit earth911. com or call 1-800-CLEANUP.
S Avoid dumping. Never put anything down the sink, toilet, or storm drain, as it can end up in drinking water sources. Dispose of cleaners, medicines, oil/grease, etc., properly.
S Pick up after yourself and your pets. Use trash receptacles and recycle whenever possible. Pet waste can enter storm drains and spread bacteria.
S Use alternative products. Avoid using products that may contain harmful materials, such as per- and polyfluoroalkyl substances, or other contaminants. Use cast iron or stainless steel pots and pans instead of nonstick ones.
S Identify your source of water and check where you live and work relative to source water areas. An example tool that can be used to find this information in the U.S. is the Drinking Water Mapping Application to Protect Source Waters (DWMAPS), which can be found on the U.S. Environmental Protection Agency website at epa.gov.
S Conserve water. Use water efficiently to ease the burden on water sources and save money. Repair leaks, use a rain barrel, install low-flow devices to toilets and showers, wash full loads of laundry and dishes, etc. For more steps to save water visit WaterSense at epa.gov.
S Limit use of fertilizers and pesticides. Reduce the amount of materials used on your lawn or consider natural alternatives.
S Service your septic system. Have a professional inspect your septic system every three years and have it pumped every three to five years.
S Participate in volunteer activities. Attend events, such as removing invasive plants and replanting native ones, stormwater drain stenciling, rain barrel workshops, litter cleanups, etc. Watershed groups are often familiar with upcoming local events.
S If you see something, say something. Report any spills, illegal dumping, or suspicious activity to authorities.
Ideas for Nongovernmental Organizations and Other Groups
S Prepare an official proclamation declaring Sept. 27 – Oct. 3, 2026, as Source Water Protection Week in your community.
S Partner with your local water utility on Source Water Protection Week plans and actions.
S Post information to social media related to drinking water sources and source water protection and how your organization works to protect water quality and drinking water sources.
S Encourage viewer engagement through comments and interactive content.
S Recognize a person or organization in your community who is a source water protection champion (#SourceWaterChampions).
Ideas for Businesses
S Report spills immediately to proper authorities.
S Follow regulations and permit requirements applicable to your business.
S Demonstrate your business’s commitment to environmental stewardship by following industry environmental best practices.
S Join your local emergency planning committee to form partnerships and increase resources for hazardous materials preparedness.
S Develop plans and procedures to respond to emergency events, such as spills, extreme weather, etc.
S Train employees on emergency response plans and procedures, spill prevention, and environmental best practices.
S Properly store and secure chemicals, cleaners, oils/fuels, and other potentially hazardous materials. Inspect the systems regularly, including secondary containment, and cap or reroute floor drains where needed.
S Employ conservation measures to ease the burden on water supplies and reduce water waste.
S Identify your local water utility and check your location(s) relative to source water areas.
S Host a company volunteer day and/or encourage employees to participate in volunteer opportunities for watershed protection.
Why It Matters
Source water protection is a cost-effective, sustainable strategy that addresses water quality concerns before treatment, supports environmental health, and fosters collaboration among upstream landowners, utilities, and regulators.
More Information
To download Source Water Protection Week materials, go to awwa.org/ communications-and-outreach/source-waterprotection-week. S
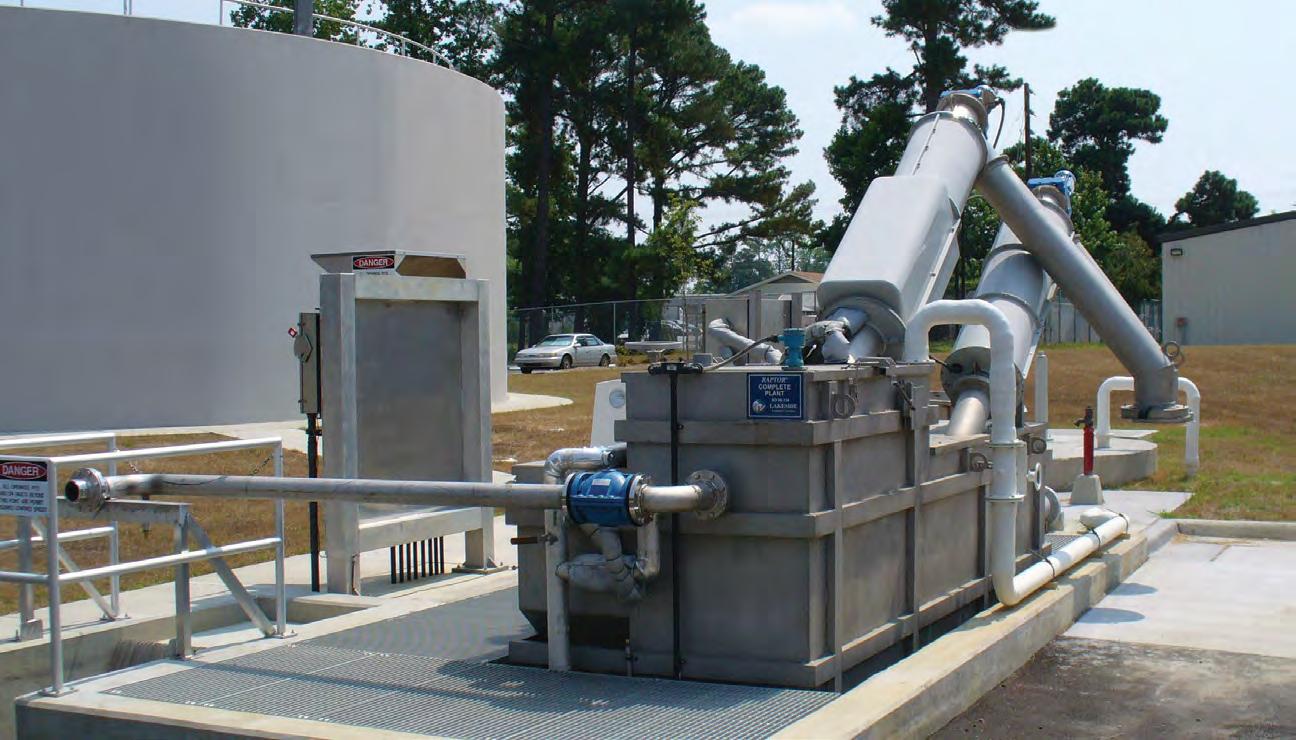
Grow your septage, FOG, and sludge receiving business with a Raptor Septage Acceptance or Complete Plant.
Trippensee Shaw, Inc.
Eustis, Sebring, & Mount Dora, FL T: 407-222-0575 www.TrippenseeShaw.com
Florida Panhandle Only
T: 205.424.7570 www.eshelmancompany.com
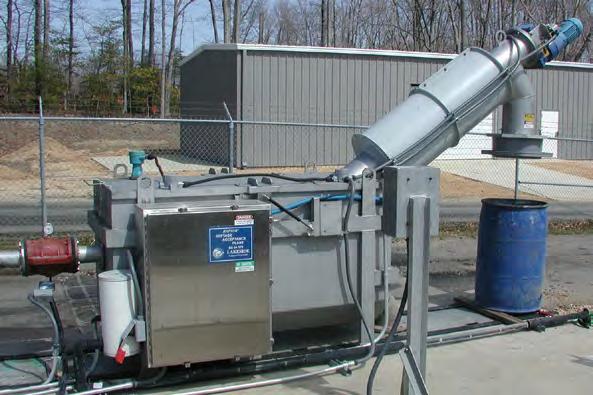
NOT YOUR ORDINARY RECEIVING SYSTEM
Raptor
Septage Acceptance Plant
Removes debris and inorganic solids from municipal and industrial septage, FOG, and sludge. This heavy-duty machine incorporates the Raptor Fine Screen for screening, dewatering and compaction. Accessories include security access and automated accounting systems.
Raptor Septage Complete Plant
With the addition of aerated grit removal, the Septage Acceptance Plant is offered as the Raptor Septage Complete Plant.
Cleaner Water for a Brighter Future®
Speak to one of our experts at 630.837.5640 or email us at sales@lakeside-equipment.com for more product information.
FSAWWA at 100: Historic Water Treatment Landmarks: A Three-Part Series
100 years goes faster than you think!
As the Florida Section of the American Water Works Association (FSAWWA) celebrates its 100th anniversary, the organization is reflecting on the remarkable legacy of Florida’s oldest water treatment facilities—plants that have safeguarded public health, supported economic growth, and shaped the state’s development for more than a century.
This three-part series honors historic water treatment facilities across Florida, each of which has provided continuous service for 100 years or more. From early coastal waterworks to inland groundwater systems and major metropolitan treatment plants, these facilities represent the foundation upon which Florida’s modern water infrastructure was built.
Miami-Dade Water and Sewer District: An Historical Narrative of the Hialeah Water Treatment Plant
When you step through the arched
limestone entryways of the Hialeah Water Treatment Plant, you feel the weight of nearly a century of Miami-Dade history pressing gently, but unmistakably, against the present. The plant is not a relic frozen in time; it is a living, breathing piece of infrastructure that has served south Florida through booms, storms, and sweeping demographic change. It stands as a reminder that public works were once built not only for function, but also for civic pride.
Origins in a Transformative Era
The story of Hialeah begins in the early 1920s, when Miami was transforming from a modest coastal town into a rapidly growing metropolis. Water demand was rising, saltwater intrusion threatened existing wells, and the region needed a dependable, modern supply. The roots of the system stretched back to Henry Flagler’s early Miami Water Company, but by 1924 the City of Miami recognized the need for a major new facility.
That year, the Miami Water Company and
the city’s electric facilities were acquired by American Power and Light and merged into Florida Power & Light. Amid this transition, Miami officials developed the Hialeah Water Treatment Plant, which entered service in 1925. At the time, it was celebrated as the largest well water softening plant in the United States—a $1 million civic investment that signaled Miami’s ambitions.
A Facility Built With Purpose and Beauty
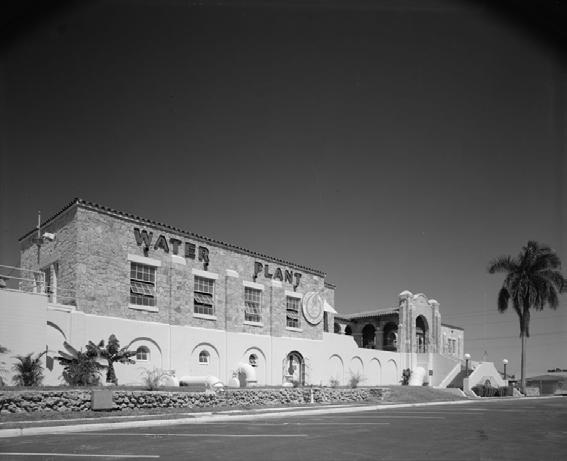
Unlike many industrial sites of its era, Hialeah was designed to be seen. Its Spanishstyle architecture, open-arch superstructure, and the use of limestone excavated directly from the site, reflected a belief that essential infrastructure could also be aesthetically meaningful. The plant’s layout and structure still reveal the story of its growth—each expansion layered onto the last as Miami’s population surged.
Continued on page 10
A photo (circa 1930) of the Miami-Dade County Water and Sewer Department Hialeah Water Treatment Plant showing the west side and south front of the building. (source: Library of Congress)
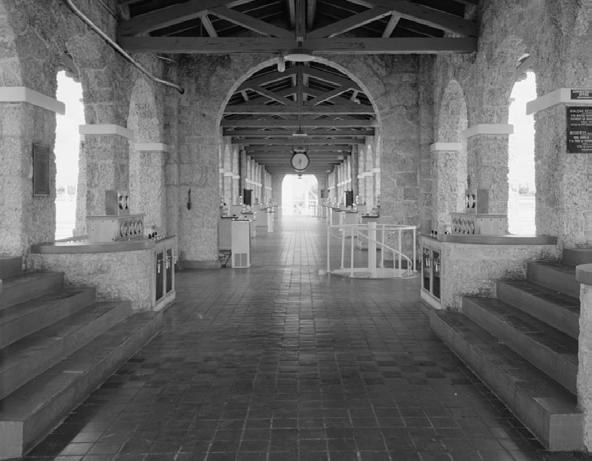
A photo (circa 1930) of the Miami-Dade County Water and Sewer Department Hialeah Water Treatment Plant interior hallway. (source: Library of Congress)

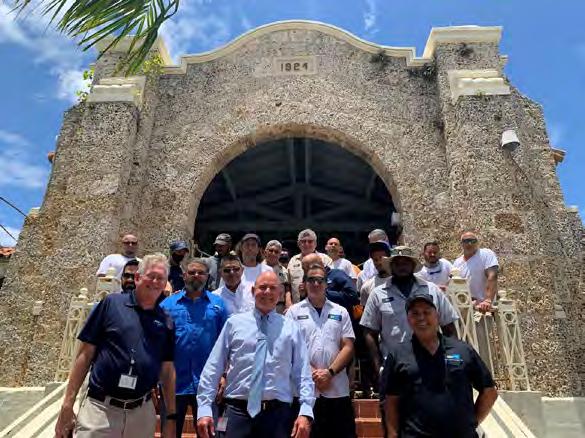
Roy Coley (first row, center), Miami-Dade County deputy mayor and former Miami-Dade Water and Sewer Department director, stands with Hialeah Water Treatment Plant staff at the facility’s main entrance. The entrance is an open-arch superstructure designed with Spanish-style architecture elements using limestone excavated from the property.
Continued from page 8
Decades of Expansion and Adaptation
Hialeah’s evolution mirrors the region’s explosive development. Its milestones tell a story of constant adaptation:
S 1925: The plant begins operation with a capacity of10 million gallons per day (mgd).
S 1926: Capacity doubles to 20 mgd, an early sign of Miami’s rapid growth.
S 1928–1931: Additional improvements maintain the 20-mgd capacity while expanding treatment infrastructure.
S 1935–1937: Capacity increases to 40 mgd, reflecting the city’s continued expansion.
S 1947: A major upgrade brings the plant to 60 mgd, adding new wells, settling capacity, and a lime kiln that allowed residuals to be recycled back into the treatment process.
These expansions were not merely technical upgrades—they were lifelines for a region whose population was growing faster than almost anywhere else in the United States.
Changing Ownership and Integration Into a Regional System
O wnership of the water system shifted several times as Miami matured. In 1941, the City of Miami purchased the Miami
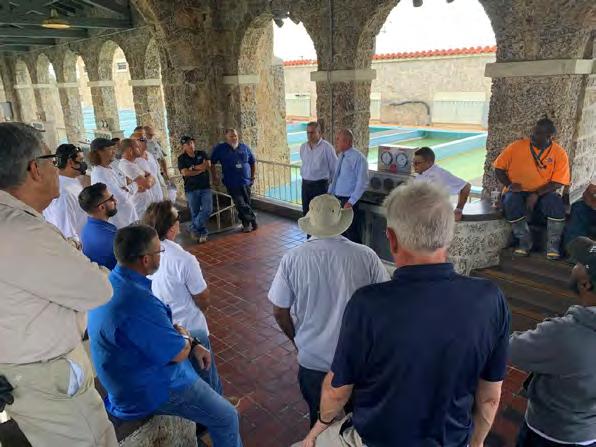
Roy Coley (center, in tie) speaks with facility staff in the filter gallery about the importance of this plant to the county for the last 10 decades. With the critical upgrades and modernization projects currently being executed, the plant will be delivering reliable, high-quality water to the community for generations to come.
Water Company from Florida Power & Light, consolidating control of the water supply. Three decades later, in 1973, the creation of the Miami-Dade Water and Sewer Authority brought Hialeah into a countywide system. The authority became a county department in 1983, and in 1993 it was renamed the MiamiDade Water and Sewer Department, the organization that operates the plant today.
A Historic Landmark With Modern Responsibilities
Hialeah’s architectural and historical significance has been recognized nationally, including documentation in the Historic American Buildings Survey at the Library of Congress. Despite its heritage status, the plant remains a fully active drinking water facility— one that must balance public interest with the security requirements that intensified after 9/11.
Today, Hialeah maintains a treatment capacity of 60 mgd, serving approximately 320,000 residents. It operates in tandem with the Preston Water Treatment Plant as part of an interconnected regional system, but it retains its own distinct identity and community role.
The People Behind the Plant
If the plant’s architecture tells the story of its past, its people tell the story of its present. Hialeah’s operations and lime plant staff run the facility around the clock, supported by specialized teams—structural and
electrical crews, well mechanics, instrument technicians, filter mechanics, diesel teams, and tank cleaning crews—that serve both Hialeah and Preston.
Historic staffing records from the 1930s and 1950s show how the workforce evolved as the plant expanded and treatment processes became more sophisticated. What began as a small municipal operation grew into a complex, multidisciplinary facility that reflects the technological and organizational progress of the water industry.
A Living Legacy
Perhaps the most remarkable aspect of the Hialeah Water Treatment Plant is its ability to evolve without losing its identity. It has weathered population surges, environmental challenges, and shifts in governance. It has expanded, modernized, and adapted while retaining the architectural character and civic spirit with which it was built. Hialeah is not a museum piece, but an historic facility that still produces high-quality drinking water every day—a bridge between Miami’s past and its future. It stands as a testament to the foresight of early planners, the craftsmanship of its builders, and the dedication of generations of water professionals who have kept it running. In the arches of its limestone walls and the hum of its modern equipment, you can hear both the echoes of 1925 and the steady pulse of a city that continues to grow.
More historic photos of the plant can be found at loc.gov/resource/hhh.fl0329. photos?st=gallery. S
Normalization of Deviance: Eroding Safety, Compliance, and Cultur e in Water Operations
Kevin Shopshire President, FWPCOA
merican sociologist Diane Vaughan defines “normalization of deviance” as the process where a clearly unsafe practice becomes considered normal if it does not immediately cause a catastrophe.
Normalization of deviance occurs when deviations from established rules, standards, or best practices are repeatedly tolerated without immediate negative consequences, leading these risky behaviors to become culturally accepted as normal.
The concept was first articulated by Vaughan in her analysis of the 1986 Space Shuttle Challenger disaster, where NASA personnel gradually accepted technical risks that were initially recognized as unsafe.
Normalization of Deviance: In Action
This is a phrase that is new to me, courtesy of a safety video I watched this morning. This can be a byproduct of the “git ‘er done” mentality, or just a gradual process of acceptance. How many little things are done incorrectly, but without negative effects, until a catastrophic event or accident occurs?
Look around.
Are your coworkers working in wastewater with a tear in their gloves (or no gloves) since it’s just a quick fix? Are their safety glasses on top of their head, because again, it was just a quick project?
When you saw this, did you say something? Or did you just accept that is wasn’t a big deal. If you didn’t say something, you “normalized the deviance.”
The next time, they (or you) leave the gloves and/or glasses in the pocket or truck, the next time, they (or you) may not even take gloves or glasses to the worksite, since again, it’s just a quick process. Plus, it’s really hot out and the sweat gets in your eyes.
How long until this normalized behavior is observed by a new employee, who then thinks, “this is how it’s really done.”
How long until something negative happens?
There are many, many safety examples that could be presented, and this is just one.
Another one is seatbelts: do you use them? All of the time? How about turn signals? Did you just glance down quickly at the text that came in?
Again, so many examples. With the driving examples, I recently heard a lawyer commercial, reminding us that our children are watching our driving habits, and remembering them. Normalization.
What about collecting samples? Have you read sampling protocols, or just listened to another employee that’s been “doing it for years.” I mean no disrespect to experienced operators; they know their trade. I understand that as operators, you are required to prove, by examination, that you know the correct methods, procedures, policies, etc., to obtain licensure.
One day though, they may have cut a corner in a procedure that got them the same result, without harm or foul. Then another.
Were you an operator trainee, following an experienced employee around your plant? Have you compared your verbally trained procedure to the state of Florida sampling procedures? If you have not followed the procedure, and documented and collected properly, the sample does not even exist in the eyes of the state, and you may have just put your facility in violation.
The state does not accept “normalization of deviance” as an acceptable response to permit violations. I sincerely doubt the Occupational Safety and Health Administration or insurance inspectors accept it either.
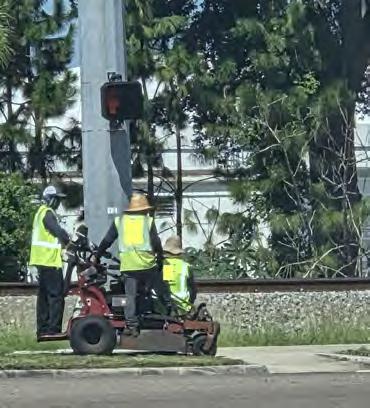
In the photo I’ve included, I wonder what the normalization of deviance was that led to this: Three people on a walk-behind mower, riding down a sidewalk (not slowly) along a major highway. They did proceed to cross the six-lane highway after the photo was taken, all on the mower. It has been normalized.
FWPCOA Committee Spotlight: Publicity Committee
The purpose of the Publicity Committee is to develop and sustain a public relations effort to inform the public about FWPCOA. This committee establishes contact with editorial staffs to arrange for favorable publicity for the association through newspapers, periodicals, and other means. It should be particularly active immediately prior to and during the annual and regional short schools. This exposure builds credibility and public acceptance to better educate the public on the objectives and advantages of the association and of our field.
One of the items managed by this committee is promoting and supporting municipalities in recognizing August as “Water Professionals Month.” Every region reaches out to its municipalities in requesting proclamations, and many municipalities offer to issue the proclamations in open council meetings. If you’re interested, reach out to your region to get involved, especially if it’s your municipality! If you’d like to get involved with the Publicity Committee at the state level, contact the chair, Mr. Jonathan Torres, at publicity@fwpcoa.org.
You’ll probably be reading this just as our Education Committee and board of directors meetings are held during the short school in Fort Pierce. If you’re not there, stay tuned for the next Education Committee and board of directors meetings in October.
I hope to see you there! S
From Source to Tap: How Microplastics Enter and Can be Removed From Drinking Water
Viraj deSilva, Barbara Martinez, and Dilrika Weerapperuma
Microplastics (MPs) are plastic pieces smaller than 5 mm that can be harmful to aquatic wildlife. In addition to wildlife impacts, due to possible toxicity associated with their polymeric composition, additives, and other compounds or microorganisms adsorbed on their surface, MPs are an emerging public health concern. Moreover, nanoplastics (NPs) cross the placental and blood-brain barriers and have been linked to inflammation and cardiovascular risk, but dose-response data in humans remain sparse. A global protocol is needed to harmonize results and build a hypothesis on human health risk, as high variability throughout testing methods in the studies, and lack of data, such as size and composition of the particles, complicate the comparison of the findings.
Microplastics Legislation in the United States
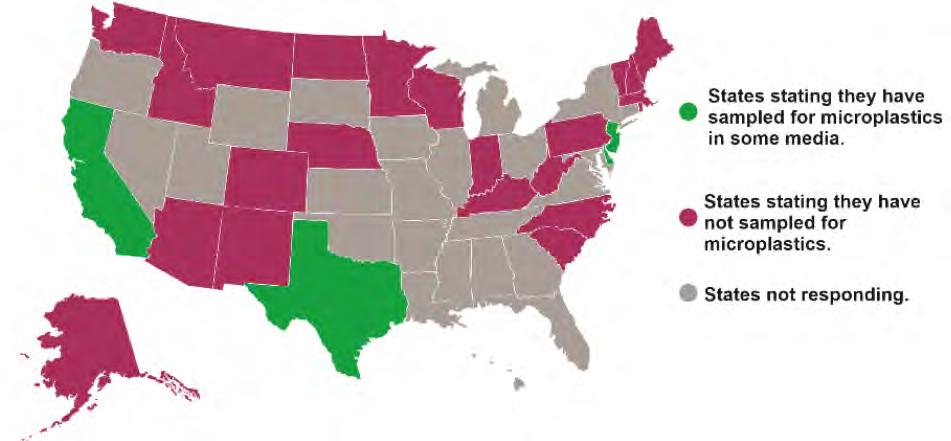
The map in figure 1 illustrates how states in the U.S. reported their activity on MPs sampling. The states in green indicate they have sampled MPs in at least one type of environmental medium, though only a small,
scattered group of states, such as California, Texas, and a few in the Mid-Atlantic, fall into this category. The states in magenta have not conducted any MPs sampling, comprising much of the North, parts of the West, Alaska, and large portions of the East Coast and Southeast. The states in gray did not respond to the survey, leaving their sampling status unknown; these are primarily located in the interior West, Midwest, and portions of the South and New England. Overall, relatively few states report MPs sampling, while most either have not sampled or did not provide information.
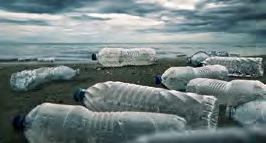
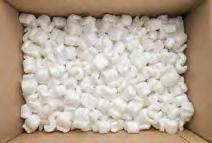
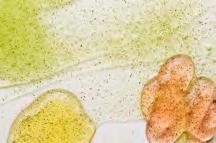
The MPs are smaller than 5 mm and larger than 1 micron. Figure 2 illustrates six common physical forms of plastic pollution. At the top are fibers, shown as colorful yarnlike strands; pellets, represented by small blue plastic granules being handled in bulk; and films, depicted as thin, pastel-colored plastic sheets or bags. The bottom row shows fragments, illustrated by broken plastic bottles scattered in water; foam, represented by white packing peanuts filling a box; and microbeads, shown as tiny, round plastic particles under magnification. Together, these pictures
Viraj deSilva, Ph.D., P.E., BCEE, is vice president and national practice leader, emerging contaminants, with Tetra Tech Inc. in Tampa. Barbara Martinez, E.I., is project engineer with Freese and Nichols Inc. in Jacksonville. Dilrika Weerapperuma, Ph.D., P.E., is president with Environmental Solutions in Tampa.
highlight the many shapes plastic can take as it enters and persists in the environment. The MPs can be of different polymer types, sizes, and shapes and may enter water treatment plants (WTPs) via various processes, including degradation and fragmentation of larger plastics and use of cosmetic products containing microbeads. Additionally, many industries discharge wastewater containing MPs produced during manufacturing into water bodies. A 2019 study of different sites across surface water and sediments in Tampa Bay showed an abundance of MP particles, with average concentrations of 0.94 (±0.52) MP particles per liter (MPP/L) in discrete water samples, 4.5 (±2.3) MPP/m³ in plankton net samples, and 280 (±290) MPP/kg in surface sediments. Figure 3 shows several major sources of MPs entering the environment. Larger plastic products, such as bottles, are broken down into tiny pieces by ultraviolet radiation and wave action. Clothing made from synthetic materials sheds fine plastic fibers that wash into waterways. Industrial plastic pellets, or nurdles, can spill and fragment them into small particles. Personal hygiene products, like toothpaste, shower gel, and face wash, may contain tiny plastic microbeads that are rinsed down the drain. All of these sources contribute to a pool of colorful MP pieces less than 5 mm in size that accumulate in aquatic environments.
Getting Microplastics in the Human Body
Figure 4 highlights the main pathways
Figure 1. Microplastics legislation in the United States.
through which MPs enter the human body. They can be ingested through drinking water—originating from contaminated sources, packaged in plastic bottles, and delivered via pipes—and through food, including seafood-like fish and shellfish, as well as salt and other food items. Additionally, MPs enter the body via application and inhalation. This includes exposure to glitter particles, dust, and aerosols suspended in the air, and microbeads found in cosmetics, such as toothpaste, makeup, and lotions. Together, these pathways illustrate the diverse routes by which MPs can impact human health.
The MPs may affect the body in several potential ways. Physically, most larger particles likely pass through the gut, but very small ones, especially NPs, might cross the gut wall and reach the bloodstream or organs, where laboratory studies show they can trigger inflammation, oxidative stress, and cell damage at high doses. Chemically, plastics carry additives, like plasticizers, flame retardants, and colorants, some of which are known or suspected endocrine disruptors, that could leach out in the digestive system, though real-world amounts are still uncertain. In addition, MPs can act like sponges by picking up pollutants and microbes, such as heavy metals, persistent chemicals, and bacteria, but it’s not yet clear how much this increases human exposure through drinking water.
Orb Media’s first U.S. survey (159 global samples; 33 from major U.S. cities) found plastics in 94 percent of taps, with a mean of ~5.5 MPP/L, as show in Figure 5. Most were textile microfibers; however, the reviewed studies (n = 21) showed the presence of MPs in tap water and bottled water, with the concentration being higher in bottled water than in tap water and increasing by decreasing particle size. Newer studies have also found that regular bottled water users ingest up to 90,000 more MP particles per year than those that mainly drink tap water. Additionally, the lower MP abundance in tap water than in natural sources indicates a high removal rate of MPs in WTPs. This evidence should encourage consumers to drink tap water instead of bottled water to limit their exposure to MPs and also produce less plastic waste.
A coastal seawater desalination plant in Saudi Arabia using reverse osmosis (RO) experienced increasing turbidity and membrane fouling caused by MP fibers and fragments from marine and wastewater sources. These particles clogged intake screens,
Continued on page 16


Fibers Pellets Films
Fragments Foam Microbeads
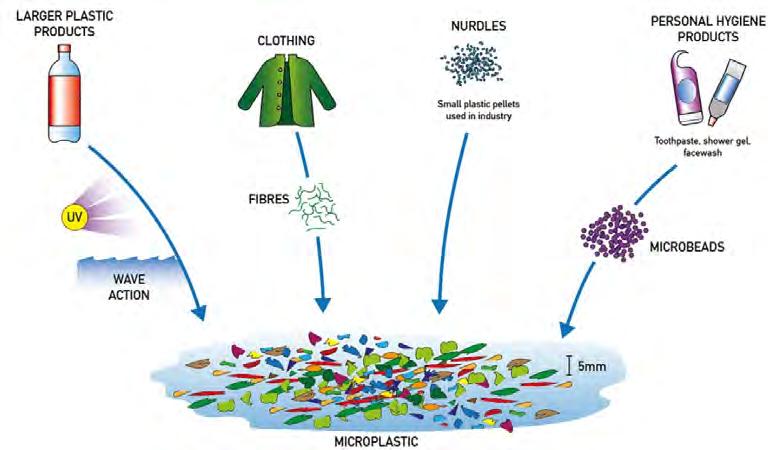
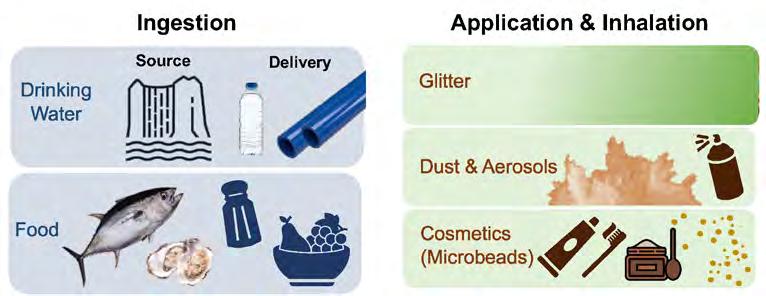
Figure 2. Types of microplastics.
Figure 3. Microplastic production.
Figure 4. Microplastic exposure pathways.
disrupted dissolved air flotation, and in some cases, fragmented into submicron sizes capable of RO membranes. To address this, the plant implemented a hybrid pretreatment system—including coagulation with dissolved air filtration, dual-media filtration, and ultrafiltration—that reduced RO fouling by 40 to 60 percent, eliminated detectable microplastics in the permeate, and stabilized energy use by reducing cleaning frequency.
Microplastics Exposure to Source Water
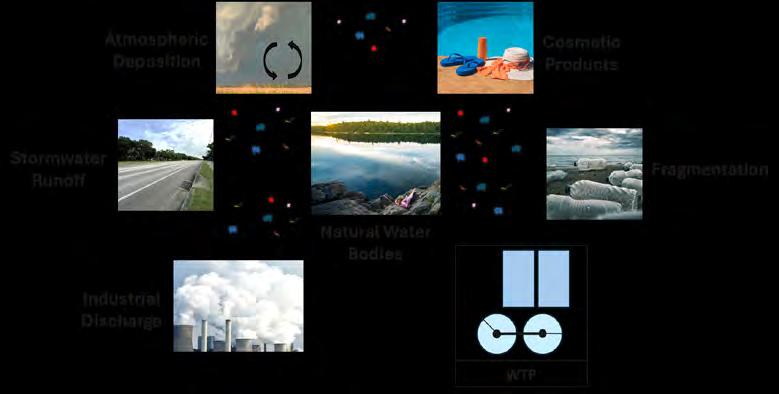
Figure 6 shows the various sources and pathways through which microplastics enter
natural water bodies and their subsequent treatment. Microplastics are introduced into aquatic environments via atmospheric deposition, where airborne particles settle onto water surfaces. Cosmetic products contribute microplastics through personal care items that wash into water systems. Stormwater runoff transports pollutants from urban areas into rivers and lakes, while fragmentation shows the breakdown of larger plastic waste into smaller microplastic particles. Industrial discharge also releases contaminants into water bodies. These microplastics accumulate in natural water bodies, such as lakes and rivers, where they may eventually be processed by WTPS to reduce pollution levels.
Removal of Microplastics in Water Treatment Processes
How can MPs be removed from drinking water? The WTPs, where they exist and are optimized, are considered highly effective in removing particles of similar characteristics and sizes as MPs. Drinking water treatment has proven effective in removing far more particles of smaller size and at far higher concentrations than those of MPs. Conventional treatment optimized to produce treated water of low turbidity can remove particles smaller than a µm. Advanced treatment can remove even smaller particles; for example, nano- and ultrafiltration can achieve 87.3 to >99.9 percent removal of MPs, as shown in Figure 7.
Microplastics in Bottled Water
A study in 2017 was conducted to identify the presence of MPs in 27 different lots of water bottles from 11 different brands purchased in different countries (Table 1). These samples showed that 94 percent of the bottles possibly contained MPs, but only the MPs in the >100-µm size range were able to be confirmed as polymeric material using infrared analysis, resulting in an average of 10.4 MPP/L. The results from the confirmed MPs can be compared to the results of a 2017 study on tap water, which identified MPs of size >100 µm in globally sourced tap water and showed an average density of 5.45 MPP/L, almost half of the density found in water bottles. More-recent studies on different U.S. bottled water brands found densities as high as 10⁵ MPP/L, accounting for a whole range of particle sizes.
Summary
Plastic pollution poses a significant and growing threat to human health, underscoring the urgent need for a standardized global protocol on microplastics. As part of comprehensive water safety planning, water suppliers should optimize treatment processes to strengthen both particle removal and microbial protection—steps that simultaneously enhance microplastic removal. California’s systematic approach to sampling and testing microplastics in drinking water provides a strong model for how to tackle this challenge effectively. Although U.S. tap water is not free of MPs, current evidence indicates it contains
Figure 5. Microplastic particles of sizes >100 µm density across individual bottles and tap water.
Figure 6. Microplastics polluting pathways to source water.
orders-of-magnitude fewer particles than most major bottled brands. Until national standards and monitoring requirements are established, limiting the use of plastic water bottles and relying instead on a high-quality household filter, paired with a reusable bottle, remains a simple way to reduce daily plastic exposure.
The WTPs already remove substantial portions of microplastics through conventional methods, with even greater effectiveness achieved through advanced processes, such as nano- and ultrafiltration. Meanwhile, the U.S. Environmental Protection Agency continues to classify microplastics as an “emerging contaminant.” A 170-organization legal petition filed on Dec. 1, 2024, calls for mandatory nationwide monitoring beginning in 2026, and federal action is currently pending. Desalination facilities also face unique challenges and must employ robust, multistage pretreatment to prevent microplastics from overwhelming highpressure membrane systems.
Reducing MP pollution will require a combination of public awareness and technological progress. Educating communities about how everyday plastic use contributes to microplastic contamination can help reduce the amount of plastic entering water systems. At the same time, advanced treatment technologies are essential, as conventional plants are far less effective at removing small MPs and NPs.
References
1. Martinez B., and V. deSilva (2026), Microplastic Contamination and Treatment in Drinking Water. FWEA Conference, Daytona Beach, Fla.
2. deSilva V., B. Martinez (2025), Assessing Microplastic Contamination and Treatment in Drinking Water. APWA Conference, Chicago, Ill.
3. deSilva V. (2024), Managing Microplastics in Wastewater and Biosolids, WEFTEC 2024, New Orleans, La.
4. Doran, E., Grant, M., & Lobdell, T. (2024). Petition to Include Microplastics on the Sixth Unregulated Contaminant Monitoring Rule under the Safe Drinking Water Act. Food and Water Watch. https://www.foodandwaterwatch.org/wpcontent/uploads/2024/11/MicroplasticsPetition-to-EPA.pdf.
5. Kosuth, M., Wattenberg, E. V., Mason, S. A., Tyree, C., & Morrison, D. (2017). Synthetic polymer contamination in global drinking water. Orb media. https:// orbmedia.org/invisibles-final-report.
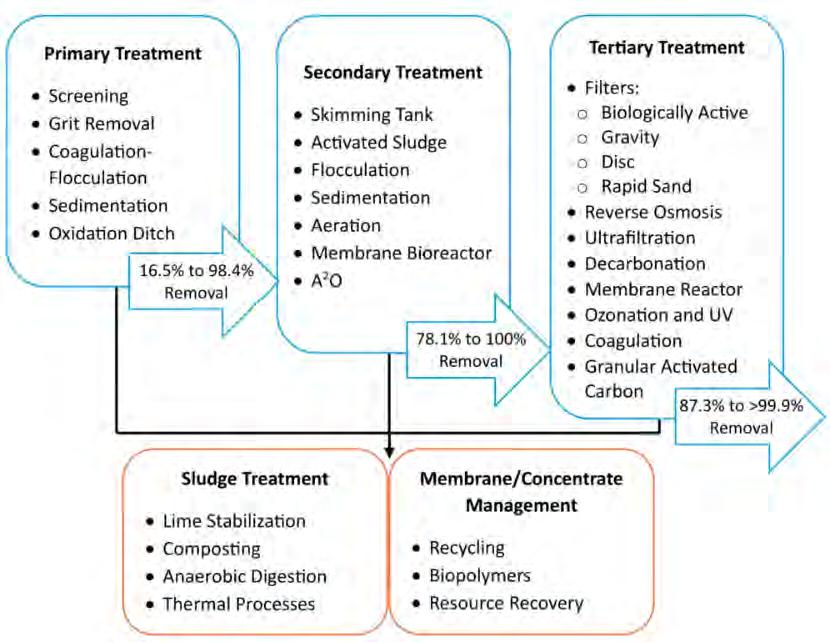
Figure 7. Drinking water treatment stages and possible microplastics removal.
Table 1. Microplastics in Tap Water and Bottled Water in the United States
Tap Water (Municipal) Bottled Water
Typical contamination rate ~ 94 % of samples contained plastic fibers in a 2017 nationwide survey
Average particles per liter ~ 5 – 6 microplastic pieces (>1 µm)
Estimated annual intake/person
≈ 4,000 microplastics if you drink only tap water
Regulation No federal standard yet; California began state-level monitoring in 2024
6. Mason, S. A., Welch, V. G., & Neratko, J. (2018). Synthetic polymer contamination in bottled water. Frontiers in Chemistry, 6, 389699. https://www.frontiersin.org/ articles/10.3389/fchem.2018.00407/full.
7. McEachern, K., Alegria, H., Kalagher, A. L., Hansen, C., Morrison, S., & Hastings, D. (2019). Microplastics in Tampa Bay, Florida: abundance and variability in estuarine waters and sediments. Marine Pollution Bulletin, 148, 97-106. https:// www.sciencedirect.com/science/article/ abs/pii/S0025326X19306083.
8. Tang, K. H. D., & Hadibarata, T. (2021). Microplastics removal through water treatment plants: Its feasibility, efficiency,
~ 100 % of samples contained plastics in every modern study consulted
110,000 – 370,000 particles once invisible nanoplastics (<1 µm) are counted. Mean ≈ 240,000
10- to 100-fold higher (hundreds of thousands) if you rely on bottled water
Same federal gap: bottled water follows FDA rules that currently ignore micro- and nanoplastics
future prospects and enhancement by proper waste management. Environmental Challenges, 5, 100264. https://www. sciencedirect.com/science/article/pii/ S2667010021002432. S
Highlights From the 2026
Florida Water Resources Conference
Clark
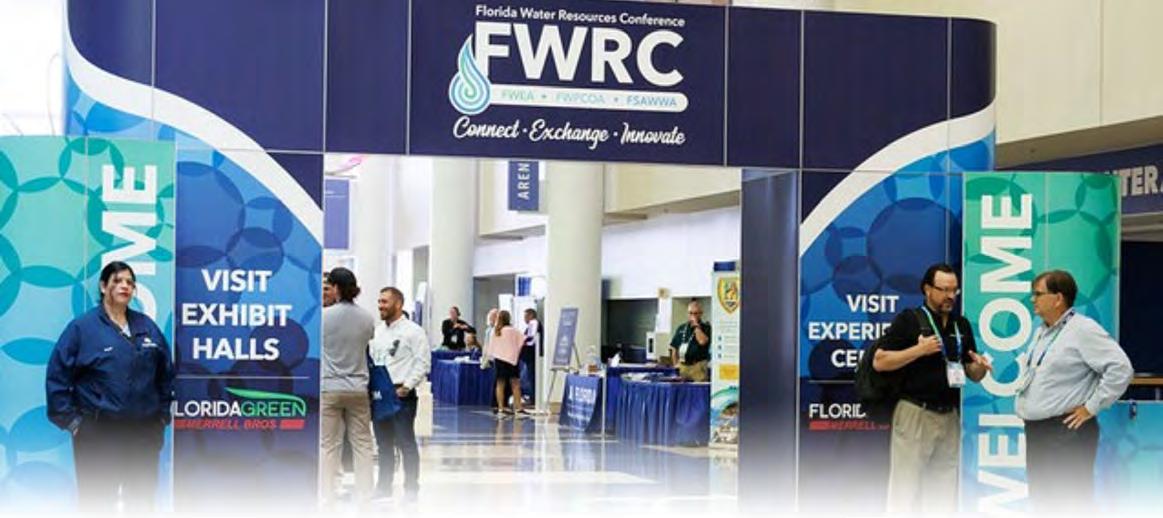
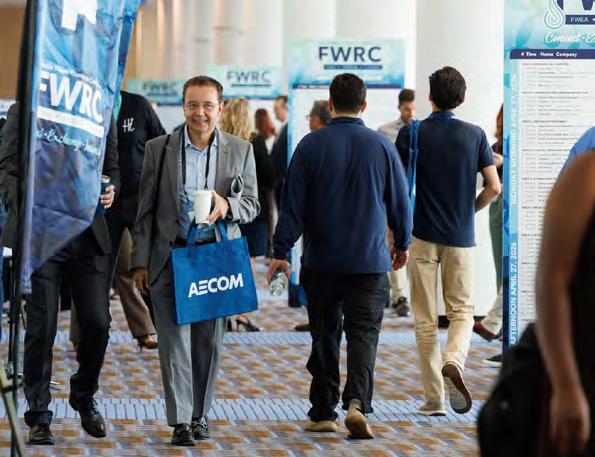
More than 3,500 water professionals gathered in Daytona Beach this spring for the 2026 Florida Water Resources Conference (FWRC), reaffirming the conference’s position as Florida’s premier event for water and wastewater professionals. From April 26-29, utility leaders, operators, engineers, manufacturers, regulators, consultants, researchers, students, and young professionals came together at the Ocean Center to connect with colleagues, exchange knowledge, and explore innovations shaping the future of the industry.

Hosted jointly by the Florida Section American Water Works Association (FSAWWA), Florida Water Environment Association (FWEA), and Florida Water and Pollution Control Operators Association (FWPCOA), FWRC 2026 delivered four days of technical education, professional development, networking, leadership engagement, competitions, tours, and industry collaboration.
This year’s theme, “Connect, Exchange, Innovate,” was more than a slogan—it was reflected throughout every aspect of the conference experience. From the expanded Welcome Center and Experience Center to the inaugural Mentor Matchup, Ripple Effect Hub, technical sessions, plant tours, and exhibit hall, attendees found new opportunities to build relationships, gain
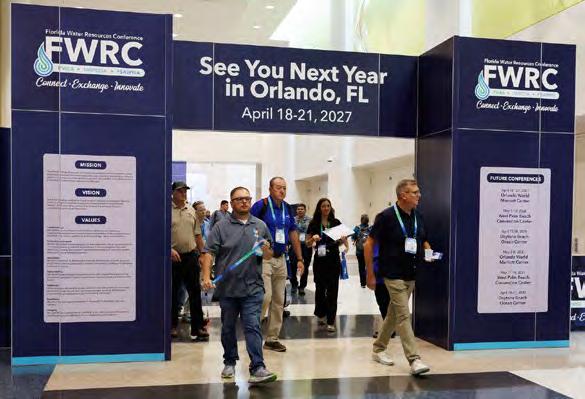

practical knowledge, and discover solutions to the challenges facing Florida’s water sector.
As the industry continues to face evolving regulatory requirements, workforce challenges, infrastructure needs, emerging contaminants, and technological advancements, FWRC remains a vital platform for bringing together diverse perspectives and creating meaningful dialogue around the future of water.
2026 FWRC By the Numbers
S 3,537 attendees
S 489 exhibitor booths
S 68 sponsors
S 138 technical sessions and educational presentations
Mish
S 5 industry competitions
S 894 CEU/PDH certificates awarded
S 291 attendee survey responses
These numbers represent more than attendance—they reflect the continued growth and engagement of Florida’s water community and the industry’s commitment to professional development and collaboration.
A Dynamic Gathering of Innovation, Education, and Connection
The 2026 conference demonstrated once again why FWRC continues to be one of the most respected and influential water conferences in the United States.
Attendees had access to more than 138 technical sessions, workshops, discussions, tours, competitions, and educational programs covering topics ranging from per- and polyfluoroalkyl substances (PFAS) and nutrient removal to artificial intelligence, utility management,
cybersecurity, resiliency, water reuse, asset management, and workforce development.
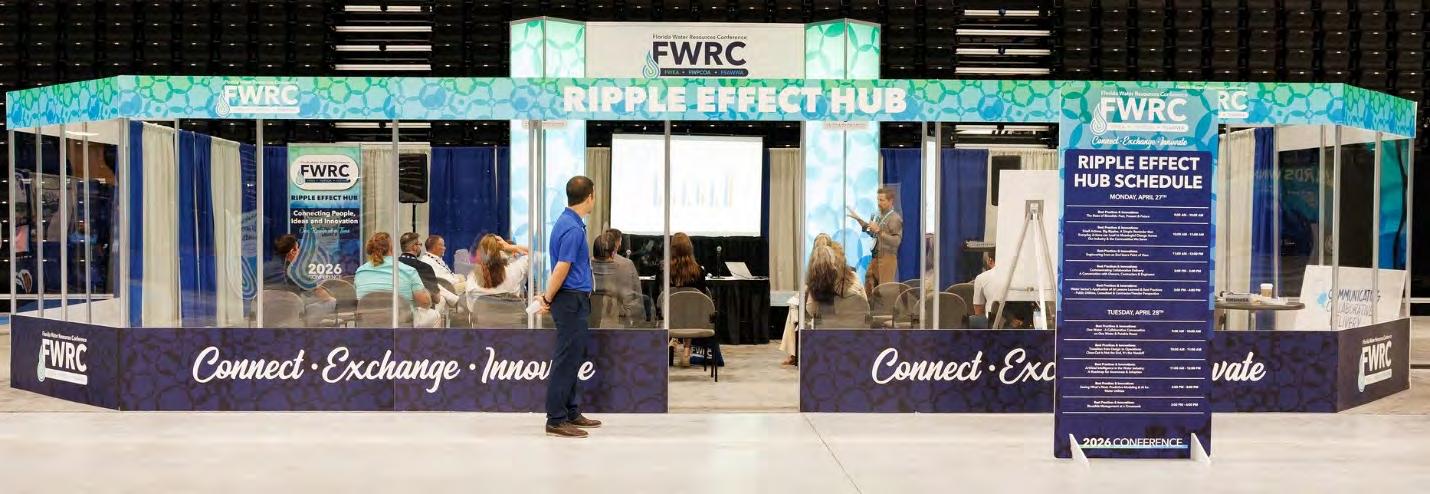
The technical program expanded this year with an additional day of programming on Sunday and the introduction of the Ripple Effect Hub, which hosted 10 interactive discussions focused on emerging ideas, innovation, and best practices.
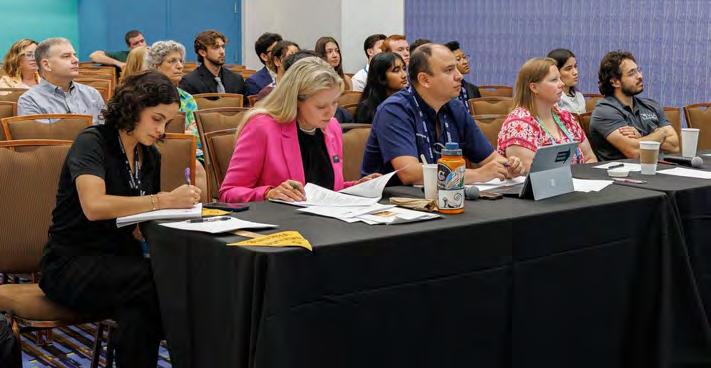
Equally important were the opportunities to build relationships. Survey results reinforced what many attendees already know: networking remains the primary reason professionals attend FWRC. More than 87 percent of respondents identified networking as one of their primary goals for attending the conference, while 86.9 percent rated networking opportunities as good or excellent.
The survey also demonstrated strong overall satisfaction with the conference experience. Nearly 80 percent of respondents reported being satisfied or very satisfied with FWRC 2026, while more than 85 percent indicated they are likely to return next year.
These results validate FWRC’s continued focus on creating an environment where

education, innovation, and professional connections intersect.
CONNECT: Creating Meaningful Connections Across the Industry
The foundation of every successful conference is the ability to bring people together, and FWRC 2026 placed significant emphasis on creating intentional opportunities for connection.
Survey respondents consistently identified networking as the most valuable aspect of their conference experience. Open-ended survey responses overwhelmingly cited networking, relationship building, and reconnecting with colleagues as the most valuable outcomes from attending FWRC.
To support this objective, several new and expanded initiatives were introduced throughout the conference.
Expanded Welcome Center
The Welcome Center served as the conference’s central gathering point and quickly Continued on page 20

FWRC 2026
Continued from page 19
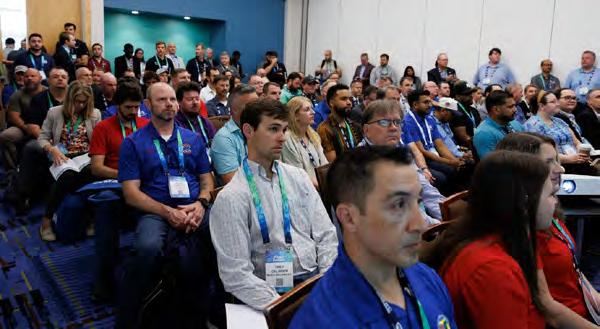
became one of the most utilized spaces throughout the event. Attendees enjoyed charging stations, the ribbon wall, networking spaces, and orientation resources designed to help participants maximize their conference experience. The Welcome Center received one of the highest participation rates among all conference experiences and earned strong satisfaction ratings from attendees.
Experience Center
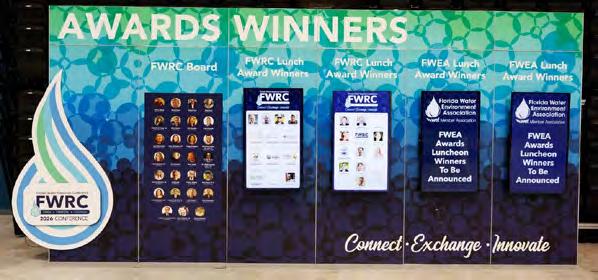
One of the most successful additions to FWRC 2026 was the expanded Experience Center. Designed to create opportunities for interaction beyond traditional conference programming, the Experience Center featured:
S Professional headshot lounge
S Awards wall
S Private meeting rooms
S Sticker bar
S Boxed lunch options
S Interactive mosaic wall
S Networking spaces
The center attracted hundreds of participants and generated positive feedback throughout the conference.
Headshot Lounge
The complimentary Headshot Lounge proved especially popular among attendees looking to update professional photographs for LinkedIn profiles, company websites, and professional communications. The experience received some of the highest ratings among the new conference offerings and demonstrated the value of providing practical career development resources alongside traditional technical programming.
Mentor Matchup
Among the most exciting additions to FWRC 2026 was the inaugural Mentor Matchup. Created to foster meaningful dialogue between emerging professionals and established industry
leaders, Mentor Matchup featured a series of rapid-fire five-minute conversations that allowed participants to ask questions, share experiences, and gain valuable career insights.
Following the structured mentoring sessions, participants gathered for a networking happy hour where conversations continued in a more relaxed setting.
The program was particularly impactful for students and young professionals seeking guidance from experienced utility leaders, consultants, and operators. Based on positive feedback received during and after the event, Mentor Matchup is expected to remain an important component of future conferences.
Women of Water Forum
The Women of Water Forum once again provided one of the conference’s most engaging and inspiring discussions.
Facilitated by Randy Brown, president of Eagle Utilities Management LLC, and Marjorie Craig, P.E., retired utilities director for the Village of Tequesta, with support from Megan Nelson of Orange County Utilities, the session brought together accomplished leaders from across Florida’s water sector, and men are always encouraged to attend.
Panelists included:
S Zasha Del Orbe, JEA
S Sangeeta Dhulashia
S Joan Fernandez, FWEA president, CDM Smith
S Elizabeth Keddy, Hillsborough County Utilities
S Jennifer McElroy, GRU
S Iulia Siemen, Orange County Utilities
The panelists shared candid reflections on leadership, career development, mentorship, overcoming challenges, and the future of the profession. The resulting discussion provided
meaningful insights and encouragement for attendees at all career stages.
FSAWWA Vet’s Connect
The FSAWWA Vet’s Connect program continued its mission of supporting veterans and transitioning service members within the water industry.
The session focused on:
S Strengthening veteran engagement
S Expanding mentorship opportunities
S Building career pathways
S Creating a supportive professional network
The program reflects the industry’s ongoing commitment to workforce development and inclusion while recognizing the valuable leadership skills veterans bring to the profession.
EXCHANGE: Advancing Knowledge Through Education, Innovation, and Shared Experience
At its core, FWRC exists to support the exchange of ideas, experiences, and solutions across Florida’s water sector. Whether through technical presentations, interactive workshops, facility tours, or peer-to-peer discussions, attendees came to Daytona Beach ready to learn from one another and return home with practical tools they could immediately apply within their organizations.
Survey results confirmed the value of the educational program. Technical sessions received an average score of 3.5 out of 4 among attendees who evaluated them, with an impressive 96.5 percent rating sessions as good or excellent. Technical presenters earned an average score of 4.18 out of 5, while more than 80 percent of respondents indicated that the content provided practical and applicable information for their work.
These results reflect the tremendous
efforts of the Technical Program Committee, session moderators, workshop coordinators, and presenters who worked throughout the year to develop a diverse and relevant educational experience.
Technical Program Highlights
The 2026 technical program featured presentations from utility professionals, consultants, researchers, regulators, manufacturers, and subject matter experts from across Florida and beyond.
Educational tracks included:
S Modeling, Geographic Information Systems, and Computer Applications
S Stormwater and Green Infrastructure
S Distribution Systems
S Wastewater Treatment
S Sustainability
S Potable Water Treatment
S Facilities Operations and Maintenance
S Utility Management
S Water Supply and Water Quality
S Collection Systems
S PFAS and Emerging Contaminants
S Reclamation and Reuse
S Nutrient Removal
S Communications and Public Engagement
S Biosolids and Resource Recovery
S Funding, Finance, and Fees
Survey feedback highlighted particular interest in emerging technology and artificial intelligence, water supply and potable water topics, PFAS and contaminants, wastewater treatment, operations and maintenance, and regulatory developments. These topics continue to shape utility planning and operational decision making throughout Florida.
Ripple Effect Hub
One of the most innovative additions to FWRC 2026 was the Ripple Effect Hub. Designed
as an interactive learning environment, the hub hosted 10 facilitated discussions that encouraged participants to move beyond traditional presentations and engage directly with peers on emerging challenges and opportunities.
The Ripple Effect Hub encouraged collaborative dialogue, idea sharing, and problem solving among participants representing a variety of disciplines and organizations.
Attendees explored topics ranging from workforce development and utility innovation to technology implementation and operational best practices. The format provided an opportunity for participants to learn from each other while building professional relationships across organizational boundaries.
The hub quickly became a popular destination throughout the conference and demonstrated the growing interest in interactive educational experiences that complement traditional conference programming.
What’s Flowing in Florida Utilities?
One of the conference’s most anticipated workshops returned in 2026 with an updated focus on smart utility technologies, PFAS management, regulatory developments, and utility innovation.
Hosted jointly by the FSAWWA Water Utility Council (WUC), FWEA Utility Council, FWEA WR3 Committee, and FSAWWA FL2051 Committee, the workshop explored many of the most pressing issues facing Florida utilities.
Back by popular demand, attendees once again participated in Utility Buzzword Bingo throughout the program, listening for familiar industry terms and concepts during presentations and discussions. Workshop topics included: B – Break the Ice: An interactive networking exercise designed to encourage participation and discussion.
I – Intelligent Utilities: Emerging technologies, artificial intelligence applications, analytics, automation, and procurement strategies.
N – Navigating PFAS: PFAS treatment, wastewater considerations, regulatory developments, and future challenges.
G – Government and Regulations: State and federal legislative updates and evolving regulatory requirements.
O – Open Forum: An interactive discussion addressing current utility challenges and emerging industry trends.
The workshop concluded with a networking event that allowed attendees to continue conversations with presenters and colleagues in a more informal setting.
FWPCOA Operators Showcase
The 2026 Operators Showcase once again highlighted the expertise and professionalism of Florida’s water operators. Presented by FWPCOA and sponsored by GHD, the showcase featured presentations from leaders representing FSAWWA, FWEA, and FWPCOA.
Attendees were guided through a series of presentations focused on advancing Florida’s water production capabilities.
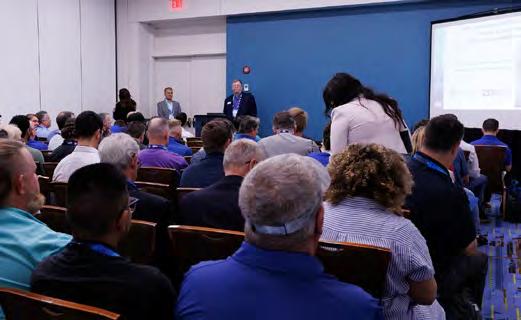
A featured presentation by Juan Valdez, plant superintendent at PBCWUD, explored modern treatment technologies, operational strategies, and approaches utilities are using to meet increasing demand while maintaining regulatory compliance and exceptional water quality.
The session concluded with an interactive panel discussion and audience question-andanswer period that generated thoughtful dialogue among operators and utility professionals.
Plant Tours: Learning Beyond the Classroom
Facility plant tours continue to be among the most valued educational experiences offered at FWRC because they provide attendees with direct exposure to facilities, equipment, and operational practices.
Continued on page 22
Continued from page 21
This year the conference featured two unique tours hosted by the City of Daytona Beach.
City of Daytona Beach Lift Station 34 Walking Tour
Participants explored the replacement of Lift Station 34, originally constructed in the 1970s as a dry pit/wet pit facility. The project transformed the aging infrastructure into a modern wet well equipped with submersible pumps designed to improve reliability, operational safety, and maintainability.
Tour attendees learned about:
S Project planning and design considerations
S Construction challenges within an established residential neighborhood
S Maintaining service during construction activities
S Site constraints and limited working space
S Community engagement and coordination
The tour provided valuable lessons for utilities facing similar infrastructure replacement projects.
City of Daytona Beach Water and Wastewater Plant Tour
The second tour offered attendees a behindthe-scenes look at one of the region’s most important utility facilities. Participants visited the LPGA Water Treatment Facility, home to both the Ralph Brennan Water Treatment Plant and the Westside Regional Water Reclamation Facility.
Highlights included:
S Lime softening treatment processes
S Drinking water production operations
S Biological nutrient removal systems
S Public access reclaimed water production
S Utility resiliency and operational planning
The facility plays a critical role in supporting Daytona Beach’s growing population and serves as an excellent example of integrated water and wastewater management.
FWEA Utility Council Breakfast and Annual Meeting
The annual FWEA Utility Council Breakfast brought together utility executives and industry leaders from across Florida.
The council serves as a unified voice for wastewater utilities and focuses on issues affecting public health, environmental protection, regulatory compliance, and utility management.
Attendees discussed legislative priorities, emerging challenges, operational concerns, and opportunities for collaboration among Florida utilities.
The breakfast continues to provide an important forum for utility leadership engagement and peer-to-peer learning.
A Culture of Learning
One of the most encouraging findings from the attendee survey was the continued emphasis participants place on professional development and education.
Nearly half of survey respondents identified professional development as one of their primary reasons for attending FWRC while technical sessions and educational programming consistently ranked among the most valuable aspects of the conference experience.
As the water industry continues to evolve, the importance of knowledge sharing has never been greater. The conference remains committed to providing educational opportunities that are practical, relevant, and immediately applicable to the challenges facing utilities today.
The success of the 2026 technical program
reflects the dedication of hundreds of volunteers, presenters, moderators, and committee members who work throughout the year to ensure attendees leave the conference better informed, better connected, and better prepared for the future.
INNOVATE: Showcasing Technology, Talent, and the Future of the Water Industry
Innovation has always been a cornerstone of FWRC, and the 2026 conference continued that tradition by bringing together the latest technologies, emerging solutions, industry expertise, and future leaders under one roof.
From the exhibit hall floor to student competitions and operational challenges, attendees had countless opportunities to discover new ideas, learn from peers, and witness excellence in action.
Exhibit Hall: Where Challenges Meet Solutions
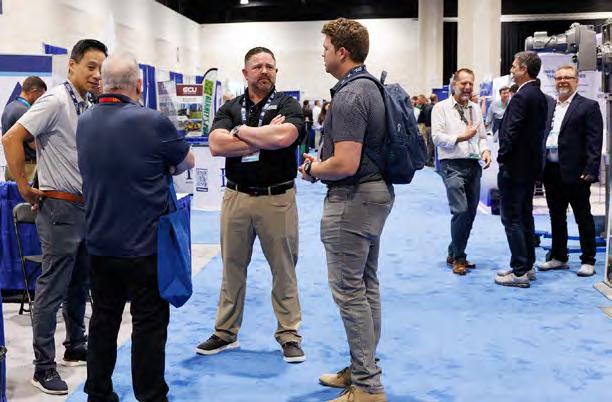
The exhibit hall remained one of the most vibrant and valuable components of FWRC 2026. With 489 exhibitor booths representing manufacturers, consultants, contractors, technology providers, equipment suppliers, and service organizations, the exhibit hall served as a central hub for innovation and engagement throughout the conference.
Attendees explored the latest advancements in:
S Treatment technologies
S Pumps and equipment
S Asset management systems
S Digital solutions and software
S Automation and controls
S Laboratory technologies
S Infrastructure services
S Engineering and consulting services
Survey results reinforced the exhibit hall’s importance to the overall conference experience. Exhibit hall value received an average rating of 4.47 out of 5, making it one of the highest-rated aspects of the conference. Additionally, 76.6 percent of respondents indicated they made meaningful follow-up connections or identified products and services they planned to investigate further after the conference.
These findings demonstrate the exhibit hall’s critical role in helping utilities and professionals discover solutions that can improve operations, reduce costs, and address emerging challenges.
Scavenger Hunt and Interactive Experiences
Attendees also participated in the popular exhibit hall scavenger hunt, which encouraged exploration and interaction with exhibitors throughout the conference.
Participating locations included:
S Fortiline Waterworks
S Key Trak
S Hydro Corp
S H2M Architects + Engineers
S Electric Machine Control Inc.
S Power Storage Solutions
S Southern Pump and Supply
S Inframark
These activities created additional opportunities for engagement while helping attendees discover new technologies and services available within the industry.
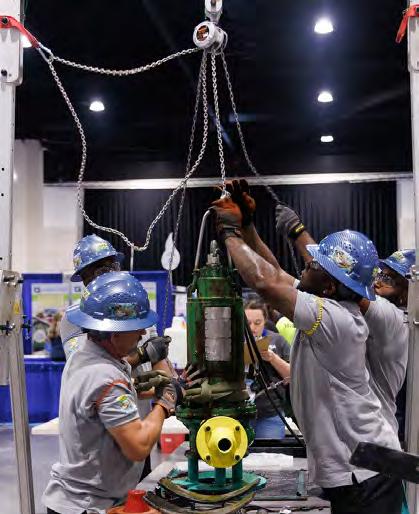
FWEA Operations Challenge
One of the most anticipated events at every FWRC is the Operations Challenge Competition, often referred to as the “Wastewater Olympics.”
Sponsored by Tetra Tech, the 2026 competition once again demonstrated the extraordinary skills, teamwork, and professionalism of Florida’s wastewater operators.
Teams of four competed across five challenging events:
S Operations
S Maintenance
S Laboratory
S Safety
S Collection Systems
The competition tests technical knowledge, problem-solving abilities, communication skills, and teamwork under pressure. The highestperforming teams earned the opportunity to represent Florida on the national stage at the Water Environment Federation Technical Exhibition and Conference (WEFTEC), being held September 2026 in New Orleans.
Congratulations to this year’s top team: S First Place: Polk County Bio-Wizards
The Operations Challenge continues to showcase the dedication and expertise of wastewater professionals who work every day to protect public health and the environment.
Top Ops Competition
Sponsored by Mead & Hunt, Top Ops once again delivered one of the most entertaining and educational competitions of the conference.
Often described as the “College Bowl of the Water Industry,” Top Ops challenges teams to answer technical questions and solve real-world water treatment and operations problems.
Teams comprised of engineers, operators, mechanics, laboratory professionals, supervisors, and managers competed in a fast-paced test of industry knowledge. The competition also served as preparation for Florida’s national representatives who competed at the AWWA Annual Conference and Exposition, held in June in Washington, D.C.
Congratulations to the 2026 Top Ops champion: S Hillsborough Counties Hard Water Team
Their victory reflects the exceptional knowledge and professionalism found throughout Florida’s drinking water community.
Students and Young Professionals: Investing in the Future
The future of Florida’s water industry was on full display throughout FWRC 2026. Students and young professionals participated in a wide variety of educational, networking, and leadership development opportunities designed to support career growth and strengthen industry engagement.
Activities included:
S Student and Young Professionals Breakfast
S Student Design Competitions
S Poster Competition
S Young Professionals Workshop
S Networking Reception
S Mentor Matchup
S Technical Sessions and Educational Programming
These initiatives continue to strengthen the pipeline of future industry leaders and create meaningful connections between experienced professionals and emerging talent.
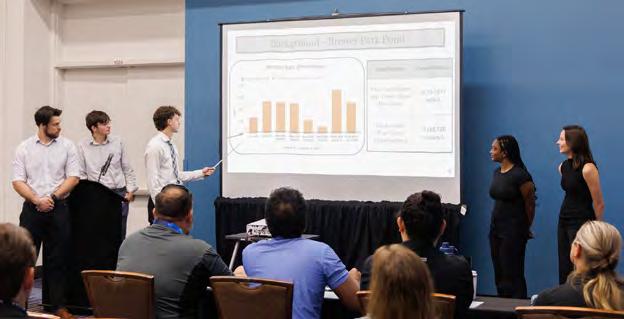
FWEA Student Design Competition
The annual Student Design Competition showcased innovative solutions developed by university teams addressing real-world environmental and wastewater challenges. These projects represent months of research, engineering analysis, collaboration, and presentation preparation.
Wastewater Category Winner
University of South Florida
Team members:
S Alana Ward
S Ella Barnes
S Mahad Niazi
S Kyle Fitzpatrick
Environmental Category Winner
Florida Gulf Coast University
Team members:
S Zach Hudson
S Carter Baker
Both teams earned the opportunity to represent Florida at the national competition during WEFTEC this fall.
The quality of the projects demonstrated not only technical excellence, but also the creativity and innovation that will help shape the future of the water profession.
Poster Competition
The Student and Young Professionals Poster Competition highlighted outstanding research and technical work from emerging professionals across the state. Attendees engaged directly with presenters, explored innovative ideas, and discussed solutions to current environmental and utility challenges.
Congratulations to this year’s winner:
S Dennis Ssekimpi, Florida A&M University, Florida State University
The competition continues to provide a valuable platform for developing presentation skills, sharing research, and building professional networks.
Young Professionals Workshop
The collaborative FWEA/FSAWWA Young Professionals Workshop brought together emerging leaders from across the water sector. Participants gained insights from experienced professionals, discussed career development
Continued on page 24
Continued from page 23
strategies, explored leadership opportunities, and strengthened their professional networks. Programs such as this play a critical role in workforce development and succession planning as utilities continue to address industrywide workforce challenges.
Recognizing Innovation Across the Industry
Throughout the conference, one common theme emerged: innovation is not limited to technology. Innovation was evident in:
S New conference experiences
S Mentorship opportunities
S Student projects
S Utility operations
S Technical research
S Workforce development initiatives
S Collaborative problem-solving discussions
Whether through a new treatment process, a creative infrastructure solution, a student design project, or a leadership development initiative, innovation continues to drive progress throughout Florida’s water community.
As utilities face increasingly complex challenges related to infrastructure, regulations, workforce development, climate resilience, emerging contaminants, and technological change, the importance of innovation has never been greater.
The FWRC continues to provide the platform where those ideas are shared, refined, and advanced.

Leadership, Recognition, and Looking Ahead
Celebrating Excellence Across Florida’s Water Community
While technical education and networking remain core components of FWRC, the conference also serves as an important opportunity to recognize the individuals, teams, and organizations whose dedication advances Florida’s water profession.
From industry awards and leadership meetings to volunteer recognition and sponsor support, FWRC 2026 highlighted the people who continue to strengthen and shape the future of the industry.
FWRC Awards Luncheon
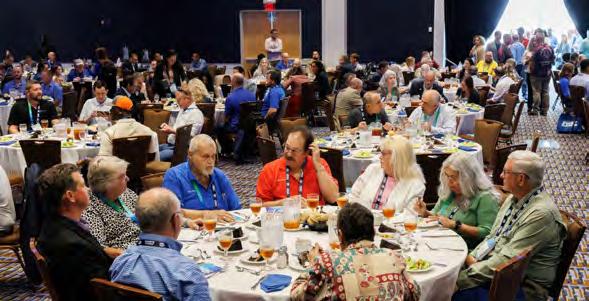
Sponsored by Flovac, the FWRC Awards Luncheon brought attendees together to celebrate leadership, service, and professional achievement.
Hosted by Mark Lehigh, FWRC president, the luncheon focused on the power of connection and the shared mission that unites water professionals across Florida.
Throughout the event, attendees reconnected with colleagues, celebrated industry accomplishments, and reflected on the collaborative spirit that drives progress throughout the profession.
The luncheon served as a reminder that the strength of the water industry is built not only on infrastructure and technology, but also on the relationships, dedication, and expertise of the people who serve it.
FWEA Awards Luncheon
The FWEA Awards Luncheon provided another opportunity to recognize outstanding service, leadership, and achievement across Florida’s water environment community.
Joan Fernandez, FWEA president, welcomed attendees and recognized special guests, including Howard Carter, immediate past president and Water Environment Federation trustee, who served as keynote speaker.
The luncheon featured:
S FWEA annual business meeting
S Water Stories video presentation
S Annual financial and organizational updates
S Leadership transition ceremony
S Awards presentation
A significant moment occurred during the passing of the gavel from Joan Fernandez to David Hernandez, incoming FWEA president. The ceremony symbolized the continued leadership and stewardship that support the association’s mission and future success.
Kristiana Dragash served as master of ceremonies for the awards presentation, recognizing outstanding volunteers, students, professionals, and industry contributors from across Florida.
Florida Select Society of Sanitary Sludge Shovelers
One of FWRC’s most respected traditions continued during the Annual Florida Select Society of Sanitary Sludge Shovelers (FSSSSS) Breakfast and Induction Ceremony.
Founded in 1956 by David B. Lee, the society recognizes individuals who have demonstrated exceptional and meritorious service to FWEA and the water profession. Membership cannot be requested or applied for—it is bestowed by peers in recognition of long-term service and dedication.
Congratulations to the 2026 inductees:
S Joe Paterniti
S Dustin Chisum
S Scott Ruland
Their contributions reflect the spirit of volunteerism, leadership, and professional commitment that has helped strengthen Florida’s water industry for generations.
Leadership and Collaboration
Throughout the conference, numerous boards, committees, councils, and leadership groups met to advance important initiatives affecting Florida’s water community and FWRC continues to provide an essential forum for collaboration among FWEA, FSAWWA, FWPCOA, and Florida Water Resources Journal leadership.
Meetings addressed topics including:
S Biosolids management
S Asset management
S Utility finance and rates
S Emerging technologies
S Workforce development
S Cybersecurity
S Public affairs
S Utility operations
S Safety
S Membership and engagement
S Water quality
S Distribution systems
S Master planning and modeling
These meetings play a critical role in shaping future programs, advocacy efforts, educational initiatives, and industry priorities.
By bringing together volunteer leaders from across the state, FWRC helps ensure continued collaboration and alignment among organizations working toward common goals.
The Importance of Volunteers
Behind every successful FWRC is an extraordinary network of volunteers.
From the earliest planning meetings to the final conference session, volunteers dedicate countless hours to creating an exceptional experience for attendees.
The conference’s success depends on:
S Technical review committee members
S Session moderators
S Workshop coordinators
S Registration volunteers
S Student program volunteers
S Competition coordinators
S Tour organizers
S Committee leaders
S Board members
S Speakers and presenters
These individuals contribute their expertise, energy, and passion not because they have to, but because they believe in supporting the profession and helping others succeed.
Survey results reinforced the value of these efforts.
Staff and volunteers received some of the highest ratings in the entire survey:
S 95.5 percent rated staff and volunteers knowledgeable and helpful
S 91.5 percent rated interactions with staff and volunteers favorably
These results reflect the professionalism and commitment demonstrated throughout the conference.
To every volunteer who contributed to FWRC 2026: thank you! Your dedication continues to set FWRC apart and helps create an experience that attendees value year after year.
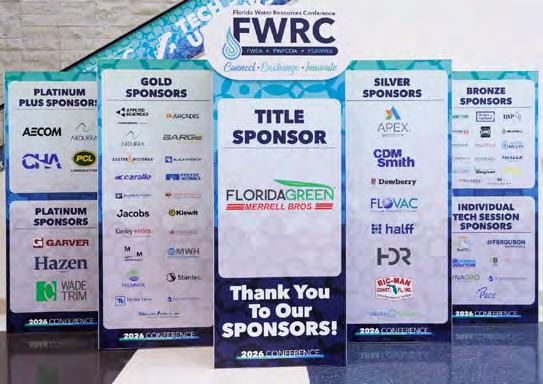
Thank You to Our Sponsors
The success of FWRC would not be possible without the generous support of our sponsors. Their investment helps enhance educational programming, networking opportunities, student initiatives, conference experiences, competitions, and professional development opportunities throughout the event.
Title Sponsor
S Merrell Bros.
Platinum Plus Sponsors
S AECOM
S Ardurra
S CHA
S PCL Construction
Platinum Sponsors
S Hazen
S Wade Trim
Gold Sponsors
S Arcadis
S Ardurra
S Barge Design Solutions
S Baxter & Woodman
S Black & Veatch
S Carollo
S Freese and Nichols
Continued on page 26
FWRC 2026
Continued from page 25
S Global Tech Solutions
S Hydra Services
S Jacobs
S Kiewit
S Kimley-Horn
S McKim & Creed
S Mott MacDonald
S MWH
S Plummer
S Stantec
S Tetra Tech
S Veith Engineering
S Wright-Pierce
Silver Sponsors
S Apex
S CDM Smith
S Dewberry
S Flovac
S Halff
S HDR
S Ric-Man Construction Florida
S Weston & Sampson
Bronze Sponsors
S Barney’s Pumps
S Brown and Caldwell
S DXP
S Fortiline Waterworks
S GHD
S Haskell
S Inframark Water & Infrastructure Services
S Mead & Hunt
S Moss Kelley
S Operational Technical Services
S Synagro
S Thalle Construction
S Tom Evans Environmental
S Vega
S VTScada
S Woolpert
Their continued support demonstrates a shared commitment to advancing Florida’s water profession.
Survey Insights and Continuous Improvement
The commitment of FWRC to excellence
includes listening carefully to attendee feedback. The 2026 survey generated 291 responses and provided valuable insight into what attendees valued most and where future improvements can be made.
Key findings included:
S 79.4 percent overall satisfaction
S 85.6 percent likelihood of returning in 2027
S 87.3 percent attended primarily for networking
S 96.5 percent rated technical sessions good or excellent
S 88.2 percent rated exhibit hall value positively
S 76.6 percent reported meaningful business connections
S 95.5 percent rated staff and volunteers helpful and knowledgeable
The survey also identified opportunities for enhancement, particularly related to:
S Room comfort and layout
S Audio/visual quality
S Schedule timing and conflicts
S Technical track organization
S Food and beverage offerings
S Mobile app functionality
These insights are already being incorporated into planning discussions as preparations begin for FWRC 2027.
Looking Ahead to Orlando
The FWRC continues to evolve because of the commitment, ideas, and participation of its attendees, volunteers, sponsors, exhibitors, speakers, and partner organizations. The success of the 2026 conference demonstrated the tremendous value of bringing Florida’s water community together to learn, collaborate, and innovate. With strong attendance, highly rated educational programming, successful new initiatives, and overwhelmingly positive feedback, the conference enters 2027 with significant momentum.
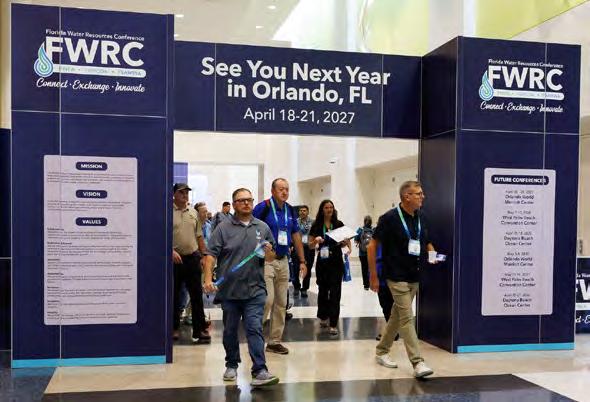
Mark your calendars now for the 2027 Florida Water Resources Conference, taking place April 18-21, 2027, at the Orlando World Marriott.
We look forward to welcoming you back for another exceptional opportunity to Connect, Exchange, and Innovate.
Mish Clark is executive director of the Florida Water Resources Conference.
Thank You for Making FWRC 2026 a Success!
Dear Water Professionals,
On behalf of the Florida Water Resources Conference, thank you for joining us in Daytona Beach for FWRC 2026. Your participation as attendees, exhibitors, sponsors, speakers, volunteers, and leaders made this year’s conference an extraordinary success. This year we focused on creating intentional opportunities for connection and engagement through new experiences including the Welcome Center enhancements, Experience Center, Headshot Lounge, Awards Wall, Ripple Effect Hub, and Mentor Matchup. Together, we demonstrated the power of collaboration and the importance of investing in our industry’s future.
Thank you for your continued support of FWRC and the host associations— FWEA, FSAWWA, and FWPCOA. We look forward to building on this momentum and welcoming you to Orlando in 2027.
FWRC 2026 Survey Snapshot
S 79.4 percent overall attendee satisfaction
S 85.6 percent likely to attend FWRC again
S 87.3 percent attended primarily for networking
S 96.5 percent rated technical sessions good or excellent
S 88.2 percent rated the exhibit hall valuable
S 76.6 percent made meaningful business connections
S 95.5 percent rated staff and volunteers knowledgeable and helpful
Mark Lehigh FWRC President
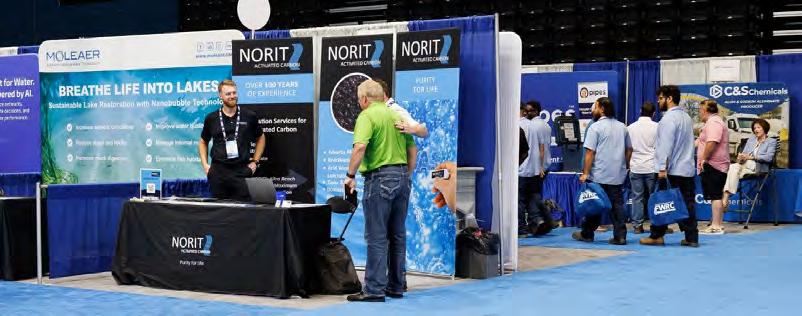
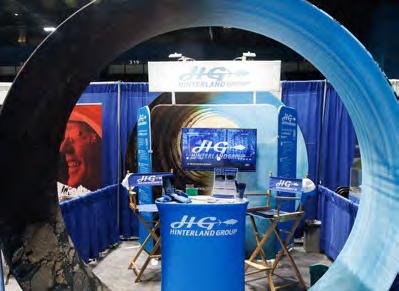
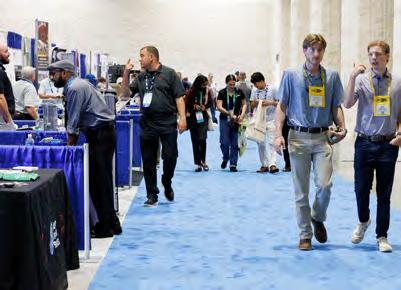
Exhibitors Show the Newest Products, Services, and Technologies in the Industry EXHIBITION
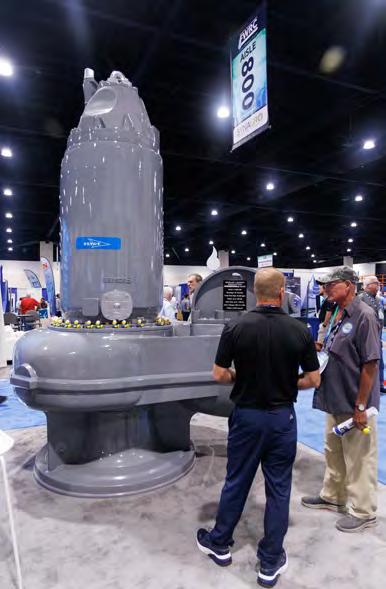
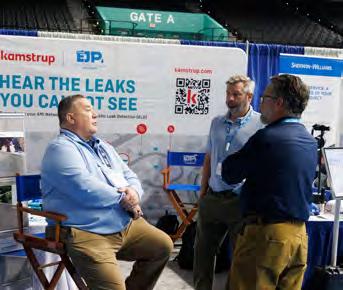
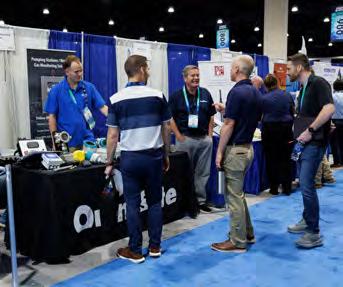
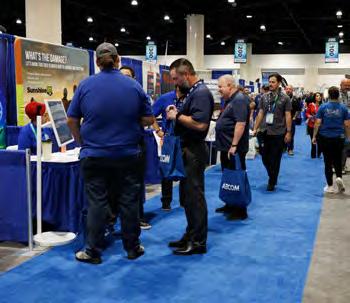
The exhibit hall this year included 489 exhibit booths, with company employees and representatives discussing the newest technologies and processes with the attendees at their booths.
Just outside the hall, booths for FSAWWA,
FWEA, FWPCOA, and the Florida Water Resources Journal had staff and volunteers available to talk about programs and events from the three organizations and their joint magazine.
The hall was also the site for the evening
receptions, morning and afternoon breaks, prize giveaways, competitions, and some of the awards presentations.
Some of the many booths and activities are pictured here.
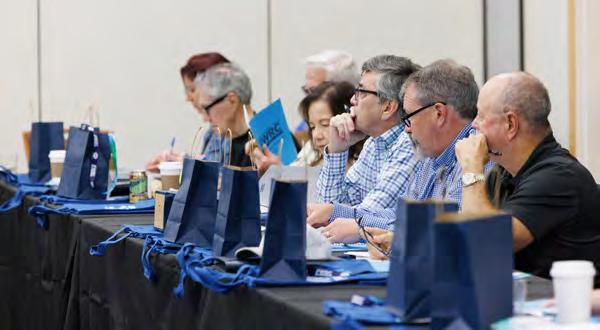
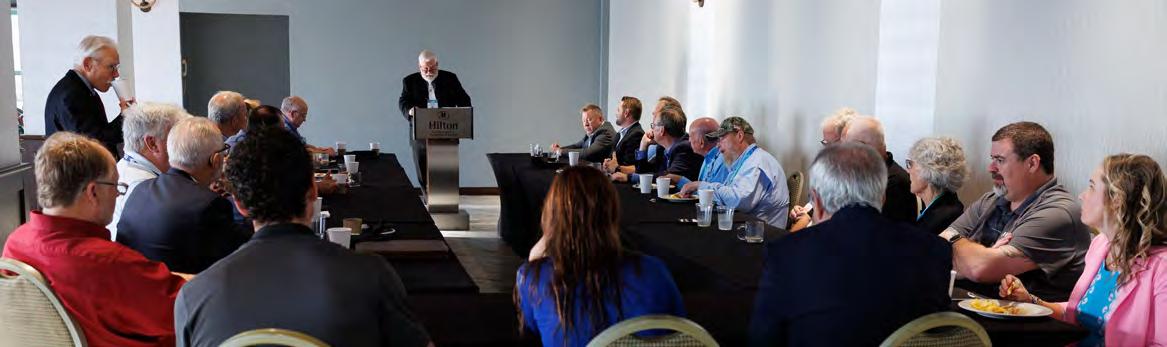
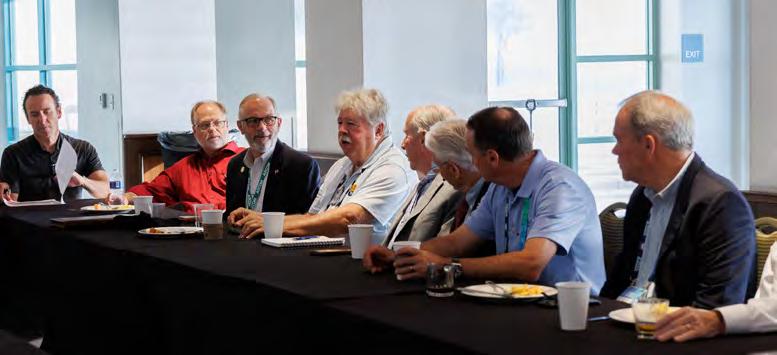
Water Groups Hold Meetings at the Conference Meetings
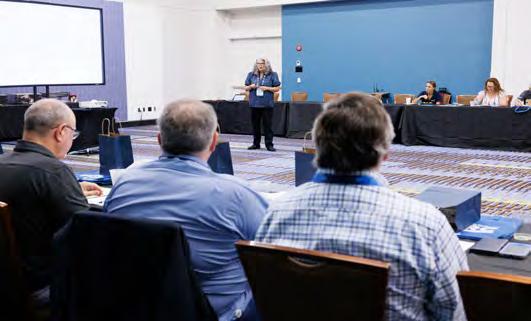
oards, councils, and committees hold meetings at the conference (and throughout the year), which is where the real work for FSAWWA, FWEA, and FWPCOA takes place. Check each organization’s website to see if there’s a group you would be interested in joining. ere are photos of some of the meetings that took place.
WATER FORUM
The Water Workforce Needs Everyone: Reflections From the 2026 FWRC Women of Water Forum
A conference workshop for connection, inspiration, and community WOMEN OF
Megan Nelson and Marjorie G. Craig
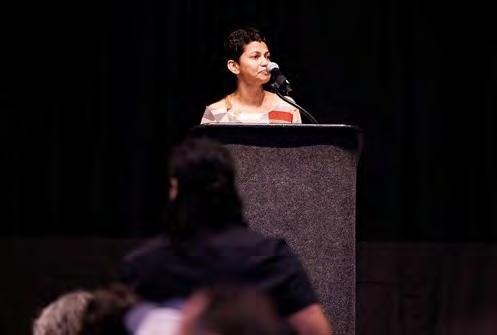
The 2026 Women of Water Forum at the Florida Water Resources Conference (FWRC) began with a microphone moving around the room before the focus was on the panel.
Before the panelists answered a single question, attendees introduced themselves one by one, named the organization they represented, and shared something personal: a hobby, a goal, a family connection, or a detail that helped turn a conference session into a community conversation. In just a few minutes, strangers became colleagues, and colleagues began to feel like a community.
The introductions took a little longer than most, but that was exactly the point. Before discussing the future of the water industry, the forum first focused on the people who make the future possible. And it was designed for connection—connection with each other.
Held Monday, April 27, at the Daytona Beach Ocean Center, the forum brought together approximately 90 attendees, mostly women, with participation from men and advocates. The session was sponsored by The Vaughn Company, whose continued support helped make the gathering possible.
The program made clear that men were

encouraged and welcome to attend. That message mattered. The conversation centered on women in water, but its larger theme was unmistakable: The water workforce needs everyone.
The Workforce Challenge
The water sector is facing a workforce challenge that can no longer be treated as distant or theoretical. Utilities across Florida are preparing for retirements, succession gaps, hiring challenges, and growing demands on the people who operate, maintain, design, regulate, and manage water systems.
When attendees were asked how many people in their organizations were retiring now, recently, or within the next decade, hands went up across the room. For many, this wasn’t an abstract statistic; it was happening in their own utilities, departments, and teams.
At the same time, women remain underrepresented in the water workforce. The U.S. Water Alliance has reported that women make up only 14.9 percent of the water workforce in the Unites States and accounted for only 5.54 percent of water and wastewater treatment plant and system operators in 2024. The issue is not
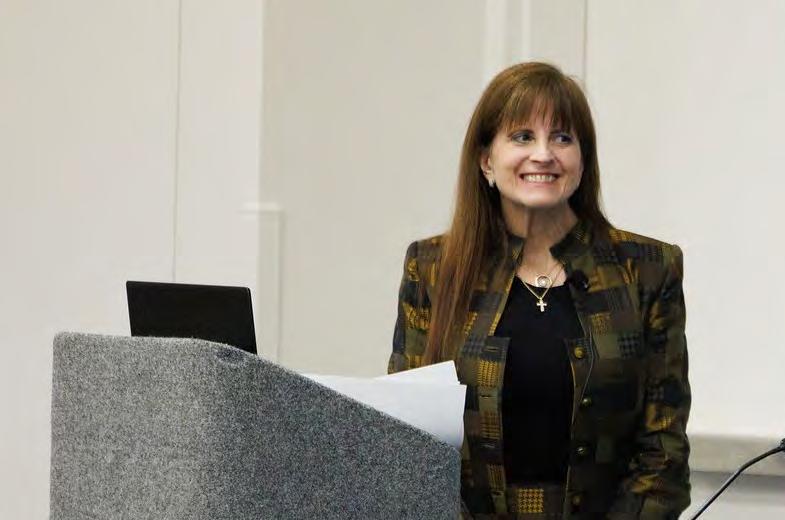
only representation—it’s capacity. The sector must attract, support, and retain all available talent.
As Marjorie Craig reminded the attendees, “Everyone in this room is a leader and can encourage people to enter the water industry.”
The Panel
The 2026 panel brought together leaders from utilities, consulting, operations, compliance, capital projects, and professional associations.
The panelists were:
S Zasha Del Orbe, manager of wastewater treatment and reuse, JEA
S San’g’eeta Dhulashia, P.E., PMP, deputy director of utilities, City of Sunrise
S Joan Fernandez, P.E., PMP, project manager, CDM Smith, and FWEA president and board of directors member
S Elizabeth Keddy, P.E., LEED AP, capital projects section manager, Hillsborough County Water Resources Department
S Jennifer McElroy, P.E., supervising engineer, Gainesville Regional Utilities
The forum was facilitated by Marjorie G. Craig and A. Randolph “Randy” Brown, president
Continued on page 30
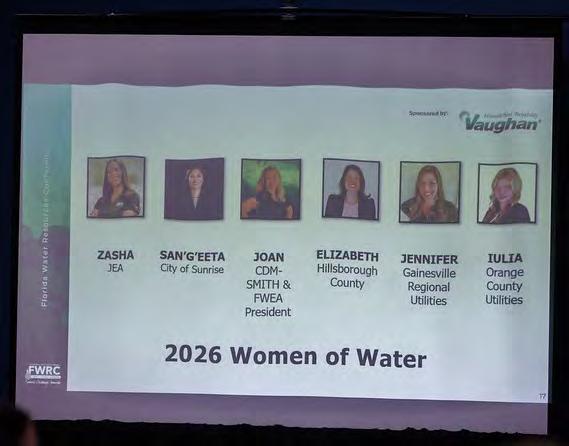
Randy Brown, session facilitator.
Marjorie Craig, session facilitator. Session panelists.

of Eagle Utility Management. Megan Nelson served as the team-building facilitator. Together, the panelists represented different entry points into the profession. Some planned for engineering careers, some arrived through unexpected opportunities, and some began in field work, operations, or consulting. Their stories made clear:
There is no single path into water.
How Water Found Them
The first question for each panelist was how she entered the water industry. Few people in the room had intentionally set out for water careers. Many found the industry, or the industry found them.
Zasha Del Orbe began in banking before entering utilities through a physically demanding field position repairing water and sewer lines. That experience gave her a deep respect for operators, maintenance teams, and the infrastructure that communities rely on every day. She later moved into wastewater operations and leadership.
For Del Orbe, the meaning of the work became clear through service. “Passion for the industry comes from seeing how important it is for the environment and the community we serve,” she said.
San’g’eeta Dhulashia connected her career to childhood memories of water scarcity in India, where summer water deliveries were limited by household. Later, after coming to Florida, she was struck by the state’s clean air, water, and natural beauty. Her path through chemical and environmental engineering led her to a profession she described as deeply fulfilling.
Joan Fernandez followed an early interest in environmental protection to environmental engineering and consulting. Elizabeth Keddy’s path included the Chesapeake Bay, sustainability, energy, resiliency, and capital infrastructure. Jennifer McElroy traced her connection to childhood days spent exploring creeks, beaches,
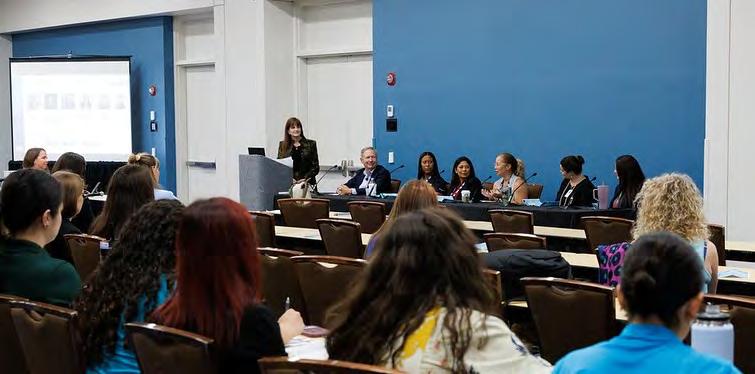
and stormwater systems before realizing that utilities offered a way to serve both science and community.
“Our profession really is a people-serving profession,” McElroy said, “and there’s so much we do for the community.”
That idea carried throughout the morning. Water may be the product, but people are the profession, and behind every treatment plant, pipeline, laboratory, and utility office are people whose work protects public health every single day.
Preparing the Next Generation
The discussion returned often to the “silver tsunami,” the wave of retirements already affecting utilities. The concern was not only how many people may leave, but how much knowledge may leave with them.
Panelists and facilitators emphasized that succession planning must be active. Organizations need to identify future gaps, cross train employees, explain career pathways, and help people prepare before vacancies occur.
Randy Brown described a utility exercise that color-coded an organizational chart based on retirement eligibility. The result made the risk visible: some crews and divisions could lose major experience within a short period. That realization led to more intentional conversations about training, licensing, qualifications, and advancement.
The panel also cautioned against assuming that the best technical performer will automatically become the best manager. Technical skill matters, but leadership requires preparation, communication, budgeting and contract knowledge, people skills, and trust.
Future leaders are not created the day a position opens and leadership isn’t something that’s handed to someone on their first day in a new position. It’s cultivated over years—through mentoring, opportunity, trust, and the willingness to let people grow before they’re needed.
Workplaces That Help People Stay
Attracting people into water is only the first step. Keeping them requires workplaces that understand how people actually live and work.
Panelists discussed field conditions, operations roles, facilities, caregiving, flexibility, maternity leave, aging parents, shift work, emergency response, and the limits of remote work. The conversation was practical: locker rooms, showers, private spaces for breast milk pumping, safe facilities, and thoughtful emergency operations planning all affect whether employees feel excepted and supported.
Flexibility also matters, but it must be applied carefully. Technology has made some office-based work more adaptable, but it does not solve the same challenges for operators, mechanics, field crews, and shift workers. Schedule changes, such as moving everyone to four 10-hour days, which appear beneficial on paper, can create unintended burdens for employees with childcare, eldercare, school schedules, or long commutes.
The underlying leadership lesson in the session was simple: know your people. When leaders understand their teams, they make better decisions about policies, facilities, schedules, and support.
A Conversation in Transition
The forum also acknowledged the changing legal and political environment surrounding programs described as diversity, equity, and inclusion (DEI). Participants discussed Florida Senate Bill 1134, which addresses official actions of local governments related to DEI.
The conversation was handled with care. The focus was not on labels, but on the substance of the work: attracting talent, retaining workers, broadening awareness of water careers, and ensuring that people who have historically been underrepresented can see a place for themselves in the profession.
The group discussed how future conversations
The full panel.
Session attendees.
Continued from page 29
may evolve, using language centered on workforce resilience, culture, belonging, stewardship, and the water workforce of the future. The words may shift, but the need remains.
From Listening to Participation
Midway through the session, the room shifted from discussion to participation.
Megan Nelson led attendees through a short visualization, movement practice, and partner-sharing exercise. Participants were invited to pause, notice their breath, imagine the version of themselves leaving the conference, and identify one word they wanted to take home. They then moved, stretched, and shared with someone nearby.
The exercise was brief, but it changed the room. It reminded attendees that professional learning is not only intellectual; the body also carries memory, confidence, stress, and connection. In a field shaped by problem solving, emergency response, compliance, and technical precision, the pause created space to notice what was being learned and what might be carried forward.
It also helped people meet each other. In water, relationships are not secondary to the work—they are part of how the work gets done.
Advice Worth Carrying Forward
The panelists shared practical advice for professionals at all stages of their careers:
S Ask questions.
S Take notes.
S Follow up when something interests you.
S
S Ask supervisors to clarify priorities when the workload becomes too large.
S Do not expect perfection early in your career.
S Do not close the door too quickly when someone sees potential in you.
Several panelists emphasized mentorship. Nearly every panelist could point to someone who encouraged them, challenged them, or simply believed in them before they fully believed in themselves. Mentors don’t just answer questions—they open doors, guide people toward professional organizations that may help them, expand possibilities, and sometimes change the course of a career. The panel also encouraged attendees to become mentors to others.
Another recurring message was direct: bet on yourself. If you are asked to do something that you think might be out of your comfort zone, but someone thinks you can do it, try it. Bet on yourself and take that opportunity because it might not come around again.
The forum also highlighted the value of field knowledge and nontechnical professionals. Operators, mechanics, engineers, human resources professionals, communications staff, consultants, regulators, and managers all shape the water workforce. The industry is stronger when those groups understand and respect one another’s contributions.
Continuing the Conversation
The Women of Water Forum has always been more than a panel. It is a place to hear
ideas, build relationships, and remember that leadership happens at every level.
In 2026, the conversation widened. It honored women in water, while pointing toward a larger workforce truth. The industry needs more awareness, more pathways, more mentors, more flexibility, more field respect, and more people willing to make space for others.
The next generation of water professionals is already here: in classrooms, treatment plants, utility offices, laboratories, consulting firms, public works departments, communications teams, maintenance shops, and conferences where someone hands them a microphone and invites them to speak.
The forum ended with a group photo, but the photo was more than a closing formality. It captured the energy of the room: panelists, facilitators, attendees, men, women, advocates, early-career professionals, seasoned leaders, operators, engineers, consultants, public servants, and support professionals who gathered after two hours of conversation.
The future of the water workforce needs everyone and depends on welcoming talent from every background, investing in the next generation, and creating workplaces where everyone can thrive.
Because protecting our most precious resources has never been the work of just one profession, one generation, or one group of people. It takes all of us.
Megan Nelson, P.E., is chief engineer at Orange County Utilities and Marjorie G. Craig, P.E., is the recently retired utilities director for the Village of
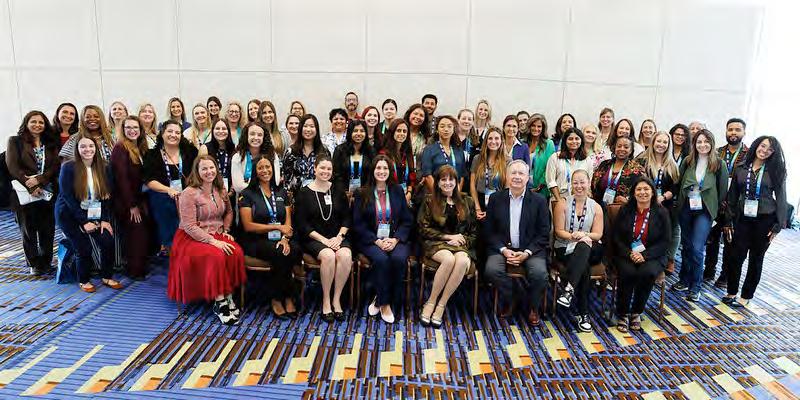
Women of Water session group photo.
Shovelers Breakfast and Meeting SHOVELERS EVENTS Shovelers Holds Annual Meeting and Induct New Members
The Florida Select Society of Sanitary Sludge Shovelers (FSSSSS) breakfast was held on Monday at the conference. Patrick “Murf” Murphy presided over the meeting.
The agenda each year is generally the same: attendees sign in, review the contact list for errors and missing information, report the spotting of
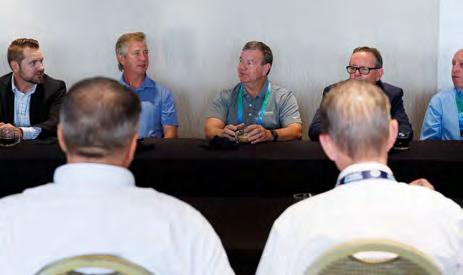
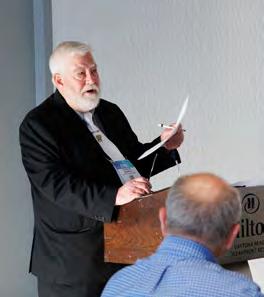
fellow shovelers not properly attired with their shovel pin, and share stories. They also advise the leadership (ph7) of FSSSSS potential candidates who should be given consideration for membership in the future, and then sign the certificates for the nominees for the current year deemed to have contributed outstanding and meritorious service above and beyond the call of duty to the Florida Water Environment Association (FWEA) per the guidelines.
The nominees must be present at the conference awards luncheon to receive their certificate and pin as dictated by tradition. The names of the nominees remain secret until the awards ceremony, except for the shovelers who attend the breakfast.
Meeting attendees.
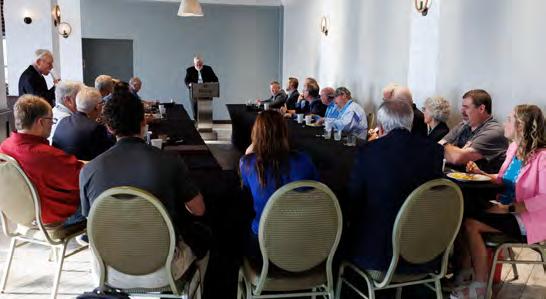
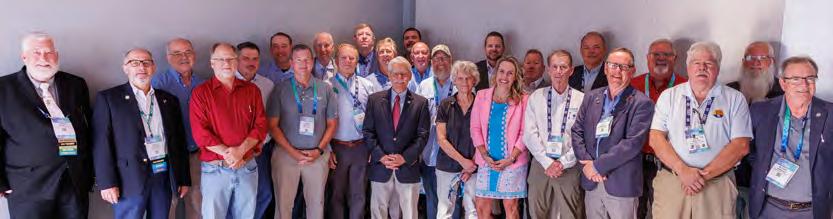
New Members for 2026 Inducted
Three nominees for FSSSSS became members of the organization after completing a tongue-twisting induction exercise at the conference, held on Tuesday during the FWEA luncheon. Murphy, the chair of the society, took to the podium and began the ceremony.
The inductees this year were:
S Joe Paterniti, Clay County Utility Authority
S Dustin Chisum, Heyward Florida
S Scott Ruland, Woodard & Curran
These three each took their turn at the podium, and after successfully repeating the name of the society three times (after several tries!), received their certificates as members of the Class of 2026. The new members also received the coveted Silver Shovel pin, which, according to FSSSSS, should be worn at all times.
Each nominee must be a FWEA member in good standing at the time of nomination. The nominees must also be present at the FWRC luncheon to receive the award as dictated by tradition.
Upon successful completion of the induction ceremony, the nominees are:
“Elevated on the official shovel to the highest ridge on the sludge bed, with the title of Florida Select Society of Sanitary Sludge Shoveler, and with all the honors, atmosphere, perquisites, and dignity appertaining thereunto.”
Murphy moderates the meeting
Meeting in progress
Group photo of attendees.
CHARTER MEMBERS –Class of 1956
* Founder: David B. Lee
* M. Emory Dawkins
* Pat Flanagan
* John E. Kiker Jr
* C. E. Richeimer
* K.S. Watson
Shoveler Class of 1957
* Ralph H. Baker
* Bill Bryant
* J. Robert Hoy
* Emil Jensen
Shoveler Class of 1958
* J.J.R. Bristow
* Ralph E. Fuhrman
* Wylie W. Gillespie
* Ellis K. Phelps
* R.E. Simon
Shoveler Class of 1959
* Sidney A. Berkowitz
* Thomas De S Furman
* D. Joe Raye
* John D. Wakefield
* Joe C. Woolf
Shoveler Class of 1960
* Clifford M. Courson
* Arthur R. Finney Jr
* George T. Lohmeyer
Shoveler Class of 1961
* Ray Lawrence
* Robert R. McNary
* Ralph L. Metcalf
* E.C. Shreve Jr
Shoveler Class of 1962
* Perry A. Cessna
* Fred A. Eldness
* Harry E. Schlenz
Shoveler Class of 1963
* Alvin R. Murphy Jr
* Vincent D. Patton
* J.A. Shepard
* Sidney W. Wells
Shoveler Class of 1964
* John E. Baber
* J.F. Kapinos
* Donald P. Schlesswohl
* Robert S. Shaw
* Raymond C. Willis
Shoveler Class of 1965
* Charles E. Adams
* Fred C. Funnell
* Sam P. Robinson
* Sam Scott
* Joe M. Valdespino
Shoveler Class of 1966
* Arthur D. Castor
Albert Henderson
* Hoyle Knight
Robert S. Wright

FLORIDA SELECT SOCIETY OF SANITARY SLUDGE SHOVELERS
Shoveler Class of 1967
* Lou Branding
* K.K. Hufstetler
* Richard P. Vogh
Shoveler Class of 1968
* Paul D. Haney
* Nick Mastro
* John V. Miner Jr.
* Thomas P. Smith
Shoveler Class of 1969
* William P. Allman
* Hugh Pearch
* James Santarone
* Robert Sinn
* Arthur F. Vondrick
Shoveler Class of 1970
* Roderick W. Campbell
* Joseph B. Hanlon
* John B. Miller
* Charles C. Sweglar
Shoveler Class of 1971
* Hardy C. Croom
* L.T. Faulk
Joseph F. Lagnese Jr.
Shoveler Class of 1972
* J. Floyd Byrd
* B.T. Dean
* Harry W. Gioielli
* S.M. Richard Jr
Shoveler Class of 1973
Charles L. Meyer
* Richard C. Mills
* John D. Parkhurst
* George E. Symons
* William C. Timms
Shoveler Class of 1974
* James F. Barlow
* John A. Dacy
* R.L. Hart
* Victor G. Wagner
Shoveler Class of 1975
* Mac Grossman
* Cecil M. Kent
* Madame Jean Suave
* William P. Simpson
* Horace L. Smith
Shoveler Class of 1976
* John W. Bamble
* George W. Parker Jr.
* Norman Tuckett Jr.
Shoveler Class of 1977
Richard Englebrecht
* George Humphreys
* R.A. Litkenhaus
* J. Edward Singley
* Garrett Sloan
Shoveler Class of 1979
* Donald K. Shine
* Geoffrey Scott
* Bobby L. Jones
Shoveler Class of 1980
* Ray C. Holman
Terry Knepper
* E. Jack Newbould
* Joseph Papia
* David B. Preston
Shoveler Class of 1981
* Robert A. Canham
* George B. Furman
* Phil E. Whelchel
Shoveler Class of 1982
* William E. Dunn
* Everett Kinloch
Shoveler Class of 1983
* Joan E. Stokes
James Taylor
Shoveler Class of 1984
* Frank D. Hoble
Larry Robinson
* Wally Zentner
Shoveler Class of 1985
* James M. McCracken
* William D. Johnson
Shoveler Class of 1986
* George H. Dacy
* Kenneth M. Drury
* Theodore C. Pope
Shoveler Class of 1987
Thomas M. Baber
J.I. Garcia-Bengochea
* Richard Sheldon
Shoveler Class of 1988
* Joseph Cheatham
* Robert Driver
David Stewart
Shoveler Class of 1989
Phillip K. Feeney
* Herb Pickle
Samuel R. Willis
Shoveler Class of 1990
Patrick Karney
* Robert Parmelee
H.E. Pruder
Phil Searcy
Shoveler Class of 1991
* Sam P. Gutridge III
Katherine Kinloch
Shoveler Class of 1992
Donald Holcomb
Shoveler Class of 1994
Salvatore D’Angelo
Bert Hale
Charles Jacobs
Shoveler Class of 1995
Donald Munksgaard
Charles Logue
* James Baird Jr
Douglas W. Fredericks
Shoveler Class of 1996
Rim Bishop
Gregory J. Chomic
Thomas Mueller
Shoveler Class of 1997
* David L. Crowson
Richard W. Fernandez
* Joseph Habraken
* J.C. Holley
Shoveler Class of 1998
Charles C. Billias
Michael D. Cliburn
* C. W. “Mickey” Sheffield
Shoveler Class of 1999
Robert Bailey
Larry J. Ruffin
Thomas Lothrop
Shoveler Class of 2000
* Jessie L. Carpenter
* Juan A. Citarella
Julie L. Karleskint
Shoveler Class of 2001
Luis Aguiar
John Harward
* Grady Sorah
Richard Voorhees
Shoveler Class of 2002
Gary D. Dernlan
* Rudolph Fernandez
Arthur P. Saey
* Kenneth Wilson
Shoveler Class of 2003
Christine Ferraro
William Edgar
Kenneth Rearden
Roy Pelletier
Shoveler Class of 2004
Thomas Helgeson
Raymond E. Hanson
Robert Solomon
Shoveler Class of 2005
Scott Kelly
Holly M. Hanson
Douglas Prentis
Shoveler Class of 2006
Shoveler Class of 2008
Chuck Hlavach
Tim Madhanagopal
Jon Meyer
Shoveler Class of 2009
* Albert “Bill” Heller Jr
Mark McNeal
Donna Kaluzniak
* Donald Maurer
Shoveler Class of 2010
Pamela Holcomb
Thomas King
Christopher Stewart
Shoveler Class of 2011
Walter Barrett
John Giachino
George Lomax
Shoveler Class of 2012
James Hope
Nabil Muhaisen
Lisa Prieto
Shoveler Class of 2013
Timothy McVeigh
Darrell Milligan
Paul Pinault
Shoveler Class of 2014
Patrick Allman
* Richard Griswold
Christine Miranda
Shoveler Class of 2015
Gregory Kolb
Frederick Nugent
Jeffrey Poteet
Shoveler Class of 2016
Brad Hayes
Ronald Shupler
Brian Wheeler
Shoveler Class of 2017
Tom Evans
Chris Fasnacht
Sondra Lee
Shoveler Class of 2018
Raymond Bordner
Ron Cavalieri
David Hartwig
Shoveler Class of 2019
Clyde Burgess
Tim Harley
Patrick Murphy
Shoveler Class of 2020
Tina Nixon
Larry Hickey
Mike Darrow
Shoveler Class of 2022
Keaton Heller
Chris Collins
Lynn Spivey
Shoveler Class of 2023
Jason Hopp
Suzanne Mechler
* Chuck Nichols Sr
Shoveler Class of 2024
Bob Bierhorst
Darryl Parker
Tim Ware
Shoveler Class of 2025
Kristiana Dragash
David Hunniford
Ada Levy
Shoveler Class of 1978
* Arthur Saarinen Jr
* Felix Janocha
Charles Hogue
* Curtis Stanton
David Shulmister
* J. Jack Smith
Shoveler Class of 1993
Timothy Brodeur
* David Pickard
Frederick Trippensee
* Lee Kraft
O.H. “Sonny” Moss
* David York
Shoveler Class of 2007
Kartik Vaith
Mark Cliburn
Edward James
Shoveler Class of 2021
Mike Sweeney
Vaughan Harshman
Jake Rohrich
Shoveler Class of 2026
Joe Paterniti
Dustin Chisum
Scott Ruland
*Deceased
Industry Experts Share Their Information, Experience, and Expertise TECHNICAL SESSIONS AND WORKSHOPS
Professionals in the industry gave presentations at the conference on the latest technical and managerial information for water and wastewater personnel.
The workshops at the conference covered the topics of chemical safety, surface water treatment, information and operational technology for operators, operational water and wastewater math, wastewater collection systems, mechanical safety, care and cleaning of membranes, and using artificial intelligence to enhance utility performance.
The two-day technical program included technical sessions on
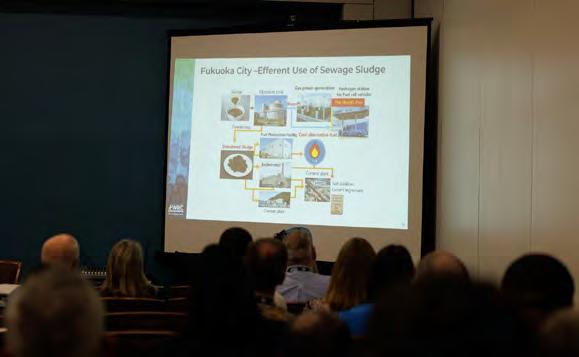
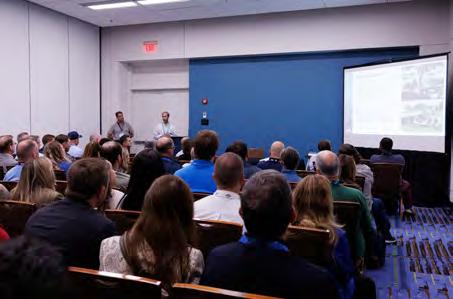
modeling, geographic information systems, and computer applications; stormwater and green infrastructure; distribution systems; wastewater treatment; sustainability; potable water treatment; facilities operation and maintenance; utility management; water supply and water quality; collection systems; per- and polyfluoroalkyl substances and emerging contaminants; reclamation and reuse; nutrient removal; communications and public engagement; biosolids and resource recovery; and utility funding, finance, and fees.
Pictured are some of the workshops and sessions.
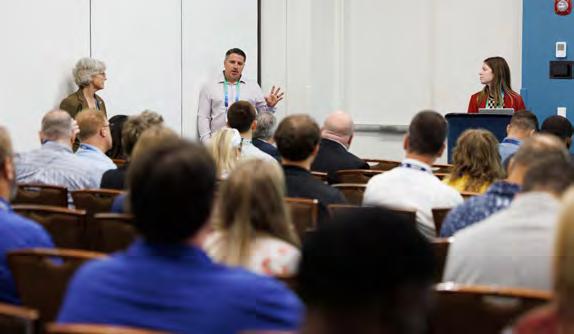
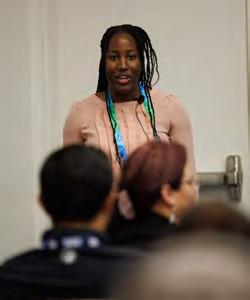
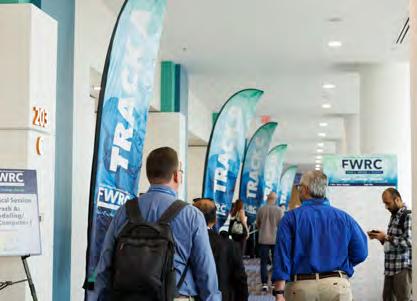
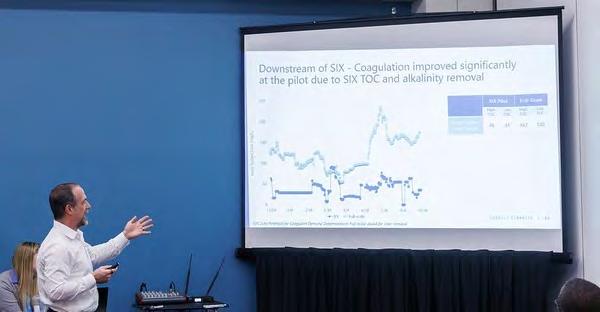
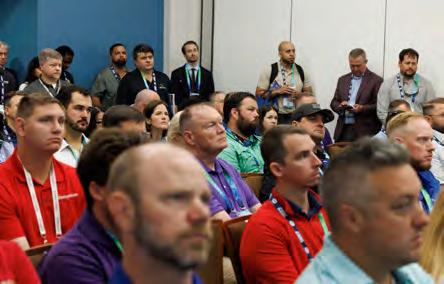
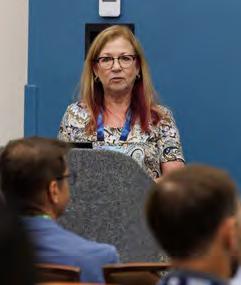

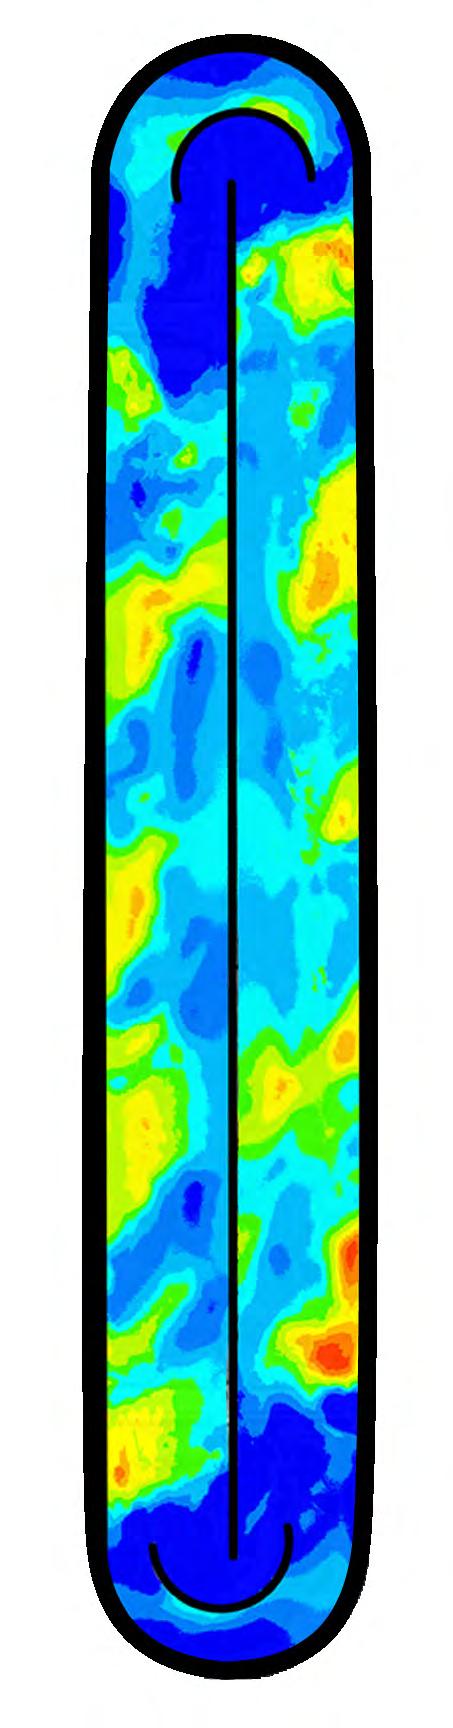
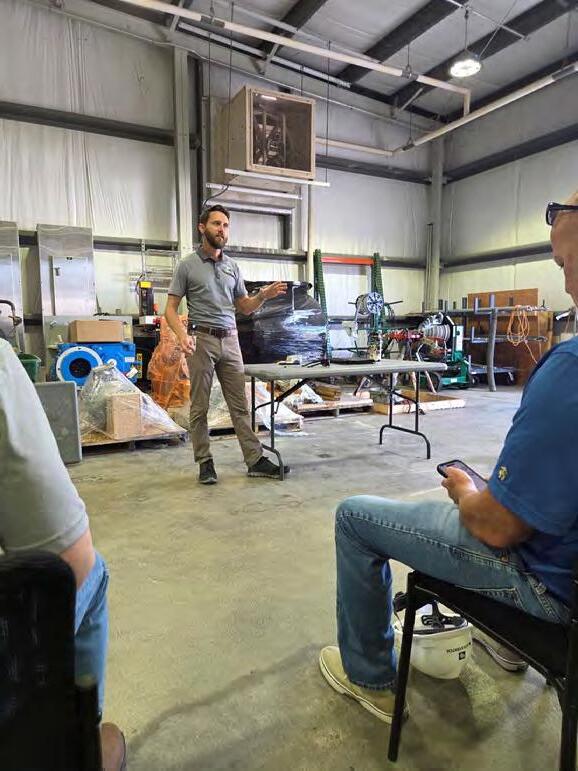
FACILITY TOURS
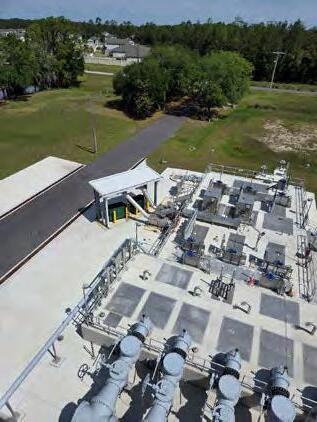
City of Daytona Beach Water and Wastewater Plant Tour
This tour,, held on Wednesday, April 29, offered attendees a behind-the-scenes look at one of the region’s most important utility facilities, the LPGA Water Treatment Facility, which is home to the Ralph Brennan Water Treatment Plant (WTP) and the Westside Regional Water Reclamation Facility (WRF). They both play a critical role in supporting Daytona Beach’s growing population and serve as an excellent example of integrated water and wastewater management.
The WTP operates as a lime softening facility and is permitted to treat up to 24 million gallons per day (mgd) while the WRF can produce up to 15 mgd of public access reclaimed water through a biological nutrient reduction treatment process.
The attendees learned about lime softening treatment processes, drinking water production operations, biological nutrient removal systems, public access reclaimed water production, and utility resiliency and operational planning.
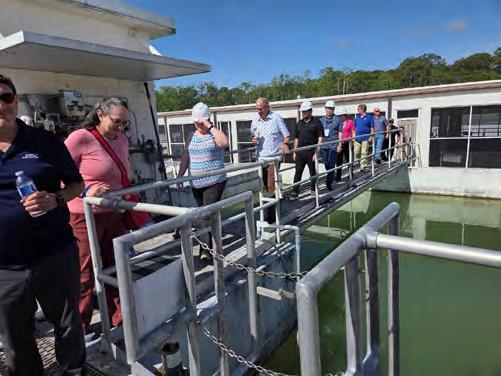
The tour guides were Eric Smith, Steve Sweade, Dave Engstrom, and Steve Stuff.
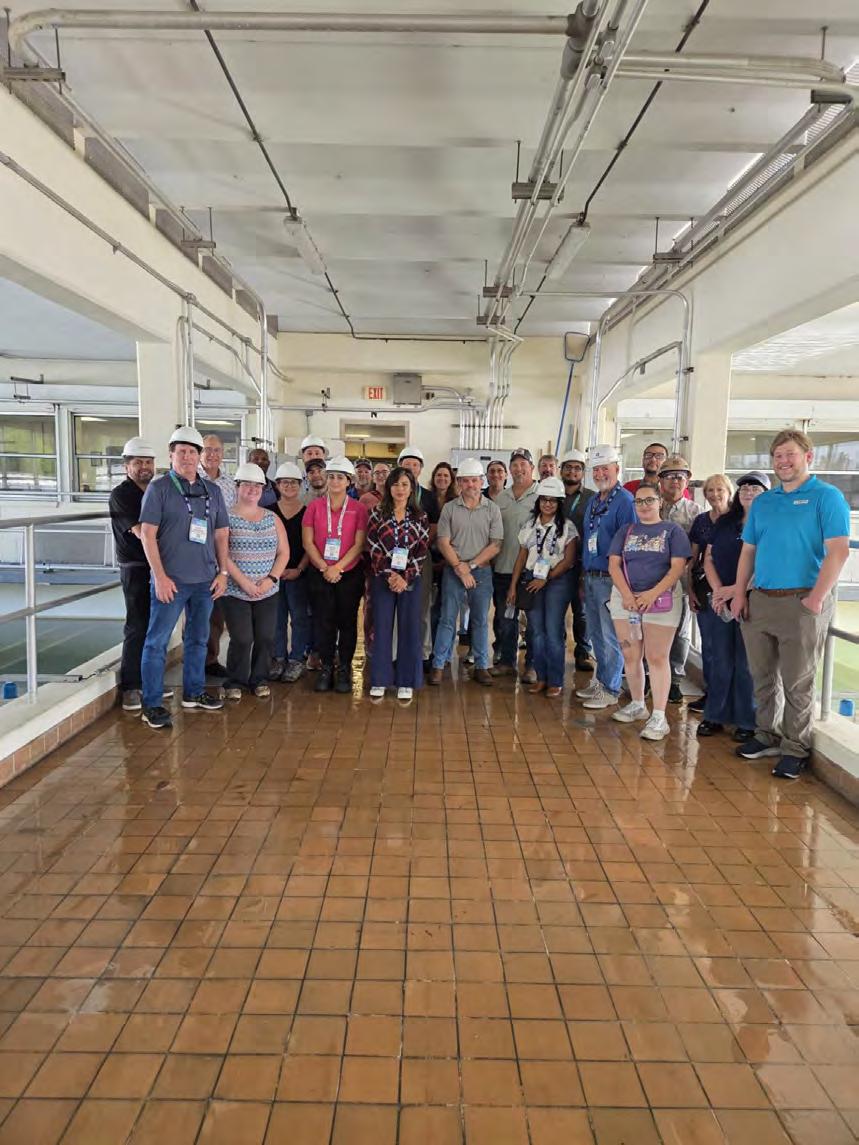
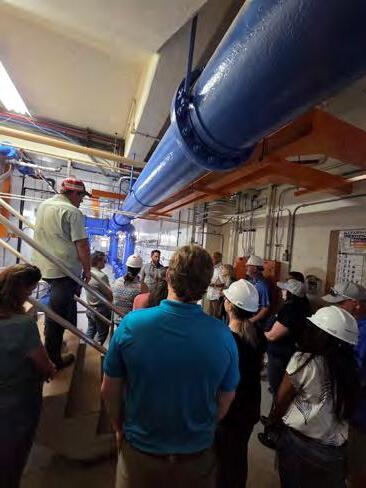
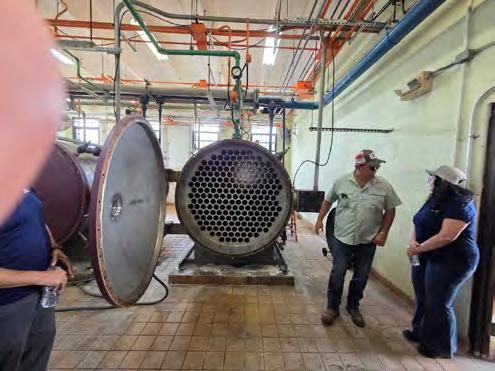
Eric Smith, Daytona Beach director, presenting a brief history of Daytona Beach Water and Wastewater Plant.
Observing clarification of the potable water. Inside the water treatment facility. Ozone being produced.
The Daytona wastewater influent pump station as seen from atop the headworks structure.
City of Daytona Beach Lift Station 34 Walking Tour
On Tuesday, April 28, tour participants from the conference explored the replacement of the City of Daytona Beach Lift Station 34, which was originally constructed in the 1970s as a dry pit/wet pit facility. The project transformed the aging infrastructure into a modern wet well equipped with submersible pumps designed to improve reliability, operational safety, and maintainability.
Those in attendance learned about the planning, design, and construction challenges associated with replacing an aging lift station on a tight site within an established residential neighborhood. The tour highlighted lessons learned related to maintaining service during construction, working within a limited space, and coordinating improvements in a highly visible coastal community.
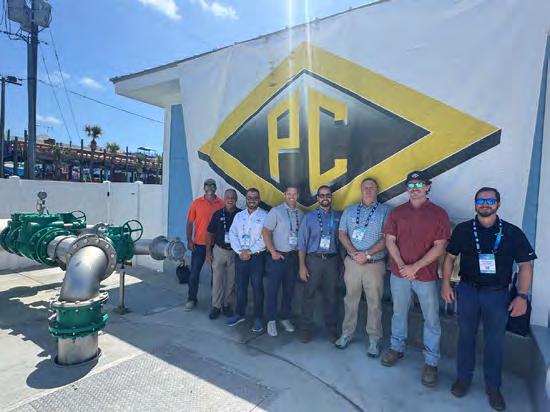
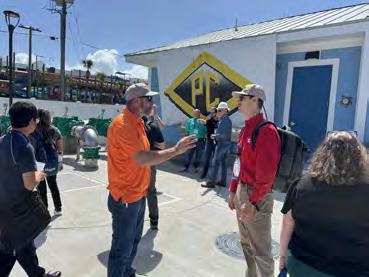
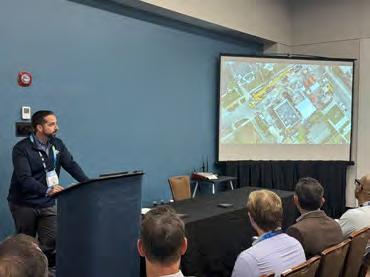
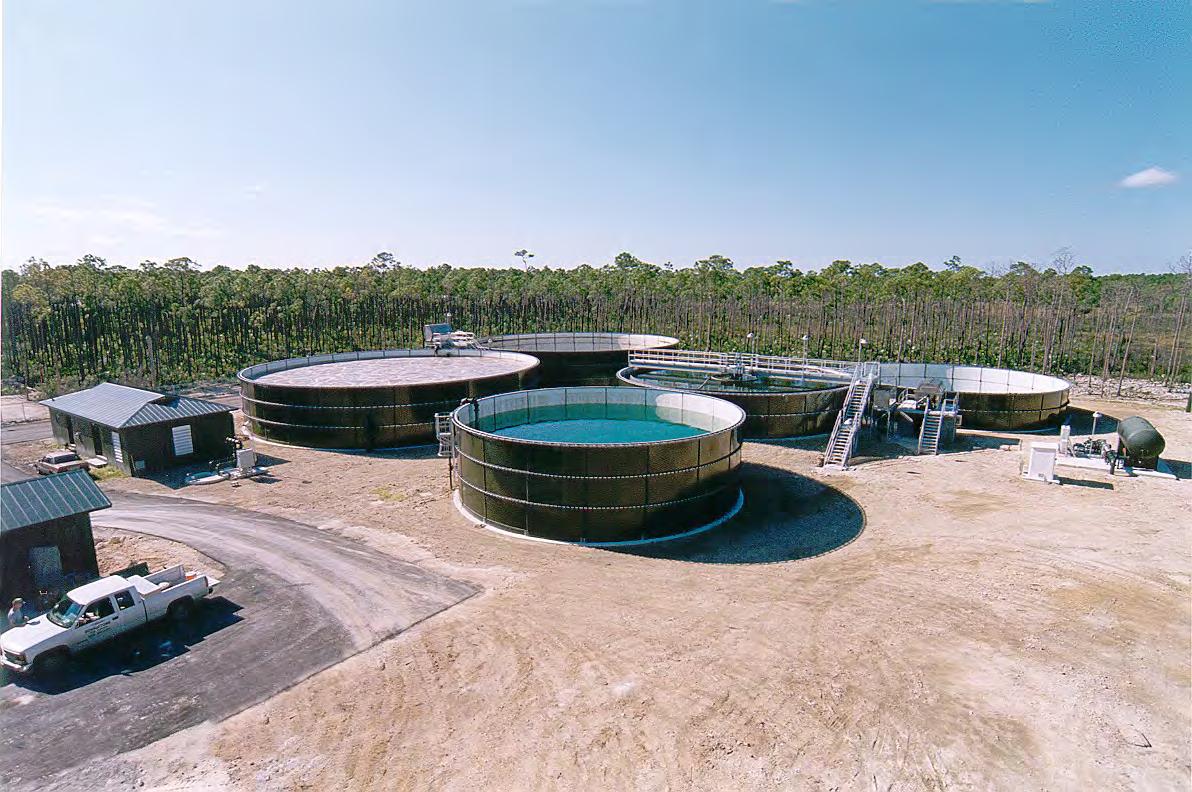
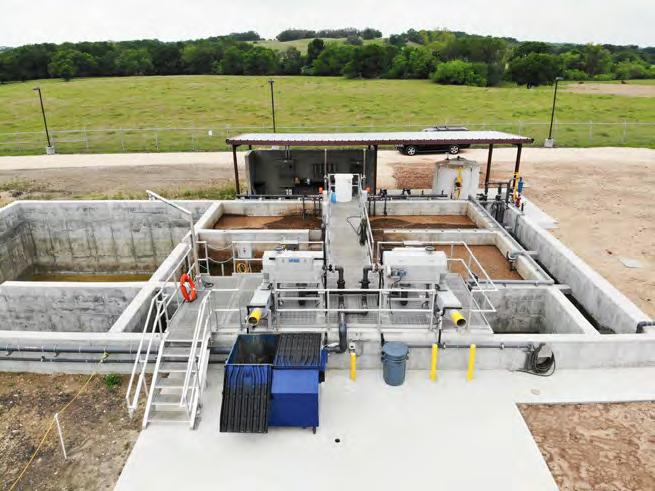

From left are Justin Daily, general superintendent; Dan Nawrocki, senior vice president; Wes Bashlor, project director; Jason Surowiec, preconstruction manager; John Yesalonia, construction executive; Andrew Crouse, project director; Kyle Thompson, project engineer; and Nick LeClerc, project manager of PC Construction’s Florida team at Daytona’s Lift Station 34.
Justin Daily (in orange shirt), PC’s general superintendent, discusses elements of the project with an attendee of the tour.
John Yesalonia (at podium), PC’s construction executive, presents the access challenges of Lift Station 34 to attendees.
FWPCOA OPERATORS SHOWCASE
Advancing Florida’s Water Production: From Parks to Reclamation
Operators from across Florida came to the conference to learn about timely issues to use as they develop in their careers. On Monday, some attended the Operators Showcase to learn about water scarcity due to urban development and environmental issues, which is driving Florida water professionals to develop new technologies that can produce the volume of water needed by users and meet the highest degree of water treatment. The showcase was sponsored by the Florida Water and Pollution Control Operators Association (FWPCOA) and moderated by Manny Moncholi, Ph.D., P.E.
Strategies for Water Resiliency and Conservation
John O’Brien
Florida’s utilities continue to face rising pressure from population growth, saltwater intrusion, aging infrastructure, and increasingly variable hydrologic conditions. At the showcase, presenters highlighted a unified theme: water resiliency depends on smarter regulation, stronger source control, and advanced treatment that aligns with “fit for purpose” principles. This presentation discusses the regulatory and technical foundations that shape potable reuse and resilient water supply planning in Florida.

S Ambient Water Quality Criteria. This defines pollutant concentrations unlikely to pose human health risks, which includes both microbial and chemical criteria designed to protect exposed populations.
S Pretreatment and Source Control. Because wastewater contains variable industrial and commercial inputs, pretreatment programs are essential. Industrial and some commercial wastewater may contain concentrations of metals or organics far above normal domestic wastewater.
Effective source control reduces treatment burden and improves the reliability of potable reuse systems.
Regulatory Foundations for Potable Reuse
A Patchwork of State-Level Frameworks
There are currently no federal regulations written specifically for potable reuse. States can instead rely on the Safe Drinking Water Act (SDWA) and Clean Water Act (CWA) as guiding structures and may choose to implement potable reuse using these requirements.
This flexibility has allowed Florida to move aggressively toward reuse-driven resiliency.
Fit for Purpose: A Modern Regulatory Lens
The U.S. Environmental Protection Agency (EPA) now endorses a “fit for purpose” approach, meaning treatment requirements are matched to the intended end use.
For potable reuse, this means advanced treatment trains must reliably meet drinking water standards while addressing source-specific risks.
Clean Water Act Considerations
The CWA governs pollutant discharge and sets expectations for water quality in receiving waters. Several components directly influence potable reuse planning:
Microbial Risk and Treatment Requirements
Quantitative Microbial Risk Assessment
Microbial constituents remain a primary concern in reuse. Quantitative Microbial Risk Assessment provides a structured method to evaluate pathogen densities, exposure pathways, and dose-response relationships. This informs treatment targets and redundancy requirements.
Surface Water Treatment Rule
The Surface Water Treatment Rule establishes minimum log-removal/inactivation requirements for key pathogens:
S 3 log Giardia
S 4 log viruses
S 2 log Cryptosporidium
Utilities achieve these objectives through combined filtration and disinfection. The CT (concentration × contact time) values define the inactivation credit for disinfectants, such as chlorine, chloramines, chlorine dioxide, and ozone.
Safe Drinking Water Act Requirements
All potable reuse water must meet SDWA standards, including:
S National Primary Drinking Water Regulations. Enforceable maximum contaminant levels or treatment techniques.
S National Secondary Drinking Water Regulations. Nonenforceable aesthetic standards, such as color, odor, pH, and cloudiness.
These benchmarks ensure that reclaimed water used for potable purposes is both safe and acceptable to consumers.
Florida’s Clean Waterways Act and Potable Reuse
Florida’s 2020 Clean Waterways Act formally recognized reclaimed water as a potable water source, requiring it to meet or exceed drinking water standards. The Florida Department of Environmental Protection subsequently updated Chapters 62 565, 62 610, and 62 625 of the Florida Administrative Code to incorporate potable reuse. This regulatory clarity positions Florida as a national leader in potable reuse implementation.
Conclusion
Water resiliency in Florida will depend on integrating advanced treatment, robust source control, and a fit for purpose regulatory mindset. As potable reuse becomes more widespread, operators will play a critical role in ensuring treatment reliability, regulatory compliance, and public confidence.
John O’Brien is chief water/wastewater plant operator at the Palm Beach County Southern Region Water Reclamation Facility and is chair of the FWPCOA Direct Potable Reuse Committee.
Tide, Flows, and Pollutants: An Integrated Approach to Biscayne Bay Water Health
Grace Pleasant and Pradeep Nagarajan
Biscayne Bay is one of south Florida’s most iconic natural treasures—a subtropical lagoon stretching across Miami Dade, Monroe, and Broward counties that’s home to seagrass meadows, mangroves, and the nurseries that sustain the region’s marine life. Beneath its blue surface, however, the bay is struggling: water quality impairments, nutrient loading, and hydrologic alterations have pushed the system to a tipping point. Miami Dade County (county) and its partners are taking on the challenge with one of the most ambitious integrated modeling efforts ever attempted for the bay.
Why Biscayne Bay Needs a New Approach
With 428 square miles of estuary and five million feet of interconnected canals, the bay is shaped by both natural forces and human infrastructure. Freshwater inflows, groundwater interactions, stormwater systems, and tidal exchange all influence how pollutants move through the watershed.
The county’s Reasonable Assurance Plan calls for restoring water quality and hydrology, protecting groundwater, and revitalizing wetlands, but to do that effectively, managers need a unified picture of how the entire system behaves—not just isolated pieces.
That’s where integrated modeling comes in.
Building a Countywide Water System Model
The project team, including Miami Dade County, Florida Department of Environmental Protection, Environmental Science Associates, 36 municipalities, and local and nonprofit community organizations, set out to build and calibrate a comprehensive surface water–groundwater model capable of simulating everything from rainfall and recharge to canal hydraulics and nutrient transport.
Their framework combines three major engines:
S MIKE SHE for groundwater, overland flow, recharge, evapotranspiration, and saturated/unsaturated zone processes
S MIKE+ for canal hydraulics, storm sewer networks, structures, pumps, and advective transport
S MIKE ECO Lab for biological and chemical water quality processes including nitrogen, phosphorus, temperature, pH, and chlorophyll-a
These tools allow the team to track how nutrients enter canals, move through the network, and ultimately reach the bay.
Inside the Model: From Land Use to Canal Gates
To represent the watershed accurately, the team incorporated:
S L and use based roughness coefficients (Manning’s M = 1/n)
S O verland flow and ponded drainage systems
S Unsaturated and saturated zone parameters, including hydraulic conductivity and drainage codes
S A detailed canal network with primary and secondary rivers, cross sections, culverts, bridges, pumps, and 98 active gates
S B oundary conditions including 43 closed boundaries, 14 tailwater boundaries, and 4 inflow points
The MIKE SHE and MIKE+ models were then tightly coupled so groundwater heads, overland flow, and canal hydraulics influence one another in real time.
Testing the System: Hurricane Irma as a Calibration Event
To validate the model, the team used Hurricane Irma (from September 2017), which was a rare event that stressed every part of the hydrologic system. The calibration period spanned Sept. 2-18, 2017, and focused on matching:
S Groundwater heads
S Groundwater recharge
S Canal water levels
S Spatial patterns of headwater and tailwater conditions
The results showed strong alignment between simulated and observed conditions,
giving confidence that the model can support future planning and restoration decisions.
What Comes Next: Adding Water Quality Intelligence
With hydrology and hydraulics calibrated, the next phase is to build a MIKE ECO Lab water quality model that simulates:
S Temperature
S pH
S Nitrogen
S Phosphorus
S Chlorophyll-a
This will allow the county to evaluate how pollutant reduction projects affect nutrient loads and to identify where additional municipal actions are needed.
A Smarter Path Forward for Biscayne Bay
The bay’s challenges are complex, but so is the team working to restore it. By integrating groundwater, surface water, and water quality modeling, the county is building a science driven foundation for long term recovery. This isn’t just a modeling exercise — it’s a roadmap for protecting one of Florida’s most valuable ecosystems.
Grace Pleasant is an engineer and Pradeep Nagarajan P.E., is a project manager with GHD.
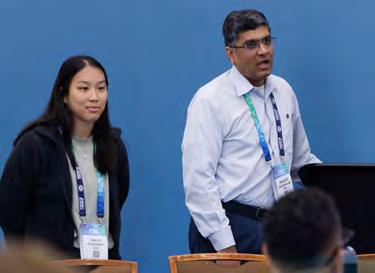
Grace Pleasant and Pradeep Nagarajan.
Water Scarcity in Florida: Water Loss Prevention Through AMI Smart Utilities Implementation
Andrew Swirsky
Florida’s water utilities are under pressure—literally and figuratively. Population growth, aging infrastructure, and tightening water supplies are forcing utilities to rethink how they measure, monitor, and manage every gallon. At the center of this shift is a new generation of advanced metering infrastructure (AMI) and digital tools that connect engineering, operations, and finance in ways that were unthinkable a decade ago. The message to Florida utilities is clear: the era of “billing only” AMI is over. The future belongs to integrated, data-driven systems that combine metering, pressure monitoring, leak detection, and analytics into a unified operational ecosystem.
Technology Adoption is Accelerating, Expectations are Rising
Utilities across the United States are moving into what is being called AMI 2.0 or AMI+, where the value extends far beyond meter reading. This new AMI is not used for just billing anymore; utilities are connecting engineering, operations, and finance all together.
New procurements increasingly require:
S Built in leak detection
S District metering capabilities
S Pressure monitoring
S Integration with supervisory control and
data acquisition (SCADA), geographic information systems (GIS), and work order systems
Utilities that cannot extract these capabilities from their existing AMI networks are returning to bid—an indicator of how essential these functions have become.
Why Water Loss Management Needs a Modern Upgrade
The industry’s traditional guide, AWWA Manual M36, Water Audits and Loss Control Programs, remains foundational, but increasingly mismatched with today’s technology landscape. It’s useful for theory, but is not current with best technology and often dramatically underestimates the cost of real losses.
The distinction between real losses and apparent losses is central:
S Real losses: pipeline leaks, service failures, tank overflows—water that never reaches a customer.
S Apparent losses: meter inaccuracies, unauthorized consumption, data errors— water delivered but not billed.
Real and apparent losses require different tools. A utility that does not separate them will spend capital on the wrong interventions; AMI, however, provides the granularity needed to finally separate these categories at scale.
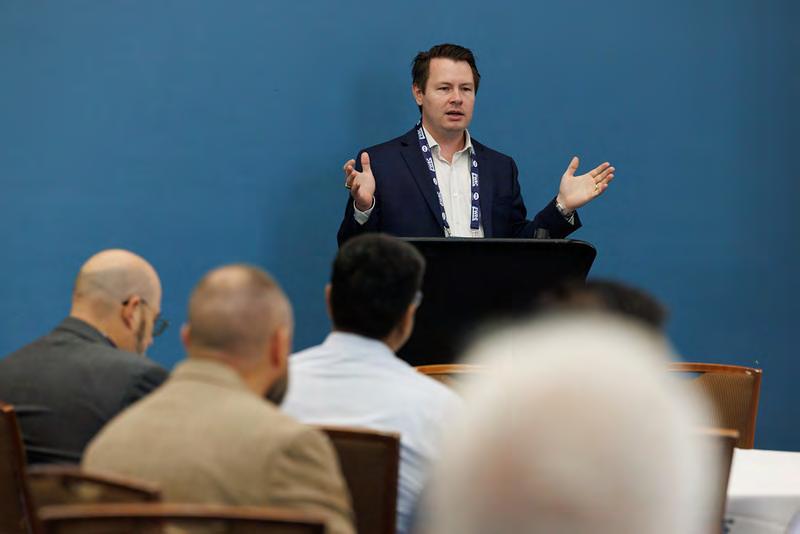
Andrew Swirsky
Pressure Management: The Quiet Workhorse
Pressure is one of the most powerful— and underused—levers in water loss control.
A reduction of just 10 pounds per square inch can reduce water losses by 10 to 20 percent, depending on pipe age and materials. With AMI enabled pressure sensors, utilities can:
S Identify transient pressure spikes
S Detect pressure reducing valve malfunctions
S Optimize pressure zones
S Reduce background leakage
This is where AMI shifts from a billing tool to an operational asset.
District Metering Areas: The Backbone of Modern Water Loss Control
A practical rule of thumb is 1,000 to 3,000 connections per district metering areas (DMA), which allow utilities to compare:
S Total water entering a zone (SCADA or district meters)
S Total water consumed (AMI)
S The balance—real and apparent losses
This zoned approach enables targeted interventions rather than systemwide guesswork.
A utility can use self-designed DMA zones, integrated SCADA, AMI, GIS, and work orders to uncover both water loss and AMI performance issues.
North Miami Beach: A Glimpse of the Fully Integrated Future
One of the most forward-leaning examples is North Miami Beach, where a fully integrated water and wastewater sensor network and artificial intelligence ecosystem is under design. The focus includes:
S Key performance indicator driven outcomes
S C ombined AMI, DMA, and leak detection
S Cross system data integration for sewer sheds and DMAs
This is the blueprint for the next decade of Florida water management.
Acoustic Leak Detection and Sensor Strategy
The AMI-based acoustic leak detection is emerging as a powerful complement to pressure and flow analytics, but the real differentiator is a tiered sensor deployment strategy, ranked by cost-effectiveness:
1. Retrofits at existing air release valves and pressure release valves: lowest cost, immediate value
2. City-owned access points: hydrants, vaults, pump stations
3. New right of way installations: highest cost, reserved for critical gaps
This structured approach ensures utilities invest where the data payoff is highest.
The Five Components Every Smart Utility Needs
A holistic framework blends physical and digital infrastructure:
S Data collection and transmission
S Databases and software tools
S Engineering and data science
S S ensor installation and management
S Pipeline repair and construction management
There is no such thing as a “digital-only” project; the physical and the digital must be connected.
The Big Takeaways for Florida Utilities
The four main operator ready directives are:
S S olve your apparent losses first—they offer the fastest financial return on investment.
S Segment your system into DMAs—track performance by area, not systemwide averages.
S Use your data to identify key events— breaks, leaks, pressure anomalies.
S Build a cross department team— engineering, information technology, and operations must work together.
Closing Thoughts
Florida’s water future depends on smarter, more-connected systems. Pressure monitoring, AMI, leak detection, and integrated data platforms are no longer optional—they are the foundation of resilient, financially sustainable utilities.
The utilities that embrace AMI+ and data-driven operations will be the ones best positioned to protect their water resources, reduce losses, and deliver reliable service in an increasingly water scarce state.
Andrew Swirsky, P.E., is founder and chief executive officer of InfraSync Technology Services, with offices throughout the United States.
Overview of the JEA H2.0 Purification Center
Ryan Popko and Jo Ann Jackson
Florida’s water story is changing. Population growth, aquifer constraints, and rising environmental pressures are pushing utilities to rethink how they secure reliable, sustainable supplies. The new H2.0 Purification Center at JEA represents one of the most significant steps forward—Florida’s first full-scale potable reuse facility and a model for how advanced treatment can protect the state’s water future.
Floridians use nearly 6.4 billion gallons of water each day and that number is growing, with an estimated 1,000 people moving to Florida daily. The math is simple: demand is rising, traditional supplies are not. Purified recycled water is emerging as the most costeffective, environmentally responsible path to long-term resilience.
Florida’s Water Reality: Abundant, Yet Limited
Florida is often described as water rich—50 inches of annual rainfall, thousands of miles of rivers and coastline, and more first-magnitude springs than any other state.
The hydrology of Florida, however, is fragile. Much of that water is not available where or when it’s needed, and the Floridan aquifer— the backbone of the region’s drinking water supply—is under increasing stress.
Less than 0.5 percent of all the water on Earth is available as fresh water, and in Florida, that fraction is stretched thin by growth, climate variability, and ecological needs.
Aquifer withdrawal by JEA is already approaching its permitted limits. Conservation and reclaimed water help, but they cannot close the projected gap. By 2040, Florida will need an additional 1 billion gallons per day of supply. Potable reuse is one of the few options capable of meeting that scale.
Why Purification? A Natural Process, Accelerated
All water on Earth has been used and will be reused again, and potable reuse simply accelerates and controls what nature already does—filtering, transforming, and returning water to the aquifer.
The purification approach by JEA takes high-quality reclaimed water and treats it through a multibarrier advanced process
to produce drinking-water-quality purified water. This water is then used to replenish the aquifer, improving groundwater quality and expanding available supply.
C ompared to seawater desalination or long distance interconnections, purification is less costly, less energy-intensive, and more locally controlled. It also reduces nutrientladen discharges to the river, supporting ecological restoration goals.
The H2.0 Purification Program: A Decade in the Making
In 2014 JEA began planning its multidecade, three-phase purification program. The new center is the flagship facility of Phase III.
Facility Highlights
C omponents of the facility include:
S 1-million-gallon-per-day capacity, with room for future expansion
S Dedicated piloting and research area
S Replenishment well for consumptive-use credit
Continued on page 42
Continued from page 41
S Visitor Education Center with exhibits, tasting station, and 100 person classroom
S Florida Green Building Coalition Silver Rating and use of Florida Friendly Landscaping™ guidelines
S Opening for tours in 2026
The center is designed not only as an operational asset, but also as a public facing hub for education, transparency, and trust building—critical elements for potable reuse acceptance.
Permitting: Building the Plane While Flying It
When JEA began design, Florida had no potable reuse rule. The team adopted what it called a “crystal ball approach”—designing to meet or exceed the most stringent standards from other states while actively helping shape Florida’s future regulations.
At the time, the only available pathway was the Florida Department of Environmental Protection (FDEP) Rule 62 610 (wastewater) and JEA permitted the facility under 62 610 with conditions anticipating the forthcoming potable reuse rule. When FDEP created Rule 62 565, JEA transitioned smoothly and ultimately secured permits as both an advanced treatment water facility (ATWF) and a public water system (PWS).
Rule 62 565 sets some of the most protective pathogen reduction requirements in the United States:
S 14-log reduction of enteric viruses
S 12-log reduction of Cryptosporidium
S 12-log reduction of Giardia
These apply regardless of whether the project is indirect or direct potable reuse.
Operations and Staffing: A New Frontier for Florida Operators
Potable reuse facilities sit at the intersection of drinking water and wastewater operations. Florida’s existing licensing structure—separate Class A/B/C licenses for water and wastewater—remains in place, but ATWF staffing requirements depend on the treatment level of the source water.
The FWPCOA has created a potable reuse operator certification program, and while not yet required by FDEP, JEA has embraced it: 100 percent of JEA’s staff has taken the FWPCOA potable reuse course and passed it.
The staffing model at JEA blends water treatment plant and water reclamation facility operators, creating cross-training opportunities and a new career pathway for operators interested in advanced treatment.
Compliance: A Higher Standard of Oversight
Unlike a traditional PWS, the center has 14 compliance monitoring points and analyzes more than 40,000 water quality samples annually, including over 7,500 permit compliance samples.
This level of monitoring ensures that any deviation is detected long before it could affect water quality. It also provides a robust dataset for optimization, research, and public communication.
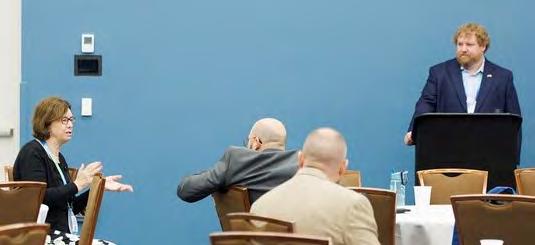
A Whole Utility Effort
Potable reuse is not an operations only project; there are more than 40 internal and external groups involved, from engineering, planning, and environmental compliance to communications, information technology, legal, procurement, hydrogeologists, contractors, and regulatory partners. This reflects a core truth: potable reuse is a utilitywide transformation, not just a treatment upgrade.
Benefits: More Than Just New Supply
The center delivers multiple long-term benefits:
S Maximizes use of existing water resources
S Protects and restores the aquifer
S Increases available groundwater supply
S Reduces discharges to the river
S Provides the most economical new supply option
S Improves groundwater quality
In a state where water defines ecosystems, economies, and communities, these benefits are profound.
Conclusion: Florida’s Water Future Is Purified
The center marks a turning point for Florida. It demonstrates that potable reuse is not a distant concept—it is a practical, safe, and sustainable solution ready to meet the state’s growing needs.
As the One Water Florida initiative puts it, potable reuse will “safely supply Florida’s future.” With the center, that future is already taking shape.
Ryan Popko, P.E., is water technology and engineering leader, and Jo Ann Jackson, P.E., is One Water national practice leader with JEA in Jacksonville.
Jo Ann Jackson (left) and Ryan Popko (at podium).
e system includes:
S 4,000 miles of pipe
S 20,00 fire hydrants
S 1,000+ lift stations
S 35,000 manholes
S 47,800 valves
Raw Water Wells Management
driven by iron bacteria that create a voluminous, slimy biomat that restricts water intake.
Other contributors include slime-forming bacteria, sulfate reducing bacteria, and fungi.
The resulting biofilm:
S Blocks water from entering the well screen
S Reduces pump efficiency
S Produces odors ranging from metallic to rotten egg
S Can discolor water
Treatment typically requires high-strength chlorine, often paired with brushing, surging, or jetting, to physically break up the slime. Because bacteria reestablish quickly, ongoing monitoring is essential.
Physical Clogging: When Solids Shut Down Flow
While biological fouling is organic, physical clogging is mechanical, which occurs when the deposition of inorganic solids (silt, clay, sand) or drilling debris accumulates, blocking the screen openings.
essential for assessing aquifer health and pump performance.
Key factors include:
S Higher discharge rates create deeper cones of depression
S Seasonal shifts and drought reduce available drawdown
S Lower water levels increase pumping energy
These data help operators determine whether a well is declining due to aquifer conditions, mechanical issues, or fouling.
Responding to Well Decline: A Structured, Four Step Approach
When a well shows reduced specific capacity, elevated SDI, biological activity, or increased drawdown, PBCWUD follows a tiered response:
S Chlorine solution treatment. Production well chemical injection and testing.
S Low acid chemical treatment. A second round of injection if chlorine alone is insufficient.
S 1,500 to 3,000 new meters added annually
The utility produces over 22 billion gallons of drinking water each year—enough to fill 320,000 Olympic swimming pools or 160 billion 16-ounce water bottles. At the heart of this system lies Water Treatment Plant 9 (WTP 9) in Boca Raton and its extensive raw water wellfields.
Understanding Raw Water Wells: The Hidden Engine of Supply
Raw water wells are the unseen backbone of the production capacity of WTP 9. Their performance determines how reliably the plant can meet daily demand, especially during peak season.
The work is broken into six core areas:
S Factors affecting production and supply
S Biological fouling
S Physical clogging
S Well data collection
S Verifying well performance
S Responding to well decline
Each plays a critical role in keeping the wellfield healthy.
Biological Fouling: When Microbes Take Over
Biological fouling is one of the most common—and stubborn—wellfield challenges,
Suspended particles lodge in the formation, creating a “filter cake” that restricts flow. Research shows that up to 70 percent of permeability reduction in recharge systems comes from physical clogging.
Prevention hinges on proper well development, while rehabilitation may require:
S Mechanical surging
S High pressure jetting
S Chemical treatment for severe blockages
Data Collection: The Early Warning System
Routine sampling is the backbone of wellfield management:
S AWWA’s sand standard is ≤ 5 ppm
S Membrane systems prefer < 1 ppm
Monthly sampling should include:
S Specific conductance
S Chloride
S Total dissolved solids
S Silt density index (SDI)
S Sand content
Tracking trends over time allows operators to spot subtle changes before they become operational problems.
Verifying Well Data: Understanding Drawdown
Accurate drawdown measurement is
S Maintenance wellfield rehabilitation. Moreintensive low acid treatment.
S Capital improvement rehabilitation. If decline persists, the well is recommended for engineering level rehabilitation.
This structured approach ensures that each well receives the least invasive, most cost effective treatment first.
A System That Depends on Its Operators
Behind every gallon of water delivered to PBCWUD residents is a team of operators, mechanics, and field staff who keep the wells producing with:
S Consistent monitoring
S Early detection
S Preventive maintenance
S Clear communication between plant staff and wellfield contractors
It’s a reminder that wellfield management is both a science and a craft—one that depends on experienced operators who understand the subtle signs of a well in distress.
Juan F. Valdez is water treatment plant superintendent at Palm Beach County Water Utilities Department.
STUDENTS AND YOUNG PROFESSIONALS
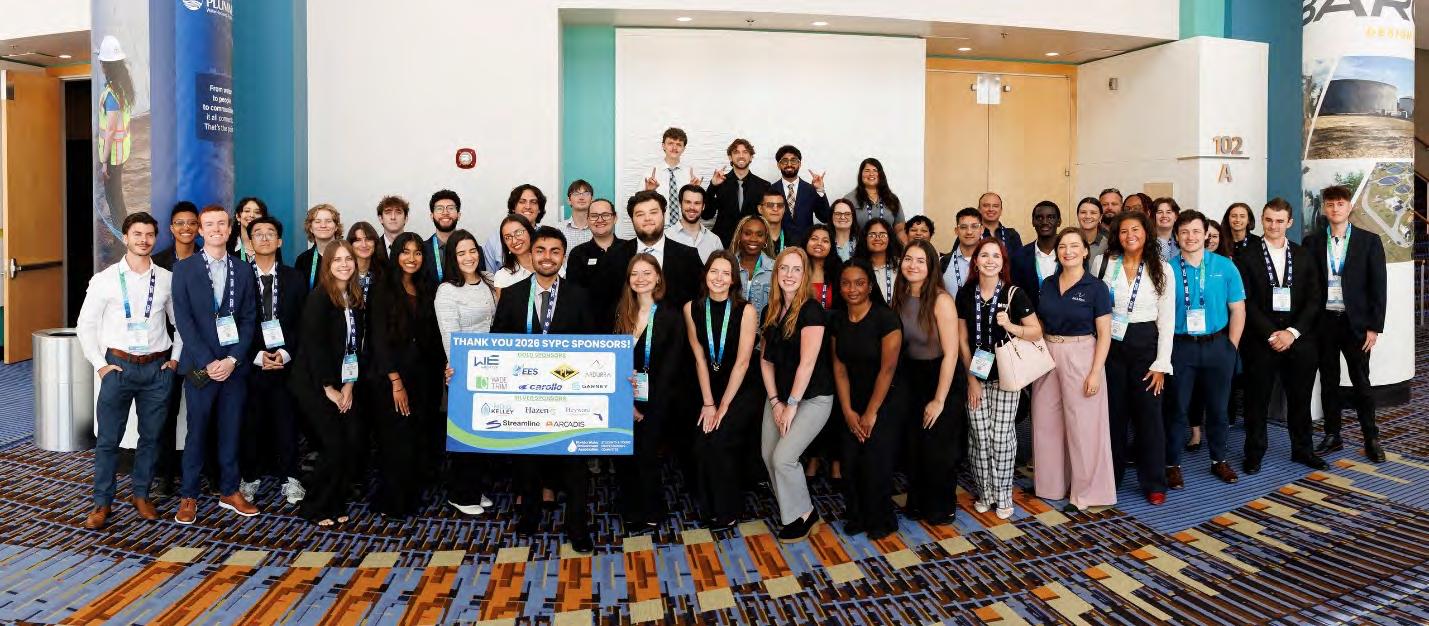
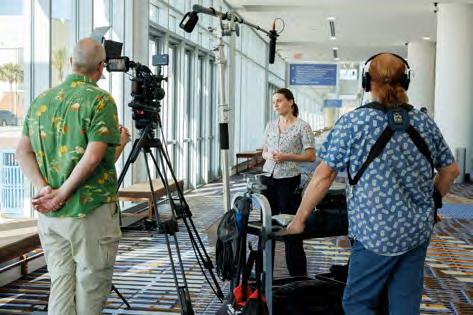
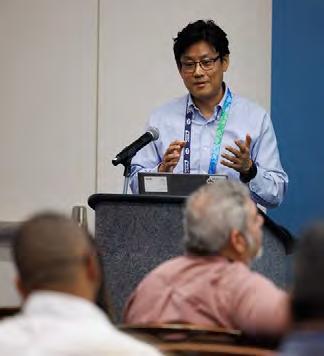
Students and Young Professionals: Future Leaders of the Industry
There was much for young professionals and university students to learn about, see, and do at the conference, including workshops and technical sessions, breakfasts and receptions, and the Student Design Competition and poster contest.



Young Professionals Workshop
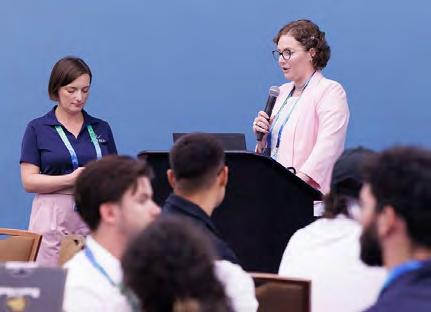
The collaborative FWEA/FSAWWA Young Professionals Workshop brought together emerging leaders from across the water sector. Participants gained insights from experienced professionals, discussed career development strategies, explored leadership opportunities, and strengthened their professional networks.
Programs such as this play a critical role in workforce development and succession planning as utilities continue to address industrywide workforce challenges.
InFLOW Scholarship
The Introducing Future Leaders to Opportunities in Water (InFLOW) program was conceived by the Water Environment Federation in an effort to introduce promising students from underrepresented groups to careers in the water industry. The program is focused on promoting diversity and inclusion within the water sector and its primary goal is to engage participants in events and networking opportunities to solidify their interest in working in the water industry, as well as increase opportunities for employment and long-term success.
The InFLOW program allows students to attend this conference at no cost, giving participants the opportunity to have small and meaningful conversations with program supporters, mentors, and future employers and learn more about the water industry by attending technical sessions and touring the exhibit hall.
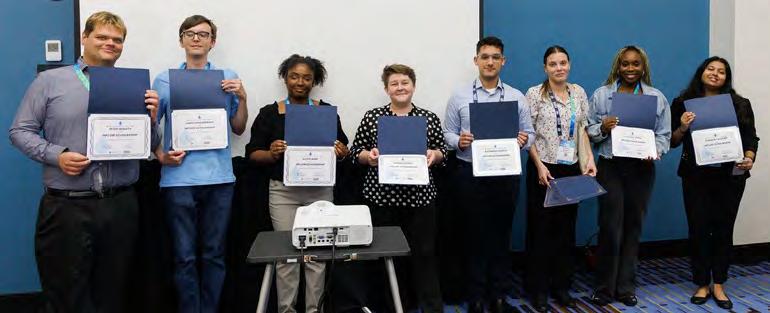
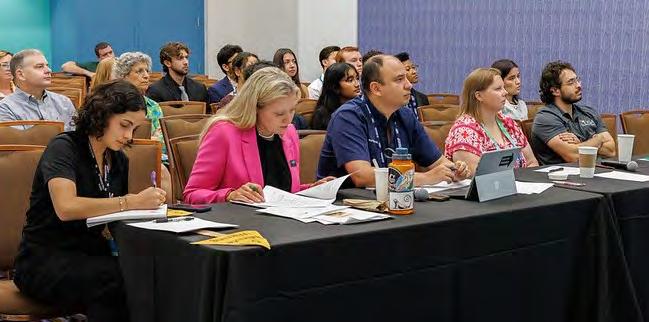
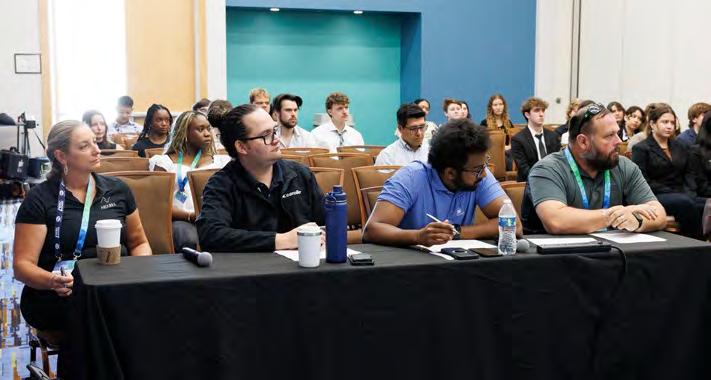
FWEA Student Design Competition
The annual Student Design Competition showcased innovative solutions developed by university teams addressing real-world environmental and wastewater challenges. These projects represent months of research, engineering analysis, collaboration, and presentation preparation.
Poster Competition
The Student and Young Professionals Poster Competition highlighted outstanding research and technical work from emerging professionals across the state. Attendees engaged directly with presenters, exploring ideas and discussing solutions to current industry challenges.
This year’s winner:
S Dennis Ssekimpi from Florida A&M University and Florida State University
Dennis Ssekimpi at his poster.
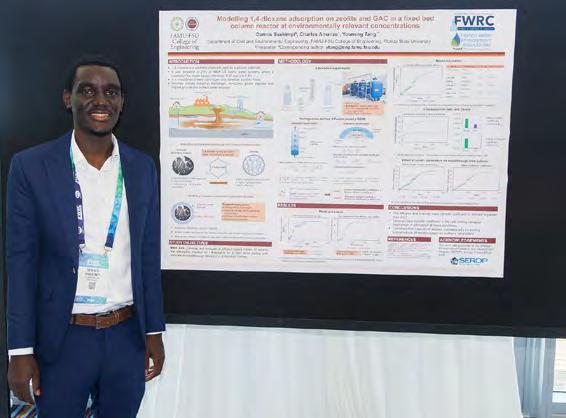
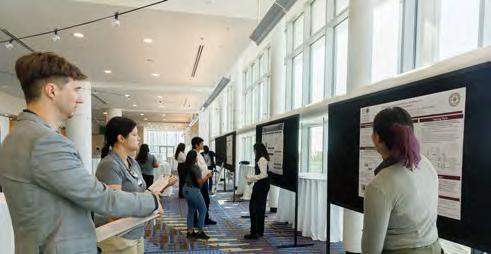
InFLOW scholarship recipients.
Poster attendees.
FSAWWA VETERANS INITIATIVE
FSAWWA Vet’s Connect Held at the Conference
The FSAWWA Vet’s Connect program continued its mission of supporting veterans and transitioning service members within the water industry. The program is part of FSAWWA’s Veterans Initiative to recognize, recruit, retain, and support military veterans in the Florida waterworks industry.
The session focused on strengthening veteran engagement,

expanding mentorship opportunities, building career pathways, and creating a supportive professional network.
The program reflects the industry’s ongoing commitment to workforce development and inclusion while recognizing the valuable leadership skills veterans can bring to the water profession.
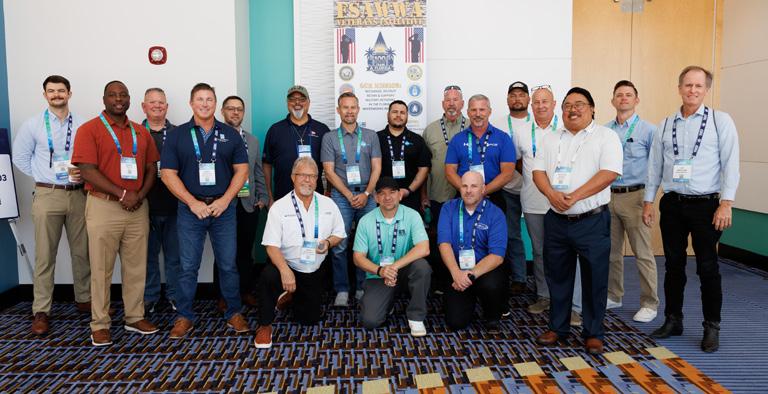
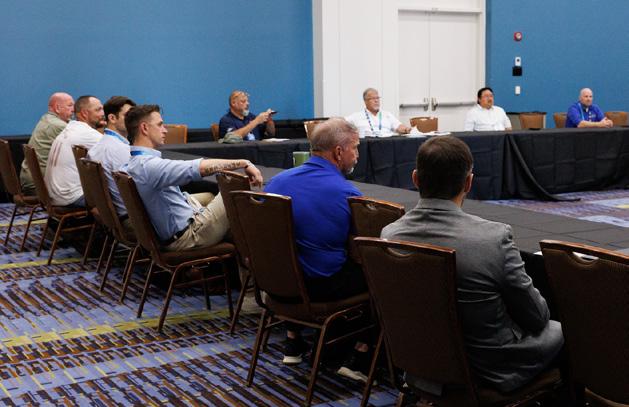


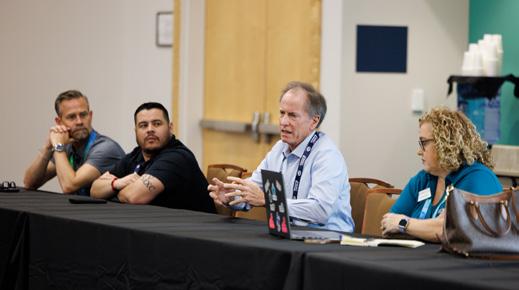

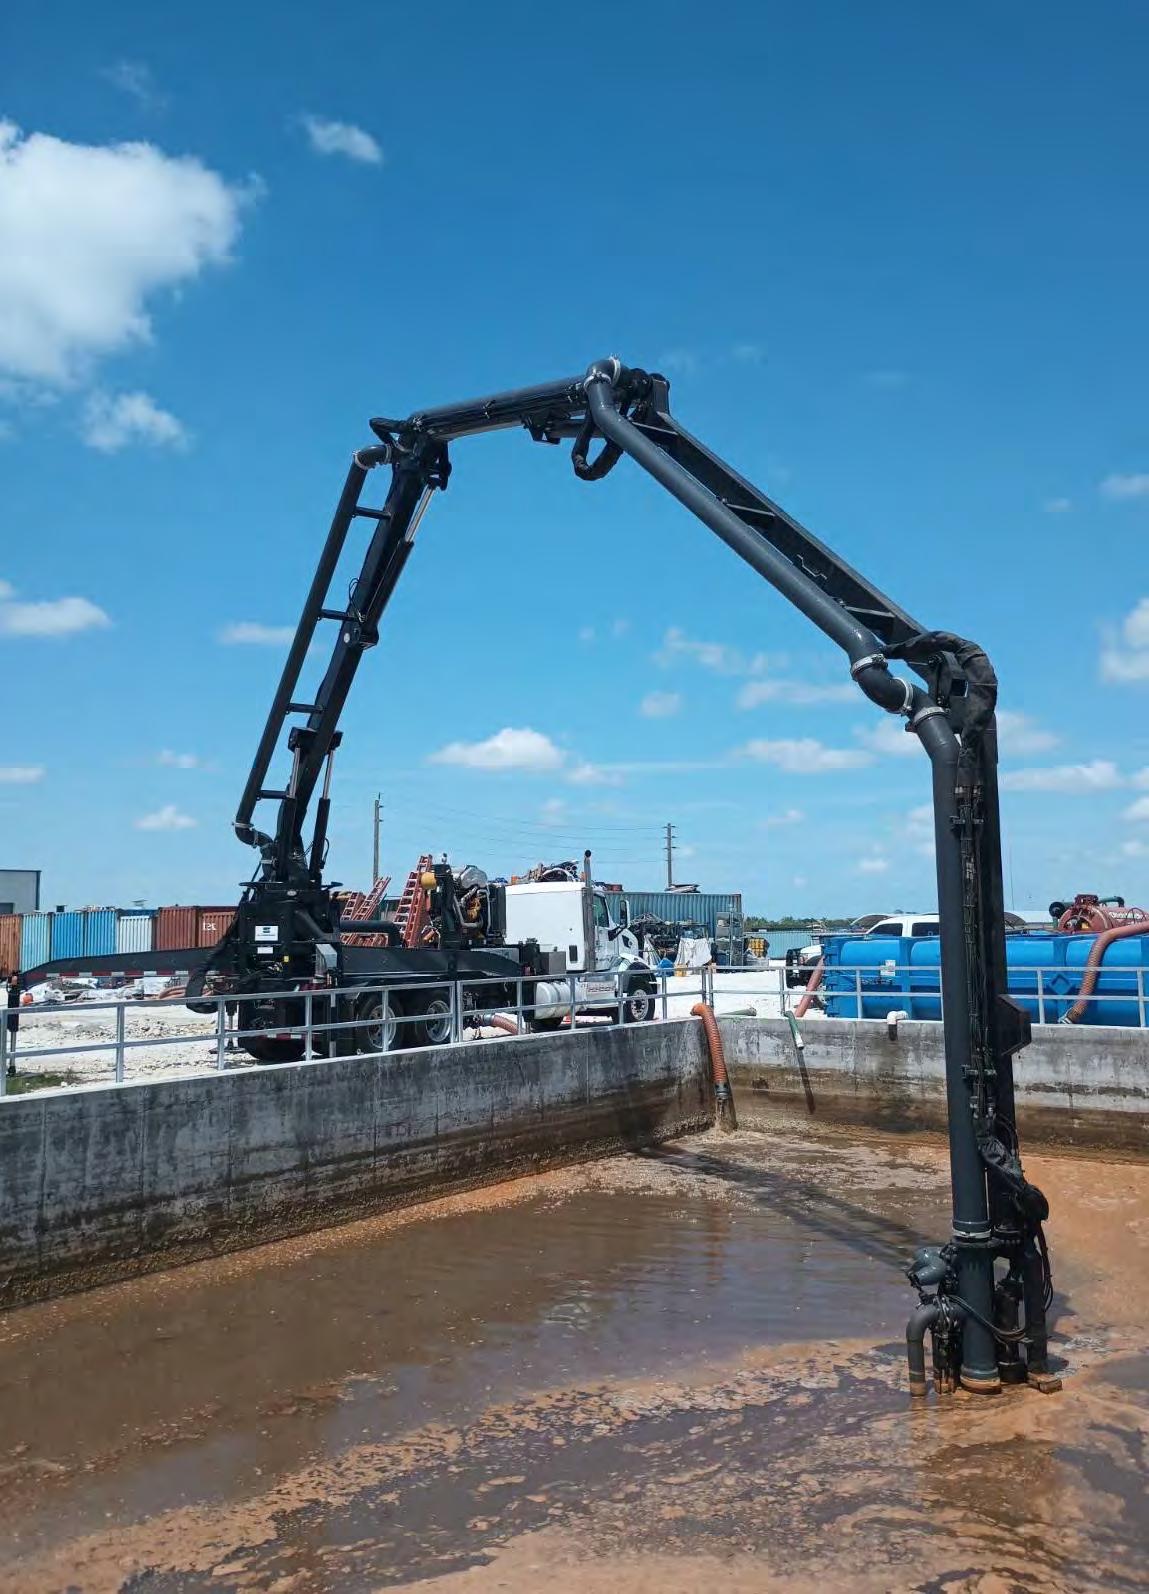
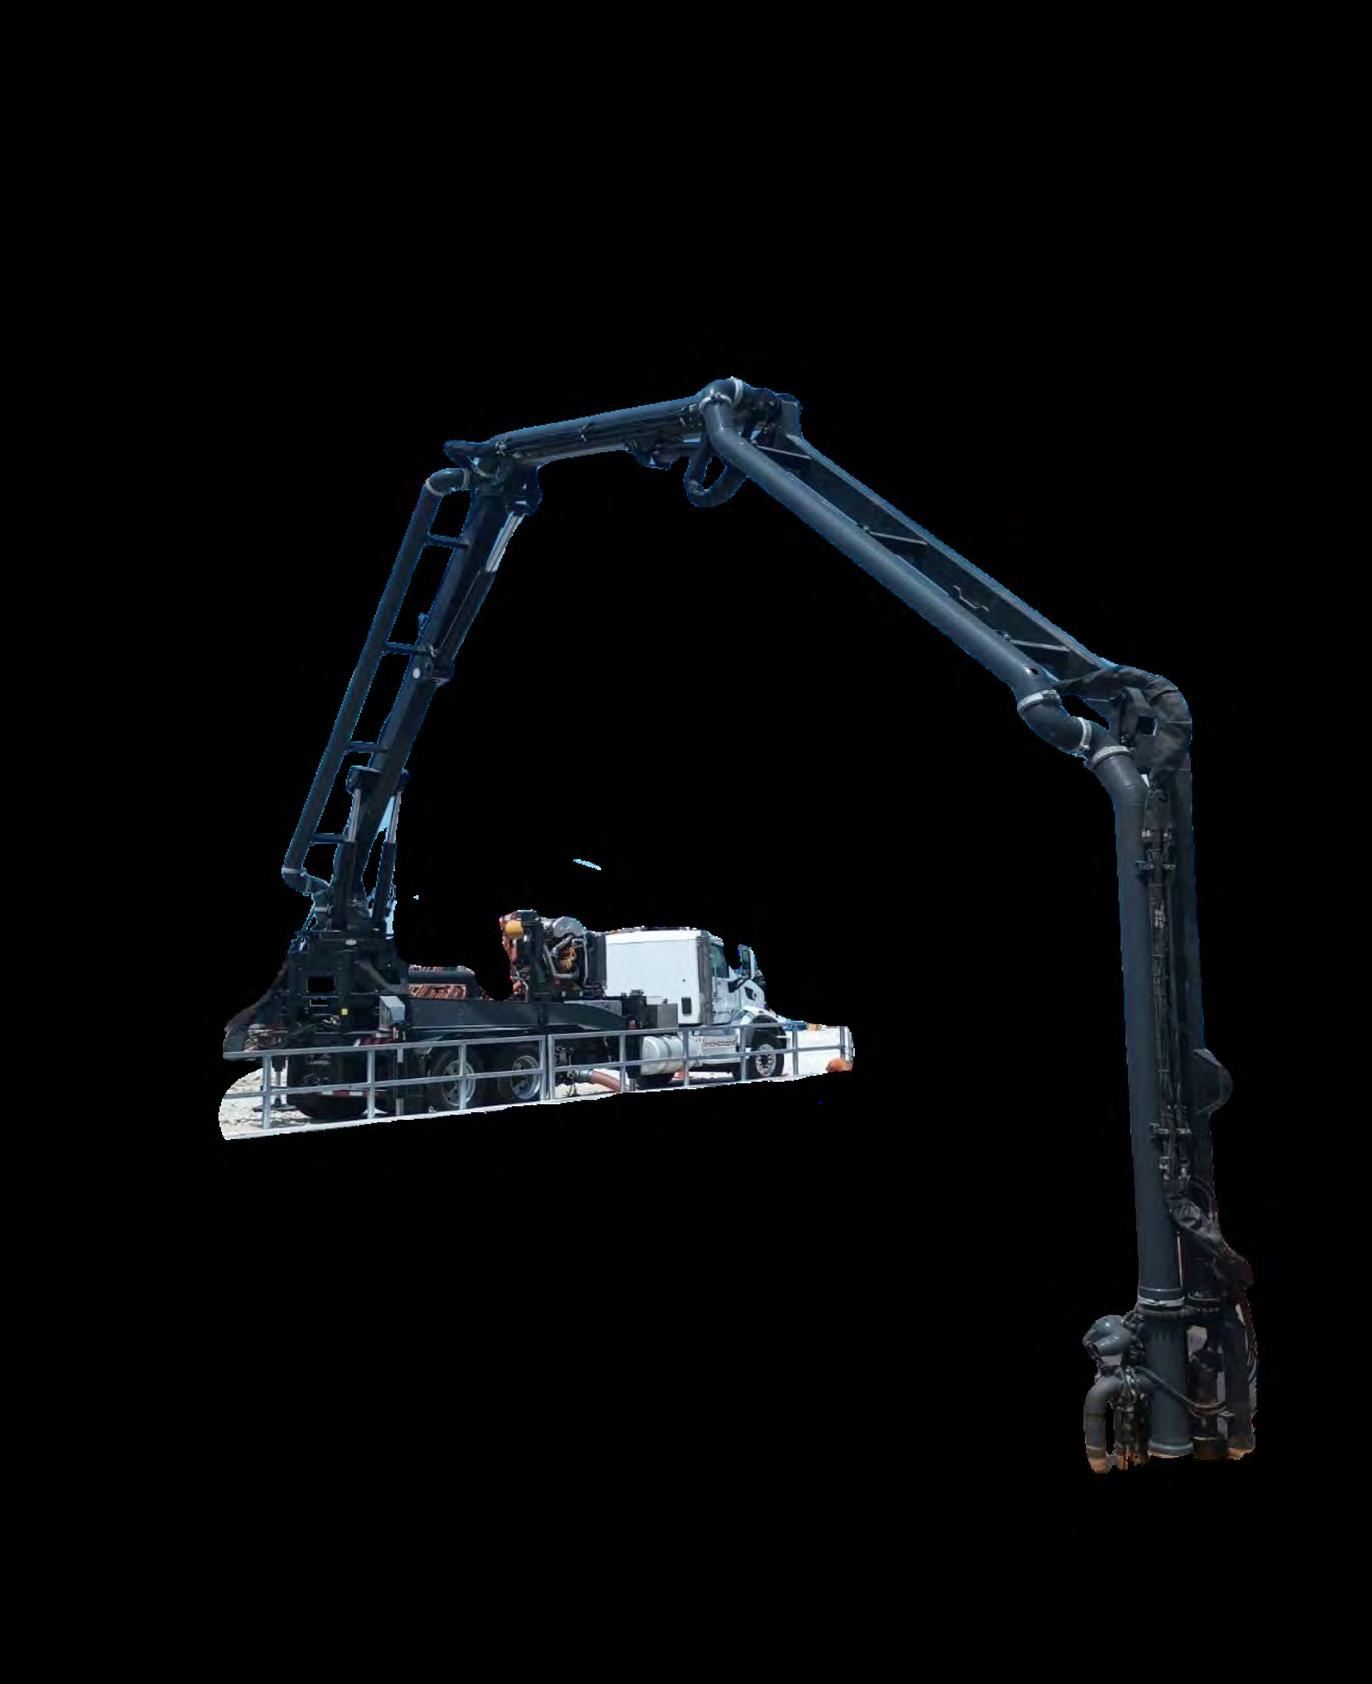
Polk County Team Wins First Place! OPERATIONS CHALLENGE
The Operations Challenge includes teams of four people that compete in five separate operator-related events. Teams compete at a regional level to earn the right to represent Florida at the national competition held this fall at the 2026 Water Environment Federation Technical Exhibition and Conference (WEFTEC).
Congratulations to this year’s top teams:
S First Place: Polk County Bio-Wizards
S Second Place: JEA The Fecal Matter
S Third Place: GRU True Grit
The competition is coordinated by Chris Fasnacht, with City of St. Cloud.
Contest Components
The competition, which was held in the exhibit hall, is a skills-based contest consisting of four timed events and one questionnaire event that showcase the knowledge and expertise of wastewater treatment plant operators. The teams display their proficiency in process
First-place team
Bio-Wizards displays its trophy.
control, maintenance, safety, collections, and the laboratory.
The process control event uses a computerbased questionnaire where two team members are given certain scenarios to figure out through a supervisory control and data acquisition (SCADA) program, and the other members complete a math and basic knowledge question section.
The laboratory section is an ammonia and alkalinity testing situation, in a simulated format, to determine the operation of an aerobic wastewater system, as well as added questions to know what the demand and usage are.
The maintenance event simulates the maintenance of a lift station where a pump has gone down and a pump is set up as a bypass in case, at some point, the other pump goes down. The teams are to do a simulated inspection of the pump before simulating taking the pump to the station and hooking it up.
The collections event simulates the team having to replace a section of an 8-inch piece of
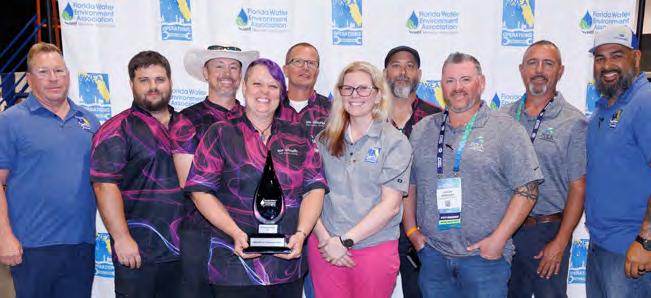
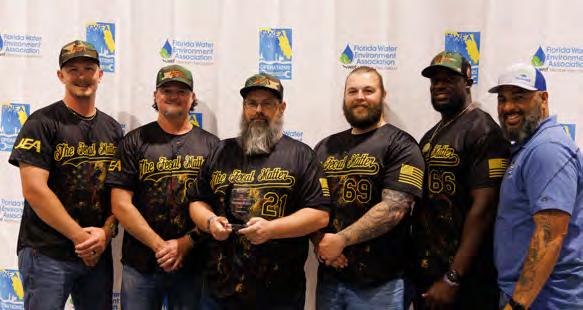
second-place winner, JEA The Fecal Matter, also came in second in the laboratory event.
pipe with a new piece of pipe that has a 4-inch hole cut out for a new sewer lateral. While this is going on, one member of the team is setting up a sampler to take samples.
The safety event simulates a person passing out in a confined space and the team arriving onsite to retrieve the person. Also added is the maintenance of a check valve in replacing the gaskets to it.
Sponsors and Next Year’s Event
The contest is looking for sponsors to help finance the travel costs for Florida’s champions to compete at the national level at WEFTEC. If you would like to contribute, please reach out to Brad Hayes at bhayes@woodardcurran.com for sponsorship information.
The next Operations Challenge will be at FWRC, to be held April 18-21, 2027, in Orlando. The competition is open to teams of wastewater treatment operators from any utility in Florida. For information on entering a team, contact Chris Fasnacht at cfasnacht@stcloud.org.
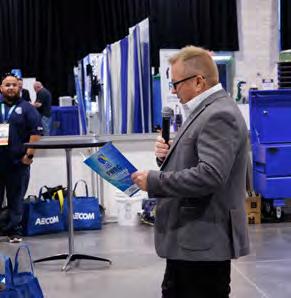
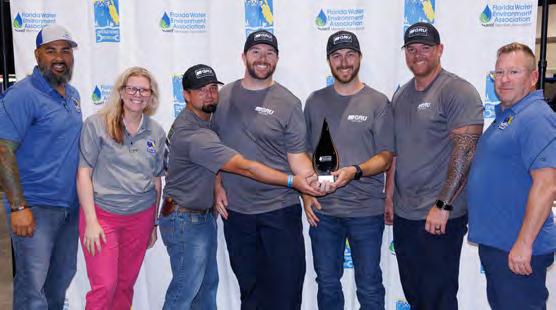
Chris Fasnacht, contest coordinator and emcee.
GRU True Grit wins third place.
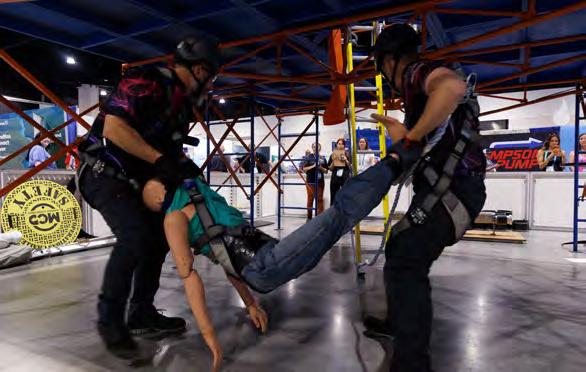
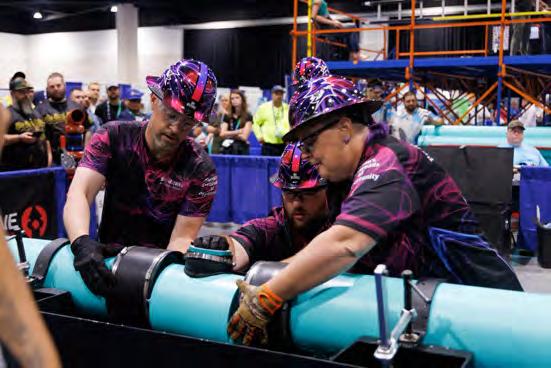

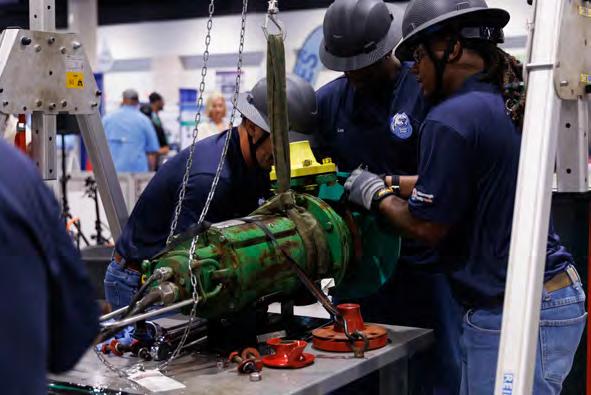
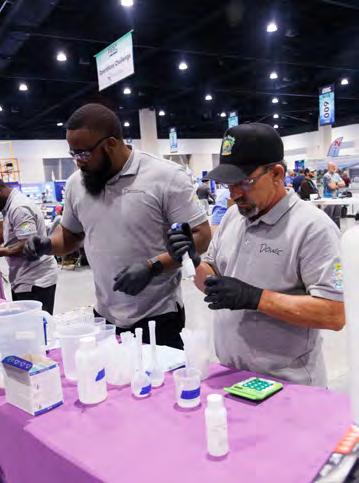
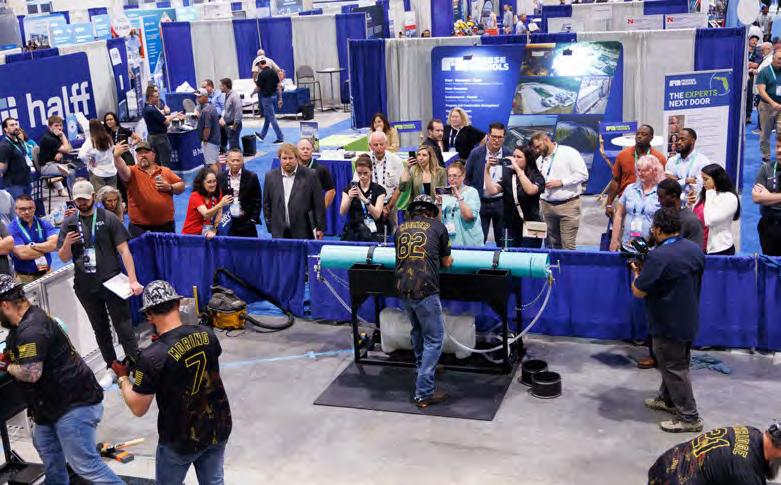
The collections event.
The safety event.
The maintenance event.
The process control event.
The contest taking place in the exhibit hall.
The laboratory event.
Top OPS Top Ops Teams Compete at the Conference
Several Top Ops teams participated in a session at the conference to get ready for the contest that will take place at the FSAWWA Fall Conference in December. Sponsored by Mead & Hunt, Top Ops once again delivered an entertaining and educational competition at the conference.
Congratulations to the Hillsborough
County Hard Water Team for becoming the 2026 Top Ops champion.
Top Ops is like the “College Bowl” and tests the groups, made up of water treatment and distribution operators or laboratory personnel, on their knowledge of system operations. Teams from FSAWWA regions compete against each other in this fastpaced question-and-answer tournament.
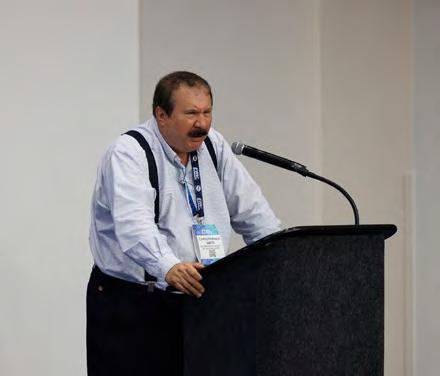
The moderator poses a broad range of technical questions and math problems, and the team scoring the most points in the championship round is awarded the winner’s trophy.
For more details about the contest and to receive the competition rules, contact Andrew Greenbaum at greenbaumal@bv.com or Mark
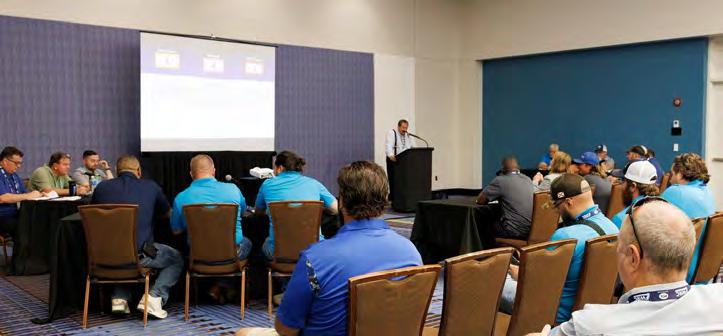
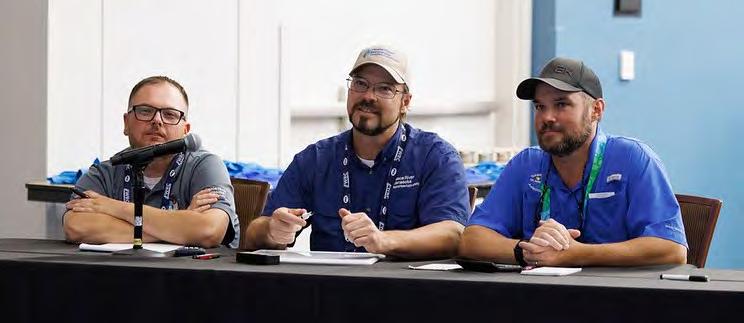
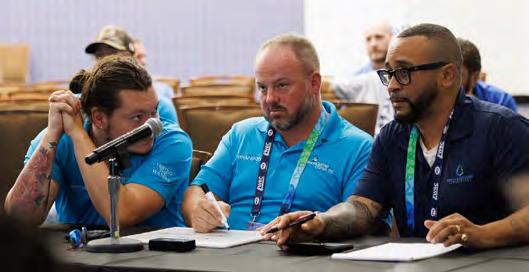
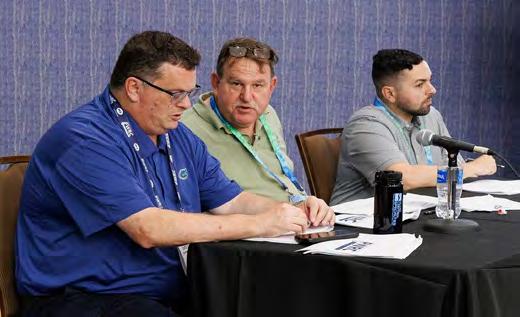
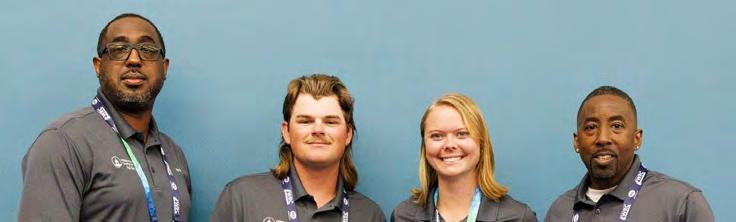
Chris Wetz moderates the session.
The contest judges.
Other participating teams.
The contest in action.
The winning team from Hillsborough County. Members (from left) are Mark Bell, Jacob Schumucker, Paige Mulford, and Thomas Hunter.
LAWN PARTY
Evening Event Enjoyed by Conference Attendees
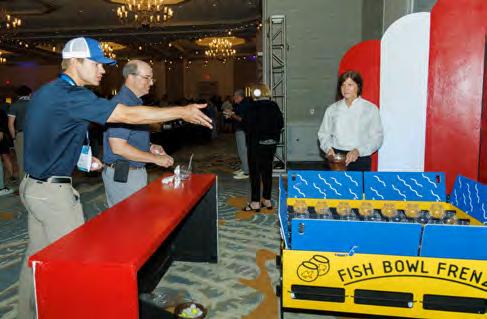
This year’s conference evening event, billed as the Lawn Party, was moved indoors because of rain (two years in a row!). Everyone took it in stride, however, and the attendees were dancing, networking, and enjoying food, music, and games in a fun atmosphere.
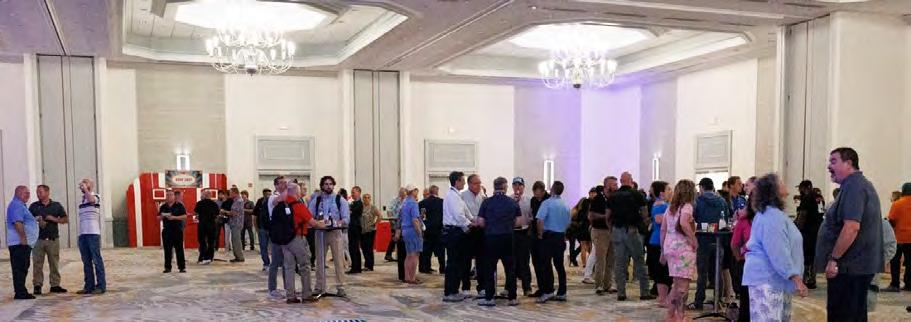
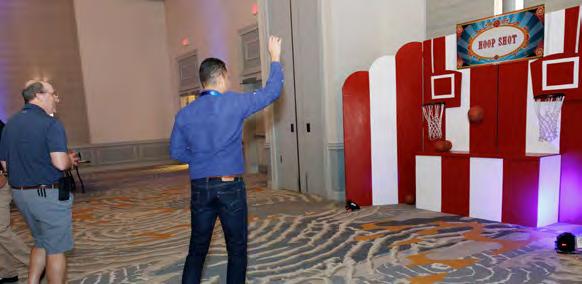
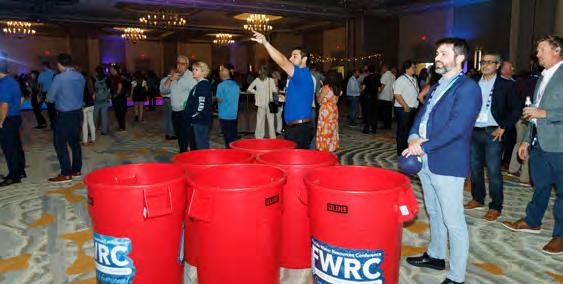

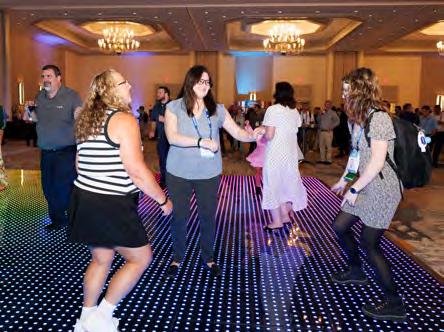

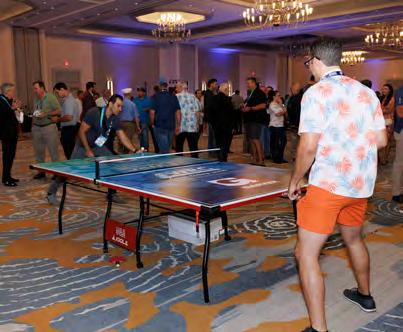

AWARDS
Each year the Florida Water and Pollution Control Operators Association, Florida Water Environment Association, and Florida Section of the American Water Works Association honor outstanding individuals, utilities, and other organizations for contributions to the state’s water and wastewater industry. The awards were presented at the two lunches held during the April 2026 conference.
FWEA Awards
Earle B. Phelps Awards
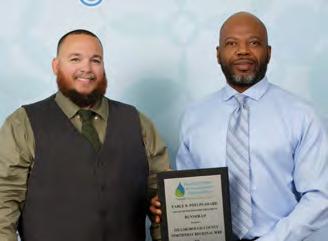
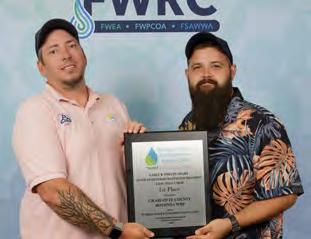
Advanced Secondary Wastewater Treatment Facility
Less Than 3 MGD First Place
Charlotte County Rotonda Water Reclamation Facility
Accepted by Jason Foster and Joseph File.
Advanced Wastewater Treatment Facility Runner-Up
Hillsborough County
Northwest Regional Water Reclamation Facility
Accepted by Gregg Rollo and Dewey Jackson.
Advanced Secondary Wastewater Treatment Facility
Less Than 3 MGD Runner-Up Polk County Northwest Wastewater Treatment Facility
Accepted by Edward Clark.
Advanced Secondary Wastewater Treatment Facility
Greater Than 6 MGD First Place
Toho Water Authority Sandhill Water Reclamation Facility
Accepted by Shane Howard and Luis Trinidad.
Advanced Secondary Wastewater Treatment Facility
Less Than 3 MGD Honorable Mention
Town and Country Utilities Babcock Ranch Water Reclamation Facility
Accepted by Nathaniel Mastroeni.
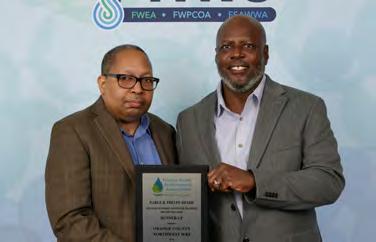
Advanced Secondary Wastewater Treatment Facility
Greater Than 6 MGD Runner-Up
Orange County Northwest Water Reclamation Facility
Accepted by James Montague Jr. and Mark Robinson.
Advanced Wastewater Treatment Facility Honorable Mention
Orange County Eastern Water Reclamation Facility
Accepted by Mark Robinson, Bryan Elliott, and Terry White.
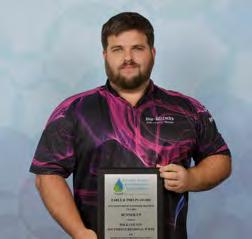
Advanced Secondary Wastewater Treatment Facility 3 to 6 MGD Runner-Up
Polk County Southwest Regional Wastewater Treatment Facility
Accepted by Bryan Osborne.
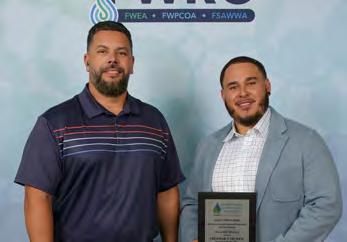
Advanced Secondary Wastewater Treatment Facility
Greater Than 6 MGD Honorable Mention
Orange County South Water Reclamation Facility
Accepted by Eddie Laboy and Johnny Arnaldi.
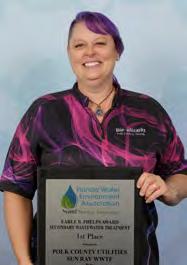
Secondary Wastewater Treatment Facility
First Place
Polk County Utilities
Sun Ray Wastewater Treatment Facility
Accepted by Mandi Hebert.
Secondary Wastewater Treatment Facility Runner-Up
JEA Arlington East Water Reclamation Facility
Accepted by Leo Tamburini.
David W. York Water Reuse System of the Year Awards
Reuse Project of the Year
JEA Potable Reuse Program Accepted by Ryan Popko.
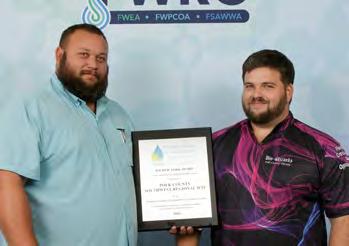
1 to 5 MGD
Polk County Southwest Regional Water Treatment Facility Accepted by Josh Brown and Bryan Osborne.
Less Than 1 MGD
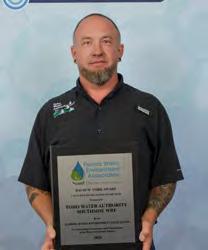
5 to 15 MGD
Toho Water Authority
Southside Water Reclamation Facility
Accepted by Erik Dabrowski.
Toho Water Authority Sunbridge Water Reclamation Facility (no photo)
Wastewater Collection System of the Year Awards
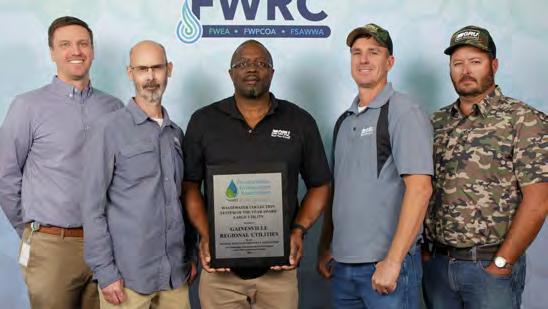
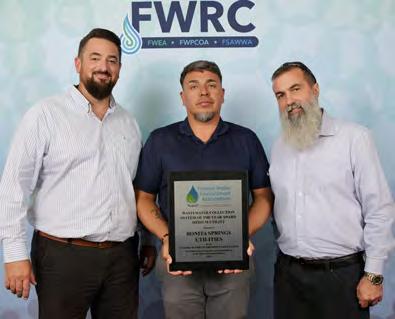
Large
Gainesville Regional Utilities
Accepted by (left
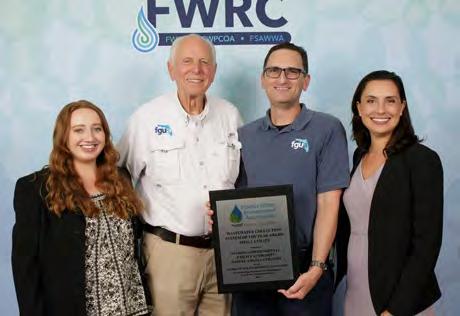
to right)
Peter Simms, Jared Copeland, Elijah Gainey, John Griffis, and Levi Lee.
Medium
Bonita Springs Utilities
Accepted by (left to right) Don Woodruff, Arturo Rodriguez, and Miguel Almaral.
Small
Florida Governmental Utility Authority
Nassau Amelia Utilities
Accepted by (left to right) Brennady Barnes, Mike Sweet, Matthew Rihs, and Aly Byrne Escribano Accenture.

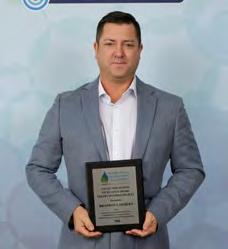
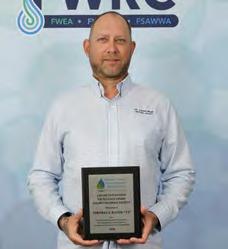
Biosolids/Residuals
Bonita Springs Utilities East Water Reclamation Facility Accepted by Jake Hepokoski and Don Woodruff.
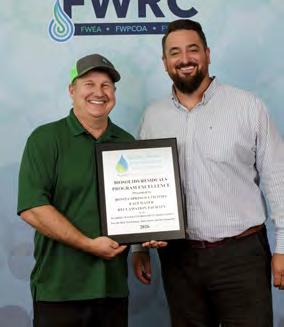
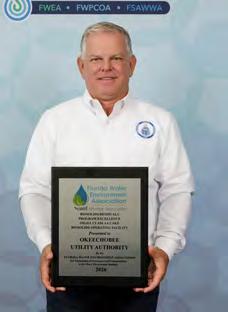
Utility Management Performance Excellence
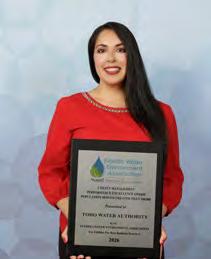
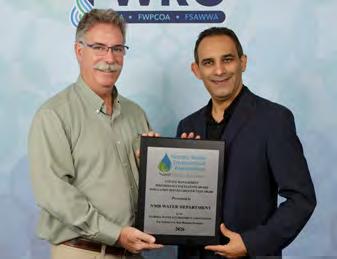
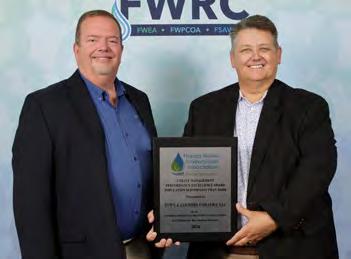
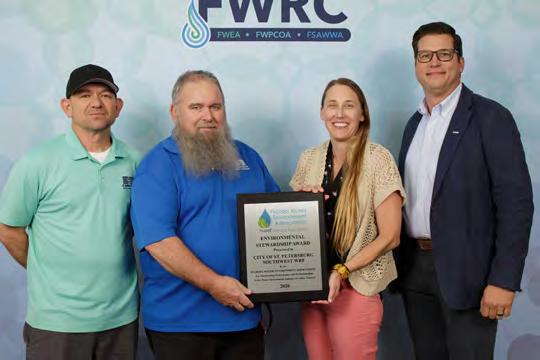
of St. Petersburg Southwest Water Reclamation Facility
by (left to right) Jason Venable, Frank Niles, Ivy Drexler, and Tony Pevec.
Presented to Thomas J. Bayer.
Presented to Brandon Lawhern.
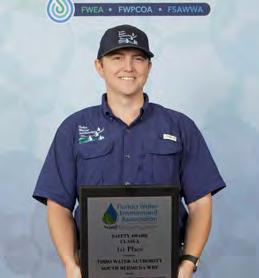
Class A, First Place
Toho Water Authority
South Bermuda Water
Reclamation Facility
Accepted by Christopher Henderson.
Safety Awards
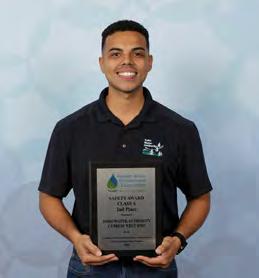
Toho Water Authority Cypress
West Water Reclamation Facility
Accepted by Luis Centeno.
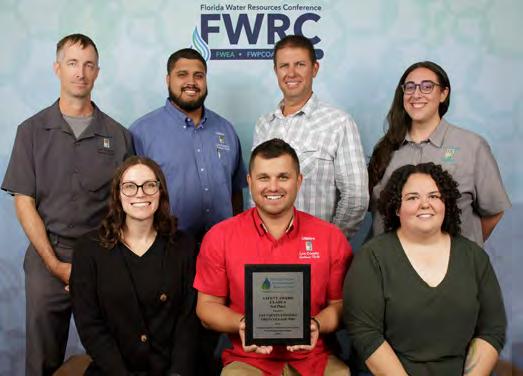
Class A, Third Place
Lee County Utilities Fiesta Village Water Reclamation Facility
Accepted by (front row, left to right) Nicole Devine, Igor Gutin, and Andrea Browning and (back row, left to right) Christopher Brooks, Dereck Perez, Robert Dick, and Laura Longa.
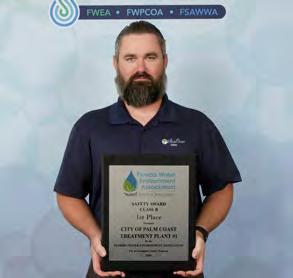
Class B, First Place
City of Palm Coast Treatment Plant # 1
Accepted by Adam Doroski.
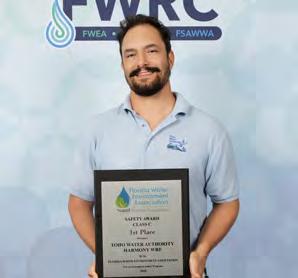
Toho Water Authority Harmony
Water Reclamation Facility
Accepted by Charles Evans.
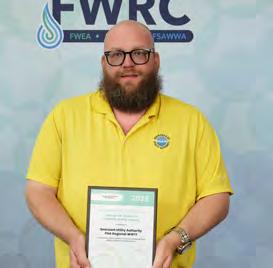
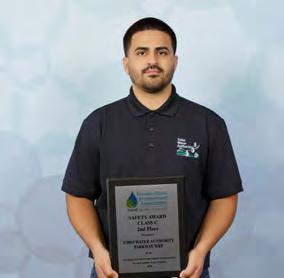
Toho Water Authority Parkway
Water Reclamation Facility
Accepted by Keven Rios.
George W. Burke Jr. Facility Safety Award
Seacoast Utility Authority PGA Regional Wastewater Treatment Facility
Accepted by Brent Weidenhamer.
Class A, Second Place
Class C, First Place
Class C, Second Place
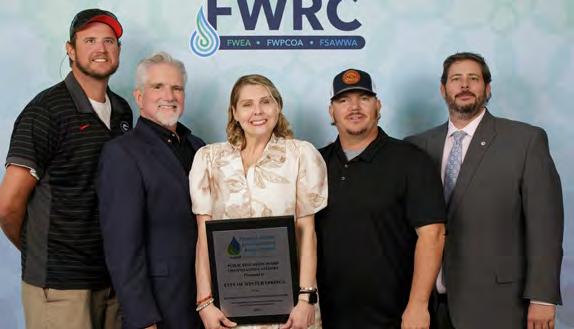
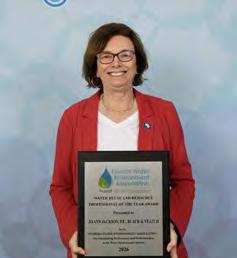
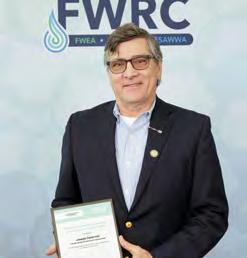
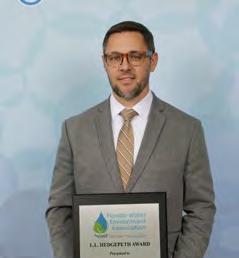
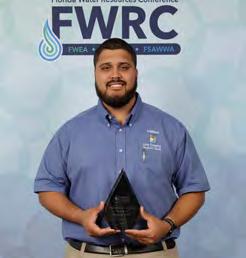
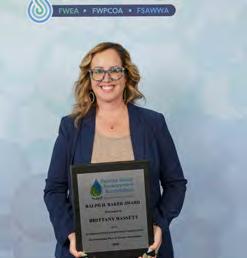
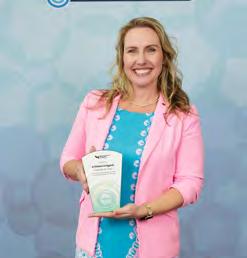
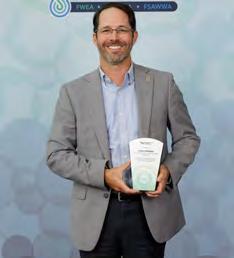
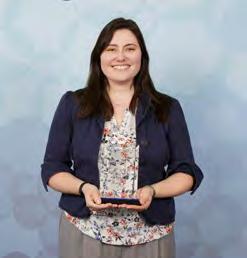
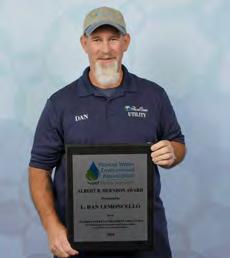
City of Winter Springs
Accepted by (left to right) Rory Jacobs, Clete Saunier, Marla Mullis, Clifton Mullis, and Kevin Sweet.
Presented to Jo Ann Jackson.
Presented to John Allan Stock.
Presented to Joseph Paterniti.
Presented to Thomas White.
Ralph H. Baker Award
Presented to Nicole Cohen. Albert B. Herndon
Presented to L. Dan Lemoncello.
Presented to Brittany Bassett.
FSAWWA Awards
Water Treatment Plants
Service Awards
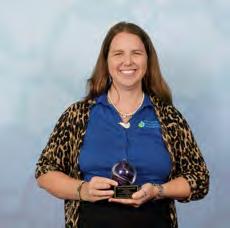

Presented to Megan Nelson.Presented to Brittany Bassett.
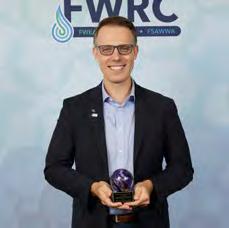
Presented to Yanni Polematidis.Presented to Manasi Parekh.

Presented to Olga Mikhalchishina. Presented to Angel Villarruel-Moore.
Outstanding Class B City of Oviedo West Mitchell Hammock Water Treatment Plant Accepted by Joetta West and Steve Santiago.
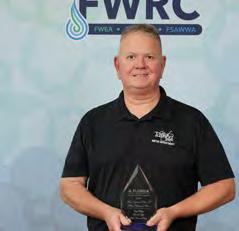
Most Improved Class A City of Tampa Accepted by Brad May.
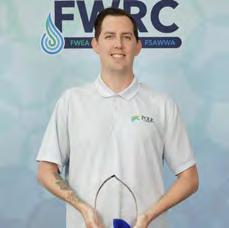
Outstanding Class A City of Boca Raton Accepted by Edward Galvan, Kara Mills, Keyshawn Hutchinson, Benjamin Kisielewski, and Lee
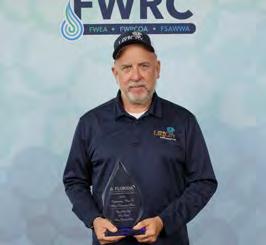
Outstanding Class C City of Lake City Accepted by Michael Osborn.
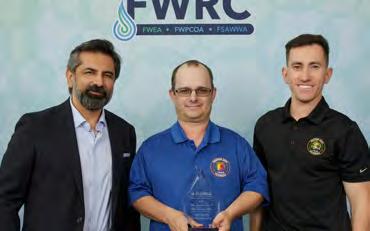
Most Improved Class C City of Orange City Accepted by (left to right) Bilal Iftikhar, Chris Bailey, and Robert Lawler.
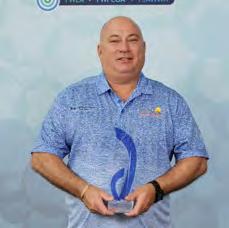
Presented to Garrett Rheiner, Polk County Utilities. Marvin N. Kaden Award for Outstanding Water
Presented to Vincent Domanico, Pasco County Utilities.
Duerr.
FWPCOA Awards
David B. Lee Awards
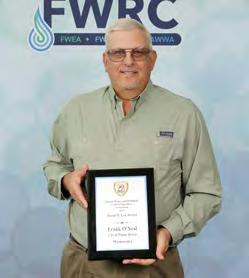
Wastewater
Presented to Frank O’Neal, City of Winter Haven.
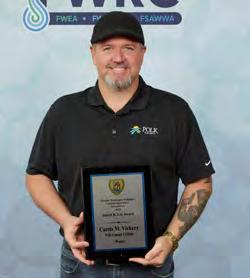
Water
Presented to Curtis M. Vickery, Polk County Utilities.
FWRC 2025 Best Paper Award
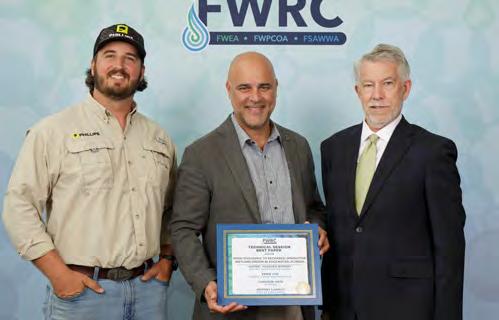
FWRC 2026 Best Paper Award
“From Discharge to Recharge: Innovative Wetland Design in Edgewater, Florida”
Accepted by (left to right) Cameron Pate, Rafael Vazquez-Burney, and Ernie Cox.
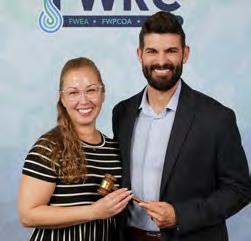
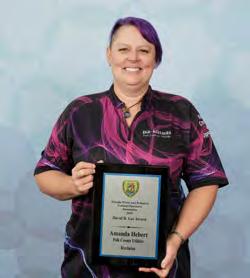
Presented to Mandi Hebert, Polk County Utilities.
60+ Year Membership
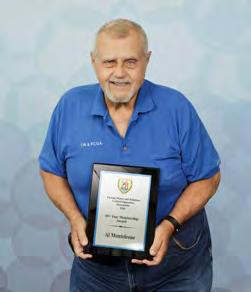
Pat Flanagan Award
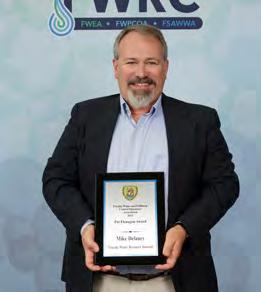
FWEA PRESIDENT
FWEA Welcomes New President With Passing of the Gavel
Joan Fernandez completed her term as the 2025-2026 FWEA president at the organization’s annual meeting and awards luncheon at the conference. David Hernandez begins his term as FWEA president for 2026-2027.
Fernandez passes the FWEA gavel to Hernandez.
Reclaim
Presented to Mike Delaney.
Presented to Al Monteleone.
National expertise, Florida experience
Garver Tampa Water Leader Chris High, PE, has spent his career helping Florida utilities plan, deliver, and manage critical water infrastructure. He knows the pressures shaping the region, and backed by the resources of a national firm, he brings the local knowledge and practical delivery experience communities need to move the right projects forward with confidence.
GarverUSA.com

Chris High, PE
Tampa Water Leader
Florida Section AWWA Technical and Education Council Drives Industry Learning and Innovation
TTyler Tedcastle Chair, FSAWWA
o remain consistent with our vision of “A Better Florida Through Better Water,” FSAWWA strives to continually provide the ability to educate our membership on all things water. The FSAWWA Technical and Education Council (TEC) is led by Mike Stoup,
P.E., and continues to serve as a driving force for professional development, technical education, and industry collaboration across Florida’s water sector. During the past year, some of TEC’s committees and divisions have hosted numerous seminars, webinars, workshops, networking events, and educational programs that reached hundreds of water professionals throughout the state.
Council Committee Activities
A key focus across the council has been expanding educational opportunities and increasing member engagement. The Finance and
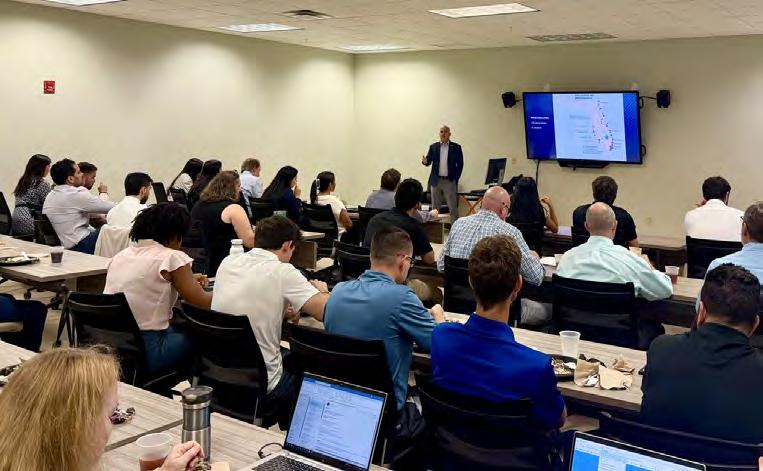
Rates Committee continues to meet quarterly and is developing practical “Lunch & Learn” sessions focused on utility finance, rate structures, and funding strategies. These sessions are designed to expose utility professionals to emerging ideas and best practices while fostering discussion among peers.
One of the council’s most active groups, the Master Planning and Modeling Committee, continues to expand its statewide reach. The committee hosted its third annual full-day seminar in Orlando, attracting 50 attendees and featuring 10 technical presentations. It also conducted a highly attended FSAWWA Fall Conference workshop on water supply planning that drew more than 100 participants. Looking ahead, the committee plans to host quarterly virtual meetings and a major seminar in south Florida during 2026.
Automation and cybersecurity have also become increasingly important areas of focus. The Automation Committee is developing a series of educational programs highlighting the evolution of communications, field instrumentation, and process control technologies throughout the water industry. Meanwhile, the Cybersecurity Committee continues to hold monthly meetings focused on legislative updates, cybersecurity standards, operational technology and
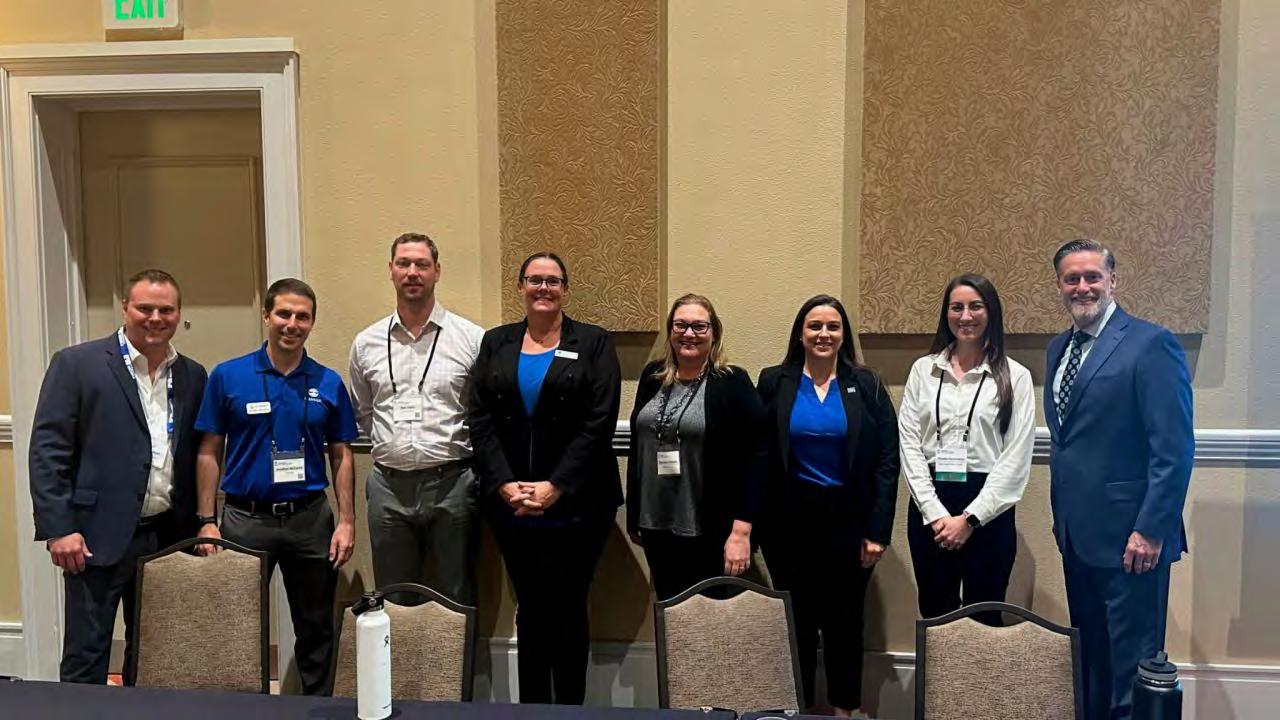
FSAWWA Region VI technical seminar.
Committee has experienced significant growth, with a user group membership exceeding 300 professionals. Monthly meetings feature presentations from utilities and industry experts on GIS-enabled asset management practices, helping organizations improve infrastructure visibility and operational decision making.
The Contaminants Committee’s Water Bugs webinar series continues to attract strong participation. Recent presentations covering per- and polyfluoroalkyl substances (PFAS) treatment technologies and media regeneration strategies drew more than 200 registrants. Additional sessions planned for 2026 will address emerging topics such as microplastics, regulatory developments, and advanced monitoring techniques.
Council Division Activities
Water conservation remains a major priority. The Water Use Efficiency Division successfully hosted the Water Conservation Symposium at the Fall Conference and recognized six recipients of the Water Conservation Award of Excellence. The division is also supporting the 28th annual Water Conservation Month campaign, promoting the 2026 theme of “Rain Shutoff Devices” in partnership with Florida’s water management districts and other organizations.
The Water Quality and Resource Division has undergone leadership changes and is actively rebuilding membership and programming. The committee has established goals to deliver multiple webinars in 2026, including topics related to emerging contaminants, free chlorine conversion, and the potential impacts of data centers on water resources. These efforts reflect growing industry interest in water quality challenges and infrastructure planning.
Collectively, these initiatives demonstrate TEC’s commitment to providing timely technical education, fostering professional connections, and helping Florida’s water professionals address emerging challenges.
The TEC Needs Volunteers!
Through its dedicated volunteers and active committees, the council continues to strengthen the knowledge base and technical capabilities of
What Do You Know About Collection Systems Arithmetic? Test Yourself

Charlie Lee Martin Jr., Ph.D.
1. The discharge into a 12-inch sewer carries an average daily flow of 2.5 million gallons per day. If the average daily flow from the area served is 100 gallons per person per day, the number of people served is
a. 5,000.
b. 15,000.
c. 10,000.
d. 25,000.
2. The number of 5-foot sections to replace 140 feet of 8-inch pipe is
a. 15 sections.
b. 28 sections.
c. 20 sections.
d. none of the above.
3. The slope on an 8-inch, 400-foot-long pipe with an upstream manhole invert elevation of 155.32 feet and a downstream manhole elevation of 150.90 feet is
a. 0.012 feet/feet
b. 0.010 feet/feet.
c. 0.011 feet/feet.
d. none of the above.
4. The estimated actual distance between two manholes on a map that is measured as 15/16 of an inch with a scale where 1 inch equals 1000 feet is
a. 900.5.
b. 937.5.
c. 940.5.
d. none of the above.
5. The pounds of chemicals used to control roots at a concentration of 150 mg/l in 450 feet of an 8-inch sewer pipe is
a. 1.47 lbs.
b. 1.80 lbs.
c. 1.90 lbs.
d. none of the above.
6. The cubic yards of asphalt concrete paving material required to pave over a trench 2,700 feet long and 5 feet wide with a 3-inch-deep patch is
a. 125 cubic yards.
b. 105 cubic yards.
c. 185 cubic yards.
d. none of the above.
7. The number of 5-cubic-yard dump truck loads of sand to fill a trench 3 feet wide, 9 feet deep, and 100 feet long is
a. 30 loads.
b. 10 loads.
c. 20 loads.
d. none of the above.
8. The width of a trench at ground surface that is 3 feet wide at the bottom and 11 feet deep with walls sloped at ¾-inch horizontal to 1-inch vertical is
a. 14.5 feet.
b. 25.5 feet.
c. 19.5 feet.
d. none of the above.
9. The amp fuse needed for a 12-volt batteryoperated radio using a 3-ohm resistance is
a. 2 amps.
b. 4 amps.
c. 6 amps.
d. none of the above.
10. The efficiency of a pump with a water horsepower (HP) of 2.87 HP and a brake HP of 3.50 HP is
a. 75 percent.
b. 82 percent.
c. 90 percent.
d. none of the above.
Answers on page 94
References used for this quiz: Formulas can be found in the appendix of CSUS Operation and Maintenance of Wastewater Collection Systems, Volume I, 5th edition
LET’S TALK SAFETY
This column addresses safety issues of interest to water and wastewater personnel, and will appear monthly in the magazine. The Journal is also interested in receiving any articles on the subject of safety that it can share with readers in the “Spotlight on Safety” column.
Don’t Let Chemicals Get You!
Water utility operators and laboratory staff are often exposed to chemicals that can cause severe harm—or even death. Many chemicals are extremely toxic, and even small quantities of them can be lethal. The effects of chemical exposure can be local (at the point of contact) or systemic. Systemic exposure occurs when the chemical agent is absorbed into the bloodstream and distributed throughout the body, affecting one or more organs. If you are exposed to a toxic chemical, the severity of damage will depend on the toxicity of the substance, its solubility in tissue fluids, its concentration, and the duration of exposure.
Avenues of Chemical Exposure
A person can be exposed to dangerous chemicals in the following ways:
S Dermal contact
S Inhalation
S Ingestion
S Ocular exposure
S Injection
Dermal Contact
Spills and splashes in the laboratory, or when loading chemicals into vats or mixing bays, can result in contamination of exposed skin. When chemicals come in contact with the skin or the mucous membranes, they can cause surface
irritation at best; at worst, the chemicals can be absorbed into the bloodstream, causing systemic poisoning. Chemicals primarily penetrate the skin through hair follicles, sebaceous glands, sweat glands, and cuts or abrasions.
Touching contaminated hands to the mouth, nose, and eyes can also cause chemicals to be absorbed into the body
Inhalation
Inhalation is the most common road of entry for toxic substances. Toxic vapors, mists, gases, and even dust and particulates can be absorbed through the mucous membranes of the mouth and nose, and subsequently travel into the throat and lungs and cause serious damage to those tissues. The effects are further compounded if the substances pass through the lungs into the circulatory system.
Ingestion
Mouth pipetting in the laboratory can lead to the ingestion of chemicals, but an even more common cause of unintentional ingestion of toxic substances is from foods that were stored in containers, such as beverage jars, that had been used to store nonfood items (paint, plant food, or other substances). Another unsafe—but common—practice that can lead to ingestion is storing food in a place where chemicals are stored or storing chemicals in a refrigerator used for food.
Ocular Exposure
Unprotected eyes can become contaminated by splashing, aerosol contamination, or from rubbing with contaminated hands. Many chemicals are capable of causing burns and loss of vision. Absorption into the bloodstream from ocular exposure can also occur quickly, because eyes contain many blood vessels.
Injection
Inattentive laboratory workers can have accidents with needles; an accidental stick can inject chemicals into someone inadvertently. Broken glass containers that stored toxic chemicals can also cut through skin, exposing a worker’s blood to unwanted contamination.
Avoiding Chemical Exposure
Remember these safety tips when working with and around chemicals:
S Use personal protective equipment as required.
S Do not work alone in the lab.
S Always work in properly ventilated areas.
S Never eat, drink, or smoke while using hazardous chemicals.
S Always read the chemical’s Safety Data Sheet prior to use.


S Make sure all chemical containers are properly labeled.
S Always wash up after using chemicals.
S Never smell or taste a chemical to identify it.
S Do not pipette by mouth.
S Know and practice all emergency evacuation and containment procedures.
S Learn the locations of fire alarm pull stations, fire extinguishers, and eye wash stations.
S Store all hazardous chemicals properly.
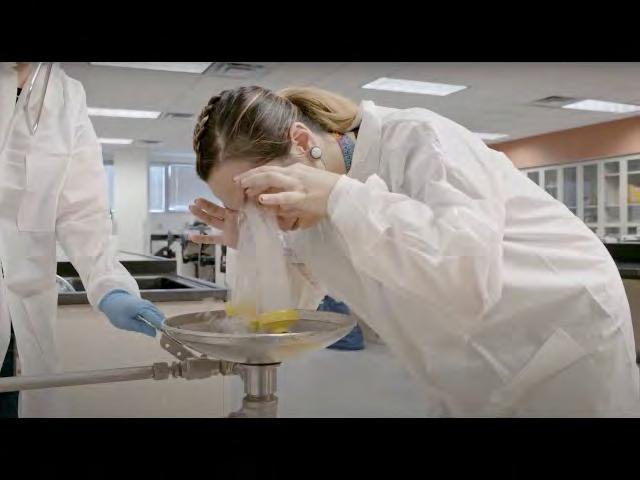
S Always use hazardous chemicals as intended.
S Avoid creating aerosols in the laboratory.
S Do not use open vessels for processing chemicals.
S In the event of a chemical splashing into your eye(s) or on your skin, immediately flush the affected area(s) with running water for at least 20 minutes.
eport all injuries, accidents, and broken equipment or glass right away, even if the incident seems small or unimportant.
Always follow these basic safety practices to minimize risk when working with hazardous chemicals. For more information go to the U.S. Chemical Safety Board’s website at csb.gov. S
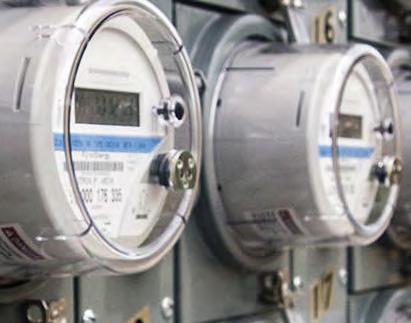

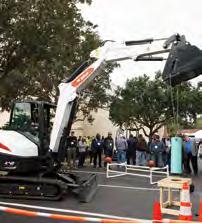












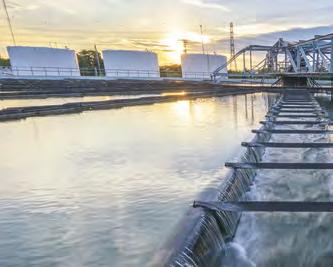
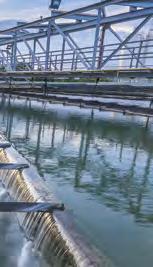




































































































































































































































Tim Thibert
City of West Melbourne
Work title and years of service.
I have proudly served as the water distribution supervisor for the City of West Melbourne for the past seven years. Prior to joining West Melbourne, I dedicated 12 years to the City of Melbourne, where I gained much of my experience in water distribution and underground utilities.
My career began in 2002 in the well drilling industry, where I was responsible for drilling water wells, installing pumps, and running water lines to complete each project. Through this hands-on experience, I quickly discovered
FWRJ READER PROFILE

in the vital role that water infrastructure plays in serving our communities. Since then, I have remained committed to expanding my knowledge and expertise in the water industry, continuously striving to master my profession.
What does your job entail?
As the water distribution supervisor, I oversee the operation, maintenance, and regulatory compliance of the city’s entire water distribution system. My responsibilities include managing fire hydrant maintenance and testing programs, valve exercising, meter reading operations, cross connection control, water quality monitoring, emergency water main repairs, and the review of engineering construction plans to ensure compliance with city standards.
What education and training have you had?
I have been extremely fortunate throughout my career to work with exceptional mentors who believed in my potential and encouraged me to continue learning every aspect of this field. Their guidance has instilled a commitment to professional development, education, and excellence in the underground utility profession.
My professional qualifications include holding a Florida Department of Environmental Protection Water Distribution Operator Level 1 license, Wastewater Collection Class A certification, and Reclaimed Water Distribution
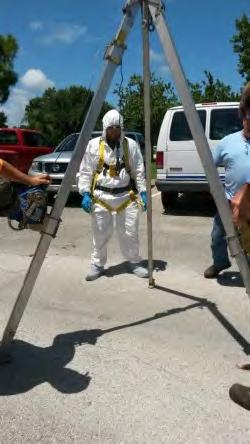
Class C certification. I have also earned Florida Stormwater Association Stormwater Level 1 and Level 2 certifications, as well as backflow tester and repair certifications. In addition, I have completed extensive training and certifications in trenching and shoring, confined space entry, competent person safety standards, and numerous Federal Emergency Management Agency emergency management courses. Most recently, I made the decision to further my education by pursuing a college degree and have begun coursework at Eastern Florida State College.
What do you like best about your job?
I truly love everything about my job. One of the things I enjoy most is that no two days are ever the same. Each day presents new challenges, and I take great pride in being able to assess a problem, develop a solution, and see the work through to completion. There is a tremendous sense of accomplishment that comes from excelling in a field that many people know very little about. I also value the camaraderie that comes with working as part of a dedicated team. Whether responding to an emergency repair or completing a major project, there is a unique sense of satisfaction in overcoming challenges together and knowing that the job was done safely, efficiently, and to the highest standard. lthough I now spend much of my time in a supervisory role and in the office, I still enjoy
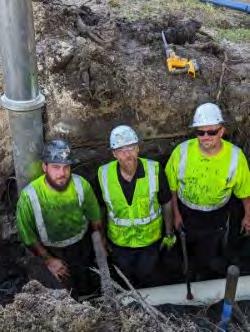
My first confined space training course in 2008 where I was lowered into a sanitary sewer manhole.
Working side by side with my team (left to right: Alan Brookins, Tim Thibert, and Chris Riley) on an eight-inch water main break in 2024.
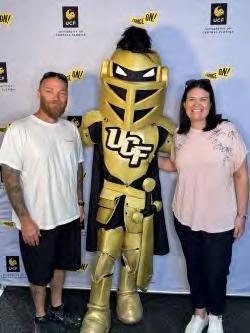
getting out in the field and working alongside my team whenever the opportunity arises. At this stage in my career, I find teaching and mentoring others to be the most rewarding part of my job, sharing my knowledge and experience with the next generation of workers and helping them develop the skills and confidence to succeed.
What professional organizations do you belong to?
I am an active member of the Florida Water and Pollution Control Operators Association (FWPCOA) and currently serve as the chair of Region 3, representing all of Brevard County. The City of West Melbourne is also an active member of the Florida Section of the American Water Works Association and the American Public Works Association. The more I get involved in these professional organizations the more I realize the importance of staying up to speed with the latest industry best practices, emerging technologies, and the ever-changing regulations regarding potable water.
How have the organizations helped your career?
The FWPCOA has played a significant role in my professional development over the years. It has provided the best-quality training and educational opportunities that have prepared me for real-world challenges that I
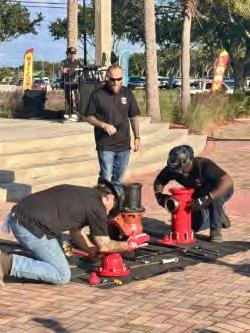
have encountered in the field. I still remember attending my first Water Distribution Level 3 course many years ago; I was struck by just how much there was to learn about this field, but rather than getting overwhelmed, I found myself excited to take on the challenge and continue growing in my profession.
I am deeply appreciative of everything the organization has done—not only for me personally, but also for the water and wastewater industry as a whole. Its commitment to education and excellence has helped shape the careers of countless underground utility professionals.
As my career has progressed, I have felt a strong desire to give back to the profession that has given me so much. With that goal in mind, I recently became an instructor for FWPCOA, where I now teach the Water Distribution Level 3 course at the association’s short schools. Sharing the knowledge and experience I have gained over the years and helping others advance in their careers has become one of the most rewarding aspects of my professional journey. I take great pride in contributing to the development of the next generation of water professionals and helping ensure the continued success of our industry.
What do you like best about the industry?
I know I am probably biased in my opinion on this, but the underground utilities field, I

believe, is the absolute best field to get into. I believe that you can be as successful as you want to be if you are willing to put in the work. This field is probably the best example of the phrase “hard work pays off.” I appreciate that everyone has the same opportunity to be successful in this field, whether you are young or old, fresh out of high school or college-educated, man or woman, everyone has the same opportunity to reach their goals.
I also enjoy the extracurricular activities and competitive nature of this field. The past five years, I have been able to compete in the fire hydrant and pipe tapping competitions at the FSAWWA Fall Conference. Participating in these events have really shown the fun side of this industry as you network with and compete against other people that do the same work you do on a daily basis.
What do you do when you’re not working?
I enjoy most outdoor activities, such as fishing, golf (both disc golf and ball golf), and kayaking; going to University of Central Florida football and basketball games; traveling the world (and taking pictures of the different fire hydrants!); and spending time with my family. They say that if you love what you do you never have to work a day in your life. After 20 plus years in this field, I can absolutely agree with that. S
Me with my beautiful wife, Rebecca Thibert, and Knightro, the University of Central Florida mascot.
Coaching the West Melbourne fire hydrant competition team (left to right: Alan Brookins, Tim Thibert, and Solomon Rini) at our annual Heritage Day Festival in 2024.
Operators: Take the CEU Challenge!
Members of the Florida Water and Pollution Control Operators Association (FWPCOA) may earn continuing education units through the CEU Challenge! Answer the questions published on this page, based on articles in this month’s issue. Circle the letter of each correct answer. There is only one correct answer to each question! Answer 80 percent of the questions on any article correctly to earn 0.1 CEU for your license. Retests are available.
This month’s editorial theme is Disinfection and Water Quality. Look above each set of questions to see if it is for water operators (DW), distribution system operators (DS), or wastewater operators (WW). Mail the completed page (or a photocopy) to: Florida Environmental Professionals Training, P.O. Box 33119, Palm Beach Gardens, Fla. 33420-3119, or scan and email a copy to memfwpcoa@gmail.com. Enclose $15 for each set of questions you choose to answer (make checks payable to FWPCOA). You MUST be an FWPCOA member before you can submit your answers!
EARN CEUS BY ANSWERING QUESTIONS FROM PREVIOUS JOURNAL ISSUES!
Contact FWPCOA at membership@fwpcoa.org or at 561-840-0340. Articles from past issues can be viewed on the Journal website, www.fwrj.com.
Screening Corrosion Control Inhibitors Using Traditional and Alter native Bench-Scale Methods
Sam Laing and Steven J. Duranceau see page 78
(Article 1: CEU = 0.1DS/DW02015473)
1. What regulatory change lowered the lead action level to 0.010 mg/L?
a. Original Lead and Copper Rule (LCR)
b. Lead and Copper Rule Revisions (LCRR)
c. Lead and Copper Rule Improvements (LCRI)
d Safe Drinking Water Act Amendments
2. Which method is considered more hydraulically representative of actual distribution systems?
a. Traditional jar testing
b. Pipe rack studies
c. Weight loss testing
d Coupon immersion batch
3. What is the primary limitation of traditional jar testing?
a. Poor hydraulic representation
b High cost
c. Complex operation
d. Inability to measure metals
4. Why was normalization of concentration data needed?
a. To reduce sampling frequency
b To account for coupon material differences
c. To eliminate temperature effects
d. To adjust for surface area-to-volume difference
5. What general conclusion was drawn about inhibitor performance?
a. All inhibitors increased corrosion
b. No inhibitors were effective
c. Alternative inhibitors reduced copper release vs. current inhibitor
d Only the current inhibitor was effective
From Source to Tap: How Microplastics Enter and Can be Removed From Drinking Water
Viraj deSilva, Barbara Martinez, and Dilrika Weerapperuma see page 14
(Article 2: CEU = 0.1DS/DW02015474)
1. What size defines microplastics (MPs)?
a. Smaller than 50 mm
b. Smaller than 5 mm
c. Smaller than 1 cm
d Smaller than 100 mm
2. Why are MPs considered a public health concern?
a. Only aesthetic impacts
b They increase water hardness
c. Potential toxicity and ability to carry contaminants
d. They improve filtration efficiency
3. What did studies find regarding MPs in bottled water versus tap water?
a. Tap water always has more MPs
b. Bottled water generally has higher MP concentrations
c. Both are completely free of MPs
d Bottled water has none
4. What percentage removal of MPs can nano- and ultrafiltration achieve?
a. 10 to 25 percent
b 25 to 50 percent
c. 60 to 70 percent
d 87.3 to greater than 99.9 percent
5. What is one recommended way to reduce personal exposure to MPs?
a. Drink only bottled water
b Use more plastic packaging
c. Rely on tap water and reusable bottles
d. Avoid all filtration
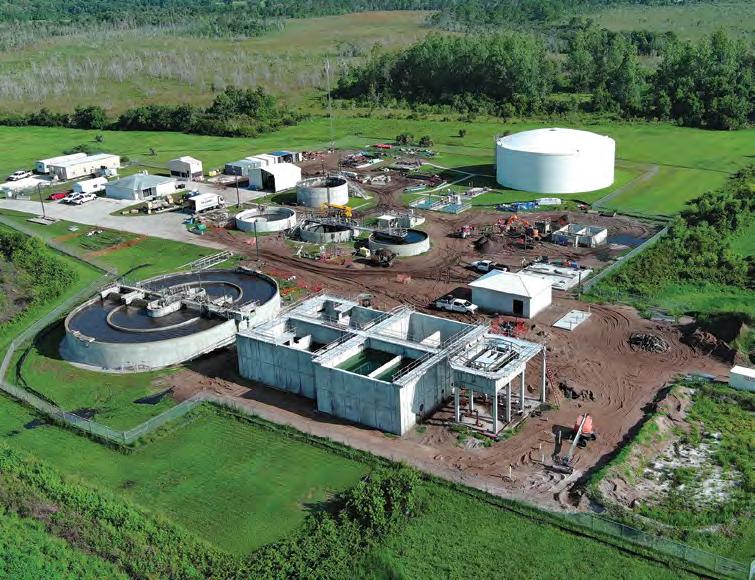
Building Florida's Water Future
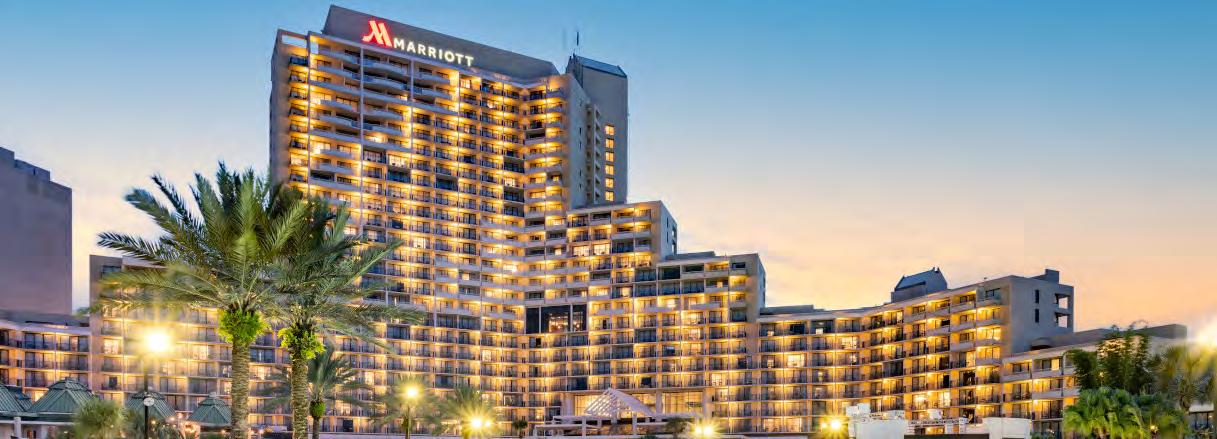


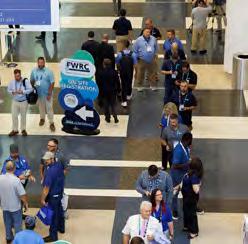
CALLING ALL SPEAKERS
It’s time to upload your submissions
Seize the opportunity to share your knowledge and solutions with the water industry. We are currently accepting papers/abstracts for consideration as a part of the 2027 Technical Program.
Visit fwrc.org/learn to begin your submission today!
ABSTRACTS DUE
BY SEPTEMBER 30, 2026
W EBSITE UPDATES
Stay up-to-date with all things FWRC
Have you visited the FWRC website lately? We’ve been busy working on lots of exciting updates for the upcoming 2027 conference. We’ve also archived all Technical Session presentations from 2026 which are available to view and download.
Visit fwrc.org to see what’s new on the website!
M ARK YOUR CALENDARS
2027 Attendee Registration opens December 8
Are you excited to purchase your tickets for the largest water conference in the southeast? Attendee registration for 2027 FWRC opens online December 8, 2026. Mark your calendars to take advantage of the early bird pricing!
Visit fwrc.org to keep informed of all key dates!


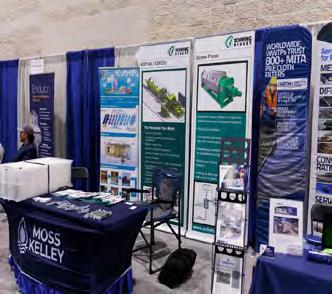
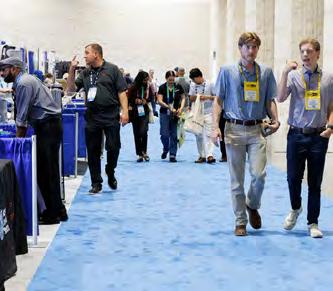
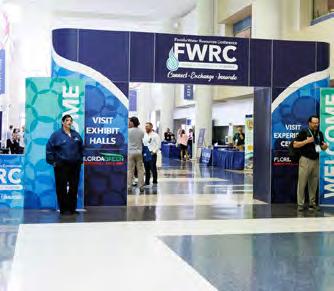

Screening Corrosion Control Inhibitors Using Traditional and Alternative Bench-Scale Methods
The Lead and Copper Rule (LCR) has been a cornerstone of drinking water regulation, establishing allowable concentrations of lead and copper in water distributed to the public through drinking water systems. Utilities in compliance with the LCR have been required to stay under the lead and copper action levels of 0.015 mg/L and 1.3 mg/L, respectively. In 2021, the Lead and Copper Rule Revisions (LCRR) were put into place, introducing a slew of new requirements for lead service line (LSL) replacements, distribution system material inventories, and sampling protocols. In 2024, the Lead and Copper Rule Improvements (LCRI) were passed to reinforce the LCRR, with the most significant change being the elimination of the lead “trigger level” and instead lowering the lead action level to 0.010 mg/L, which becomes enforceable in November 2027.
Sam Laing and Steven J. Duranceau
The LCRR and LCRI also recommend the elimination of jar testing (or coupon studies) to demonstrate a change to corrosion control treatment (CCT), except in cases where LSLs are absent. In these systems where LSLs are not present, or where few exist and are to be replaced, coupon testing may continue to be a valuable tool for CCT evaluation when pipe rack experiments are not financially optimal. Among the available approaches, bench-scale jar testing and pilot-scale pipe rack testing are the two most widely used methods for identifying the most effective CCT (USEPA 1993). Jar testing for corrosion control evaluations has long been used in the drinking water industry, with several configurations designed throughout the years (Cornwell & Wagner 2019; Edwards & Ferguson 1993; Korshin, Perry, & Ferguson 1996). Jar testing methods are known to
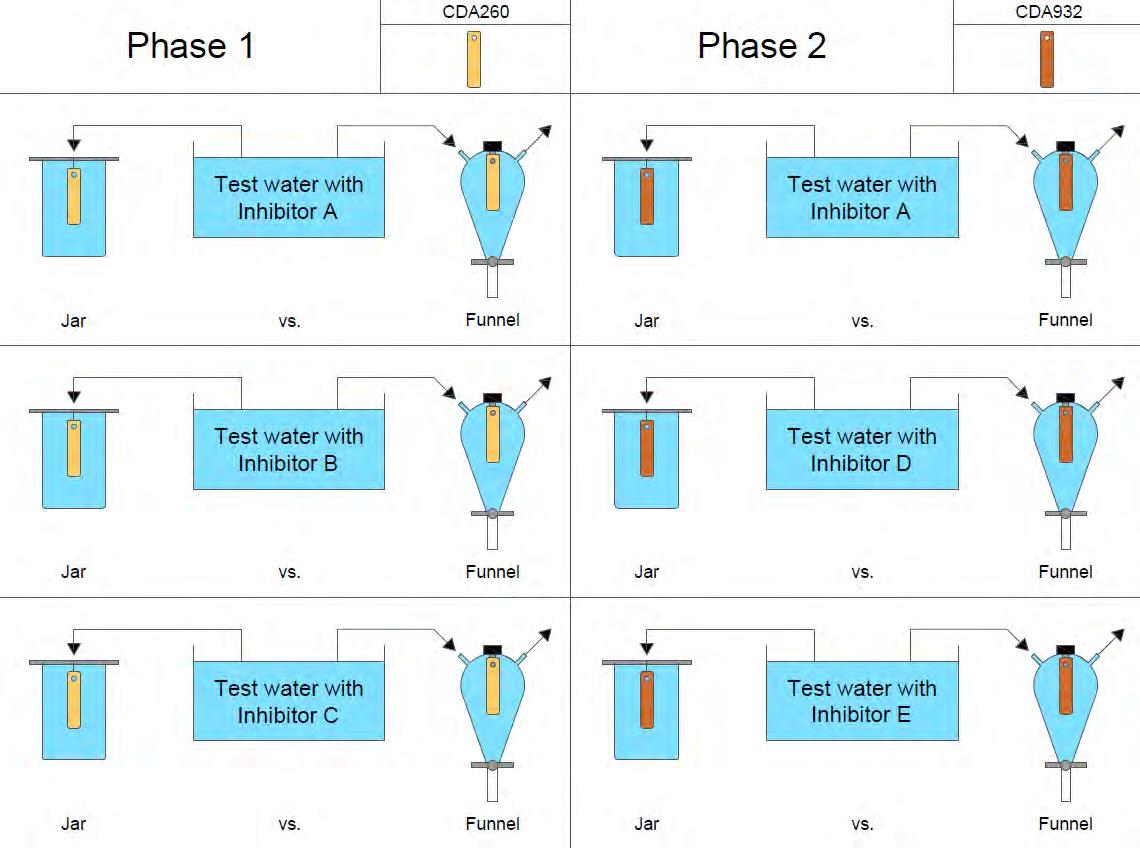
At the time this research was conducted, Sam Laing was a graduate research assistant at the University of Central Florida (UCF) in Orlando; he is now an assistant engineer at Hazen and Sawyer in Charlotte, N.C. Steven J. Duranceau, Ph.D., P.E., is professor in the department of civil, environmental, and construction engineering at UCF.
have a much lower barrier to entry, both in cost and in operational complexity, than traditional pipe rack test methods (Roth et al. 2021, Masters et al. 2022). Bench-scale testing is operationally convenient, but the results are considered less reliable due to poor hydraulic representation of distribution system conditions. While traditional immersion jar tests do not provide a direct representation of lead and copper levels that would indicate LCR compliance at the tap, the results provide a relative indication of metals release for each treated water in comparison with a control condition. Corrosion test results often exhibit significant variability that make it challenging to draw conclusions, so accounting for variability is important and is typically handled by performing sample replicates. Moreover, corrosion testing by weight-loss methods, the “cook and look” method, generally requires extended testing periods that do not necessarily produce satisfactory results. Hence, immersion testing under controlled conditions that measures metal release (concentration data) is favored as a lower-cost assessment method for potable water lead and copper studies. In contrast, data collected in pipe rack studies are considered higher quality since the method more accurately simulates flow regimes found in public water systems. Pipe rack studies are the preferred method of choice for evaluating CCT, especially when LSLs are present in a system, but the cost of these studies can be prohibitive. There have been many different corrosion pipe rack designs and methods developed over the years. The U.S. Army Corps of Engineers
Figure 1. Graphical abstract portraying the experimental plan.
(USACE) developed a pipe rack system for determining the effectiveness of corrosion control chemicals in potable water (Prakash, T.M. et al. 1988). In addition, the Water Research Foundation (WRF) had developed a soldered copper tubing test rack for use in conducting corrosion control studies (WRF 1990). Duranceau and colleagues investigated the use of electrochemical noise corrosion monitoring for water purveyors (Duranceau, Townley, and Bell 2004). The investigation revealed that there were differences when adding corrosion chemicals to virgin metal samples versus precorroded coupons. Prior municipal corrosion control studies have historically relied on virgin components during implementation of studies; however, since the distribution piping within residences and buildings, if metal, had experienced corrosion, then the addition of chemical to virgin metal could skew results. Duranceau and colleagues (2018) demonstrated the use of precorroded linear polarization probes and precorroded coupons for conducting accurate and rapid corrosion inhibitor screening.
The need for reliable and cost-effective results for corrosion control evaluations was demonstrated by Campesino-Karlins and Duranceau (2023) using a novel bench-scale testing method that is believed to closely mimic distribution system conditions, as compared to traditional jar test methods using immersed coupons. This alternative bench-scale corrosion control method utilized a modified separatory funnel equipped with a rubber stopper and an immersed precorroded metal coupon that provided a sealed environment, allowing a flow-through changeout component unlike traditional methods (Campesino-Karlins and Duranceau 2023).
The purpose of the work reported in this article was to compare, in parallel, the bench-scale funnel method versus the traditional bench-scale method for a subset of the test conditions. By performing the evaluation using the same test conditions, a comparison can be drawn between the two methods to explore the effects of flow and sealed conditions to bench-scale evaluations. It was observed by Campesino-Karlins and Duranceau (2023) that traditional stagnant jar testing led to higher variance in copper release compared to the flow-through method during an experimental comparison of a limited sample size.
Project Background
As part of a larger ongoing investigation
that screened alternative phosphate-based treatment chemical formulations for corrosion control at a municipal utility, a parallel study was conducted to compare traditional and alternative bench-scale testing procedures. The evaluation was performed at a central Florida water purveyor (utility) that operates three water treatment plants (WTPs) providing service to over 50,000 customers. Two of the utility’s facilities, the North and East WTPs, treat groundwater via tray aeration, disinfection with chlorine, and corrosion inhibitor addition. The third WTP, referred to as the South WTP, extracts groundwater and treats the water supply via granular activated carbon (GAC), forced draft aeration, disinfection with chlorine, and corrosion inhibitor addition. Results of the comparison study reported herein used test water only from the South WTP.
Water for the comparison study at the South WTP was collected once per week and transported to the laboratory to conduct bench-scale testing. Finished water was collected, which contained the utility’s currently used corrosion inhibitor while additional bulk water was collected prior to the addition of the chemical. Once at the University of Central Florida (UCF) campus, the alternative corrosion inhibitor formulations were added to the appropriate batch of bulk water before bench-scale testing. The bulk water was dosed with a volume of corrosion inhibitor stock solution such that the concentrations of orthophosphate (OPO4) in the water matched the concentration
in the utility’s finished water with a target of ± 0.10 mg/L O-PO4. The average water quality observed in the finished water from the South WTP is listed in Table 1.
Methods and Materials
General
To evaluate corrosion control performance under controlled laboratory conditions, two distinct experimental setups were employed. Metal coupon tests were performed using traditional immersion batch tests, and a modified flow-through test. The bench-scale testing took place in two 13-week phases, separated by a three-week gap to allow for cleaning equipment and processing samples. Each phase tested two alternative corrosion inhibitors alongside the product currently in use by the utility. Figure 1 provides a graphical abstract portraying the experimental plan for the study. The first four weeks of each phase were used as a conditioning period, where the only test water used across the set of samples was the utility’s finished water. This step was implemented to acclimate the metal coupons to distribution system conditions prior to any change in the water conditions. After the fourth week, the alternative inhibitors were used to create the necessary test waters for the remainder of each phase, allowing for nine weeks of data for comparison.
on page 80
Water Quality Parameter South WTP
Table 1. Average Water Quality of Finished Water From the South Water Treatment Plant (Reported as mg/L Unless Stated Otherwise)
Traditional Metal Coupon Immersion Batch Test
The traditional immersion jar testing method used in this experiment was based on the methods described by Cornwell and Wagner (2019). Glass jars containing approximately 500 mL of test water were changed out every three or four days at the same intervals as the flow-through method. A set of samples for the jars and the funnels are displayed for comparison in Figure 2. The metal coupons were suspended in the jars using a piece of square plexiglass with a zip tie adhered to the surface with epoxy. Note that the stagnation times and the type of metal coupon used in the experiment were the same for both methods. After the stagnation period, water quality parameters were analyzed prior to the in-situ acidification of the sample and subsequent metals analysis.
Modified Metal Coupon Immersion FlowThrough Test
Unlike traditional immersion jar testing methods, the flow-through method utilizes
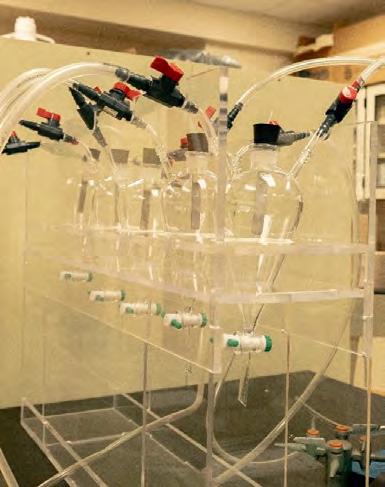
modified in a way that allows water to flow through the apparatus. The full list of materials required for utilizing the method are reported by Campesino-Karlins and Duranceau (2023). The test waters were pumped through Tygon E-Food tubing to the modified separatory funnel using a peristaltic pump at a flow rate of 200 mL/min. Test water flowed through the inlet and across the coupon, which is secured with a nylon coupon holder affixed to a rubber stopper and out through the outlet to waste. After a 15-minute flow period, the pump was stopped, allowing the coupon to remain under stagnant conditions in the test water for periods of three to four days prior to the sample aliquot being taken.
Corrosion Inhibitor Selection
The corrosion inhibitor currently in use at the utility is classified as having a 50:50 “ortho:poly” ratio, meaning the phosphate content consists of approximately 50 percent orthophosphate and 50 percent polyphosphate. The alternative inhibitors tested against this product over the course of the study contained higher orthophosphate content. During Phase 1, two blended phosphate products with 85:15 ortho:poly
ratios were evaluated alongside the utility’s current corrosion inhibitor. In Phase 2, the alternative products evaluated were two phosphoric acid formulations. Each inhibitor shall be referred to using the names listed in Table 2.
Metal Coupon Selection
The alloys tested in this experiment were two different copper alloys used in various residential plumbing materials, valves, and pump components: CDA260 (70:30 yellow brass) and CDA932 (bearing bronze, which is similar in composition to a leaded brass). The CDA844 (leaded brass) was initially selected for use in this experiment, but was not available; therefore, CDA932 was used as an alternative. The utility has no known LSLs and has not experienced lead-related issues in its system; nevertheless, a benchscale study using leaded materials provides an indication as to whether a change in the corrosion inhibitor would result in elevated lead concentrations. Copper pipes and brass appurtenances (valves, faucets, etc.) are commonly used in residential plumbing and are likely the main source of copper found in public water systems. In systems where no known LSLs exist, leaded brass plumbing materials may be the main contributor to lead exposure in drinking water systems. The CDA260 was used in the comparison during the first phase of the study while CDA932 was used in the second phase of the study (Lytle and Schock 1996). Metal coupons were conditioned for the first four weeks of each phase to allow the material to begin acclimating to current system conditions.
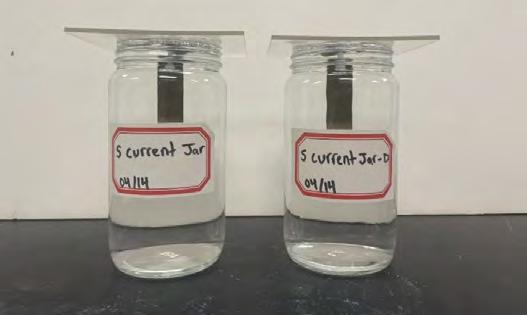
Sample Preparation for Water Quality Analysis
uring each changeout, the aliquot in the jar or funnel was collected and analyzed for pH, temperature, dissolved oxygen, conductivity, oxygen-reduction potential (ORP), orthophosphate, and chlorine residual. The aliquot was then filtered using a 0.45-micron filter, acidified with nitric acid for at least 24 hours before analysis to obtain metals data with inductively coupled plasmaoptical emission spectroscopy (ICP-OES) that represented dissolved metal content. The total metal content was obtained through standard acid digestion procedures in the U.S. Environmental Protection Agency (EPA) Method 200.7.
Statistical Evaluation
Statistical comparisons of the two methods and the performance of the
Continued on page
Figure 2. Five funnel flow-through samples (left); two traditional jar test batch samples (right).
Table 2. Inhibitor ID and Descriptions
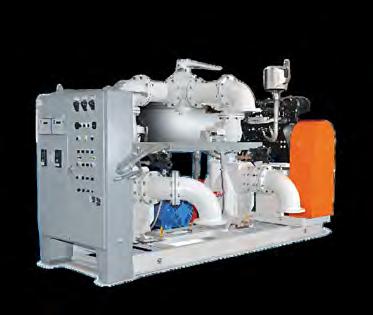
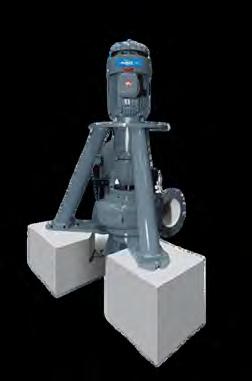
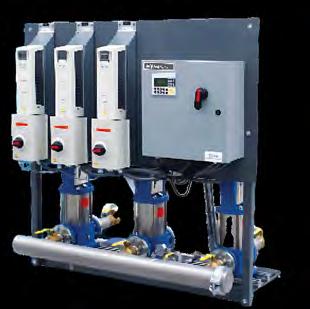
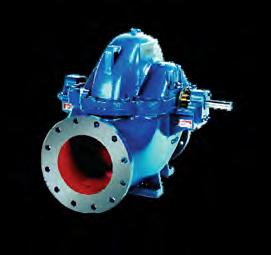

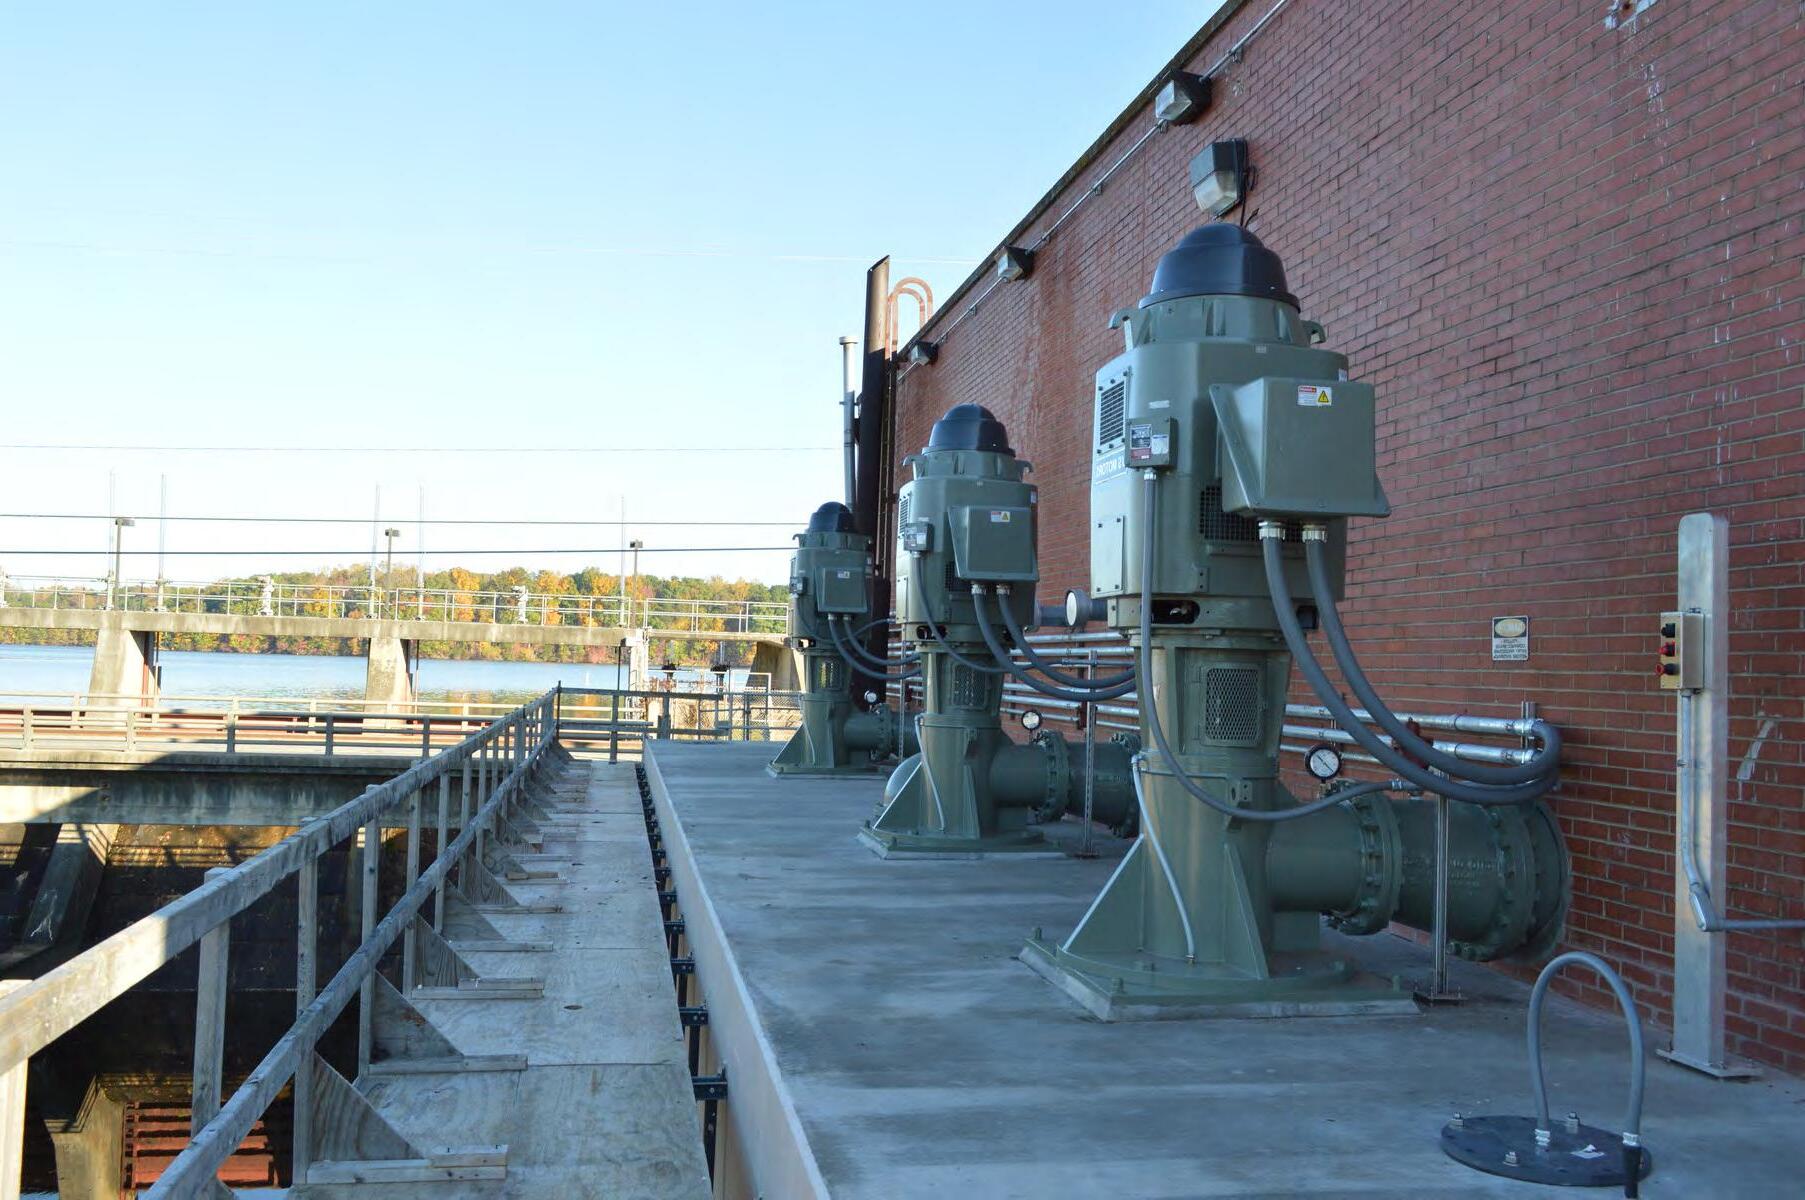
corrosion inhibitors were conducted using ANOVA (Analysis of Variance). A twoway ANOVA test with replication was used to evaluate the effects of both corrosion method and inhibitor type on metal release simultaneously. This analysis tests the main effects of both the method and inhibitor, as well as the interaction between the two to determine whether the effect of an inhibitor depends on the method used.
Because the metal concentration data collected in corrosion experiments do not typically follow normal distributions (Wysock et al. 1995), it is common to use nonparametric statistical methods for determining significance, such as a Wilcoxon Rank Sum analysis. The nonnormal distributions tend to occur due to metal release being much higher at the beginning of a corrosion study, or due to spikes in concentration due to colloidal particles. In order to use statistical methods that assume normal distribution, like ANOVA, it is suggested that metal concentrations be allowed to stabilize over time, so the “stable” data can be analyzed.
Wysock et al. (1995) recommends that a determination be made as to whether a metal concentration dataset is normally distributed, either by graphical or numerical techniques. In this study, each copper concentration dataset was confirmed to follow a normal distribution after the four-week conditioning period using a numerical technique, the Kolmogorov-Smirnov test, at a 95 percent confidence interval. Since the distribution was confirmed to be normal, the use of ANOVA was justified. Lead data for one of the methods were typically below detection limits, so ANOVA was not performed on these datasets.
Comparison
Since the containers used in the two methods are slightly different sizes, there is a difference in the ratio of the surface area of the coupon to the volume of water it is immersed in. The surface area to volume ratio (SA:V) can influence the magnitude of the metal concentration data collected in corrosion control evaluations (Cornwell and Wagner
2019, Devine and Triantafyllidou 2023). To account for the difference between the SA:V in the two methods, the concentration data were analyzed, then used to calculate the mass released in micrograms (µg) by multiplying the metal concentration by the containers’ volume. This conversion is shown in Equation 1. Data were statistically analyzed before and after normalization to determine whether the results were impacted by the difference in SA:V, as described in the results and discussion section.
Scanning Electron Microscopy Evaluations
At the end of each 13-week study, coupons were also analyzed by scanning electron microscopy with energy dispersive spectroscopy (SEM-EDS) at the UCF Materials Characterization Facility. A nondestructive analysis was performed to provide supplemental information about any topographical differences between metal coupons using different methods. After SEM-EDS analysis was performed, the coupons were cleaned and weighed in order to obtain a corrosion rate in mils/year from a gravimetric analysis. These two analyses are meant to supplement the metal release data obtained throughout the course of the study.
Results and Discussion
Phase 1: Method Comparison
During Phase 1 the immersion jar test method and the modified funnel flowthrough method, herein referred to as the traditional method and flow-through method, respectively, were compared using South WTP water dosed with inhibitors A, B, and C in containers equipped with the CDA260 coupon. The average concentrations and standard deviations observed in Phase 1 are displayed in Figure 3. Higher average copper concentrations were observed in the traditional method samples supporting results reported in Campesino and Duranceau (2023). Additionally, standard deviations were observed to be higher using the traditional method compared to the flow-through method. Inhibitor A, which is currently in use at the utility, showed the highest average copper concentration regardless of which method was used. Using the traditional method, inhibitors B and C resulted in decreases to the average copper concentration by 17 and 23 percent, respectively. Alternatively, using the flowthrough method, B and C showed 10 and 16 percent decreases.
Figure 3. Phase 1 average copper concentrations compared across methods and inhibitors.
Table 3. Phase 1 ANOVA Summary Table
The standard deviation of copper concentration was found to be higher in the traditional method as compared to the flowthrough method, as denoted by the error bars in Figure 3. It was observed regardless of inhibitor; the traditional method was seen to be more variable in terms of copper concentration. Standard deviations in inhibitors A, B, and C were found to be, respectively, 59, 71, and 51 percent higher in the traditional method samples compared to their flow-through method counterparts.
The two-way ANOVA analysis performed on the copper concentrations reports on the statistical significance of the inhibitors, the methods used, and the relationship between the two variables, as summarized in Table 3.
The P values listed in Table 3 show the traditional method and the flow-through method are statistically different. To attempt to normalize data yielded from each method due to the difference in SA:V, a separate ANOVA was also performed on the mass released. The P values were below the critical value of 0.05 for both concentration and mass-based ANOVA for the method and inhibitor comparison. These results indicate, with 95 percent confidence, that the methods differ significantly during Phase 1, as do inhibitors A, B, and C. The F-statistic in the concentration-based ANOVA analysis is notably larger than the F-statistic in the mass-based analysis between the methods, while between the inhibitors there is little difference. This indicates that normalizing the concentrations by converting them to mass released is an effective way of adjusting the data to compare the methods. In either case, it is evident that the two methods and the three inhibitors performed statistically differently from each other. Additionally, the P value for the interaction between method and inhibitor is greater than 0.05, meaning that the evaluation of the inhibitors was not significantly affected by which method was used.
Phase 2: Method Comparison
During Phase 2 the methods were compared using South WTP water dosed with inhibitors A, D, and E, in containers equipped with the CDA932 coupon. Recall that the CDA932 coupon contains both lead and copper, and therefore data will be presented for both metals in this section. Inhibitor A was tested in each phase to compare alternative inhibitors to the existing condition. Elevated copper concentrations were observed in Phase 2 compared to Phase 1 and can presumably be attributed to the greater copper content in the CDA932 coupon compared to CDA260.
Phase 1 - CDA260
Phase 2 - CDA932
Figure 4 shows that while the average copper concentrations are higher in Phase 2, the alternative inhibitors still performed better than the utility’s currently used product, similar to the results from Phase 1. Observed copper concentrations for Inhibitors D and E decreased by 10 and 9 percent, respectively, using the traditional method. In contrast, the flow-through method yielded greater reductions of 19 and 23 percent. Interestingly, this is the opposite of what was
Continued on page 84
Figure 4. Phase 2 average copper concentrations compared across methods and inhibitors. Error bars denote standard deviation.
Table 4. Phase 2 ANOVA Summary Table
Table 5. Statistical Variance Yielded From Two-Way ANOVA Analysis on Copper Concentration in mg/L
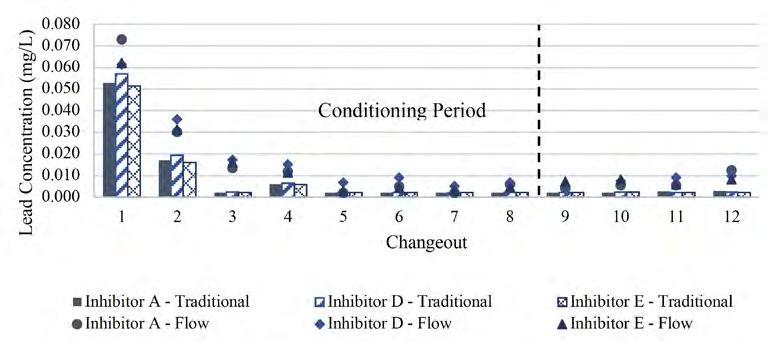
observed in Phase 1, where the flow-through method resulted in a less dramatic decrease in concentration when compared to the traditional method. This could potentially be due to a difference in the effect of flow on different alloys. The error bars in Figure 4 illustrate that the standard deviation in copper concentrations were higher using the traditional method compared to the flowthrough method in Phase 2. Compared to the
flow-through method, the standard deviation for inhibitor A was only 9 percent higher in samples collected using the traditional method, while inhibitors D and E showed significantly greater increases of 77 and 76 percent, respectively.
The results of the ANOVA performed for Phase 2 were similar to those from Phase 1. The methods were shown to be significantly different from each other regardless of how the data were presented. Likewise, the
Continued from page 83 Continued on page
inhibitors were statistically different from each other in Phase 2, as shown in Table 4. A P value greater than 0.05 for the interaction of method and inhibitor suggests, with 95 percent confidence, that the method had no statistically significant effect on the inhibitor’s performance.
O verall, the statistical variance reported in the ANOVA tests for copper concentration across Phase 1 and Phase 2 was observed to be lower in the flow-through method compared to the traditional method. Table 5 reports the variance observed in the sample sets for each method. Relative percent differences in method variance were calculated at 99 percent for Phase 1 and 49 percent for Phase 2. These findings reinforce the observation that copper concentration measurements exhibited consistently lower standard deviations in the flow-through method. This suggests improved precision compared to the traditional approach.
The lead release between the two methods during Phase 2 followed a different trend than copper. In the samples using the traditional method, lead was not detected by ICP-OES in the majority of samples after the conditioning period, meaning the concentration was below 0.002 mg/L, or 2 µg/L, as seen in Figure 5. Alternatively, the flow-through method yielded concentrations generally ranging from 2 to 12 µg/L in the same time frame. Previous studies using the flow-through method at the South WTP with similar alloys have resulted in similar results. In the beginning of the conditioning period, throughout the first four water changeouts, there were detectable levels of lead in the samples from each method. Samples that were below the detection limit were listed as 0.002 mg/L so that they could be
Figure 5. Lead concentrations during the transition from conditioning to the beginning of the inhibitor evaluation. Note the detection level of lead was 0.002 mg/L.
Figure 6. Air bubbles observed after three to four days of stagnation in the traditional method.
Figure 7. Gravimetric analysis in phases 1 and 2.
Table 6. Average Zinc Release Per Water Changeout

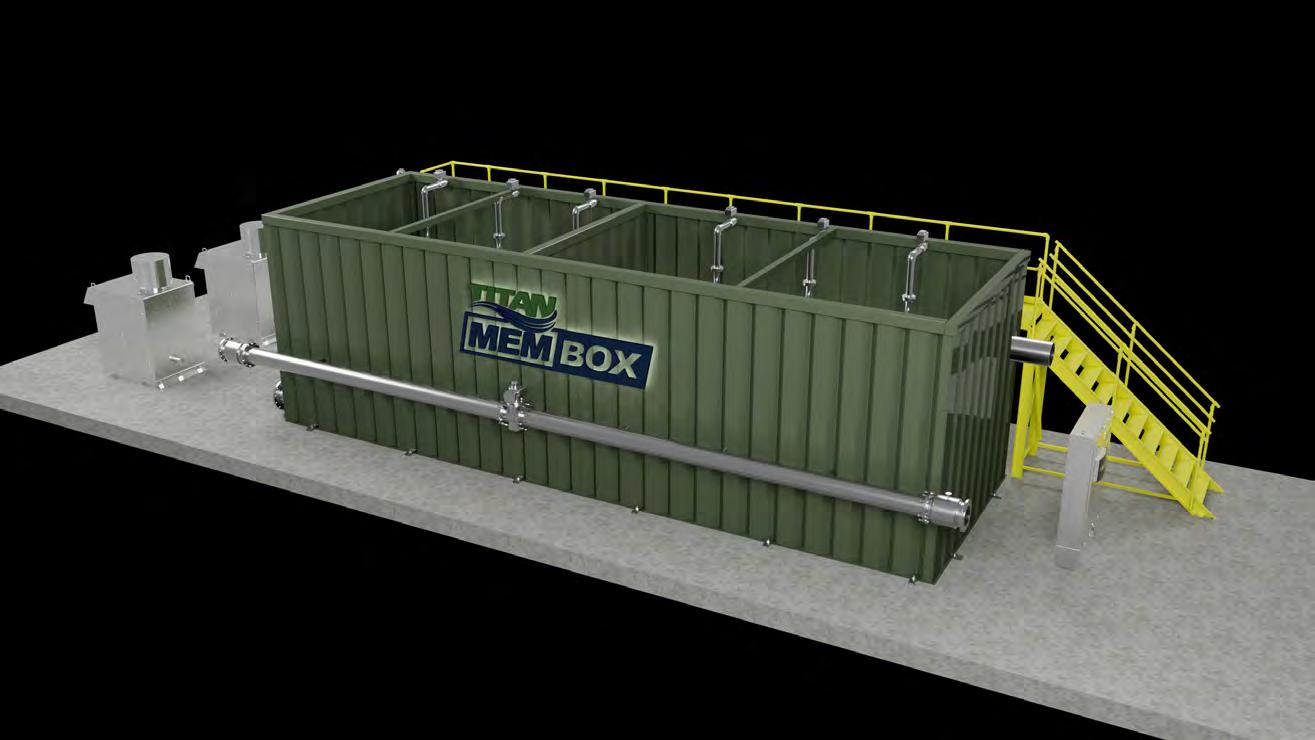


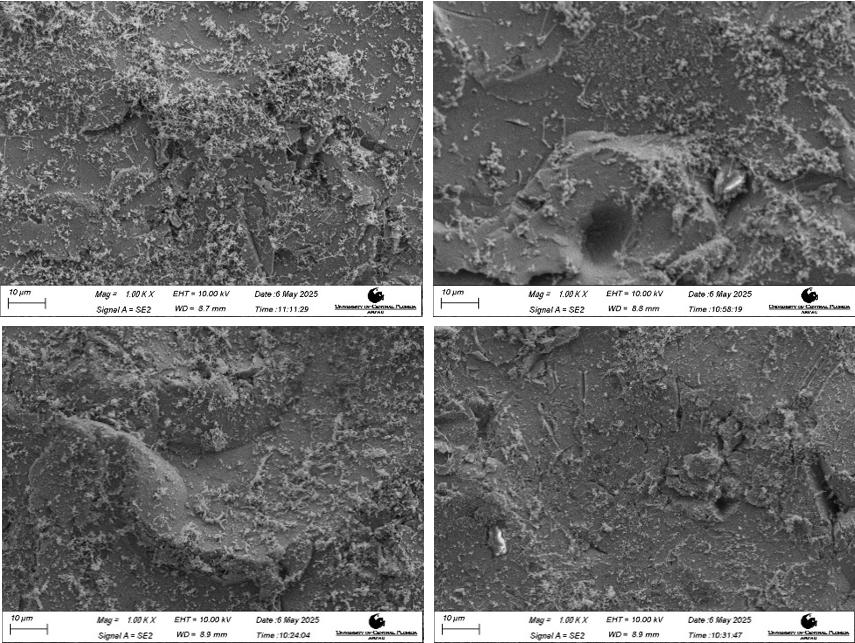
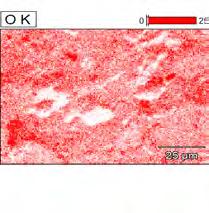
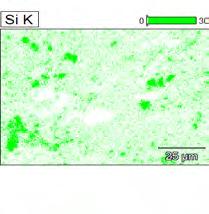
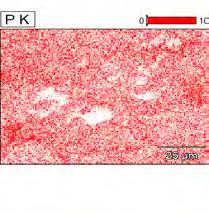
Continued from page 84
shown graphically. Figure 5 shows data from only the first six weeks of the study to better capture the difference between the methods. The remainder of the study generally mirrors changeouts 9 through 12 where the traditional methods yield nondetectable readings and the flow-through method ranges between 2 to 12 µg/L. Considering that the SA:V is larger in the traditional method compared to the flowthrough method, it is reasonable to assume that lead concentrations would have been larger, as was the case with the copper data.
This discrepancy could be due to several factors. The most immediate reason that presents itself is that the flow component could be disrupting the surface of the metal, albeit at a slow flow rate of 200 mL/minute. Another possibility is that there is higher potential for corrosion due to the greater mass of oxidants in the flow-through method relative to the metal surface, since the volume is approximately 600 mL compared to 500 mL in the traditional method. The type and amount of chlorine disinfectant in a system can influence the speciation of lead scale in pipes (Edwards and Dudi 2004, Liu et al. 2008), but since this study used only 8 percent leaded materials it is unclear if this would be enough to cause such a difference in concentration. Due to the lead being undetectable in most traditional method samples, ANOVA was not performed for this dataset.
Variations in the container seals between the flow-through and traditional methods may have contributed to the observed differences in lead levels. During the course of the study, it was observed that air bubbles would consistently appear after three to four days in the stagnant jars. While the plexiglass tops were lightly pressed to form a seal initially, the seal may have weakened over time, allowing air to seep in, as seen in Figure 6. Additionally, in a limited sample size, the dissolved oxygen content was observed to be lower, on average, in the flow-through method compared to the traditional method. This observation is consistent with a previous study performed by Campesino and Duranceau in 2023, which may suggest that the sealed conditions in the flow-through method allow for reduced oxygen intrusion during stagnation, thereby limiting oxidative reactions that could influence lead release dynamics.
Gravimetric Analysis
Weight-loss data from Phase 1 suggest that inhibitor A is indeed resulting in a faster corrosion rate than alternatives B and C, as seen in Figure 7. This difference
Figure 8. The SEM images of CDA260 coupon using test water dosed with inhibitor A during phase 1; traditional method (top) and flow-through method (bottom).
Figure 9. The SEM spectral imaging of inhibitor A - CDA260; flow-through (left) and traditional (right).
is slightly more pronounced in the flowthrough method samples while the traditional method suggests little difference between inhibitor A and C in this analysis. Regardless of method, inhibitor B was shown to result in the lowest corrosion rate in Phase 1 based on the gravimetric analysis. In Phase 2, where the CDA932 coupon was used, corrosion rates were understandably lower due to the lower zinc content. Differences between the inhibitors in terms of corrosion rate are not easily discerned between the traditional method samples in Phase 2 based on gravimetric analysis. The flow-through method, alternatively, shows a distinguishable difference between inhibitors A, D, and E. This suggests that perhaps the effect of flow affected the two alloys differently. Regardless of the observations made on metal weight-loss evaluations (“cook and look”), EPA cautions against using coupon weight-loss results when evaluating lead and copper release to drinking water (EPA 2016).
It is important to consider that copper and lead are not the only constituents in the coupons contributing to the total weight loss. Zinc makes up approximately 30 percent of the CDA260 coupon used in Phase 1, and may be selectively leached out of brass depending on water chemistry (Lytle and Schock 1996); the CDA932 coupon is approximately 3 percent zinc, in contrast. Zinc was analyzed, when possible, along with lead and copper throughout the course of the study. The average zinc concentrations per water changeout for the tested conditions are tabulated in Table 6. The higher mass of zinc released for the flow-through method in Phase 2 supports the gravimetric analysis results, which suggest that the flow-through method resulted in higher zinc corrosion rates for the CDA932 coupon.
SEM-EDS Analysis
The SEM-EDS analysis was performed on the coupons after the 13-week stagnation period to check for any distinct differences in topography or scale composition. It was observed that, in general, there were no staggering visual differences between the coupons from the traditional and flowthrough methods. Small ridges and crevices were commonly seen in coupons from both methods, as pictured in Figure 8. Loose particulates are visible in patches, which EDS analysis and spectral imaging suggest could be a combination of copper oxides, silicate, and phosphate. These patches of byproducts were observed to be marginally more concentrated on coupons tested with the traditional method. This could suggest that the element
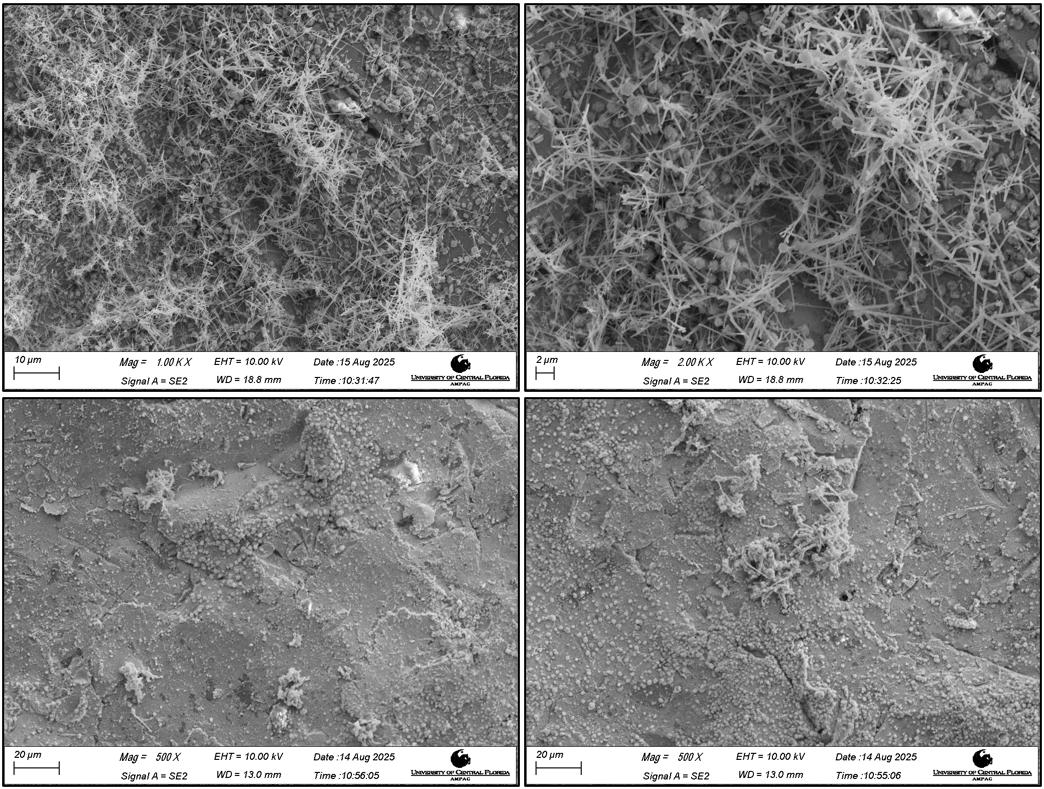
of flow disrupted the formation of corrosion byproducts.
Based on the EDS results, the corrosion products on the CDA260 coupons’ surface are suspected to be copper oxides, phosphate, and silicate. The elemental composition of phosphorus on the metal surface ranges from 1.5 to 5 percent by weight. Similarly, silica generally comprised approximately 2 percent of the surface layer by weight in most samples and is seen to be concentrated in small areas (~5 µm wide) with oxygen, suggesting that silicate deposits are consistently present. Spectral imaging shown in Figure 9 suggests that phosphorus is relatively uniformly distributed along the surface of CDA260 coupons while silicate occurs in patches.
In the CDA260 coupons, zinc content was found to range from 9 to 13 percent by weight, suggesting that it was selectively corroded from the surface layer of the metal, as the alloy contains 30 percent zinc by weight. Overall, the CDA260 coupons exhibited minor buildup of corrosion byproducts, and those that were most prevalent are suspected to be copper oxides and deposits containing phosphate and silica. Tenorite is suspected to be the main form of copper oxide present along the coupons’ surface due to the pH and oxidative conditions, supported by uniform brown and black byproducts universally present across the surfaces (Xiao et al. 2007).
The CDA932 coupon surfaces for each method were characterized by globular particles, which are suspected to be a mix of copper oxides and tin oxides. Silica and phosphorus are also present in similar amounts to the CDA260 surfaces. Deposits of phosphate were uniform, while silicate was more concentrated into cells, as was the case with the CDA260 coupons. Interestingly, lead appeared to be clustered together with sulfur when present, suggesting that lead sulfate may have formed on parts of the surface. Concentrated patches of needle-like structures were observed in several of the coupons used by the traditional method, but were not seen in the flow-through methods for the CDA932 samples. A set of closeup images of these needle-like structures is provided in Figure 10.
Conclusion
The traditional bench-scale immersion jar testing method was found to be more variable in terms of copper release as compared to the flow-through method. The traditional method also appeared to underestimate lead release by the leaded alloy used in this experiment, potentially due to the absence of flow and because the separatory funnel method was a well-sealed environment unlike a jar with a
Continued on page 88
Figure 10. The SEM pictures of South CDA932 inhibitor E; traditional method with needle structures (top) and flow-through method with suspected lead sulfate deposits (bottom).
cover. Each tested corrosion inhibitor resulted in a reduction in copper release compared to inhibitor A. While the methods were deemed to be statistically different from each other, the results of the CCT evaluation would not have been significantly impacted by the choice of method in this case. Similar results have been observed in a comparison of pipe racks and jar tests (Masters et al. 2022), where a pipe rack and jar test reached similar conclusions regarding CCT evaluation, despite varying operational setups.
It was found that the traditional batch method provided copper concentration results that statistically exhibited data with a greater variance and wider standard deviation than the funnel flow-through method. Statistical analysis using two-way analysis of variance showed that both bench-scale methods, as well as the five inhibitors tested (identified as A to E), were significantly different from each other at a 95 percent confidence level. Standard deviations in inhibitors A, B, and C were found to be, respectively, 59, 71, and 51 percent higher in traditional method samples compared to their flow-through alternative counterparts. Although the funnel method was shown to statistically provide a greater degree of precision and accuracy in the results, both methods would result in the same engineering outcome regarding the identification of the more acceptable corrosion control chemicals based on the conditions experienced in this study. The traditional and alternative benchscale test methods revealed that four of the inhibitors outperformed the existing inhibitor used by the utility for copper corrosion at the South WTP; however, only two of the five alternative inhibitor formulations reduced lead release, as compared to the inhibitor currently added to the South WTP treated water supply.
Further research is needed to refine alternative bench-scale test methods and conduct additional comparisons to traditional immersion tests, pipe rack tests, and fullscale results. Additional consideration should be given to comparing bench- and pilotscale testing methods under precorroded conditions that best reflect actual practice to identify when a specific method is most applicable. This is because it would help utilities in planning and selecting any specific evaluation strategy.
Acknowledgments
This project was funded through the Environmental Systems Engineering Institute (ESEI) with financial support (DN14509) provided by Hazen and Sawyer (2520 S.
Lakemont Ave, Suite 325, Orlando, Fla., 32814-6164) and the City of Casselberry (95 Triplet Lake Drive, Casselberry, Fla., 32707), Contract SOQ-2018-0276, PO 083317. Dr. S.J. Duranceau served as the principal investigator within the ESEI. The authors would like to acknowledge and thank the Hazen and Sawyer staff who assisted in the coordination of the project. Additionally, the authors would like to thank the utility engineering and operations staff who helped in coordinating the onsite testing, without which this work would not have been possible. The efforts of the University of Central Florida (UCF) Water Quality Engineering Research Group were greatly appreciated and contributed to the success of this research. Reference herein to any specific commercial product, process, or service by trade name, trademark, manufacturer, or otherwise does not necessarily constitute or imply its endorsement, recommendation, or favoring by UCF or any agency thereof. The views and opinions of authors expressed herein do not necessarily state or reflect those of Casselberry Water Utilities, Hazen and Sawyer, UCF, or any agency thereof.
References
• Campesino-Karlins, P. and S. J. Duranceau (2023). “Conducting distribution system corrosivity evaluations using an innovative jar test procedure.” Desalination and Water Treatment. 295: 1-17.
• C ornwell, D. A. and J. R. Wagner (2019). “Coupon procedures for evaluating Lead and copper solubility.” J. AWWA. 111(10): 12-24.
• Devine, C. and S. Triantafyllidou (2023). “A literature review of bench top and pilot lead corrosion assessment studies.” AWWA Water Science 5(2): e1324.
• Duranceau, S.J., A.B. Rodriguez, C.J. Higgins, R. Wilder, S. Myers-O’Farrell, S.J. Black, and B.A. Yoakum. “Use of Precorroded Linear Polarization Probes and Coupons for Conducting Corrosion Control Studies.” Florida Water Resources Journal. 69(12): 22-29 (2018).
• Duranceau, S.J., D. Townley and G.E.C. Bell. Optimizing Corrosion Control in Water Distribution Systems. Denver, Colo.: Water Research Foundation and the American Water Works Association (2004).
• Edwards, M., & Ferguson, J.F. (1993). “Accelerated Testing of Copper Corrosion”. J. AWWA, 85(10), 105-113.
• Edwards, M. and A. Dudi (2004). “Role of chlorine and chloramine in corrosion of lead-bearing plumbing materials.” Journal AWWA. 96(10): 69-81.
• Korshin, G. V., Perry, S. A. L., & Ferguson, J. F. (1996). “Influence of NOM on copper corrosion.” Journal AWWA, 88(7), 36-47.
• Liu, H., et al. (2008). “Investigation of the kinetics and mechanisms of the oxidation of cerussite and hydrocerussite by chlorine.” Environmental Science & Technology 42(9): 3241-3247.
• Lytle, D. A., & Schock, M. R. (1996). Stagnation time, composition, pH, and orthophosphate effects on metal leaching from brass. National Risk Management Research Laboratory, Office of Research and Development, U.S. Environmental Protection Agency.
• Masters, S. V., et al. (2022). “Comparison of coupon and pipe rack studies for selecting corrosion control treatment.” AWWA Water Science 4(4): e1293.
• Parks J, Edwards M, Atassi A. 2014. “Nonintrusive Methodology for Assessing Lead and Copper Corrosion.” Water Research Foundation, Denver, Colo.
• Prakash, T.M., et al. (1988). Development of the Pipe Loop System for Determining the Effectiveness of Corrosion Chemicals in Potable Water Systems. Tech. Report. N-88/12/ADA200105, U.S. Army Construction.
• S cholze, R.J., K.A. Pontow, G. Kanchibhatia, and B.T. Ray (1994). Using the CERL Pipe Loop System (PLS) to Evaluate Corrosion Inhibitors That Can Reduce Lead in Drinking Water. Fort Belvoir, Va.: U.S. Army Corp of Engineers Facilities Engineering Applications Program.
• Water Research Foundation. (1990). Lead Control Strategies. Denver, Colo.: AWWA. 15 Duranceau, S.J., D. Townley, and G.E.C. Bell.
• Engineering Research Labs (USACERL), August 1988.Roth, D. K., et al. (2021). “Consider the Pros and Cons of Corrosion Testing Methods.” Opflow Online 47(5).
• USEPA. (1993). Seminar Publication: Control of Lead and Copper in Drinking Water. EPA/625/R-93/001. USEPA, Washington, D.C.
• USEPA. (2016). Optimal Corrosion Control Treatment Evaluation Technical Recommendations for Primacy Agencies and Public Water Systems. USEPA, Washington, D.C.
• Wysock, B. M., et al. (1995). “Statistical procedures for corrosion studies.” Journal AWWA. 87(7): 99-112.
• Xiao, W., et al. (2007). “Effects of blending on surface characteristics of copper corrosion products in drinking water distribution systems.” Corrosion Science 49(2): 449-468. S


Save the Date! Imagine a Day Without Water is October 15, 2026
Each year, Imagine a Day Without Water invites us to see how crucial our need for water really is by visualizing life without it, just for one day. Very quickly, we learn how indispensable water is in our everyday lives, and how our health, environment, and economy depend on reliable access to clean water.
For more than 10 years, Imagine a Day Without Water has united diverse voices around a critical message: Water sustains us all. Each year, industry leaders, community advocates, policymakers, businesses, and educators have come together to recognize that our shared future depends on water. Our collective efforts have driven action and raised public awareness, showing that when we come together, everyone benefits.
Facts and Figures
Just one day without water in the United
S Over $121 billion in losses to the U.S. economy.
S 526,996 jobs placed at risk.
S $39.2 billion in lost wages.
S A $69 billion hit to the Gross Domestic Product—a 10 percent reduction in typical annual U.S. economic growth.
S 40 percent daily losses in economic output for heavily water-dependent industries.
To put this into perspective on a personal scale:
S For the average household, a 24-hour water outage is like flushing $209 down the drain.
S For the 325 million people served by water utilities, a nationwide disruption adds up to over $27.2 billion in household-level impacts per day.
Water and Wastewater Utilities
protecting public health, powering local economies, and supporting every aspect of our daily life. Imagine a Day Without Water is an opportunity to spotlight this essential work and connect with the communities you serve.
Wastewater utilities manage the collection and treatment of domestic, commercial, and industrial wastewater. Their primary goal is to safeguard public health and maintain clean water resources by ensuring that sewage and wastewater are properly treated before being discharged into water bodies or reused. These utilities are essential for preventing waterborne diseases and environmental contamination. By participating and encouraging others in your community to observe Imagine a Day Without Water, utilities can build trust, raise awareness about infrastructure needs, and encourage public appreciation for water.
ater utilities keep the taps running,
Consider setting up a tour or open house of your facility to invite residents to learn about protecting the local environment, key water projects currently underway, and the water treatment process.
This day is also an opportunity to celebrate your water workforce, educate policymakers, and demonstrate how water connects to every issue we care about.
The message is simple: Water can’t be taken for granted. Let’s make sure no one has to experience a day without it.
Businesses
Water shows up in myriad places—from your favorite Americano coffee at the local cafe to the essentials for your weekly pottery class.
Dependable water access is vital for local and national businesses alike. It’s a fundamental resource powering daily operations and product creation. When businesses champion community-minded initiatives like Imagine a Day Without Water, it’s a win-win.
Industries that rely heavily on water would be severely impacted as well. If the U.S. wants to lead the world in artificial intelligence (AI), it must also lead in modernizing water infrastructure. Data centers that power AI
are massive water users, and even a single day without service could mean losses of up to 20 percent in economic output, which is nearly $2 billion for this sector. For other industries that rely heavily on water, they would experience 40 percent in lost output daily, translating to billions of dollars across industries, reaching as high as $13 billion in losses to the healthcare industry alone.
By joining Imagine a Day Without Water, your business can raise awareness among team members and customers.
Educators
Water is something we all use every single day when we brush our teeth, fill a water bottle, or water the plants in our classrooms. But what would happen if one day, we turned on the tap and nothing came out?
Imagine a Day Without Water is a chance for students and educators to learn how water connects to our health, environment, and future. Whether it’s writing poems, drawing posters, or connecting with local water experts, there are so many ways your students can participate.
Water is life and learning about it can be empowering and fun.
Community and Nonprofit Organizations
Imagine a Day Without Water is a powerful opportunity to draw attention to community water needs and beloved natural resources. Aligning your education, advocacy, and engagement around this day of action can amplify your key messages so you can reach new audiences.
Officials and Policymakers
Water is a shared resource that connects people, communities, and industries, making collaboration across industries, sectors, and policymakers essential to ensure access for all. Imagine a Day Without Water is a powerful reminder that reliable, safe water systems are the foundation of thriving communities.
For elected officials, decision makers, and policymakers, this day is a chance to connect with communities and highlight the importance of smart water investments. It’s also an opportunity to support local utilities and their staff members who work every day to keep our communities running.
How You Can Take Action Today
Organizations can mark the day in diverse and creative ways:
S Proclamations and recognition from mayors and governors.
S Community events, school activities, and utility tours that connect residents with the value of water.
S Student art contests that bring the message to life in cultural and emotional ways.
S Connect with your representatives by calling the U.S. Congressional Switchboard at 202224-3121 to support water-related funding.
S Harness social media to spread the word about water. Use Instagram or TikTok to show the many ways you use water in a day.
S Write a blog post to be shared online or with a local news outlet.
S Engage your community to print and display signs, posters, and activity sheets in offices, businesses, schools, and community centers.
Strong water systems mean stronger communities. Your voice can help ensure water stays top of mind and top of the agenda. For more information go to thevalueofwater. org. S
FEMA Announces $89 Million Funding for Florida
The Federal Emergency Management Agency (FEMA) has approved more than $89 million in funding to support more than 70 recovery and hazard mitigation projects in Florida communities affected by Hurricanes Debby, Helene, Milton and other past disasters.
It provided more than $14 million in Hazard Mitigation Grant Program funds to the state for its Elevate Florida initiative and other projects. The state-managed program funds cost-effective measures designed to protect lives and property during a future disaster.
Approved funds include:
S $12 million to support 35 Elevate Florida homeowners across the state to physically raise an existing property, rebuild stronger, or implement other protective measures.
S More than $457,000 for Hillsborough County to harden utility equipment such as sanitary sewers, lift stations, and electric panels.
S $415,000 for Citrus County for generators and emergency power.
S More than $250,000 for Putnam County for lift stations, generators, and emergency power.
Florida received more than $69 million in awards under the public assistance program. The program helps fund emergency measures and permanent disaster recovery work for local communities.
Notable projects include:
S $40.8 million to the Florida Division of Emergency Management and other state agencies for debris removal, emergency protective measures, and state park and beach recovery projects following multiple disasters.
S $13.6 million for multiple healthcare facilities and counties across Florida for COVID-19 recovery.
S $7.1 million to reimburse Lee County
School District for the Hector A. Cafferata Elementary School’s temporary facility expenses after Hurricane Ian.
S $2.5 million for Charlotte County for beach and dune erosion restoration caused by Hurricane Milton.
S Nearly $665,000 to the West Villages Improvement District in Sarasota County for districtwide wayfinding replacement and utility restoration after Hurricane Ian.
Another $5 million from FEMA helps the state implement its disaster unemployment and disaster case management programs. Volunteer Florida manages the disaster case management program through local nonprofit organizations located in the jurisdictions they serve. It assists survivors in developing and carrying out their disaster recovery plans.
Over the past 90 days, FEMA provided nearly $371 million to Florida for postdisaster grant programs. S
FWEA FOCUS
Florida’s Waters: Why Quality Matters

ADavid Hernandez President, FWEA
ugust in Florida is no joke, especially if you like to spend your time outdoors! For me, in order to beat the summer heat, I always want to be near, on, or in the water.
Fortunately for us Floridians, we are blessed with an incredible variety of water resources. We have the Atlantic Ocean stretching along our east coast and the Gulf along our west coast. We have Biscayne Bay, Tampa Bay, Charlotte Harbor, the Indian River Lagoon, and Apalachicola Bay. We have iconic waterways like the St. Johns River, Suwannee River, Caloosahatchee River, and Peace River. We have Lake Okeechobee, thousands of smaller lakes, and some of the most beautiful freshwater springs in the world, including Silver Springs, Ichetucknee Springs, Wakulla Springs, Blue Springs, Rainbow Springs, and Weeki Wachee. The list goes on and on!
Whether you’re boating in the Florida
Keys, snorkeling in a spring, kayaking through mangroves, or simply watching the sunset over the water, Florida’s waterways are part of what makes our state extraordinary.
The more I think about it, the more I realize that water isn’t just something we work with every day. It shapes our communities, our economy, our recreation, and so many of our favorite memories.
That’s why the theme of water quality is so important.
Protecting Our Water
Most people don’t spend much time thinking about what it takes to protect our water resources. They turn on the tap and expect clean drinking water. They bring their families to the beach and expect safe swimming conditions. They launch a kayak into a river and expect clean water.
These expectations don’t happen by accident. They happen because of the work performed every day by the people in our industry.
What often goes unseen is the sheer coordination required to keep Florida’s waters healthy. Stormwater teams manage runoff during intense summer rains. Wastewater professionals ensure that treatment facilities
operate reliably, even during hurricanes. Reuse programs help stretch limited supplies while reducing nutrient loads. Outreach staff teach residents how small actions—like proper fertilizer use or maintaining septic systems— can make a big difference.
All of this work reflects a shared commitment: safeguarding the waters that define our state. When we protect water quality, we protect public health, local economies, wildlife habitat, and the Florida lifestyle we all cherish.
Upcoming FWEA Events
One of the things I appreciate most about FWEA is the opportunity to bring water professionals together to learn from one another, share new ideas, and strengthen our industry.
19th Annual Southwest Florida Water & Wastewater Exposition
A great example of that is the 19th Annual Southwest Florida Water & Wastewater Exposition, which will take place on Aug. 27, 2026, in Punta Gorda at the Charlotte Harbor Event & Conference Center. The event features both a technical program and an exhibition that brings together utilities, operators, engineers, manufacturers, contractors, suppliers, students, and other water professionals from throughout the region.
Events like the Southwest Florida Expo remind us that protecting water quality is truly a team effort. No single organization can do it alone. If you’re attending the expo, I encourage you to introduce yourself to someone new, attend a technical session outside your usual area of expertise, and spend some time visiting the exhibitor booths.
Until next month, stay cool and enjoy everything that Florida’s waters have to offer! S
My children, Zoey and Finn, enjoying Florida’s water.
C L A S S I F I E D S
CLASSIFIED ADVERTISING RATES - Classified ads are $22 per line for a 60 character line (including spaces and punctuation), $60 minimum. The price includes publication in both the magazine and our Web site. Short positions wanted ads are run one time for no charge and are subject to editing. ads@fwrj.com
POSITIONS AVAILABLE
Utilities Infrastructure Systems Manager
$97,430 - $150,802/yr.
Chief Utilities Treatment Plant Operator
$71,970 - $101,269/yr.
Utilities Treatment Plant Operator II
$62,171 - $87,479/yr.
Utilities Treatment Plant Trainee or Operator I
$53,705 - $86,314/yr.
Heavy Equipment Operator
$53,705 - $75,567/yr.
Utilities System Operator Trainee, I, II, or III
$44,184 - $75,567/yr.
Lift Station Operator II
$62,170 - $87,478/yr.
Lift Station Operator I
$53,705 - $75,567/yr.
Apply Online At: http://pompanobeachfl.gov Open until filled

Join the City of Plantation Utilities Team!
Now hiring for Utilities Engineer I
Utilities Inspector and Utilities Plant Mechanic I- Class C Make a difference in your community Apply today! WWW.Plantation.org
City of Melbourne
Wastewater Treatment Operator C, B, A or Trainee
Class C $51,369 – 84,198
Class B $53,541 – 87,848
Class A $55,811 – 91,663
Trainee $44,561 – 71,517
Learn more and apply online at www.melbourneflorida.org https://www.governmentjobs.com/careers/melbourneflorida
Immokalee Water & Sewer District Senior Project Engineer
The Immokalee Water & Sewer District is seeking an experienced engineering professional to provide technical leadership for the planning, design, construction, and operation of water and wastewater infrastructure projects. Strong project management, regulatory compliance, and utility engineering experience preferred. Apply at www.immokaleewatersewer.com/about-us/careers.
Immokalee Water & Sewer District Controller
The Immokalee Water & Sewer District is seeking an experienced financial leader to oversee accounting and financial operations, safeguard District assets, and support strategic financial decisionmaking. Strong accounting, budgeting, and financial management experience required. Apply at www.immokaleewatersewer.com/about-us/careers.
Senior Manager - Water Resources and Planning
This position is responsible for overseeing and managing the Authority’s Water Resources and Planning Department. Apply and view details at www.regionalwater.org
Wastewater Operators
The City of Wildwood, Florida (one of the fastest growing areas in Central Florida and contiguous to The Villages) is searching for Wastewater Operators. Starting salary range: $49,000 - $56,000 depending on license – 10% additional for dual. Please apply online at www.wildwood-fl.gov or contact Marc Correnti at mcorrenti@ wildwood-fl.gov
Project Engineer - Utilities
The City of Wildwood is searching for a licensed engineer to manage our municipal utility engineering projects, including, but not limited to water, wastewater, wastewater treatment, stormwater design, development review, and construction administration. Starting salary range: $117,350 - $129,000. Please apply online at www.wildwoodfl.gov or contact Marc Correnti at mcorrenti@wildwood-fl.gov
Okeechobee Utility Authority is Hiring for:
• Utility Director (Assistant Executive Director)
• Wastewater Treatment Plant Lead Operator
Go to: www.ouafl.com or email: hrmanager@ouafl.com
Classifieds continued on page 94
& Wastewater Positions
Technician I-II Apply Online Today! -www.davie-fl.gov
Full-time, Part-time or Temporary Work Opportunities!
Woodard & Curran supports utilities that need experienced water/ wastewater treatment operators and maintenance professionals throughout Florida and the rest of the country.
W&C wants to find you a job that works with your schedule! We even have short-term roles that let you mentor younger operators, stay engaged and make an impact – and only when it works for you… No commitment – travel covered – You decide when (or if) you say yes!
Interested in learning more about these opportunities or being added to our operator database? Please reach out to Lizzie Dovich or Brad Hayes 352-516-4397 to learn more! Ldovich@woodardcurran. com or 207-558-3906. https://www.woodardcurran.com/careers/
Continued from page 61
1. D) 25,000.
If the average daily flow from the area served is 100 gallons per person per day the number of people served is 25,000.
2. B) 28 sections.
The number of 5-foot sections to replace 140 feet of an 8-inch pipe is 28 sections.
3. C) 0.011 feet/feet.
The slope on an 8-inch, 400-footlong pipe with an upstream manhole invert elevation of 155.32 feet and a downstream manhole elevation of 150.90 feet is 0.011 feet/feet.
4. B) 937.5 feet.
The estimated actual distance between two manholes on a map that is measured as 15/16 of an inch with a scale where 1 inch equals 1000 feet is 937.5 feet.
5. A) 1.47 lbs.
The pounds of chemicals used to control roots at a concentration of 150 mg/l in 450 feet of an 8-inch sewer pipe is 1.47 lbs.
6. A) 125 cubic yards.
The cubic yards of asphalt concrete paving material required to pave over a trench 2,700 feet long and 5 feet wide with a 3-inch-deep patch is 125 cubic yards.
7. C) 20 loads.
The number of 5-cubic-yard dump truck loads of sand to fill a trench 3 feet wide, 9 feet deep, and 100 feet long is 20 loads.
8. C) 19.5 feet.
The width of a trench at the ground surface that is 3 feet wide at the bottom, 11 feet deep, and walls sloped at ¾-inch horizontal to 1-inch vertical is 19.5 feet.
9. B) 4 amp.
The
10. B) 82 percent.
The pump efficiency of a pump with a water horsepower (HP)
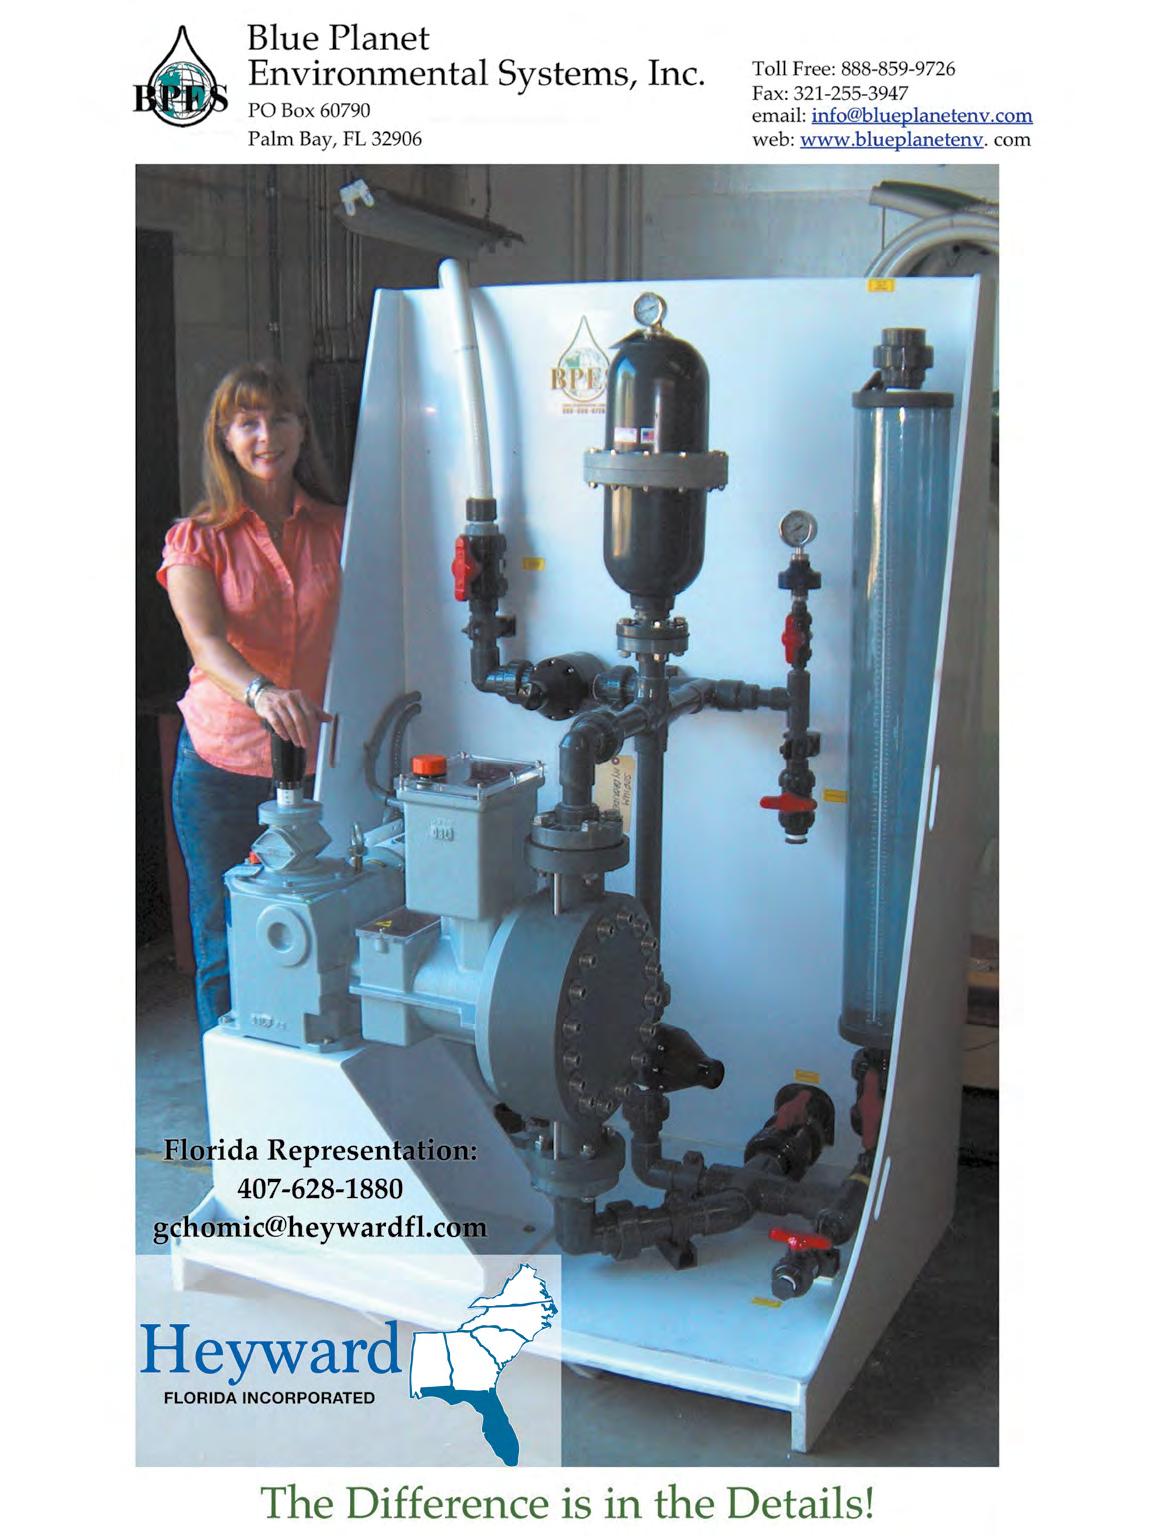
Trust Veolia to deliver the highest quality Ozonia* ozone technologies to meet even the most difficult treatment challenges.
Veolia has been pioneering world leading technologies and pushing the boundaries of the ozone industry for over 40 years.
Veolia is a leader with thousands of installations of Ozonia Ozone Systems, including some of the world’s largest ozone water treatment plants.
Visit our website for information on our full range of solutions.
*Trademark of Veolia; may be registered in one or more countries. ©2026 Veolia. All rights reserved.