11 minute read
Don’t Get Caught With Your Pumps Down: Using Analytics to Improve Pump Reliability and Performance

Mike Bernard
Much has been written about the potential for plugging pumps in both wastewater and raw water pumping applications. The prolific use of variable frequency drives on pumps offers both improved process control and the potential to reduce energy expenditures. Unfortunately, operating these pumps at reduced speeds is leading to do not provide much insight into their overall performance potential.
Advertisement
The Case for Closely Monitoring Pumps Using Advanced Analytics
Data analytics of individual pump performance provides a more-holistic approach that systems are operated, maintained, and even designed properly for the given service.
Simple illustrative dashboards convey live operating data and actionable alerts in the case of abnormal operation much more effectively than screens full of numbers. It’s perplexing that even today’s economy cars have simple dashboards (Figure 1) based on complex analytics that can calculate current fuel efficiency and whether it’s operating within the car’s performance envelope (tachometer), and yet today’s multimillion-dollar pumping stations don’t have anything similar to help operators make better decisions and take decisive action to prevent incidents like SSOs.

This no longer has to be the case.
Just like a car’s dashboard that summarizes important information into graphics, the proper use of analytics can summarize pump station operations into easily understood graphics that quickly convey actionable recommendations. It only takes a second to look at a car’s dashboard to tell whether the car is operating properly and water and wastewater operators shouldn’t have to spend any more time than that looking at their pump station “dashboards” to know if they are performing optimally.
In addition to simple dashboards, analytics platforms can include monthly summary report cards that allow managers to proactively plan for the refurbishment or replacement of worn equipment before that equipment leads to unplanned outages. Simple access to raw or analyzed data also allows engineers to design supplemental or replacement pumps to better fit the actual conditions of service and potentially identify changes in those conditions that may indicate issues with upstream or downstream piping.
In short, pump analytics empowers utility personnel to work together across disciplines to protect the environment, reduce energy expenditures, and extend the life of equipment.
Recognizing and Correcting Abnormal Pump Conditions
The City of Chattanooga (city) in Tennessee implemented an analytics platform on its Citico Pump Station in 2020. This combined sewage pumping station is the largest in the system and was scheduled for a major refurbishment of its pumps and electrical components. The city desired a comprehensive analysis of the pump sizing and current force main hydraulics to determine if changes should be made.
The analytics platform provided this information, but also indicated that there was a significant amount of deterioration of the impellers on two of the four pumps. This deterioration reduced the real firm capacity of the station from its design of 120 mil gal per day (mgd) to an actual capacity of 102 mgd. Additionally, the analytics platform indicated that plugging or ragging occurs in the pumps when operated at reduced speeds. While adversely impacting energy efficiency, this ragging also robs the station of capacity.
During extreme instances, individual pumps have lost as much as 50 percent of their capacity. This is significant as the station’s true firm capacity has been reduced to as low as 80 mgd during heavy inflow and infiltration events. Regaining this capacity is essential in the city’s efforts to reduce overflows and comply with its consent decree.
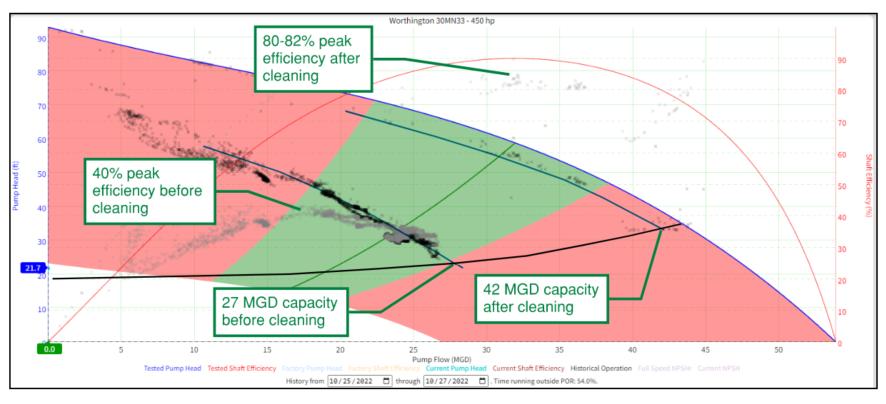
Fortunately, the analytics platform uncovered a positive and useful trend in pump performance connected to daily purging of the bubble level control system. During a purge, the signal from the bubbler indicates that the wet well is empty, so the programmable logic controller (PLC) either reduces pump speed to a minimum or turns off the pump. Five minutes later, the signal returns, indicating that the wet well level is too high. The PLC ramps the pump speed to 100 percent to pull the level back down before stabilizing several minutes later.


The periodic pump cycling is often enough to remove a majority of the foreign material from the impeller. This behavior is illustrated by data in Figure 2, which shows that the Pump 2 capacity increased by approximately 55 percent and the efficiency essentially doubled simply by cycling the pump during the bubbler purge.
The city is now evaluating automated pump cycling based upon a preset level of “lost capacity” provided by the analytics platform. Before a major rainfall event begins, operators can proactively check the real firm capacity of the station and perform any additional “cleaning cycles” on the pumps to assure that the station is performing to its potential.
How to Optimize for an Oversized Pumping System
Orange Water and Sewer Authority (OWASA) in Carrboro, N.C., implemented the same platform at the Rogerson Drive Pump Station, its largest regional wastewater pumping station, in early 2022. The initial finding from the analysis is that these pumps were operating too slowly almost 100 percent of the time.
Like most wastewater pumping stations, this one was designed to convey peak flows during heavy rainfall events; however, these events occur only 10 to 15 times per year. The unfortunate consequence of designing like this is that these pumps are operating outside of their preferred operating range (POR) almost all of the time.
Two things happen when pumps operate outside of their POR:
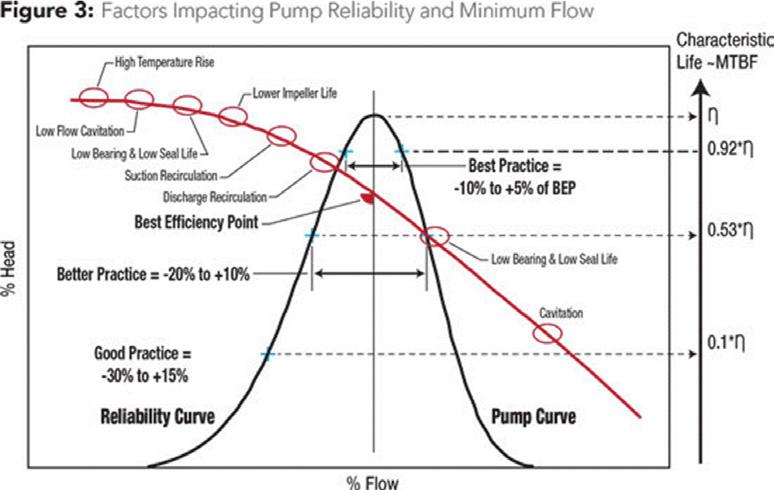
They waste energy. During low flow periods every night, these pumps consume 300 percent more energy per gal pumped than they would if they were in POR. This is indicated in Figures 3 and 4.
Wasted energy harms pumps. Conservation of energy dictates that this energy must go somewhere. In pumping systems, if it’s not going to pumping water, then it likely manifests as heat, damage, or noise. All of these are damaging for the pumps, which is why the Barringer-Nelson curve (Figure 5) indicates that operation of pumps outside of POR significantly reduces the life of these critical assets.
The insights provided by the analytics platform have provided OWASA the data and opportunity to evaluate two potential modifications to its system.
The first is to simply increase the minimum speed set point of the existing pumps from 45 hertz (Hz) to 50 Hz. This will move the operation of each pump into its POR, but it will also cause the station to revert to a fill-and-drain mode of operation.
Operations was concerned that this could lead to odor complaints along the force main and a slugging effect at the wastewater treatment plant, so the second alternative is to add a jockey pump at the station that will handle the lower nighttime flows. The addition of a smaller 100-horsepower (HP) pump could both reduce the overall energy expenditure at the facility, as well as extend the life of the 200-HP pumps, so that OWASA doesn’t get caught with its pumps down when it needs them.
Using Analytics to Predict Obstructions in Suction and/or Discharge Piping
Analytics can also identify issues in the piping to or from the pumping systems.
This was one of the most important benefits for a utility in Texas at one of its raw water pumping facilities. The facility experienced issues in both the suction and discharge piping systems. The barrel strainers on the suction side of the canned turbine pumps were blinding due to algae buildup, which starved the pumps and reduced output. The analytics platform provides a simple graphical indication to operators when this situation occurs so that operators can know to proactively clean the screens.
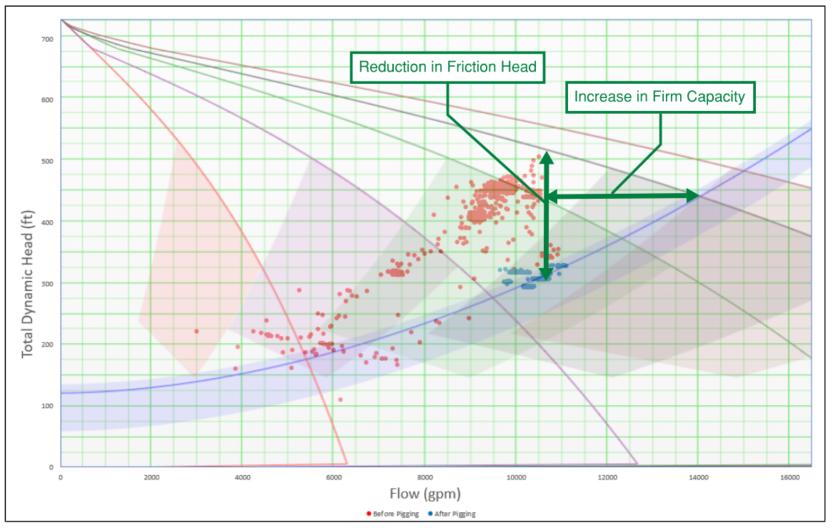
The discharge-side obstruction was more challenging to diagnose. The system hydraulics indicated that there was, at times, as much as 250 ft of additional head on the system that should not be there. This additional head, coupled with wear and tear on the pump impellers, increased the amount of electricity needed, while reducing the station’s potential output as much as 28 percent. Fortunately, the utility was able to reduce the head by running foam pigs through the 22 mi of 30-in. diameter main.
With the help of analytics, the system identified that the issue was caused by a combination of sediment and perched air bubbles in the piping due to faulty air release valves. Figure 6 illustrates the hydraulics before and after pigging. The data show that, after pigging, the current pump system hydraulics perfectly match the hydraulics from the original system design. The analytics package allows the utility to monitor the health of both the pumps and the piping systems and enables proactively scheduling maintenance activities to ensure that the utility has the capacity needed to make it through the hot summer months in Texas and keeps the systems operating optimally.
Summary
Almost every water and wastewater pumping system in the world today has some level of instrumentation that generates data. Unfortunately, most of these data are not being properly analyzed to give the operators, managers, and engineers who work with them the actionable insights they need to translate data into optimal system operation.
The application of a powerful analytics platform can provide these insights, reduce energy expenditures, extend the useful life of equipment, and protect the environment by reducing unplanned outages. All of this ensures that water and wastewater operators, managers, and engineers have the information they need to make sure that they don’t get caught with their pumps down.
This article first appeared in the spring 2023 issue of NC Currents, a publication of NC One Water (originally the North Carolina Section of the American Water Works Association and the North Carolina Member Association of the Water Environment Federation). S


Sedimentation has served as an effective method for water and wastewater treatment, but that doesn’t mean the technology can’t be upgraded. The Leopold Texler Lamella Clarifier from Xylem is a great example as its lamellae are made from a recyclable, durable, high-density polyethylene geotextile material that reduces service and maintenance requirements, while cutting solids by more than 80 percent.
The lamella plates typically found in clarifiers are made from heavy stainless steel, which require extensive support structures and significant capital investment. When exposed to sun, steel reflects ultraviolet rays and promotes algae growth in the clarifier, reducing the clarification performance and requiring regular, manual cleaning. The repellent and flexible nature of the geotextile prevents sludge accumulation on the lamella sheets, reducing the need for regular cleaning.
Lamella sheets are installed at an inclined 55-degree angle. Solids settle as the water travels upward between the lamella sheets and flows through trough covers featuring an integrated v-notch weir, resulting in even distribution of flow throughout the clarifier.
The inclined plate arrangement of the Texler system allows for an increase in the clarification area and higher surface overflow rates, reducing the required basin dimensions by up to 80 percent for new builds, or allowing more than a 100 percent increase in flow within existing sedimentation basins. The geotextile material has been proven in similar applications to last over 20 years. The width of the lamella sheets can be adapted to optimize the use of existing basins. As a result, water treatment capacity of existing rectangular clarification systems can be increased by up to 100 percent, with over 80 percent reduction in solids and turbidity values reaching levels less than 1 NTU. The solution’s modular design allows for easy maintenance, as each lamella sheet can be easily removed independently. The flexible design allows for cost-effective retrofitting of existing rectangular basins, significantly reducing the overall construction costs while significantly increasing flow capacity. (www.xylem.com)
The Flowrox FinFlex Check Valve from Valmet Flow Control helps prevent sewage overflow, malodors, and backflow of waterways. The cover and sleeve are designed to easily slip into the existing pipe and are affixed to a pipe with heavy-duty stainless steel expandable clamps.
They can be installed in either a vertical or horizontal application and have very low headloss and cracking pressures. This type of check valve uses a rubber flap that is molded internally to its thick rubber housing, which allows the valve to be completely closed until a small water column discharges via gravity through the valve. It also allows the runoff to occur until back pressure exceeds the inlet pressure.
The rubber flap is manufactured to reduce headloss across the valve when compared to other designs, such as a swing or ball check valve. When used for odor control, the valve will seal completely on itself, compared to the duckbill styles that rely on increased backpressures to seal the duckbill lips closed. The check valve ranges in size from 3 to 72 inches, with backpressures up to 50 feet. (www. valmet.com)
The MD3 Multi-Diaphragm Metering Pump from Blue-White Industries delivers smooth, continuous chemical feed, even when injecting chemicals that off-gas, like peracetic acid and sodium hypochlorite. The cutting-edge hyperdrive technology allows for alternating pumping action
Continued on page 46 between two diaphragms: when one diaphragm is in the suction phase the other is in the discharge, resulting in a smooth chemical feed profile and eliminating the chance of vapor lock and loss of prime. The diaphragms will last the life of the pump, eliminating the need for expensive rebuild kits. (www.blue-white.com)

The Microsystems GD-4000 Multi-Channel Gas Detector from Eagle Microsystems monitors and detects the hazardous gases often found in water and wastewater treatment environments. This high-performance detector is designed to provide accurate and reliable readings of gas concentrations, ensuring the safety of workers and the public. Featuring NEMA 4X enclosures, it’s built to withstand harsh environments and is resistant to dust, water, and extreme temperatures. Its user-friendly, color touch-screen interface and field-programmable alarms and settings make it easy to use. Calibration is accomplished through the same menu drive touch-screen interface. It has four 4-20 mA DC outputs and is capable of housing up to four precision sensors for common gases like chlorine and sulfur dioxide. Its sensor technology can detect gas concentrations as low as 0.1 ppm, ensuring maximum protection against potential leaks or other hazardous situations. (www.eaglemicrosystems.com)

Sherwin-Williams Protective & Marine recently launched its Water Tank Color Designer, an online tool for conceptualizing, visualizing, and optimizing water storage tank coating projects. It’s a comprehensive tool that engineers, contractors, and applicators can all use to accurately and creatively design water storage tank projects. The tool helps customers bring their visions to life and makes it easier to share designs for approval from everyone involved.
The tool presents an array of customizable options, including tank styles, paint colors, logos, icons, and fonts. Users can create multicolor designs with different colors for various areas of the tank, including the top, bottom, and legs. Users can also upload their own logo designs to help make their visualization as real as possible.
There are eight different tank styles provided: ground storage, standpipe, legged, spheroid, hydropillar, hydrotank, cone roof, and composite. There’s also access to any of the Sherwin-Williams

Color System 4000 Series industrial colors, as well as the most popular exterior tank colors. Users can also add in their own messaging and imagery. With the visualization tool, users can select the appropriate environment for showcasing their tank design, depending on whether the realworld project will stand against, for instance, a city skyline or a field. The virtual tank view is also fully rotatable for examination of the design from all angles. (www.swcoloryourtank.com)
The Duperon FlexRake IQ platform provides real-time smart screening for maximum resilience at the headworks. It tackles high peaking factors due to extreme weather and handles difficult debris like flushable wipes, first flushes, and settled solids. This is accomplished by system improvements and a sequence of operations that automatically respond in real time to optimize the screen field. The reimagined design focuses on smart enhancements to the raking device to manage heavy solids-loading events with four times the increased debris removal capacity, improved grit and rock handling and greater solids capture. (www.duperon.com) S


