Pathways to Decarbonize the PVC Value Chain in 2050
PRINCIPAL RESEARCHERS: KEY CONTRIBUTIONS FROM:
September 2022
Dr. Ronald Whitfield Dr. Francis Brown Dr. David M. Hart WITH
BU Institute for Global Sustainability Center for Houston’s Future ITIF
Preface
The Pathways to Decarbonize the PVC Chain in 2050 report aims to inform political, business, and societal leaders how an important segment of the petrochemical industry can achieve near net-zero carbon dioxide emissions by 2050. This study demonstrates that achieving this goal for this microcosm bodes well as a model for achieving near net-zero emissions for broader segments of the industry. The high-resolution approach taken here highlights the complexity of the industry and the need for policies that can accommodate yet incentivize a heterogeneous value chain. We provide granular guidance on what getting close to net-zero really requires and on the actions needed to translate carbon reduction targets into tangible progress. The work examines a range of distinct technological pathways and policy options to achieve the 2050 goal and estimates the capital requirements and operating costs of these pathways. Since cost estimating is a combination of both “art” and “science” and involves uncertainties, the analysis is presented in two ways: most-likely cases and stretch-goal cases. We are agnostic as to which pathway is “best”, and the final pathway will no doubt differ from the ones we present. Furthermore, research on novel technologies that could impact this analysis is ongoing, and breakthroughs are always possible. Our goal is to provide confidence that this segment of the petrochemical industry has multiple genuine paths to achieve a significant reduction in carbon dioxide emissions by 2050. Policies to accelerate the deployment at scale of these technologies should be debated and implemented to achieve this goal.
Please cite this report as: Whitfield, R.; Brown, F.; and Hart, D.M., Pathways to Decarbonize the PVC Value Chain in 2050, Center for Science and Energy Policy, George Mason University, 2022.
WHITFIELD ET AL., PATHWAYS TO DECARBONIZE THE PVC VALUE
CHAIN(2022) 2
Acknowledgments
The research team, in addition to the listed authors, included Stefan Koester (ITIF), Rowena Low (Whitfield Associates), Ryan Murphy (Boston University), and Chad Smith (George Mason University). Brett Perlman, CEO of the Center for Houston’s Future, was an integral part of the project’s planning and execution and led creation of its industry advisory network. Peter Fox-Penner and Henry Kelly initiated and contributed to the Weeffort.had
many informative discussions with individuals in the United States and Europe from petrochemical and energy companies, national labs, engineering and construction companies, research organizations, industry trade organizations, consulting companies, and universities. We thank those individuals for their time and interest. We also thank the stakeholders who attended briefings where we presented preliminary results. The feedback received from those briefings helped shape the contents of this report.
Of course, any errors or omissions in this study are our responsibility alone, as are any views or recommendations expressed herein.
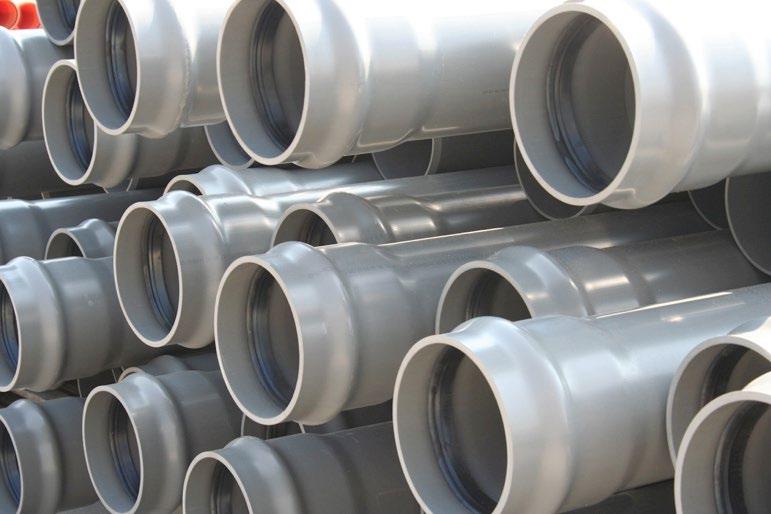
For primary funding support, we thank Breakthrough Energy and the Cynthia and George Mitchell Foundation, along with supplemental assistance from the Spitzer Trust, Sloan Foundation, and the Information Technology and Innovation Foundation. The image on our title slide is available from Стрелец Игорь via a Creative Commons license.
WHITFIELD ET AL., PATHWAYS TO DECARBONIZE THE PVC VALUE
CHAIN(2022) 3
Table of Contents
• Preface and acknowledgements
• Executive summary
• Decarbonizing the chemical industry: An analytical challenge
• Case selection: Decarbonizing PVC production in the United States
• Technology options and choices
• Methodology: Value-chain-based, bottom-up
• Baseline: PVC production in 2020
• Business as usual through 2050: Emissions without abatement policy
• Analytical framework for decarbonization pathway construction
• CCS decarbonization pathways
• Hydrogen decarbonization pathways
• Comparing pathways
• The “green premium”: Estimating the end-user cost of decarbonized PVC
• Insights for chemical industry decarbonization policy
• Opportunities for future AL., PATHWAYS TO DECARBONIZE THE PVC VALUE
researchWHITFIELD ET
CHAIN (2022) 4
Appendices and Forthcoming Companion Work Appendices:1.Sources of data and information 2. Supplementary data tables 3. Industry structure and technology for polyvinyl chloride production 4. Cost estimating methodology and assumptions 5. A simplified discounted cash flow model to explore the impacts of cost on the pace of implementation of abatement technologies 6. Public policy insights 7. Technologies under development could alter the structure of the PVC value chain Companion work: Henry C. Kelly, “New Technology Options for Petrochemical Production” (expected, October 2022).WHITFIELD ET AL., PATHWAYS TO DECARBONIZE THE PVC VALUE CHAIN (2022) 5
Executive Summary
• The PVC value chain, a major segment of the petrochemical industry (which is, in turn, a major source of greenhouse gas emissions) may be able to achieve 80%-90% reduction in CO2 emissions by 2050 in the United States using technologies approaching maturity today at a modest incremental cost.
• The industry average incremental cost – the “green premium” – for low-carbon PVC resin that would be made in the United States in 2050 in our decarbonization scenarios ranges from about 5% to 15% of this product’s price in 2020.
• This incremental cost estimate does not include the cost of the infrastructure to transport and dispose of captured CO2 or to distribute hydrogen, the two main solutions that we studied.
• The CO2 abatement estimate does not include emissions from feedstock production and transportation to the plant or from product fabrication, use, or disposal.
• Higher levels of abatement could be achieved if the electric power grid were decarbonized more quickly than currently projected by official forecasts.
• Many other uncertainties could also affect achievement of the modeled outcomes such as delayed infrastructure development, insufficient supply chain resources for project execution, site-specific constraints on technology options, and inadequate public policies.
• Our estimates draw on a bottom-up model of the PVC value chain, which represents every plant that contributes to U.S. PVC production today. These plants are very heterogeneous. The model assumes continued growth of the PVC market and replacement or upgrading of plants at the end of their useful lifetimes.
• We screened many technological options and explore two major decarbonization pathways in detail: carbon capture and sequestration (CCS) and hydrogen fuel. For each pathway, we study representative policies of varying stringency as well as game-changing technological innovations.WHITFIELD
ET AL., PATHWAYS TO DECARBONIZE THE PVC VALUE CHAIN (2022) 6
Executive Summary—Continued
• We draw on data from published research as well as confidential interviews to create a baseline model of costs and emissions for each plant in 2020 and update the model at ten-year intervals to 2050.
• We allocate costs and emissions from intermediate stages of production within and outside the PVC value chain. While we focus here on allocations within the chain, PVC production cannot be decarbonized without substantial costs and emissions allocated outside the chain, due to the integrated nature of the production processes.
• Technology adoption choices in the model are made at the plant level, based on plant-specific economic and industrial conditions as well as the policy and technology assumptions built into each scenario.
• CCS is a capital-intensive technology with relatively low operating costs, and economies of scale favor its application by large plants. Very stringent policies or breakthroughs that reduce the capital costs of CCS drive substantial abatement in our models by 2030 if supporting infrastructure is in place and by 2040 with more realistic assumptions.
• Decarbonization using hydrogen fuel is less capital intensive than CCS, and the cost of hydrogen is sensitive to the cost of natural gas and the scale of production. Very stringent policies or very low-cost hydrogen drive substantial abatement in our models by 2040 if supporting infrastructure is in place and by 2050 with more realistic assumptions.
• Technological breakthroughs could accelerate emissions reductions. For instance, electrified ethylene crackers could become an attractive strategy if their capital costs were reduced and low-cost decarbonized power became available.
• Policy interventions will be required to realize any of the decarbonization pathways. Demonstration projects and infrastructure development are particularly important in the near-term. Incentives for early adoption, public procurement, carbon pricing or air pollution regulation, and trade policies are vital over the longer-term.
• Other petrochemical industry value chains should be studied using bottom-up approaches and could incorporate modular components of steps along the chain that we have developed.
WHITFIELD ET AL., PATHWAYS TO DECARBONIZE THE PVC VALUE CHAIN (2022) 7

Decarbonizing the Chemical Industry An Analytical Challenge

Industry accounts for 29% of U.S. CO2 emissions Five emissionsofsectorsenergy-intensiveaccountfor70%industrialCO2 Chemicals and plastics account for 21% and refining accounts for 18% of industrial CO2 emissions Source: AEO (2020) U.S. CO2 Emissions 9 ResidentialTransportation1,86837%90018%Commercial79216% Non246Mfg5%Unaccounted1303%Refining2595%Chemicals & Plastics 3036% Iron & 111Steel2%Food Cement2%Products76381% All Other Mfg 2705%Industrial143329% Million t* CO2 *In this report, tons (t) refer to metric tons.
The Chemical Industry’s Economic Importance to the United States

ProfileIndustry SignificanceEconomic ChallengesAbatement


The chemical industry is one of the largest manufacturing industries in the US.
It is an immensely complex and capital-and-energy intensive sector of the economy.
The industry converts simple molecular structures into more complicated structures on a massive scale
It employs more than 540,000 workers whose average pay is 25% higher than the average US manufacturing wage.
It produces thousands of diverse products, unlike more homogeneous energy-intensive industries like iron and steel and cement.
The industry is globally competitive and accounts for nearly 10% of US goods exports.
This sector’s output is projected to continue to grow to 2050.
It will face significant challenges in meeting a near net zero carbon emissions goal over this period.
It will need substantial investment in abatement technologies, a potential reconfiguration of manufacturing activity, and investment in infrastructure.
Bringing about emissions reduction on this scale will be an enormous undertaking for both the manufacturing sector and the entire energy system.
WHITFIELD ET AL., PATHWAYS TO DECARBONIZE THE PVC VALUE CHAIN (2022) 10
The Analytical Challenge
• The industry’s inherent complexity would make a techno-economic analysis of the entire industry an unmanageably large task. The industry operates with a high degree of integration, with intermediate materials and energy passing from one operation to another, making it difficult to evaluate the performance of individual units.
• The industry uses science and technology to transform raw materials into the myriad of products that we use every day. These transformations utilize one or more of seven major petrochemical building blocks (syngas, ethylene, propylene, C4 olefins, benzene, toluene, and xylenes) to create intermediate chemicals and ultimately final products such as plastics, synthetic fibers, and elastomers.
• We have selected a portion of the industry that can be analyzed with sufficient accuracy and with a reasonable level of effort to provide more broadly applicable insights into possible decarbonization pathways.
WHITFIELD ET AL., PATHWAYS TO DECARBONIZE THE PVC VALUE CHAIN (2022) 11
This Report Addresses Five Major Questions
1. Known technologies
Although R&D on new technologies is ongoing, can technologies approaching maturity today achieve the 2050 goal?
2.
How do volatile energy prices affect the trajectory of abatement strategies?
3. options
What policy options can accelerate the adoption of abatement technologies?
4.
Will the
5.
How will the
Price volatility
Policy
“Green premium”
costs to implement abatement policies be prohibitive?
Sensitivity testing
differences in capital costs, prices, and grid decarbonization affect
outcome? WHITFIELD ET AL., PATHWAYS TO DECARBONIZE THE PVC VALUE CHAIN (2022) 12
Case DecarbonizingSelectionPVCProduction in the United States
Selection Criteria: Value Chain Case Study
Our approach:
Choose a major petrochemical value chain that is highly energy intensive and a major source of emissions with the following characteristics:
1. The physical volume of production of the value chain should be large and represent a significant dollar value of sales.
2. The value chain should employ a sizable workforce.
3. The value chain should primarily produce long lasting products.
4. The market for the products of the value chain should be globally competitive.
If successful, the results of this research could be extended to other major chemical value chains.
WHITFIELD ET AL., PATHWAYS TO DECARBONIZE THE PVC VALUE
CHAIN(2022) 14

























Large Volume US Petrochemical Value Chains WHITFIELD ET AL., PATHWAYS TO DECARBONIZE THE PVC VALUE CHAIN (2022) 15 Source: American Chemistry Council, 2020 production volumes HydrocarbonEthyleneCrackerFeedstock PVC Benzene consumerPackaging,insulationPackaging,goods,nonwovensPolypropylenePropyleneEthylene Packaging, film, bottlesPolyethyleneEthyleneGlycol PET bottles, antiModeratefreeze%single use High % single use High % single use High % single use 24.3 Mt 6.9 Mt 2.0 Mt 7.8 Mt 2.3 PolystyreneMt Pipe, siding, electricaldecking, High % Durable Goods
16
Case Selection: US PVC Industry in Global Context
• The United States accounts for about 15% of global consumption of PVC.
• Northeast Asia—composed of China, Japan, and South Korea—is a much larger source of demand and accounts for up to 50% of consumption.
• Note: The picture becomes more complicated when the large volume of trade in intermediates and products made from PVC is considered.
WHITFIELD ET AL., PATHWAYS TO DECARBONIZE THE PVC VALUE CHAIN (2022) 18
Case Selection: US PVC Industry Structure
• PVC resin production in the United States is highly concentrated. It is dominated by four major producers that represent 99% of capacity domestically. All four operate globally as well.
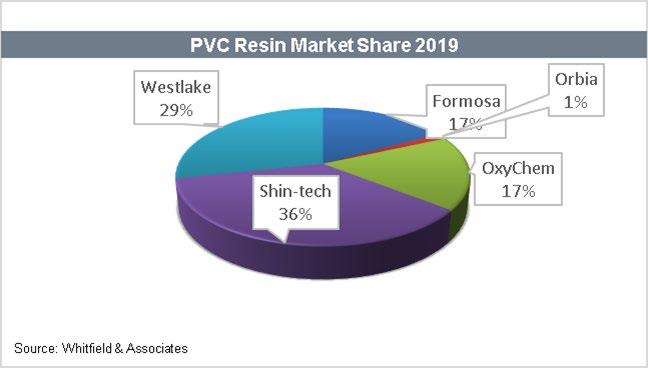
• The four major producers are backward integrated into the production of intermediate chemicals. All four produce ethylene or have equity stakes in ethylene crackers. Many operate integrated combined heat and power (CHP) plants at their sites as well.
• One firm, Olin Corp, is a major supplier of chlorine, EDC, and VCM to the chain, but does not produce PVC resin. As we have defined it, the PVC chain is short in ethylene, which must be purchased from the merchant market, and long in chlorine, which is sold for other enduses, such as water treatment and silicon production.
• Appendix 3 provides a more detailed discussion of the industry’s structure.
WHITFIELD ET AL., PATHWAYS TO DECARBONIZE THE PVC VALUE CHAIN (2022) 19
Case Selection: Geography of the US PVC Value Chain
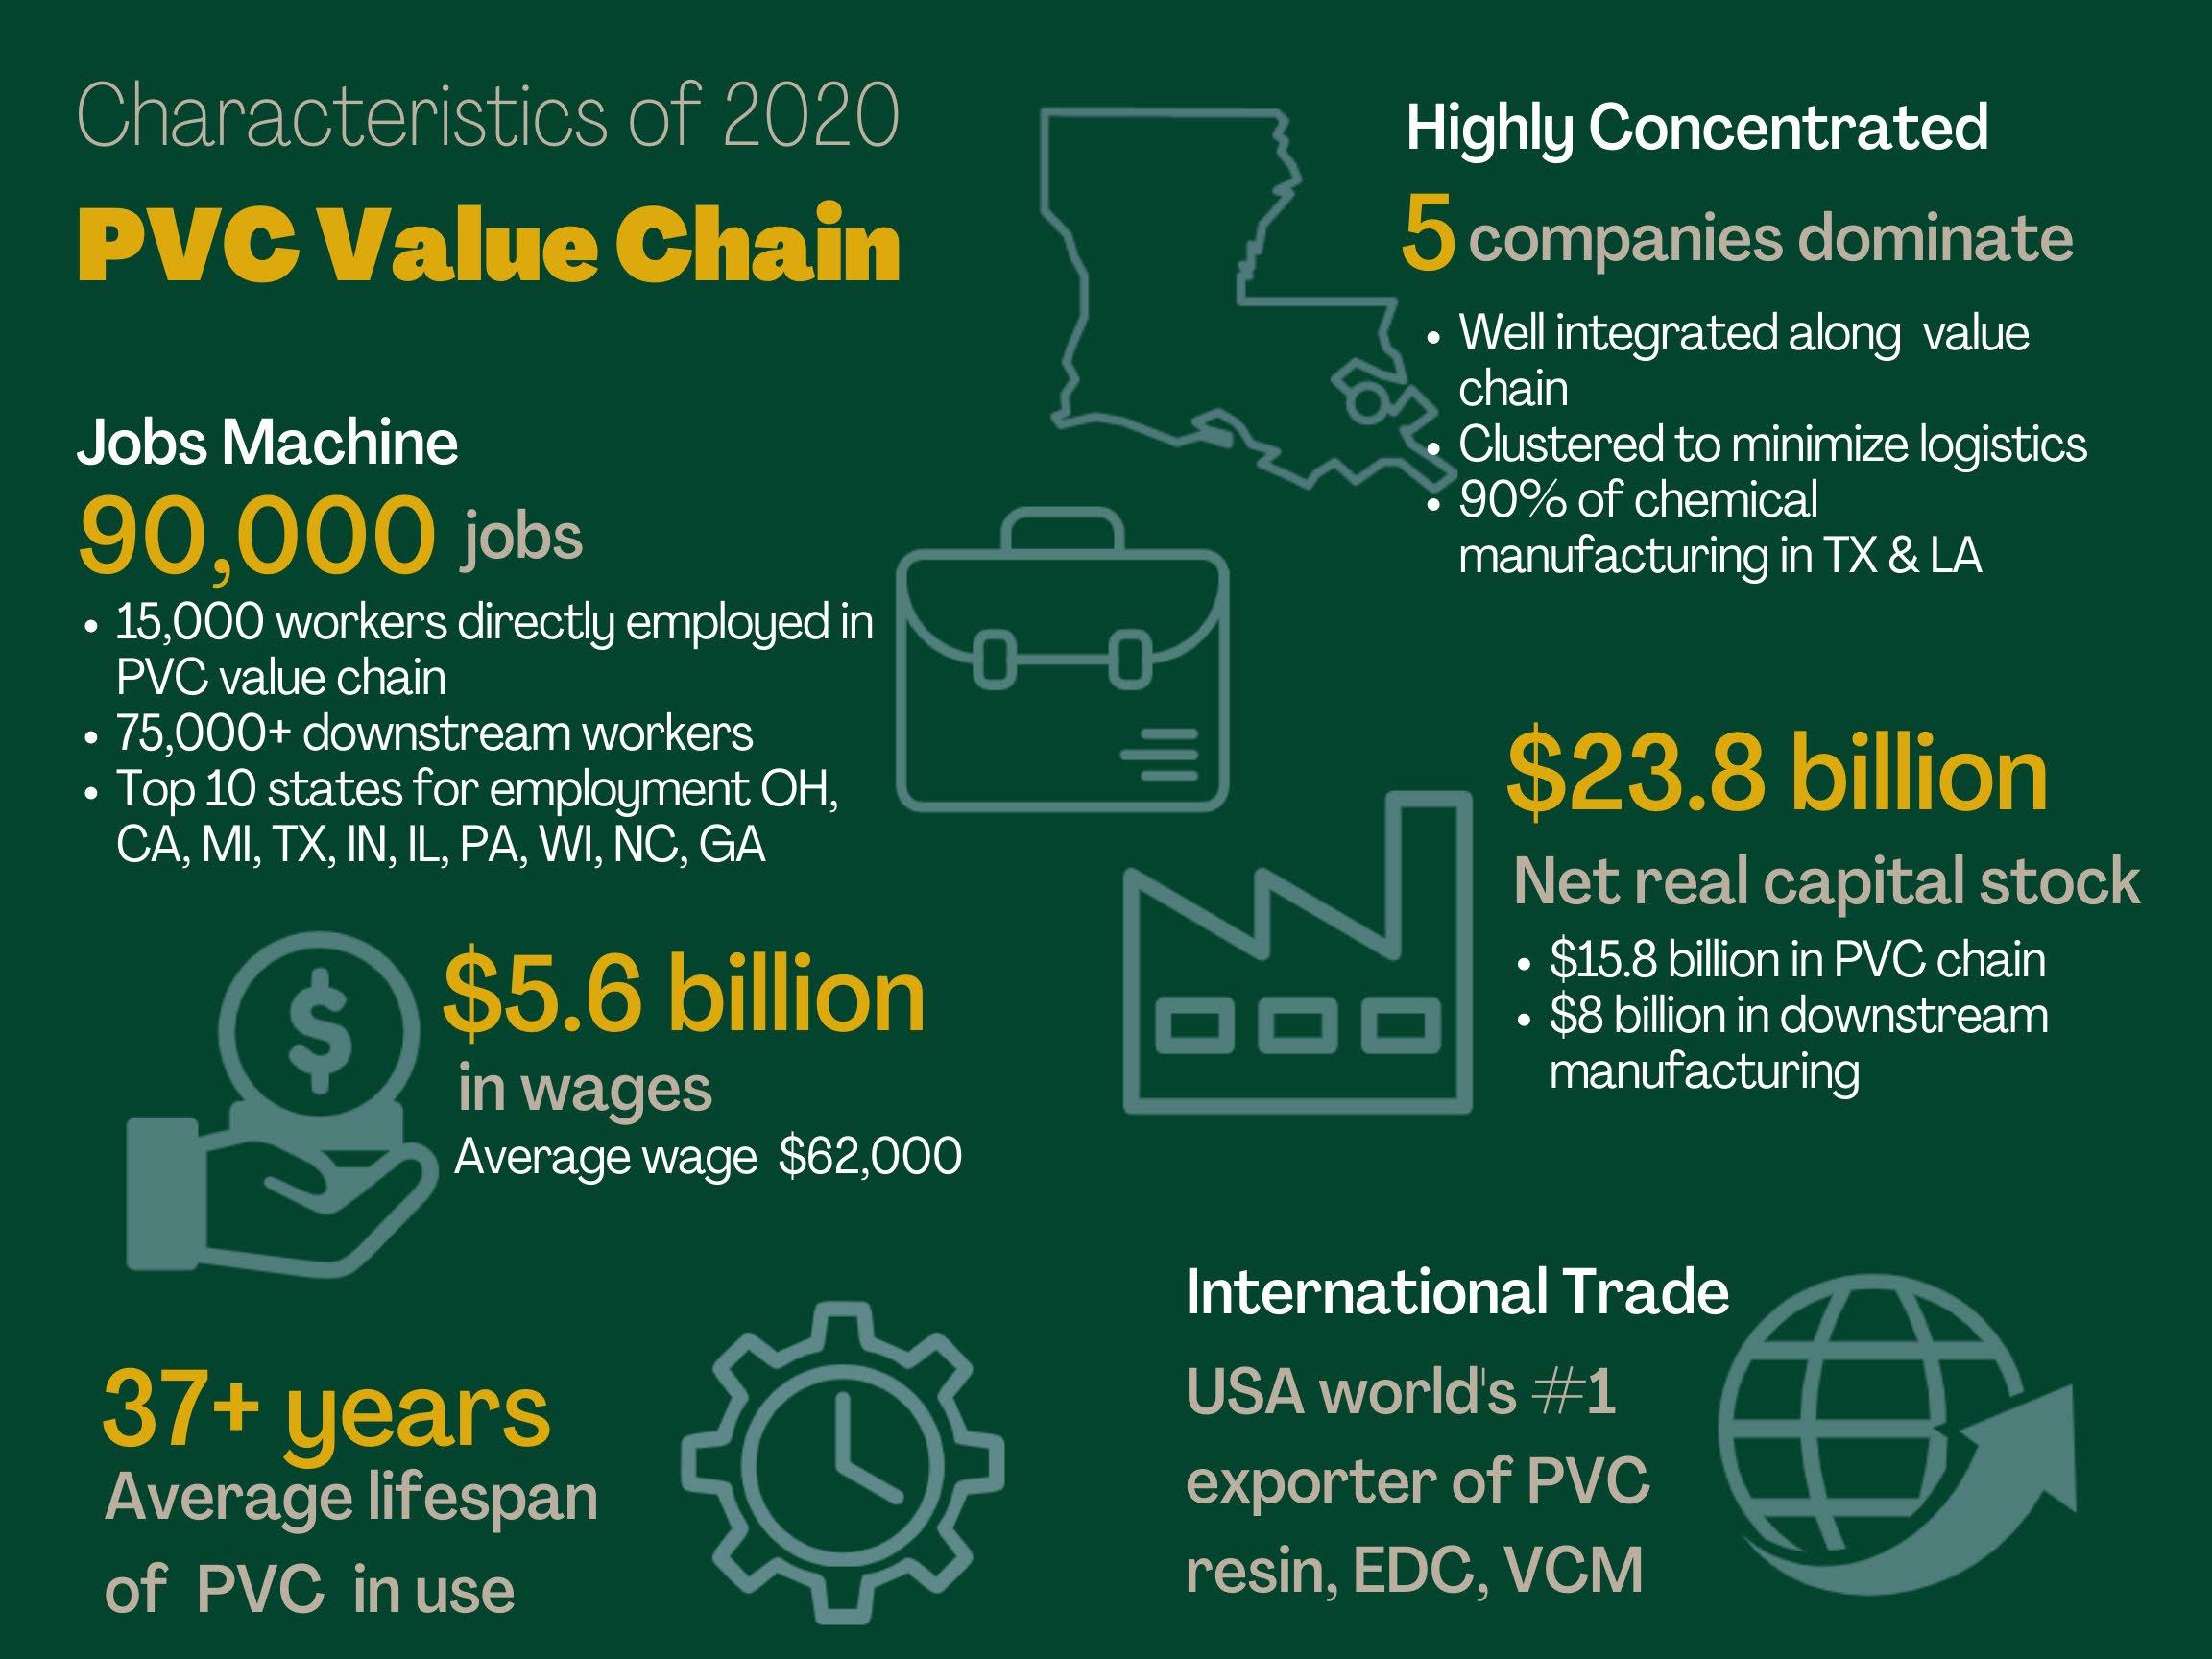
• The bulk of the US PVC value chain is located along the US Gulf Coast in Louisiana and Texas.
• This location offers many strategic advantages for the PVC value chain: lowcost feedstocks, inexpensive power, welldeveloped infrastructure and codependencies, extensive pipeline network, skilled labor, and access to water-borne
• The majority of the value chain’s domestic customers are in the upper Midwest (OH, MI, IN,IL, WI) and California, but they are also scattered through nearly every state.
export markets
WHITFIELD ET AL., PATHWAYS TO DECARBONIZE THE PVC VALUE CHAIN (2022) 20 43%TX 39%LA Other18% PVC Capacity (8,180 kt)
Decarbonizing PVC Production in the US: A Useful Case Study
Project focus:
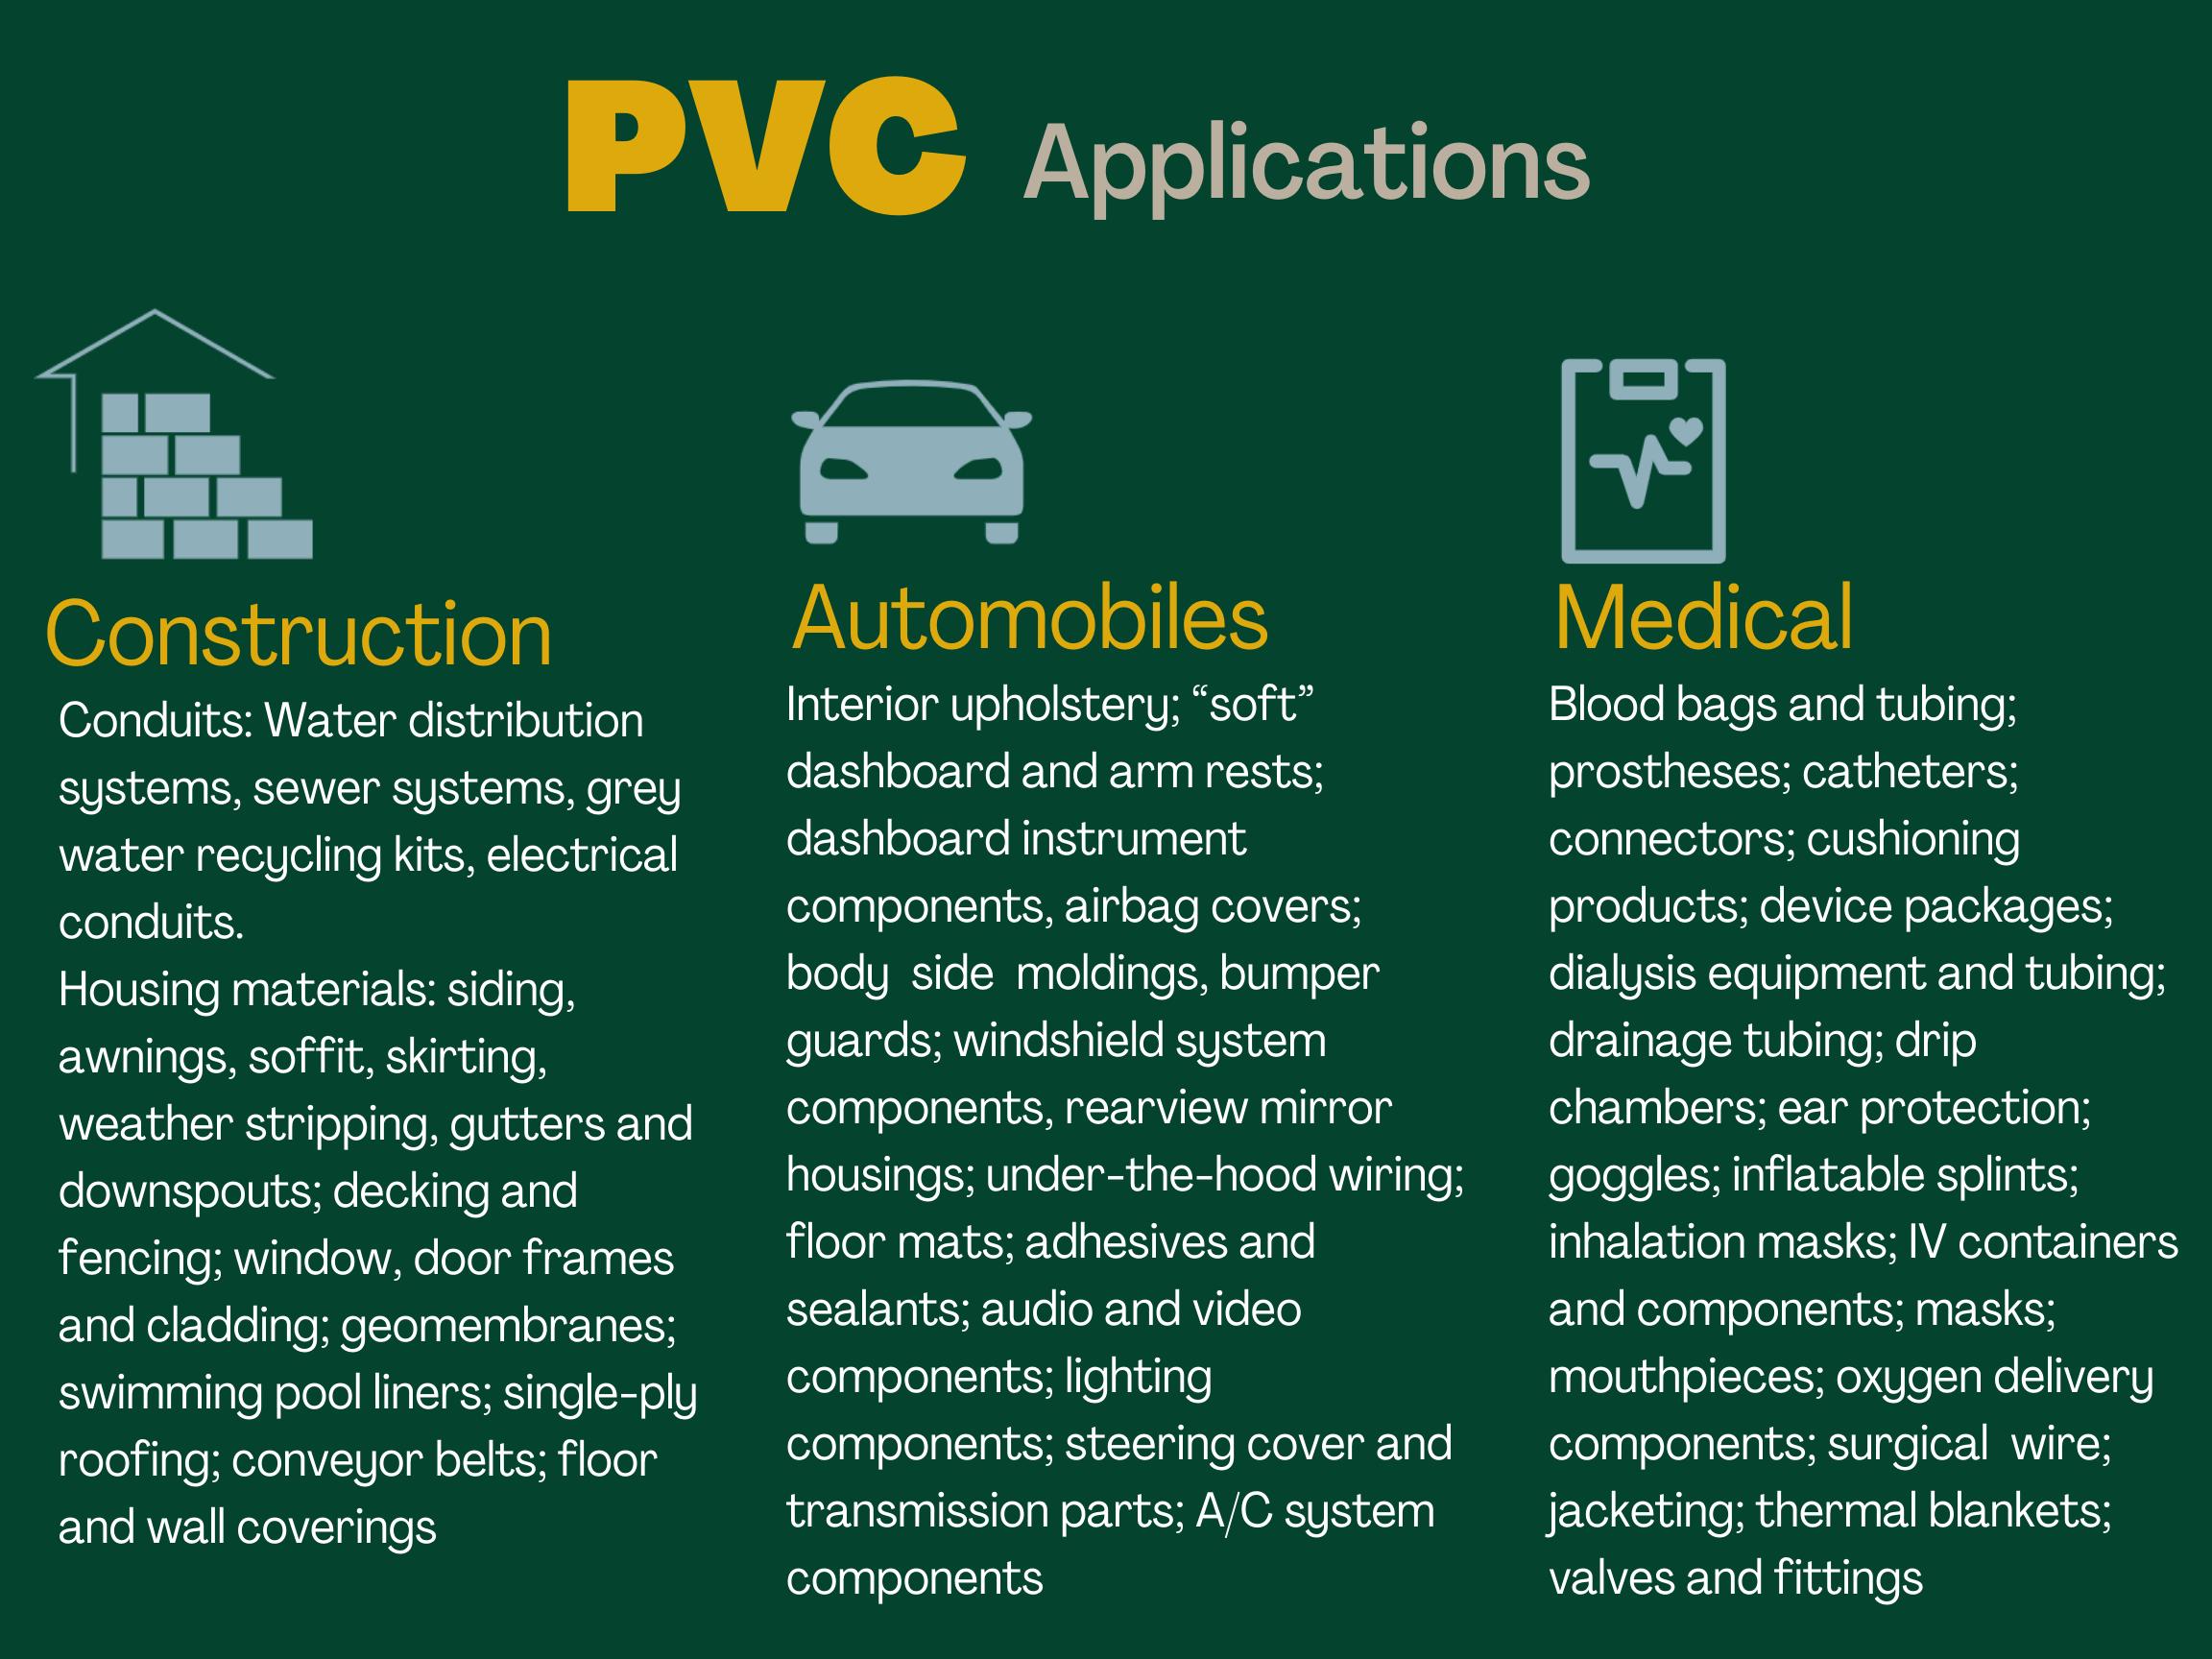
1. PVC is the third largest plastics market. Only polyethylene and polypropylene are larger.
2. It has significant production levels, employs a sizeable workforce, and has an extensive diversity of fabricated final products.
3. The value chain is built upon carbon-and-energy intensive chemical building blocks.
4. Of all the leading plastics, PVC products are the most durable and long lasting – 70% is used in building and construction markets. PVC products represent only a small fraction of plastics in the waste stream.
5. The US is arguably the lowest cost producer of PVC value chain products in the world
WHITFIELD ET AL., PATHWAYS TO DECARBONIZE THE PVC VALUE
CHAIN (2022) 21
Technology and Choices
Options
The PVC Value Chain Today: A Schematic View
EthyleneChlorine EDC
CHP combined heat and power EDC ethylene dichloride VCM vinyl chloride monomer






• Combined heat and power plants (CHP) provide power & steam to the sites
• Chlorine and ethylene are basic chemicals with many other uses
• EDC and VCM have no other significant uses other than PVC
• PVC resin is the base polymer for fabrication into final products
CHP
ResinPVCVCM
–
–
–
WHITFIELD ET AL., PATHWAYS TO DECARBONIZE THE PVC VALUE CHAIN (2022) 23
The PVC Value Chain Today: CO2 Emission Sources CHP EthyleneChlorine ResinPVCVCMEDC Major sources of CO2 emissions Other sources of CO2 emissionsCHP–combined heat and power EDC – ethylene dichloride VCM – vinyl chloride monomer WHITFIELD ET AL., PATHWAYS TO DECARBONIZE THE PVC VALUE CHAIN (2022) 24
Elements of the PVC Chain Today
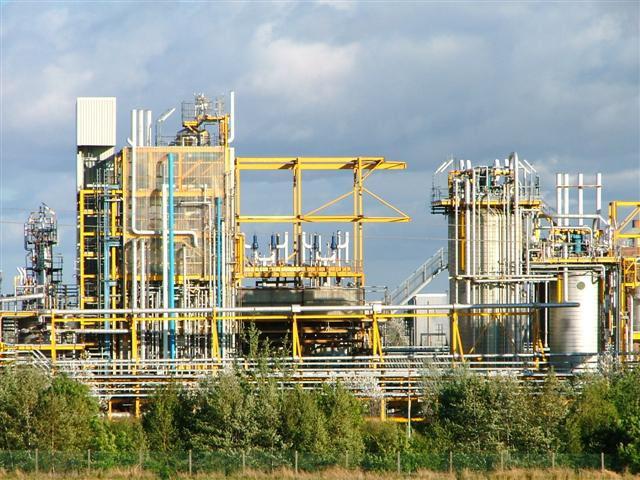
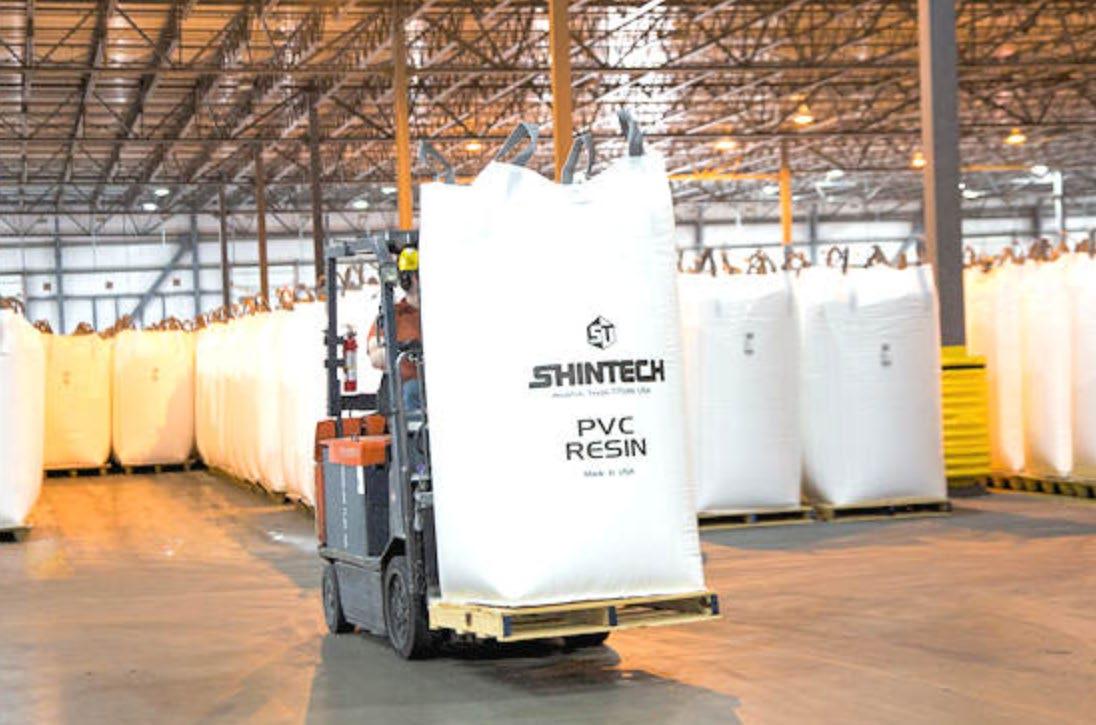
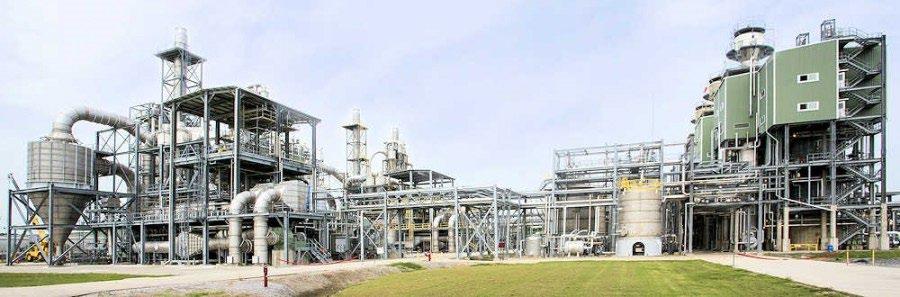
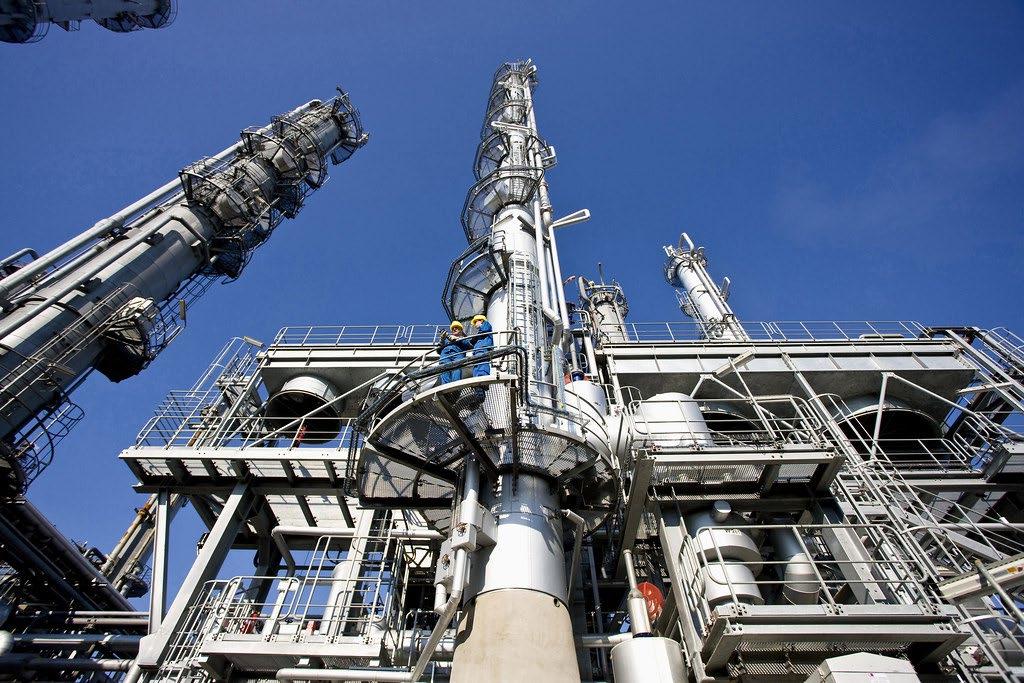 Shintech PVC plant in Louisiana Credit: Shintech
Steam cracking facility for ethylene production. Credit: BASF Hydro Polymers PVC plant in Norway. Credit: Mick Garratt
Shintech PVC plant in Louisiana Credit: Shintech
Steam cracking facility for ethylene production. Credit: BASF Hydro Polymers PVC plant in Norway. Credit: Mick Garratt
25
Options for Decarbonization: Carbon Capture and Sequestration
• Carbon capture and sequestration (CCS) systems isolate CO2 from other gases vented from production and power systems, compress it, and transport it to an underground site where it is sequestered permanently.
• Alternatively, the captured CO2 may be used for a variety of purposes.
• CCS systems are currently installed at ethanol, oil and gas refineries, and natural gas and coal fired power plants around the world.
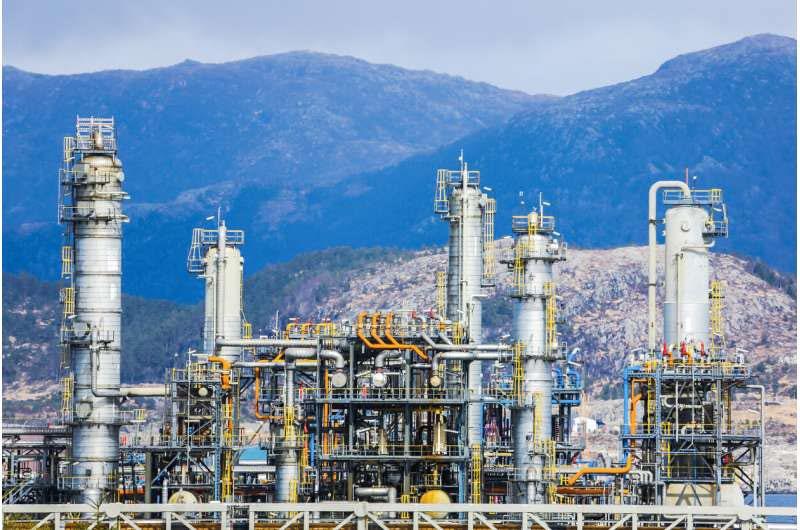
• The technology could be applied to CHP, ethylene, and other elements of the PVC chain.
• Dow Chemical announced in October 2021 that it will build a CCS system on the fuel reforming unit at an ethylene cracker in Fort Saskatchewan,
Credit: Mariusl, iStock
Carbon capture test facility at Norway’s Mongstad oil and gas refinery.
CanadaTechnology
WHITFIELD ET AL., PATHWAYS TO DECARBONIZE THE PVC VALUE CHAIN (2022) 26
Technology Options for Decarbonization: Hydrogen-Fueled Combustion
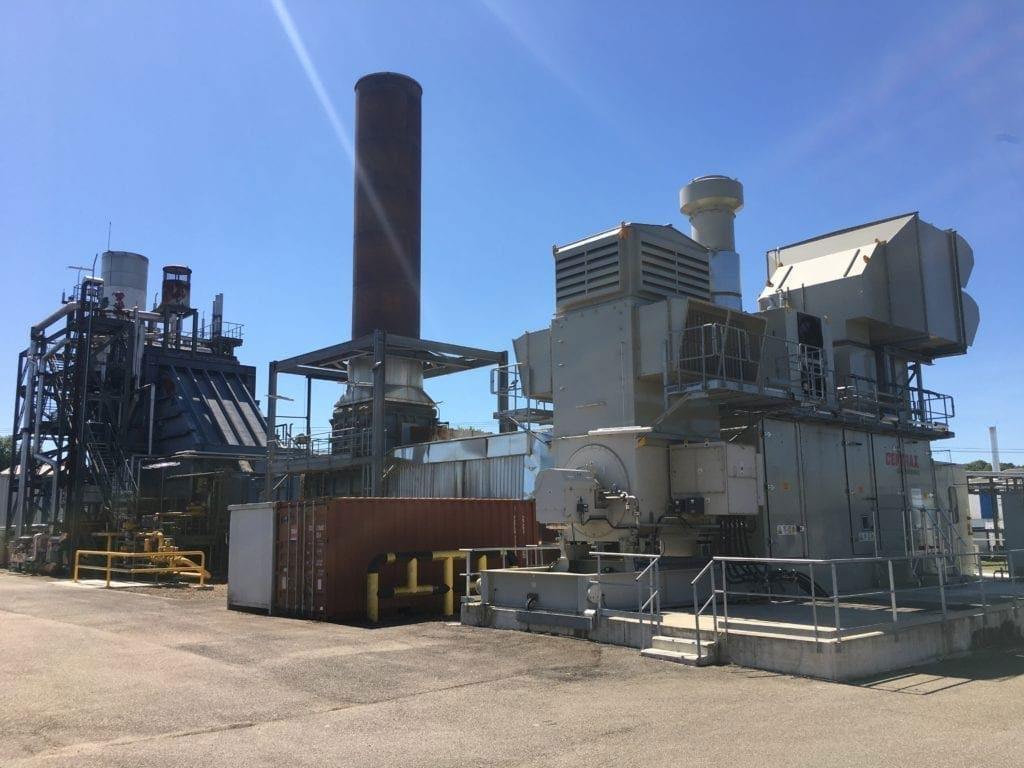
• Hydrogen (H2) can substitute for natural gas (methane) in new gas turbines, including those in CHP systems, as well as furnaces that provide heat to PVC chain production sites.
• Turbines capable of burning 100% H2 as well as those that can use ~20-30% H2 blended with natural gas are on the market.
• The former have capacities up to about 150 MW range, which could become enabling components of H2-CHP systems.
12MW H2-CHP Unit at a pulp & paper site in France, Credit: Engie
WHITFIELD ET AL., PATHWAYS TO DECARBONIZE THE PVC VALUE CHAIN (2022)
27
Technology Options for Decarbonization: Ethanol to Ethylene by Dehydration
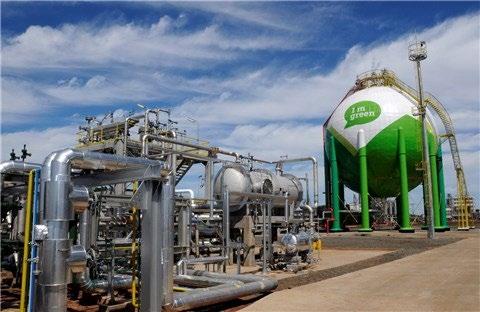
• Conversion of ethanol to ethylene by dehydration would eliminate the need for crackers in the chain.
• It is a multi-step, catalytic process that operates under relatively moderate conditions and has high yields and conversions.
• It is currently being practiced in Brazil with sugar cane as a feedstock and without abatement of CO2 emissions
• The process can operate efficiently at much smaller scales than can conventional crackers but doing so would require an overhaul of the existing PVC chain.
• Appendix 7 contains a more detailed discussion of this technology. Braskem plant for thermoplastic resin from sugarcane ethanol. Credit: Braskem
WHITFIELD ET AL., PATHWAYS TO DECARBONIZE THE PVC VALUE
CHAIN (2022) 28
Technology Options for Decarbonization: Electrification
• Electricity might be substituted for combustion to provide heat to crackers in the PVC chain and replace fossil fuels as a primary source of energy.
• Work is ongoing to create such “e-crackers” in several countries, but the concept has not yet been demonstrated, although plans for smallscale pilot testing are being developed.
• Generating the high-temperature heat required to run crackers with electricity at a reasonable cost is very challenging.
• A decarbonized grid and very low-cost power would be required to incentivize the development of this technology.
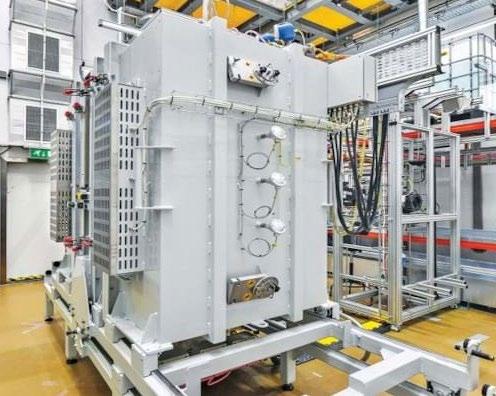
• Appendix 7 contains a more detailed discussion of this technology. Dow and Shell's 'e-cracker' experimental unit, Amsterdam. Credit: Shell AL., THE PVC
WHITFIELD ET
PATHWAYS TO DECARBONIZE
VALUE CHAIN (2022) 29
Technology Options for Decarbonization: Electrochemical Production of EDC
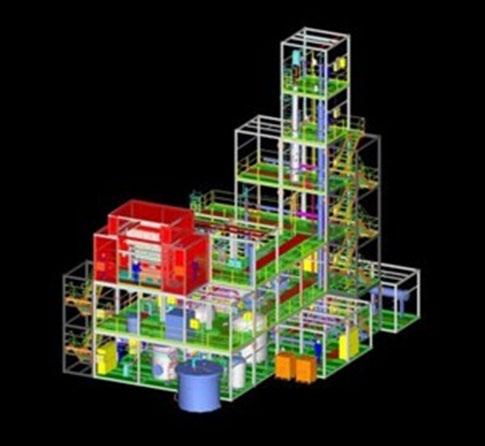
• A copper-based electrochemical process can produce ethylene dichloride, thereby eliminating the need for chlor-alkali plants and direct chlorination EDC plants in the chain.
• A combination of electrochemical chloride production technology with relatively small-scale ethylene production, as from ethanol to ethylene, might be employed to produce EDC outside of the large-scale, existing USGC locations.
• Implementation at large demonstration scale by 2030 is possible, but a special situation is required to complete the VCM/PVC chain without creating a problem of disposal of excess HCl.
• Appendix 7 contains a more detailed discussion of this technology. planned demonstration plant. Credit: Chemetry
WHITFIELD ET AL., PATHWAYS TO DECARBONIZE THE PVC VALUE
Chemetry’s
CHAIN (2022) 30
Technology Options for Decarbonization:
Plasma-Based Production of VCM
• Producing acetylene from natural gas or NGLs by a plasma-based process and reacting it with hydrogen chloride to produce VCM, would eliminate the need for crackers, chlor-alkali plants, and EDC production in the chain.
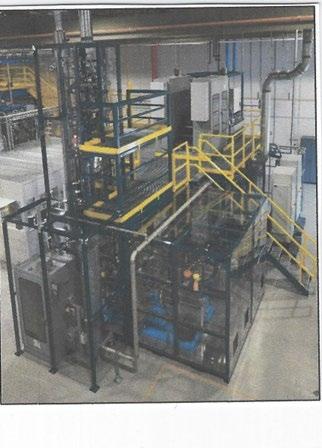
• This approach could lead to economic VCM/PVC production at small, decentralized locations, assuming HCl is available and markets exist for the byproduct H2. Implementation at a large (for this technology) demonstration scale may be possible by 2030, but a special situation is required since HCl must be available to produce VCM.
• Appendix 7 contains a more detailed discussion of this technology.
Plasma-based demonstration plant
Credit: Transform Materials PVC
WHITFIELD ET AL., PATHWAYS TO DECARBONIZE THE
VALUE CHAIN (2022) 31
Technology Options for Decarbonization: Other Potential Game Changers
• the long-term the right policy economic
•
•
•
• Biologically-sourced
• Catalytic
•
•
•
•
•
• in a companion paper to this report, which will include a discussion of technical and economic obstacles, environmental challenges, opportunities for smallscale production to take advantage of local resources, and other issues.
Related research points to a variety of innovative technologies that might be game-changers in
medium- to
under
and
conditions.
Key opportunities include:
Advanced chemical recycling using pyrolysis, gasification, and plasma pyrolysis
Depolymerization technologies
ethylene using enzymes and synthetic biology
oxidative dehydrogenation of ethane
Redox ODH technology to produce ethylene
Micro-organisms to produce ethylene
CO2 reduction technologies from waste streams or direct air capture
Electrochemical and photochemical processes using advanced catalysts and membranes
Artificial photosynthesis
These technology families will be covered
WHITFIELD ET AL., PATHWAYS TO DECARBONIZE THE PVC VALUE CHAIN (2022) 32
Technology Options for Decarbonization: Summary Early decarbonization better than late-stage (TRL matters) Criteria technologyforselection Scalability matters in economics: small plants cannot complete with large, efficient ones Availability of sufficient information to develop realistic cost projections ReplacefueledReplacedisruptorsPotentialfossil-crackersentirefront end of PVC chain chlorReplace-alkali bioethanol*Ethylenefrom acetylene to VCM* technologies**Other routeCl2-gas–freetoEDC* e-crackers* * See appendix 7 for technical evaluation of these technologies. ** See companion report for further discussion of other technologies.Carbon capture and sequestration H2 with large scale ATR and CCS Electrifiedboilers 33WHITFIELD ET AL., PATHWAYS TO DECARBONIZE THE PVC VALUE CHAIN (2022)
Technology Options for Decarbonization: Why We Focus on CCS and Hydrogen
This study focuses on CCS and hydrogen-technology pathways to decarbonization.
• These technologies
• Are mature enough to provide reasonably precise cost estimates
• Would utilize existing sites, which are already permitted and have in many cases been recapitalized in prior cycles
• Would allow retrofit of some long-lived capital equipment
• Would likely have good access to infrastructure, including new infrastructure, like pipelines to be built on established rights-of-way
• These advantages suggest to us that CCS and hydrogen are the most likely decarbonization pathways, given the long cycles for plant construction and replacement, the urgency of the climate challenge, and the large scale of the PVC value chain.
• However, we support continued R&D to explore potential game-changing technologies as well as those that would become cost-competitive if future conditions vary widely from our scenarios.
• Appendix 7 provides more detailed evaluations of four of these technologies: ethylene-from-ethanol; electrification of crackers and other production units; chlorine gas-free EDC; and acetylene-to-VCM technology.
• A companion paper being written by Henry C. Kelly explores the other technologies included above. ET AL., PATHWAYS TO DECARBONIZE THE PVC VALUE
WHITFIELD
CHAIN (2022) 34
AMethodologyValue-Chain-Based,Bottom-Up Approach
Methodology: Prior Work and Our Approach
• Prior estimates of chemical industry emissions and abatement costs published by the U.S. Environmental Protection Agency, DOE, and other reporting agencies rely on small samples of respondents. The data sets on which they base their estimates do not differentiate among technologies being practiced, account for differences in economies of scale, or incorporate the presence or absence of CHP facilities on-site.
• Our methodology differs markedly. We cover all producing sites that contribute to the PVC value chain within the defined system boundary in the United States. We differentiate among technologies that produce the same product. We take into account the presence or absence of CHP plants onsite.
• We estimate the energy requirements and emissions for all the plants operating at their nameplate capacities, not at recent capacity utilizations across the industry, and assume that they will operate at 90% of nameplate capacity in the future.WHITFIELD
ET AL., PATHWAYS TO DECARBONIZE THE PVC VALUE CHAIN (2022) 36
Methodology: Value-Chain-Based and Bottom-Up Method 1. Create bottom-up descriptions of all PVC value chain production sites in the United States 2. Estimate site emissions based on energy use, technologies, capacity, location, and feedstock 3. Build cross-sectional techno-economic models for 2020 (baseline) and each decade to 2050 4. Estimate “as-is” and “as-will-be” (business-as-usual) energy use and emissions for each site to 2050 5. Introduce CCS and hydrogen-technology abatement options, and calculate CapEx/OpEx for each site 6. Build technology cost curves for abatement options using emissions and cost data for each site 7. Create scenarios with assumed carbon prices, energy prices, and technology attributes 8. Run annual financial model (DCF) to evaluate decision at each site: “to abate” or “not to abate” 9. Draw conclusions and comparisons from scenarios (% abatement, costs to abate, green premium) 10. Tee-up issues for policymakers’ considerationWHITFIELD ET AL., PATHWAYS TO DECARBONIZE THE PVC VALUE CHAIN (2022) 37
Methodology: Limitations and Caveats
• We developed CapEx/OpEx estimates from published sources and interviews. We made professional judgments to adjust for time, scale, and other differences between these sources and the sites.
• Given the limitations of our sources and challenges of making adjustments, we estimate that the costs we report are study level values at best and could vary by ±30%.
• The cost estimates do not include the cost of the infrastructure to transport and dispose of captured CO2 or to distribute hydrogen, the two main solutions that we studied.
• We assume that the modeled technologies can be accommodated without affecting site operations. We have no information about site-specific constraints such as limited space for new equipment, the extent of current energy integration, or limited availability of utilities. Such constraints could influence the costs or feasibility of implementing emissions reduction.
• We calculate emissions from the ethylene, chlor-alkali, and CHP plants on their nameplate capacity. A significant portion of the output of these plants is used for non-PVC products. We use relevant material flows to allocate the emissions and costs estimated by the model to either the PVC value chain or other value chains or activities. We recognize that any allocation method may introduce additional error in the model results.
• We assume that all participants will be subject to the same economic drivers and will seek to maximize their returns. We have no information about special commercial arrangements between companies in the value chain and their suppliers and customers, such as favorable prices for feedstocks, consumables, or energy that could impact technology choices.
WHITFIELD ET AL., PATHWAYS TO DECARBONIZE THE PVC VALUE CHAIN (2022) 38
Methodology: Sources of Uncertainty the information judgments of the acknowledge that many assumptions embedded in the Some of the key
While the results of our analysis are presented as point estimates based on
best
available and the professional
research team, we
analysis carry varying degrees of uncertainty and a range of alternative outcomes are possible.
uncertainties include: • Technological uncertainties in process performance such as decarbonization efficiency, utilities consumption, time to achieve full demonstrated status • Projection of exogenous prices such as local natural gas and power prices and grid emissions, hydrogen prices, and the pace of decarbonization of the grid • Timing of the resolution of permitting and other legal issues and of the development of a robust regulatory regime • Timing and adequacy of necessary infrastructure for CO2 transportation and sequestration sites and for hydrogen transportation • Local conditions that may constrain implementation including site availability and commercial arrangements • Uncertainties in the reliability of estimated costs, particularly for low TRL technologies WHITFIELD ET AL., PATHWAYS TO DECARBONIZE THE PVC VALUE CHAIN (2022) 39
Methodology: Uncertainty Estimates
We reach the following broad ranges of uncertainty in our estimates:
• For CapEx and OpEx estimates at the preliminary level of estimating quality, the uncertainty range of the estimates is +/- 20% at best.
• For study level estimates, the uncertainty range is in the range of +/- 30% at best.
• For well-known processes with established cost histories, uncertainty in rough-order-of-magnitude estimates of CapEx may be as high as 50%.
Appendix 4 contains a more detailed discussion of our cost estimation methodology and how it has been applied in this analysis. AL., PATHWAYS THE PVC VALUE
WHITFIELD ET
TO DECARBONIZE
CHAIN (2022) 40
Baseline: PVC Production in 2020
Baseline: The System Boundary
Major sources of CO2 emissions
boundaryModeledsystemOther
CHP combined heat and power
EDC – ethylene dichloride
VCM vinyl chloride monomer
sources of CO2 emissions
CHP EthyleneChlorine ResinPVCVCMEDC
WHITFIELD ET AL., PATHWAYS TO DECARBONIZE THE PVC VALUE CHAIN (2022) 42
Baseline: Important Omissions that Are Out of Scope
Every study must define the scope of research. Inevitably, important factors lie outside the scope. This study is no exception. This study is not a life cycle analysis. We focus on CO2 emissions within the modeled system boundary.
Key sources of emissions that lie outside the boundary include:
• Extraction, processing, and transportation of hydrocarbon products (primarily natural gas, natural gas liquids, and petroleum derivatives) used as feedstocks and process fuels by the PVC value chain.
• Extraction, processing, and transportation of brine for chlor-alkali production.
• Conversion of PVC resin into semi-finished and finished fabricated PVC products.
• Distribution and installation of finished PVC products by consumers.
• End-of-life outcomes (such as disposal, abandonment, or incineration) of finished PVC products.
In addition, some emissions within the system boundary are excluded as well:
• Greenhouse gases other than CO2 within the system boundary.
• CO2 from transportation between processing units.
However, CO2 emissions from electricity purchased from the grid and from making “blue” hydrogen for use as a fuel are included within the scope of the WHITFIELDanalysis.ETAL., TO DECARBONIZE THE PVC VALUE
PATHWAYS
CHAIN (2022) 43
Baseline: Data Sources
• The information to support our analysis was obtained from public and private sources.
• We rely in part on published reports on technologies and costs that we believe to be reliable and are relevant to manufacturing operations in the existing and potentially decarbonized PVC chain. Appendix 1 lists published sources.
• In addition, we conducted confidential interviews with PVC value chain operators, engineering and construction firms, national labs experts, academic researchers, technology developers, and start-up firms in the US and the European Union. This information was supplemented by unpublished research conducted previously by members of the team.
• The initial baseline model was shared in a workshop to obtain further insights and validate the assessment of current industry practices.
• We estimate the energy requirements and emissions for all plants operating at their nameplate capacities, not at recent capacity utilizations across the industry (as noted above). PVC
WHITFIELD ET AL., PATHWAYS TO DECARBONIZE THE
VALUE CHAIN (2022) 44





Material Flows in the PVC Value Chain HydrocarbonFeedstock PlantCHP Power, steam NaCl O 2 Fuel H2 NaOHEthylene EDC VCMCl2 Fuel gas HCl HCl H2 Notes: (1) PVC chain sites may not have all these elements. (2) In the absence of a CHP plant, all elements require grid power and, except the cracker, require steam. CO2 emissions CO2 emissions Heavies H2 45 Legend Blue Power/Steam Red CO2 Purple Fuel Green Raw Material Light Blue Products Fuel Chlor Alkali-Plant ResinPVCPlantVCM Direct Oxychlor+EDCEthyleneCracker
Materials flow out of the PVC value chain to other chemical-industry value chains and to exports of EDC and VCM as well as into PVC. We allocate emissions and abatement costs based on these flows. Production of EDC and VCM before export are allocated to the PVC chain. See slide 57 for more details.
Legend Blue Power/Steam Red CO2 Purple Fuel Green Raw Material Light Blue Products Light Blue Dash Exports Brown ProductsMaterialOut Flows Out of the PVC Value Chain PlantCHP Power, steam NaCl O 2 Fuel H2 NaOHEthylene EDC VCMCl2 Fuel gas HCl HCl H2 CO2 emissions CO2 emissions Heavies H2 46 Exports HydrocarbonFeedstock Chlor Alkali-PlantEthyleneCracker ResinPVCPlantVCM Direct Oxychlor+EDC Fuel
Baseline: Growth and Consolidation of the PVC Value Chain, 1990–2020
•
•
•
•
EDC
VCM
PVC resin
Avg.
Total
#
#
Avg
Avg.
Total
Avg.
Total
#
Avg
Avg.
The basic technologies for producing PVC and its precursors are well established.
Over the past thirty years, the PVC value chain has seen numerous mergers, acquisitions, retirements, and retrofits.
The result of these activities is an industry that has more capacity, fewer firms, and larger plants on average.
Nonetheless, many plants in the chain are over 30 years old.
1990 2020 Companies 14 5
size (kt) 135 556
capacity (kt) 4,575 8,446 # of plant sites 34 15 # Retirements of 1990 plants 24
age of cohort — >28 years
1990 2020 Companies 9 5
size (kt) 403 884
capacity (kt) 4,834 9,745 # of plant sites 12 12
Retirements of 1990 plants 4
age of cohort — >29 years
(direct & oxy)1990 2020 Companies 10 5
size (kt) 382 725
capacity (kt) 9,177 19,912
of plant sites 24 28
Retirements of 1990 plants 3
age of cohort >30 years WHITFIELD ET AL., PATHWAYS TO DECARBONIZE THE PVC VALUE CHAIN (2022) 47
Baseline: Heterogeneity in Plant Size and Technology
• Significant differences exist among plants of the same type in the PVC value chain today. The largest plant is about twice as large as the average plant, while the smallest is just one-third, one-quarter, or even smaller in scale than the average.
• Larger (and newer) plants within the chain are more efficient than smaller (and older) plants. (However, crackers in the chain are smaller and older and use heavier feedstocks than crackers that serve other value chains.)
• Plants of the same type also utilize different processes, including chlor-alkali (membranes or diaphragm cells), EDC (oxy-chlor or direct chlorination), and ethylene (varied feedstocks).
• Net result: simple averages are inappropriate to characterize energy use and CO2 emissions across the chain.
Size Distribution, PVC Chain in 2020
Ratio vs Average
Product Largest Smallest Chlorine 0.31 0.11 EDC (oxy) 0.27 0.37 PVC (susp) CHP
One Size Does Not Fit All
• The PVC value chain contains a wide range of “old-small” and “new-large” plants
• Economies of scale: bigger plants have better energy integration
• Improved technologies: newer plants are more efficient and productive
• Decarbonization policies need to be sensitive to these differences to be effective
Appendix 3 provides a detailed discussion of industry structure and the technologies of the PVC value chain.
AverageSize(kt) sizeMedian(kt)
637 527 2.25
(direct)EDC 687 580 2.4
740 580 1.97
VCM 884 771 2.06
556 536 2.61 0.23
533 MW 451MW 1.78 WHITFIELD0.16 ET AL., PATHWAYS TO DECARBONIZE THE PVC VALUE CHAIN (2022) 48
Business As Usual through 2050 Emissions Without Abatement Policy
Business as Usual: Emissions without Abatement Policy
• The Business as Usual (BAU) model is a set of technology-specific crosssectional models that provide a basis to evaluate potential decarbonization pathways.
• The BAU model takes into account the heterogeneity of the value chain. It calibrates energy use and CO2 emissions for each site as configured in 2020. The 2030, 2040, and 2050 versions incorporate projections for the evolution of the chain under normal business and economic conditions and in the absence of specific policies to abate emissions.
• We use prices for natural gas and electric power in the relevant states and regions drawn from the Energy Information Administration’s Annual Energy Outlook 2021. The projections use AEO’s Reference Case energy prices, which the agency considers to be “most likely.” PVC
WHITFIELD ET AL., PATHWAYS TO DECARBONIZE THE
VALUE CHAIN (2022) 50
Business as Usual: PVC Demand
• Macro: The Annual Energy Outlook provides an economic backdrop to project the demand for PVC to 2050. Historically, PVC demand is closely linked to the economic growth of its key end markets -- durable goods like building and construction, automotive, and electronics. We expect these markets to continue to grow in the future, which means that PVC production volume and capacity will grow as well. We believe the growth projections in our model are conservative.
• Building and construction: Over 70% of PVC domestic consumption goes into this sector. We assume that demand in this sector will track the projected growth of GDP of 2.2% per year to 2050.
• Other domestic markets: Key end-uses include electronics, automotive, and medical markets. We assume demand in these sectors will trail the GDP growth rate due to heightened competition from other materials, with an annual growth rate of 1.5%.
• Recycling: We assume that the market for recycled PVC will grow modestly over the period and displace some virgin PVC production.
• Exports: The US is arguably the lowest-cost producer of PVC in the world. Over 35% of PVC resin is exported. Conservatively, we assume that this level of exports will not be maintained in the future as increased competition and capacity additions in Asia and elsewhere overseas will reduce growth in export volumes to 1.3% per year. Similarly, exports of intermediates EDC and VCM are projected to fall off from their recent peak levels, with growth falling to 1.3% per year.
• Net PVC Production: Considering all the above factors, net PVC production is projected to grow by 1.78% per year.
WHITFIELD ET AL., PATHWAYS TO DECARBONIZE THE PVC VALUE CHAIN (2022) 51
•
Source: American Chemistry Council, US Department of Commerce, and Whitfield Associates projections *In this report, tons (t) refer to metric tons.
PVC production is projected to increase by 73% over 30 years and reach 12.8 million t in 2050 • Production of intermediates increases to keep pace with PVC • Exports continue to be a major outlet for US production • Volume growth of the chain creates a moving target for emissions reduction policies Business as Usual: US PVC Resin Production, Past, Present, and Future WHITFIELD ET AL., PATHWAYS TO DECARBONIZE THE PVC VALUE CHAIN (2022) 52 14121086420 1990 2000 2010 2020 2030 2040 2050 Million metric tons annually* Production Domestic Demand Projections Net Exports
Business as Usual: Technology Trends
• EIA projects that the energy intensity of the economy will continue to fall overall, with rates of decline varying by end-use sector. We assume that process technologies in the PVC chain follow this trend and that companies in the PVC chain will pursue efficiency increases aggressively. The result is steady gains in efficiency between 2020 and 2050.
• In addition to a steadily improving outlook for energy efficiency, the need for additional capacity to meet rising demand will necessitate new investments for all elements in the chain. We add capacity at specific sites in the model where needed and hold capacity utilization at 90% of nameplate, a level at which operators may expect to obtain the required returns on their investments while allowing for routine maintenance and downtime. We assume that the new capacity will be larger-scale and better-integrated, and therefore more efficient than the current average.
• CHP plants are important sources of power and steam for integrated plants. As part of the modeled capacity expansion, we assume that new CHP plants will be installed at chlor-alkali plants where none exist today, and that the oldest ones (greater than 50 years old) will be retired and replaced with new, more efficient plants.
• Chlor-alkali plants are one of the largest consumers of electricity in the manufacturing sector. We expect that plants using diaphragm cell technology will completely convert to membrane cell technology (a more energy efficient technology) by 2040, thereby lowering CO2 emissions from these facilities.
WHITFIELD ET AL., PATHWAYS TO DECARBONIZE THE PVC VALUE CHAIN (2022) 53
46.3 41.9 37.2 35.5 17.7 17.7 16.3 15.650403020100 2020 2030 2040 2050 CO₂ Emissions (Million t) Business as Usual: Emissions Decline Even as the Industry Grows • More sites add efficient CHP plants; older CHP plants are retired and replaced with modern plants • Greater use of CHP power displaces a share of grid power • Chlor-alkali plants replace diaphragm cells with membrane cells • Ethylene crackers use more ethane over time, which has lower unit emissions than other feedstocks • Energy efficiency of existing plants gradually improves Why do emissions decline? Total emissions PVC chain emissions (allocatedWHITFIELDemissions)ETAL.,PATHWAYS TO DECARBONIZE THE PVC VALUE CHAIN (2022) 54
Business as Usual: Emissions by Major Source
EmissionsUnabated
(Mt/yr) CHP Crackers ProcessFuels O2/HCl
2020 46.3 52.8% 13.8% 22.9% 9.1% 1.4%
2030 41.9 58.9% 5.9% 24.1% 9.8% 1.3%
2040 37.2 59.1% 2.2% 26.7% 11.3% 0.7%
2050 35.5 62.2% 1.8% 26.8% 8.4% 0.8%
Grid
WHITFIELD ET AL., PATHWAYS TO DECARBONIZE THE PVC VALUE CHAIN (2022) 55
Annual CO2 Emissions Emissions
Business as Usual: CO2 Emissions by Region•TXand
LA emit nearly equal amount of CO2; TX has higher in-chain emissions.
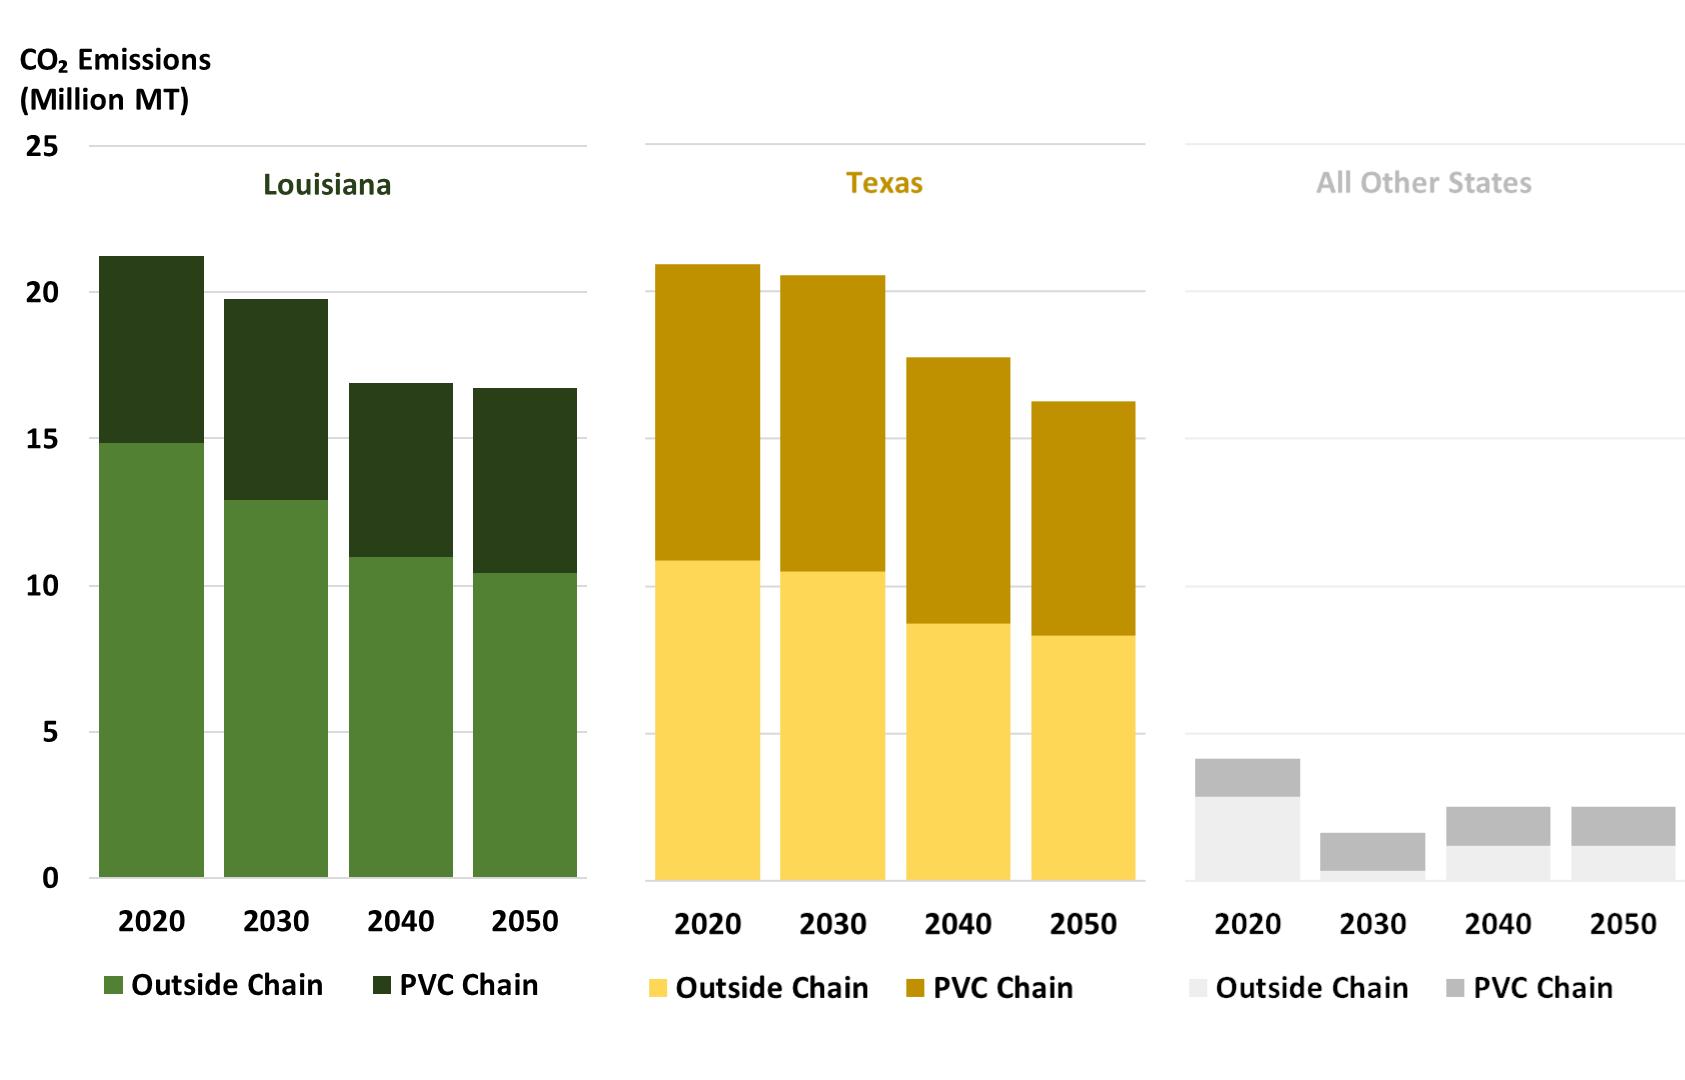
• “All other states” includes an integrated facility in KY and plants in MS, IL, & NJ
• In 2040, a new integrated facility enters the model in the OH/PA/WV region to access inexpensive feedstocks and gain proximity to the customer base in the Northeast
WHITFIELD ET AL., PATHWAYS TO DECARBONIZE THE PVC VALUE CHAIN (2022) 56
CO2
(Million t)
Business as Usual: Carbon Intensity Shows a Big Improvement
Million t CO2 / Million t PVC Equivalent Production
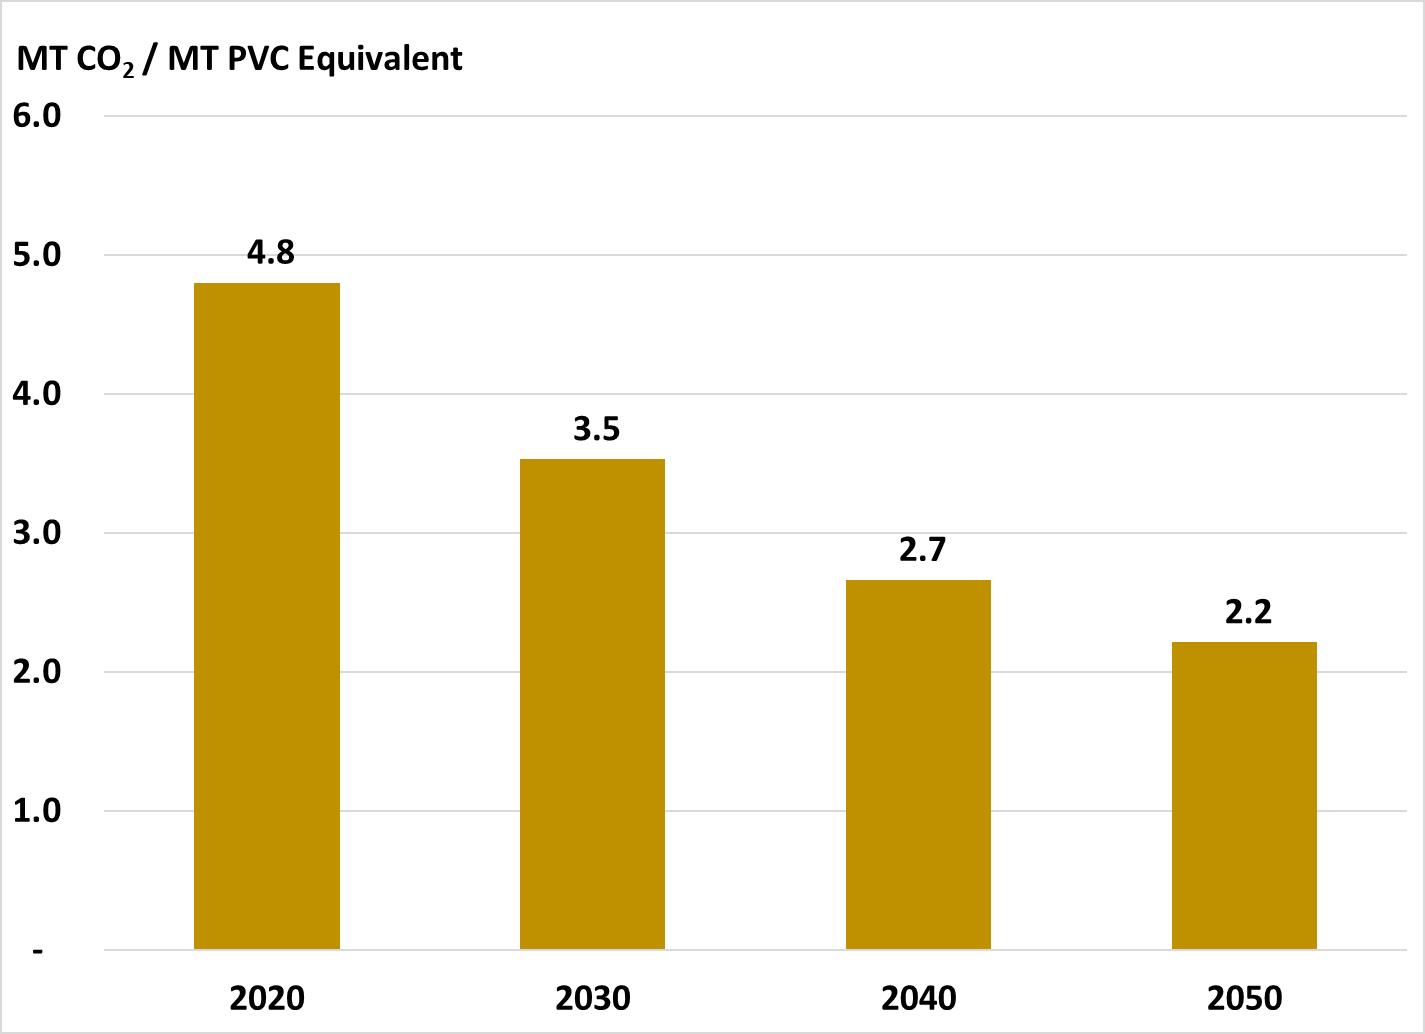
PVC Equivalent Production = PVC production + 90% VCM exports + 83% EDC exports.
This metric accounts for decarbonized exports of intermediate chemicals. Unless we account for this leakage, any measure of carbon intensity would not be representative of the entire value chain.
57
57
Business as Usual: Allocating Emissions to the PVC Chain
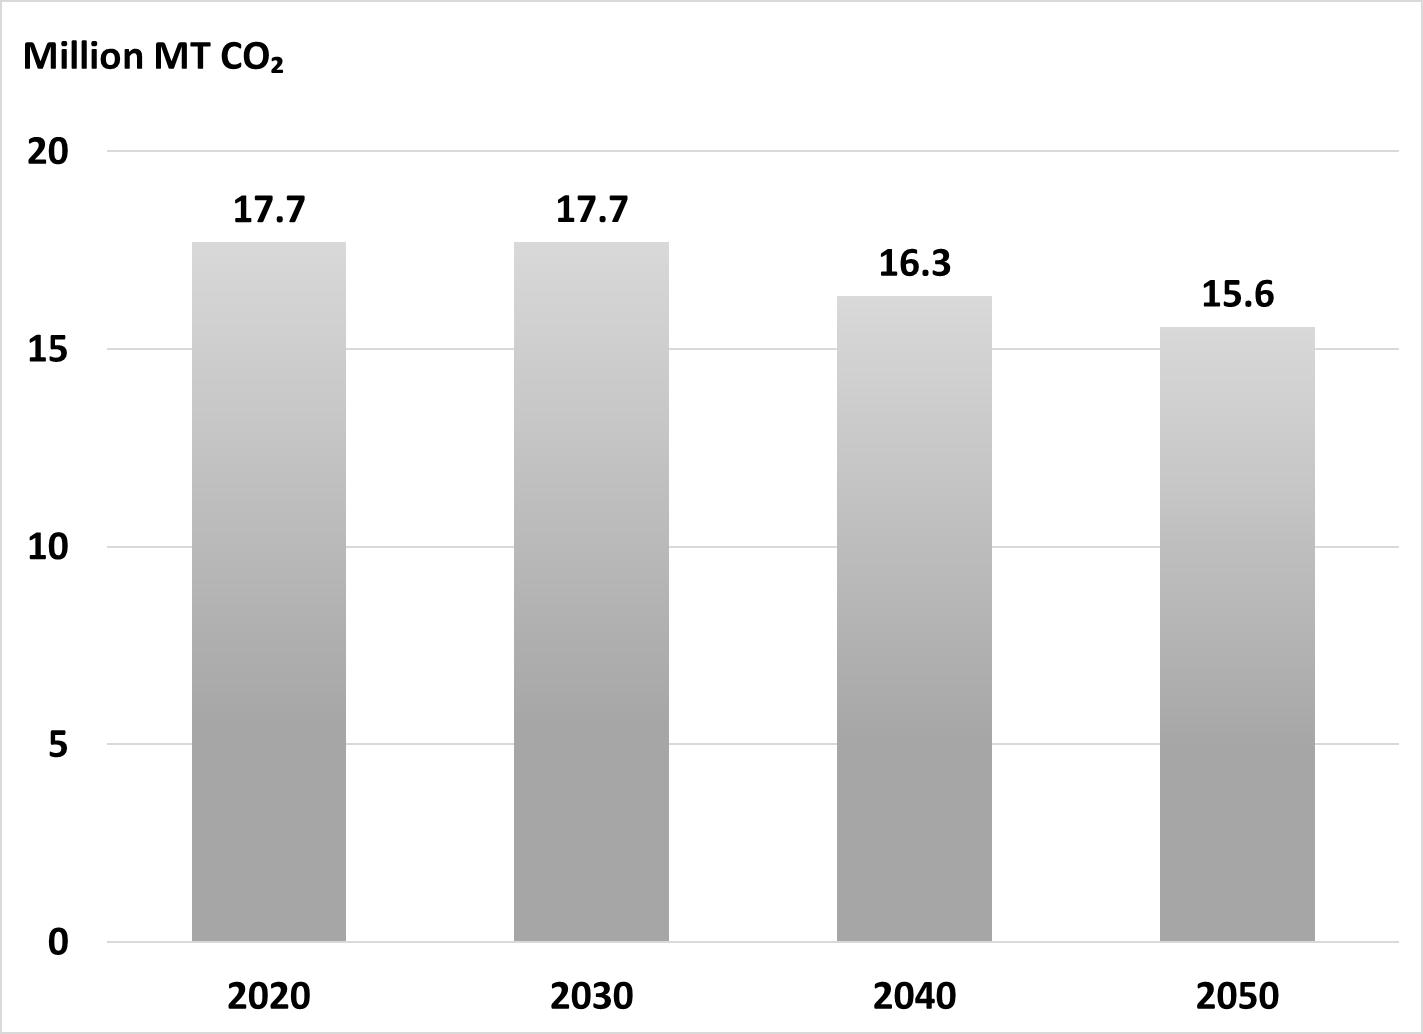
A significant portion of the output of ethylene, chlorine, and CHP plants in our model is used outside the PVC value chain. For example, ethylene is used to make polyethylene, and chlorine is used to treat drinking water. The same plants serve multiple markets. To calculate the emissions resulting from PVC production alone, we must allocate material flows within and outside the PVC value chain, a challenging task. We use these flows and other engineering factors to calculate allocated emissions. While our models focus on emissions allocated to PVC, its production cannot be decarbonized without costs and emissions allocated outside the chain, due to the integrated nature of the production process. Indeed, in the business-as-usual model, the proportion of ethylene, chlorine, and CHP capacity that feeds the PVC chain ranges from 44.5% to 63.4%, depending on the facility type and year.
Products and services allocated outside the PVC chain
•include:Ethylene for other uses
• Cracker by-products (C3, C4, …)
• Chlorine for other uses
• Co-product caustic soda from chlor-alkali plants
• Power and steam from CHP plants at the sites in excess of requirements for the PVC chain
In 2050, allocated emissions for the PVC chain represent 44% of CO2 emissions from all plants that feed into the chain. PVC VALUE (Million t CO2)
WHITFIELD ET AL., PATHWAYS TO DECARBONIZE THE
CHAIN (2022) 58
Analytical Framework for Decarbonization Pathway Construction
Analytical Framework: Introduction
The BAU model provides a “clean slate” for evaluating the potential impact of policy drivers on abatement technology adoption. Assuming that the industry continues to grow and modernize, we develop two sets of models that assess what site operators would do in 2030, 2040, and 2050 under specific conditions.
• For CCS, we ask: What would it cost if every site installed a system to capture CO2 from stack gases and sequester it safely? The sites would use grid power along with CHP where needed to operate this system. To evaluate this option, we need to estimate CapEx and OpEx at each site, the amount of CO2 to be treated, and the amount of CO2 that would remain unabated.
• For hydrogen, we ask: What would it cost if every site installed equipment to use hydrogen as a process fuel in place of natural gas? Hydrogen would generally be purchased on the market, except to the degree that it is made on site as a coproduct of ethylene production. To evaluate this option, we need to estimate CapEx and OpEx at the site, the amount of CO2 treated, and the amount of CO2 remaining unabated.
WHITFIELD ET AL., PATHWAYS TO DECARBONIZE THE PVC VALUE CHAIN (2022) 60
Analytical Framework to Construct Decarbonization Pathways
Policy Scenarios 2040,
What is the CO2 abatement trajectory for the PVC chain if we vary …
• Carbon prices?
• Natural gas and electricity prices?
• Hydrogen prices?
• CCS CapEx?
• Carbon-intensity of grid…inelectricity?themodel
What is the carbon price that drives NPV of abatement costs to
Decision Framework










• Which sites/processes choose to abate? Crackers, CHP plants, chlor-alkali plants, or EDC/VCM/PVC plants?
• When do they abate? Timing matters.
• Why do they choose to abate? ROI, scale, site integration Model
BAU model 2020, 2030, 2040, 2050 Financial
2030–2050(annual)
Policy$0?scenarios:
2030,
Abatement2050trajectoryCCScurvesCost&H2 WHITFIELD ET AL., PATHWAYS TO DECARBONIZE THE PVC VALUE CHAIN (2022) 61
Analytical Framework: Overview of CO2-Abatement Cost Curves
• Step 1 of our methodology is to estimate the CO2 abatement cost for each site and each technology.
• These estimates, explained in detail below, allow us to plot the cost of abatement per ton of CO2 across the entire PVC value chain in each time period.
• In the cost curve at the right, which shows abatement by CCS in 2030, each line segment represents a production site. They are laid out from left to right from the least to most costly to abate. The length of each segment represents the scale of the site’s emissions. 40
Sample Cost Curve: Cost Per Ton of Abating CO2 by Site in 2030, CCS 350300250200150100500 0 10 20 30
$/t CO2 Million t CO2 WHITFIELD ET AL., PATHWAYS TO DECARBONIZE THE PVC VALUE CHAIN (2022) 62
Analytical Framework: General Considerations for Cost Estimation
• Our method relies on estimates of two kinds of costs: fixed capital (CapEx) and cash operating (OpEx). Such estimates are inherently risky and uncertain.
• The literature on decarbonization costs is frequently flawed:
• The bases of published cost information often are not clearly defined, and may represent preliminary engineering estimates, averages of other reported values, or extrapolations.
• CapEx estimates based on a standard nameplate capacity at a given point in time need to be adjusted for inflation and scaled up or down to reflect larger or smaller units of capacity.
• OpEx breakdowns of major cost components are often not reported and must be brought up to date.
• In addition to mining the published literature, we interviewed industry experts to provide as much detail as possible without divulging confidential information.
• We applied a capital charge factor of 10% to account for an investor’s return on capital and working capital requirements to arrive at an estimated total cost of abatement.
WHITFIELD ET AL., PATHWAYS TO DECARBONIZE THE PVC VALUE CHAIN (2022) 63
Analytical Framework: Cost Estimation for CCS
• The most detailed public information available on the costs of modeled CCS systems is presented in a report issued by DOE’s National Energy Technology Laboratory (NETL).* These estimates were developed for specific plant sizes and for generic sites, which we take as being applicable to the U.S. Gulf Coast.
• We updated the capital requirements to 2020 by using the Chemical Engineering Plant Cost Index. We updated the operating costs to 2020 using the EIA’s AEO 2021 energy costs and producer price indices (PPI) for other components as appropriate.
• We scaled both the capital requirements and operating cost components to different capacities using appropriate costcapacity exponents.
• The cost breakdowns for various CCS operations presented in the NETL reports do not contain descriptions of systems to treat gases generated from natural gas combustion in crackers, boilers or CCS systems. These systems contain CO2 at about 5% by volume, far more dilute than those covered by NETL.
• Systems to treat dilute emissions streams would require greater front end scrubbing capacity and higher utility requirements to handle larger volumes of gases than those covered by NETL. They might not attain as high a level of abatement or decarbonization efficiency.
• We therefore developed preliminary material and energy balances and equipment cost estimates to increase the costs for treatment of more dilute gas streams. These estimates are equivalent to study level as best.
*National Energy Technology Laboratory, “Cost of Capturing CO2 from Industrial Sources,” 2014.
WHITFIELD ET AL., PATHWAYS TO DECARBONIZE THE PVC VALUE CHAIN (2022) 64
Analytical Framework: Cost Estimation for Hydrogen
• The most detailed public information available on the costs of the production of blue hydrogen by autothermal reforming is presented in a report issued by DOE’s National Energy Technology Laboratory (NETL).* These estimates were developed for specific plant sizes and for generic sites, which we take as being applicable to the U.S. Gulf Coast.
• The cost estimates for blue hydrogen production were developed for a plant with a capacity of 217kt/yr. The development of large regional hydrogen hubs has been funded by federal legislation, and DOE expects to receive proposals over the next few months to build them. Hydrogen production plants in the future will be larger than existing plants and we have imputed scale economies and operating efficiencies increasing over time from 2030 to 2050.
*National Energy Technology Laboratory, “Comparison of Commercial State of the Art, Fossil Based Hydrogen Production Technologies,” 2022.
WHITFIELD ET AL., PATHWAYS TO DECARBONIZE THE PVC VALUE CHAIN (2022) 65
Analytical Framework: CCS and Hydrogen Infrastructure
• The pace of development of the infrastructure necessary to support decarbonization by either CCS or use of hydrogen as a fuel is uncertain. It is likely to vary by region, although the U.S. Gulf Coast has active discussions about an infrastructure build-out. These considerations, along with others noted above, introduce further uncertainty into the rate and extent of decarbonization technology adoption across the PVC chain.
• The infrastructure for CO2 transportation away from plants as well as its permanent sequestration or reuse is currently limited. It is expected to increase significantly in the future with support from federal infrastructure funding and tax incentives. We assume that the CO2 transportation and disposal costs from the CCS systems will be $20/t in 2030 and decrease to $15/t thereafter.
• The distribution infrastructure for hydrogen will likely increase significantly in the future, particularly after 2030, but it is unclear at this time what it will cost and how it will be paid for. We do not include a cost for transporting hydrogen from its production site into the PVC chain.
WHITFIELD ET AL., PATHWAYS TO DECARBONIZE THE PVC VALUE CHAIN (2022) 66
Analytical Framework: Building Abatement Cost Curves
• We use the estimates of CapEx and OpEx for CO2 abatement by CCS and hydrogen to build cost curves for each of these technologies that incorporate site-specific estimates for every plant in the PVC value chain.
• The total costs of abatement plotted in these curves include OpEx plus an annual return to capital allowance of 10% of the investment required.
• We are thus able to rank the sites by cost per ton of abatement in any given time period for each technology. These rankings provide insight into which sites can be expected to be early adopters of each abatement technology as well as those that are unlikely to adopt either without a mandate or incentive.
• We are also able to compare the costs of abatement by technology overall and across sites. Hydrogen is generally more expensive than CCS. But the rankings by site are not the same for the two technologies; in other words, the difference in the cost of adoption of CCS and hydrogen is not the same at every site. A key driver of these site-level differences is the higher relative CapEx for CCS and OpEx for hydrogen.
• The next slide provides an example of the two technology cost curves in 2030. Comparable cost curves are used in the analysis of 2040 and 2050.
WHITFIELD ET AL., PATHWAYS TO DECARBONIZE THE PVC VALUE CHAIN (2022) 67
Analytical Framework: Break-Even Cost Curves for CCS & H2 Adoption in 2030
CCS Is More Cost Competitive than Priced at in this Time Frame
2030 Costs by Plant t CO2
BAU case
Flatter curve, scale less important
Crackers are disadvantaged
CCS Hydrogen
Higher CapEx, lower OpEx Lower CapEx, higher OpEx Scale mattereconomies
Early adoptions at $100/t CO2
Scale economies less pronounced
Early adoptions at $150/t CO2
Early adopters largest emitters
Small plants disadvantaged
CCS: Integrated sites at the bottom of the cost curve; smaller sites, which are seriously disadvantaged, at the top
H2: Ethylene crackers are at the top of the cost curve because fuel gases require abatement by reforming, which increases both CapEx and OpEx AL., PATHWAYS TO DECARBONIZE THE PVC VALUE
350300250200150100500 0 10 20 30 40 $/t CO2 Million t CO2 CCSHydrogen
H2
$1.5/Kg
and
WHITFIELD ET
CHAIN (2022) 68
Analytical Framework: Main Policy Scenarios
Two main variables differentiate our policy scenarios from the BAU model:
• Carbon price:
• If sites have to pay a price for each ton of CO2 they emit, they will have an economic incentive to adopt abatement technologies. To provide a predictable framework for economic decision-making, we assume that the price is initiated at a specific time at a specific level and then rises 5% per year to drive higher levels of abatement.
• Preliminary research suggested that a base rate of between $50 and $75 per ton of CO2 emitted in 2030 led to a wide range of modeled outcomes.
• Our low carbon price cases include a price of $50 in 2030 and rise by 5% per year
• Our high carbon price cases include a price of $75 in 2030 and rise by 5% per year
• The carbon price in the model is a convenient stand-in for diverse policy options, which are discussed below. It is not the only policy option that should be under consideration.
• Energy prices:
• Sites must purchase natural gas and electricity, so variations in their prices may affect adoption of abatement technologies. In the BAU case, we used the AEO Reference Case (REF) energy prices, which the agency considers to be “most likely.”
• To gain additional insights into the impacts of energy prices, we also use the AEO Low Oil & Gas Supply (LOGS) Case , in which natural gas prices are much higher than the Reference Case. The LOGS case also assumes that electricity prices rise in the near term and then decline as renewables alter the generation mix toward a greener grid.
• Our low energy price cases use the REF prices. Our high energy price cases use the LOGS prices.
• The price for blue hydrogen is based on the costs projected from NETL’s 2022 estimates of production costs, adjusted for energy prices in the REF and LOGS cases and for the economies of scale expected as plant capacities expand to meet projected demand.
WHITFIELD ET AL., PATHWAYS TO DECARBONIZE THE PVC VALUE CHAIN (2022) 69
Analytical Framework: “Stretch” Policy Scenarios
We also explore scenarios that stretch the boundaries of current thinking, but align with stated goals of DOE and the Biden administration
• Low cost CCS: We assume that the CapEx and energy consumption of CCS is reduced by 15% in 2030, 35% in 2040, and 40% in 2050.
• Low cost hydrogen: We assume that hydrogen costs $1/kg beginning in 2030.
Finally, we look in a less detailed way at two possibilities that would eliminate emissions from inputs to the system:
• Green grid: We envision the achievement of a zero-carbon in the regions where plants in the PVC are
• Green : We envision replacing no TO DECARBONIZE THE PVC VALUE
grid
value chain
located.
hydrogen
“blue” hydrogen made from natural gas with CCS with “green” hydrogen made with
carbonWHITFIELDemissions.ETAL., PATHWAYS
CHAIN (2022) 70
Analytical Framework: Summary of Scenarios
Scenario Name Technology CarbonPrice EnergyPrices Special Case
Business-as-Usual
None None Low
CCS-Low-Low CCS Low Low
CCS-High-Low CCS High Low
CCS-Low-High CCS Low High
CCS-High-High CCS High High
CCS Stretch CCS Low Low Low CCS CapEx & energy consumption
H2-Low-Low H2 Low Low
H2-High-Low H2 High Low
H2-Low-High H2 Low High
H2-High-High H2 High High
H2Stretch H2 Low High Low H2 OpEx
WHITFIELD ET AL., PATHWAYS TO DECARBONIZE THE PVC VALUE CHAIN (2022) 71
Analytical Framework: Financial Model for Site Technology Adoption
• Sites in our scenarios are faced with a decision more frequently than every decade whether to invest in an abatement technology or to pay the price for each ton of carbon emitted. A company typically evaluates these decisions on an annual basis, so we developed a simplified discounted cash flow model (DCF) to provide guidance on this decision.
• The calculation is summarized below:
= � ���� =0 ���� �������������� ���������������� ���� / 1 + ���� ����Present Value
• where cash flow in any year equals the difference between paying a carbon price and the avoided cost if the site abates, given the CapEx and OpEx of the abatement investment over the life of the asset
• r is the discount rate to account for the time value of money
• n is the useful life of the asset
• The DCF model yields a breakeven carbon price for any given abatement technology at a given site in a given year. The site will choose to abate if the present value of paying the carbon price would be more costly than incurring the present value of abatement expenses. These results drive which sites abate and when.
• The approach allows us to compare across technologies and the highly heterogeneous sites that contribute to the PVC value chain.
• Appendix 5 provides a detailed discussion of the financial model
WHITFIELD ET AL., PATHWAYS TO DECARBONIZE THE PVC VALUE CHAIN (2022) 72
CCS Decarbonization Pathways
Findings
aCarbon price of $50/t in 2030 increasing by 5%/year AEO reference case Becomes Attractive after 2030
In 2030, only “baked in” abatement occurs. Sites prefer to pay the carbon price than deploy CCS.
By 2040, larger clusters abate with CCS and smaller sites pay the carbon price.
Because a site cannot simply decarbonize only the PVC portion of its operation, delayed CCS adoption is a missed opportunity to cut carbon emissions significantly.
Carbon pricea $50 $81 $132 gasb $3.61 $3.80 $3.94
17.7 17.4 4.1 3.520100 2020 2030 2040 2050 CO₂ Emissions Allocated to the PVC Chain (Million t) CCS: Low Carbon Price, Low Energy Prices
Results (Allocated) 2030 2040 2050 fromAbatement2020 −2% −77% −80% CapExCumulative $0 $5.1B $5.3B Assumptions
Natural
price
b
energy prices ($/MMBTU) Adoption
WHITFIELD ET AL., PATHWAYS TO DECARBONIZE THE PVC VALUE CHAIN (2022) 74
17.7 6.0 3.8 3.520100 2020 2030 2040 2050 CO2 Emissions Allocated to the PVC Chain (Million t) CCS: High Carbon Price, Low Energy Prices Findings The high carbon price accelerates deployment of CCS by a Thedecade.infrastructure for CO2 sequestration may not support such a rapid deployment. By 2040, nearly every site except the smallest would adopt CCS to avoid the carbon price. Results (Allocated) 2030 2040 2050 fromAbatement2020 −66% −78% −80% CapExCumulative $6.1B $6.8B $6.8B Assumptions Carbon pricea $75 $122 $199 Natural gasb price $3.61 $3.80 $3.94 aCarbon price of $75/t in 2030 increasing by 5%/year bAEO reference case energy prices ($/MMBTU) Adoption Becomes Attractive By 2030 WHITFIELD ET AL., PATHWAYS TO DECARBONIZE THE PVC VALUE CHAIN (2022) 75
17.7 17.4 4.5 3.520100 2020 2030 2040 2050 CO₂ Emissions Allocated to the PVC Chain (Million t) CCS: Low Carbon Price, High Energy Prices Findings CCS adoption trajectory is nearly identical to the low carbon price-low energy price scenario. Conclusion: The rate of CCS adoption is largely indifferent to low or high energy prices. Results (Allocated) 2030 2040 2050 fromAbatement2020 −2% −74% −80% CapExCumulative $0 $4.8B $5.3B Assumptions Carbon pricea $50 $81 $132 Natural gasb price $5.36 $6.30 $6.85 aCarbon price of $50/t in 2030 increasing by 5%/year bAEO high energy price case ($/MMBTU) Adoption Becomes Attractive after 2030 WHITFIELD ET AL., PATHWAYS TO DECARBONIZE THE PVC VALUE CHAIN (2022) 76
17.7 6.3 3.9 3.5 0 10 20 2020 2030 2040 2050 CO₂ Emissions Allocated to the PVC Chain (Million t) CCS: High Carbon Price, High Energy Prices Findings The high carbon price will initiate the rate of CCS adoption more quickly than high or low energy prices. By 2040, only the smallest sites will prefer to pay the carbon price and thus avoid the capital cost burden of CCS technology. Results (Allocated) 2030 2040 2050 fromAbatement2020 −64% −78% −80% CapExCumulative $4.2B $5.6B $5.6B Assumptions Carbon pricea $75 $122 $199 Natural gasb price $5.36 $6.30 $6.85 aCarbon price of $75/t in 2030 increasing by 5%/year bAEO high-energy-price case ($/MMBTU) Adoption Becomes Attractive By 2030 WHITFIELD ET AL., PATHWAYS TO DECARBONIZE THE PVC VALUE CHAIN (2022) 77
CCS Stretch Scenario: Less Costly Technology
Policy Scenario:
• Assumes that CapEx and energy consumption for CCS decline by:
• 15% in 2030
• 35% in 2040, and
• 40% in 2050.
• Explores when and how the largest CO2 emitters in the PVC value chain are impacted— ethylene, chlor-alkali, and CHP plants—compared with downstream operations of EDC, VCM, and PVC resins plants.
• Assumes low carbon price (starting at $50/ton in 2030) and low-cost natural gas (AEO reference case).
• Yields a radically different cost curve inWHITFIELD2030.
ET AL., PATHWAYS TO DECARBONIZE THE PVC VALUE CHAIN (2022) 78
The Less-Costly CCS Cost Curve in 2030 Is Radically Different
• Two-thirds of the CO2 remain unabated on sites that would rather pay the carbon price.
• The lowest cost sites adopt CCS in 2030, assuming infrastructure availability.
• The high-cost tail of the cost curve (small plants) has vanished because they pay the $50/ton tax. $50/t carbon price
Assumes most likely energy prices and
WHITFIELD ET AL., PATHWAYS TO DECARBONIZE THE PVC VALUE CHAIN (2022) 79 350300250200150100500 0 10 20 30 40 $/t CO2 Million t CO2 2030 CCS
Assumptions
Carbon pricea $50 $81 $132
Natural gasb price $3.61 $3.80 $3.94
aCarbon price of $50/t in 2030 increasing by 5%/year
Findings
By 2040, the large reduction in CCS costs encourage large scale adoption; only two sites prefer to pay the carbon price. By 2050, only the smallest site prefers to pay the carbon price; every other site have installed ImplementationCCS. cost matters; CCS is expensive. Whether it is by increasing affordability through technological progress or better financial incentives, lowering the cost is key if carbon price is at $50/ton. $3.8B
bAEO reference case energy prices ($/MMBTU)
17.7 12.6 3.8 3.520100 2020 2030 2040 2050 CO₂ Emissions Allocated to the PVC Chain (Million t) CCS Stretch: Low CapEx, Low Carbon Price, Low Energy Prices
Results (Allocated) 2030 2040 2050 fromAbatement2020 −29% −79% −80% CapExCumulative $1.1B
$3.8B
Adoption Begins to Be Attractive by 2030 WHITFIELD ET AL., PATHWAYS TO DECARBONIZE THE PVC VALUE CHAIN (2022) 80
Hydrogen Decarbonization Pathways
Findings
In 2030 and 2040, all sites would prefer to pay the carbon price than use hydrogen at the projected price. Only business-as-usual abatement occurs 2050, every site adopts hydrogen at the projected price of $1.30/kg except for the smaller merchant ethylene crackers that supply the PVC chain Carbon carbon $50/t 2030
By
17.7 17.7 16.3 3.520100 2020 2030 2040 2050 CO₂ Emissions Allocated to the PVC Chain (Million t) Hydrogen: Low Carbon Price, Low Energy Prices Results (Allocated) 2030 2040 2050 fromAbatement2020 0% −8% −80% CapExCumulative $0 $0 $1.4B Assumptions Carbon pricea $50 $81 $132 Natural gasb price $3.61 $3.80 $3.94 ($/kg)Hydrogen $1.50 $1.40 $1.30 a
price of
in
increasing by 5%/year bAEO reference case energy prices ($/MMBTU) Adoption Becomes Attractive after 2040 WHITFIELD ET AL., PATHWAYS TO DECARBONIZE THE PVC VALUE CHAIN (2022) 82
17.7 17.7 3.5 2.120100 2020 2030 2040 2050 CO₂ Emissions Allocated to the PVC Chain (Million t) Hydrogen: High Carbon Price, Low Energy Prices Findings In 2030, all sites would prefer to pay the higher carbon price than use hydrogen at the projected price. The higher carbon price brings adoption forward from 2050 to By2040.2050, even the ethylene crackers have adopted hydrogen technology. Results (Allocated) 2030 2040 2050 fromAbatement2020 0% −80% −88% CapExCumulative $0 $1B $1.5B Assumptions Carbon pricea $75 $122 $199 Natural gasb price $3.61 $3.80 $3.94 ($/kg)Hydrogen $1.50 $1.40 $1.30 aCarbon price of $75/t in 2030 increasing by 5%/year bAEO reference case energy prices ($/MMBTU) Adoption Becomes Attractive after 2030 WHITFIELD ET AL., PATHWAYS TO DECARBONIZE THE PVC VALUE CHAIN (2022) 83
Hydrogen: Low Carbon Price, High Energy Prices
Carbon pricea $50 $81 $132
Natural gasb price $5.36 $6.30 $6.85 $1.80 $1.80
Findings
The rate of hydrogen adoption is agnostic to energy prices.
Prior to 2040, all sites would prefer to pay the lower carbon price than use hydrogen at the projected price.
By 2050, nearly every site prefers to adopt hydrogen at the projected price.
The rate of hydrogen adoption is more sensitive to the level of the carbon price that differences in energy prices.
aCarbon price of $50/t in 2030 increasing by 5%/year
bAEO high-energy-prices case ($/MMBTU)
17.7 17.7 16.3 1.820100 2020 2030 2040 2050 CO₂ Emissions Allocated to the PVC Chain (Million t)
Results (Allocated) 2030 2040 2050 fromAbatement2020 0% −8% −90% CapExCumulative $0 $0 $0.9B Assumptions
($/kg)Hydrogen $1.80
Adoption Becomes Attractive after 2040 WHITFIELD ET AL., PATHWAYS TO DECARBONIZE THE PVC VALUE CHAIN (2022) 84
Hydrogen: High Carbon Price, High Energy Prices
Findings
In 2030, all sites would prefer to pay the lower carbon price than use hydrogen at the projected price.
By 2040, the situation has changed dramatically. The higher carbon price and higher energy prices incentivize nearly universal hydrogen adoption. The rate of hydrogen adoption is more sensitive to the level of the carbon price that differences in energy prices.
Carbon
aCarbon $75/t in 2030 increasing by 5%/year
b
17.7 17.7 1.71.720100 2020 2030 2040 2050 CO₂ Emissions Allocated to the PVC Chain (Million t)
Results (Allocated) 2030 2040 2050 fromAbatement2020 0% −90% −90% CapExCumulative $0 $1B $2.3B Assumptions
pricea $75 $122 $199 Natural gasb price $5.36 $6.30 $6.85 ($/kg)Hydrogen $1.80 $1.80 $1.80
price of
AEO high-energy-prices case ($/MMBTU) Adoption Becomes Attractive after 2030 WHITFIELD ET AL., PATHWAYS TO DECARBONIZE THE PVC VALUE CHAIN (2022) 85
Hydrogen Stretch Scenario: $1/Kg H2
Policy Scenario:
• Assumes that hydrogen production costs decline or are subsidized, so that the price of blue hydrogen declines to $1/kg in 2030 and hydrogen use is not constrained by limited infrastructure.
• Assumes low carbon price (starting at $50/ton in 2030) and high natural gas prices (AEO LOGS case).
• Explores when and how the largest CO2 emitters in the PVC value chain are impacted –ethylene, chlor-alkali, and CHP plants – compared with downstream operations of EDC, VCM, and PVC resins plants.
• Yields rapid deployment and emissions reductions. PVC
WHITFIELD ET AL., PATHWAYS TO DECARBONIZE THE
VALUE CHAIN (2022) 86
Hydrogen Stretch: Hydrogen, Low Carbon Price, High Energy Prices
Adoption Becomes Attractive by 2030
Results (Allocated) 2040 −84% −90% −88 $0.6B $0.7B $2.1B
Assumptions
Carbon pricea $50 $81 $132
Natural gasb price $5.36 $6.30 $6.85 $1.00 $1.00 $1.00
Findings
In 2030, most sites are motivated to invest in using H2, lured by its low price and the avoidance of paying the carbon price. But the CO2 sequestration and hydrogen distribution infrastructure may not support such a rapid deployment. Smaller merchant ethylene crackers are the exception: they pay the carbon price.
By 2040, more sites adopt hydrogen, and by 2050, every site adopts hydrogen at the projected price.
The rise in emissions from 2040 to 2050 is due to increased hydrogen production as small crackers reform fuel gases and purchase more merchant hydrogen.
aCarbon price of $50/t in 2030 increasing by 5%/year
bAEO high-energy-prices case ($/MMBTU)
17.7 2.8 1.8 2.020100 2020 2030 2040 2050 CO2 Emissions Allocated to the PVC Chain (Million t)
$1/Kg
2030
2050 fromAbatement2020
% CapExCumulative
($/kg)Hydrogen
WHITFIELD ET AL., PATHWAYS TO DECARBONIZE THE PVC VALUE CHAIN (2022) 87
Comparing Pathways
Estimated Cumulative Emissions and Costs, 2020–2050, All Scenarios
Cumulative cost of abatement ($B) Cumulative carbon price paid for unabated emissions ($B) Cumulativeemissions (Million t) reductionCumulativeemissionsvsBAU (Million t) Cost per ton abated w/o carbon price Cost per ton abated w/carbonprice
CCS Low-Low $24.1 $10.9 321 186 $130 $189
CCS High-Low 37.6 10.6 204 302 124 159
CCS Low-High 26.2 11.3 325 182 144 207
CCS High-High 33.3 10.7 208 299 111 147
CCS Stretch 20.9 9.1 269 237 88 126
H₂ Low-Low 8.5 21.4 446 61 140 493
H₂ High-Low 34.6 14.7 311 196 176 252 H₂ High-High 20.5 438 69 160 457
H₂ High-High 40.4 12.1 291 215 187 244
H₂ Stretch 21.6 3.5 145 362 60 69
WHITFIELD ET AL., PATHWAYS TO DECARBONIZE THE PVC VALUE CHAIN (2022) 89
Sample Comparison of CCS vs Hydrogen: Low Carbon Price, High Energy Prices
Scenario Name PriceCarbon EnergyPrices
CCS Low-High Low-High
Findings
Under projected economic and technology assumptions, CCS technology will be adopted sooner and provide more cumulative CO2 removal over the 2030–2050 period than hydrogen technology at the projected hydrogen price.
However, hydrogen technology will provide lower annual CO2 reduction by 2050 (and afterward).
CCS Hydrogen20151050 2020 2030 2040 2050 CO₂ Emissions Allocated to the PVC Chain (Million t)
WHITFIELD ET AL., PATHWAYS TO DECARBONIZE THE PVC VALUE CHAIN (2022) 90
Low High Hydrogen
Low High
CCS Low-Low Scenarios
Scenario Name EnergyPrices
CCS Low-Low Low Low
CCS High-Low High Low
CCS Low-High Low High CCS High-High High High
CCS Stretch (Low CCS CapEx & energy consumption) Low Low
Findings
The higher carbon price is the most important factor to achieve rapid CO2 reductions.
Higher or lower energy prices have little influence on the rate of CCS adoption. Only lower capital costs will accelerate the adoption of CCS technology.
CCS High-LowCCS Low-HighStretchCCSHighCCS-High20151050 2020 2030 2040 2050 CO₂ Emissions Allocated to the PVC Chain (Million t) CCS: All
WHITFIELD ET AL., PATHWAYS TO DECARBONIZE THE PVC VALUE CHAIN (2022) 91
PriceCarbon
Hydrogen: All Scenarios
Scenario Name CarbonPrice EnergyPrices
Hydrogen Low-Low Low Low
Findings
Stretch Low-LowLowHigh-Low-High
High-High 2030 2040 2050
A high carbon price is far more powerful to drive CO2 reductions than high energy prices.
Stretch scenario that assumes a price of hydrogen of $1/kg in 2030 achieves the most rapid reduction of CO2 and the lowest annual emissions in 2050.
Hydrogen High-Low High Low Hydrogen Low-High Low High Hydrogen High-High High High
Hydrogen Stretch ($1/kg H2 starting 2030) Low High
20151050 2020
CO₂ Emissions Allocated to the PVC Chain (Million t)
WHITFIELD ET AL., PATHWAYS TO DECARBONIZE THE PVC VALUE CHAIN (2022) 92
CCS Scenarios
Findings
HydrogenCCS20151050 2020 2030 2040 2050 CO₂ Emissions Allocated to the PVC Chain (Million t)
vs Hydrogen: Stretch
Ambitious hydrogen price targets are more powerful for reducing emissions than stretch goals for CCS CapEx. We assume that the CO2 sequestration and hydrogen distribution infrastructure will not impede deployment. WHITFIELD ET AL., PATHWAYS TO DECARBONIZE THE PVC VALUE CHAIN (2022) 93 Scenario Name CarbonPrice EnergyPrices Hydrogen Stretch (Low CCS CapEx & energy consumption) Low High CCS Stretch (Low CCS CapEx & energy consumption) Low Low
WHITFIELD ET AL., PATHWAYS TO DECARBONIZE THE PVC VALUE CHAIN (2022) 94 Grid Emissions ≈ 40% CHP EmissionsPlant ≈ 36% EmissionsCracker ≈ 16% OtherFuelsProcess ≈ 5%HCl, O₂ Emissions ≈ 3% Merchant H₂ Emissions ≈ 52% Grid Emissions ≈ 33% EmissionsCracker ≈ 8% HCl/O₂ Emissions ≈ 7% Residual Emissions in 2050 All scenarios for CCS converge in 2050. Residual emissions arise primarily from the grid and CHP plants. All hydrogen scenarios nearly converge in 2050. Residual emissions arise primarily from the grid and merchant hydrogen. CCS Hydrogen 94
WHITFIELD ET AL., PATHWAYS TO DECARBONIZE THE PVC VALUE CHAIN (2022) 95 2.52.7 2.5 1.1 1.1 0.4 0.4 0.27.06.05.04.03.02.01.00.0 CCS Low Low CCS w/o grid (Million t) ProcessO2/HCl Fuels GridCHPCracker Residual Emissions for CCS Scenarios with a Decarbonized Grid Findings A decarbonized grid would reduce emissions by approximately 43% (including savings from grid-emitted carbon embodied in O2/HCl).
Residual Emissions for Hydrogen Scenarios with a Decarbonized Grid and Green Hydrogen
A decarbonized grid would reduce emissions by approximately 40% (including savings from grid-emitted carbon embodied in O2/HCl)
Using “green hydrogen” would reduce emissions by approximately 52%
A decarbonized grid and green hydrogen would reduce emissions by approximately 92%.
WHITFIELD ET AL., PATHWAYS TO DECARBONIZE THE PVC VALUE CHAIN (2022) 96 1.1 1.1 1.8 1.8 0.1 0.1 0.1 0.1 0.3 0.37.06.05.04.03.02.01.00.0 H2 H2 w/o grid H2 w/o merchant H2 w/o grid or merchant Million t MerchantCrackerO2/HCl H2 Grid Findings
.
The “Green Premium” Estimating the End-Use Cost of Decarbonized PVC
What Is the “Green Premium” for PVC?
Decarbonizing the PVC value chain will require significant new investments.
• CCS:
• The estimated cumulative CapEx of adopting CCS to decarbonize PVC production through 2050 ranges from just under $4 billion to nearly $7 billion.
• The estimated annual total cost of abatement by CCS in 2050, which includes increases in annual operating costs and 10% annual return on fixed capital, plus the carbon price paid for unabated emissions, ranges from $1.2 billion to $2.3 billion across the scenarios in that year.
• H2:
• The estimated cumulative CapEx of adopting H2 to decarbonize PVC production through 2050 ranges from $0.9 billion to $2.25 billion.
• The estimated annual total cost of abatement by H2 in 2050, which includes increases in annual operating costs and 10% annual return on fixed capital, plus the carbon price paid for unabated emissions, ranges from $1.6 billion to $3.3 billion across the scenarios in that year.
How much will these incremental costs to producers translate into price increases for PVC consumers? This value is the “GREEN PREMIUM.”
WHITFIELD ET AL., PATHWAYS TO DECARBONIZE THE PVC VALUE CHAIN (2022) 98



99 The “Green Premium” for “Clean” PVC Is Approximately 5-15% PVC2020price,domesticsales PVC2020price,exportsales Weighted2020avgprice$/t Increase in OpEx abatementfor Carbonprice Total abatementofcost equivalentPVCproduct’ntons Change in PVCcost/ttotal Change in PVCcost/ttotal avgweighted2020price PremiumGreen% 5.5% to 14.9% 2050 The PVC price in 2020 is the weighted average price of domestic shipments ($1630/t for 65% of shipments) and exports ($872/t for 35% of shipments) or $1365/t.
The Green Premium by Scenario in 2050
CCS Low-Low 8.4% (80% abatement)
CCS High-Low 10.6% (80% abatement)
CCS Low-High 9.3% (80% abatement)
CCS High-High 8.2% (80% abatement)
CCS Stretch 5.5% (80% abatement)
H2 Low-Low 9.3% (80% abatement)
H2 High-Low 11.9% (88% abatement)
H2 Low-High 12.1% (90% abatement)
H2 High-High 14.9% (90% abatement)
H2 Stretch 7.1% (90% abatement)
WHITFIELD ET AL., PATHWAYS TO DECARBONIZE THE PVC VALUE CHAIN (2022) 100
Insights for Petrochemical Industry Decarbonization Policy
Insights for Petrochemical Industry Decarbonization Policy
Introduction
• Because the study investigates just one value chain within an integrated industry, we provide insights, not recommendations.
Further research on other value chains, as well as validation of this study, will be required to develop specific recommendations
• The carbon price in the model is a stand-in for diverse policy options. It is not the only policy option that should be under consideration
• Policies can often work together and should be considered in combination with one another, in parallel and sequentially
WHITFIELD ET AL., PATHWAYS TO DECARBONIZE THE PVC VALUE CHAIN (2022)
102
Research, Development, and Demonstration • Demonstration projects that are partially funded by the public sector would likely accelerate decarbonization • Technologies embedded in the model, like CHP with CCS and cracker furnaces fueled by hydrogen, are expensive and have not been demonstrated at scale in these applications • First- to nth-of-a-kind projects may provide confidence to the private sector that such technologies will meet cost and performance specifications • Such projects are likely to be eligible for funding from DOE programs established under the 2021 Infrastructure Investment and Jobs Act and the 2022 Inflation Reduction Act • Enhanced tax incentives for private R&D spending may also provide valuable support for technology development and problem-solvingWHITFIELDETAL., PATHWAYS TO DECARBONIZE THE PVC VALUE CHAIN (2022) 103
Infrastructure • The model assumes that the infrastructure to supply hydrogen and sequester CO2 will become available when required, but it isn’t now • Recent federal legislation may jumpstart construction of hydrogen production and pipelines and CO2 pipelines and sequestration sites • Federal tax incentives may also stimulate infrastructure construction • Slow permitting could hamper infrastructure construction, although facilities along the PVC value chain are generally close to easier-to-permit offshore CO2 sequestration sites • Federal regulations for pipeline safety must be extended and enforced to ensure that new infrastructure serves its intended purposes and accidents are avoided WHITFIELD ET AL., PATHWAYS TO DECARBONIZE THE PVC VALUE CHAIN (2022) 104
Grid Decarbonization
Although the model incorporates abatement of on-site CHP plants, the grid accounts for an appreciable share of residual emissions in many scenarios
• The projections for grid decarbonization used in model (EIA’s Annual Energy Outlook) have frequently proven to be conservative in the past
• The Inflation Reduction Act is expected to accelerate emissions reductions from the power sector during the 2020s, and the Biden administration has called for the grid to be fully decarbonized by 2035.
• But the pace of decarbonization will vary from region to region. While the Gulf Coast region has abundant low-carbon resources, the states in the region have not reached a consensus on pursuing decarbonization. PVC
WHITFIELD ET AL., PATHWAYS TO DECARBONIZE THE
VALUE CHAIN (2022) 105
Incentives for Early Technology Adoption
• An investment tax credit (ITC) might be an effective tool to accelerate CCS deployment because technology decisions along this modeled pathway are sensitive to capital costs
• A production tax credit (PTC) for clean hydrogen production might speed the hydrogenbased decarbonization pathway, which is more sensitive to operating costs. Such a credit was incorporated into the Inflation Reduction Act
• The specific design features of the ITC and PTC, which may be altered by Congress at any time, can have major impacts on their effectiveness Many adoption, such as
•
alternative policies for incentivizing early
contracts for differences, are available WHITFIELD ET AL., PATHWAYS TO DECARBONIZE THE PVC VALUE CHAIN (2022) 106
“Clean” Procurement
The relatively small “green premium” in the model for low -carbon PVC suggests that “buy clean” programs could defray the costs of abatement…
• Construction is the major end-use for PVC, public sector entities that are considering “buy clean” for building materials comprise a large part of the market, and PVC costs are a small portion of overall project costs
• Implementation would be greatly aided by provisions that ensure open competition among materials for publicly-supported infrastructure projects
• Standards for “clean” PVC would need to be established and monitored such programs are likely to be difficult to implement:
• Decarbonizing PVC production requires partially decarbonizing other value chains
• Only a minority of the model’s total costs are allocated to PVC and thus included in the calculation of the green premium
• Therefore, a majority of the costs would not be defrayed by “buy clean” PVC programs unless they pay a much larger premium than the model
…but
estimatesWHITFIELD ET AL., PATHWAYS TO DECARBONIZE THE PVC VALUE CHAIN (2022) 107
Carbon Pricing
• In the modeled scenarios, a carbon price that ratchets up over time leads virtually all the facilities in the PVC value chain to abate their emissions by 2050 or earlier • Not surprisingly, starting at a higher price leads to faster emissions reductions • A predictable, rising carbon price is an attractive approach for this sector • It would allow each firm and facility to reliably plan a technology adoption pathway • It would cover all stages of the value chain • However, a chemical-sector-specific carbon fee would create challenges if substitute materials like concrete or ductile iron face a different fee structure • Neither the federal government nor the states in which the PVC value chain is located have shown an appetite for this approachWHITFIELD ET AL., PATHWAYS TO DECARBONIZE THE PVC VALUE CHAIN (2022) 108
Air Pollution Regulations
• Point-source air pollution regulation has more commonly been adopted than pollution pricing for challenges like decarbonizing chemical production in the United States in the past.
• Cracker furnaces and on-site CHP plants are the largest point sources of emissions in the value chain and would be the logical targets for such regulations
• Whether or when either of the main abatement pathways explored in our study would be considered “adequately demonstrated” or the “best system of emission reduction” and thus qualify to serve as the foundation for a pollution standard under federal law is uncertain and may depend on the success of demonstration projects
• The Supreme Court’s recent West Virginia decision suggests that EPA’s authority to impose such a standard under the Clean Air Act is likely to be contested PVC
WHITFIELD ET AL., PATHWAYS TO DECARBONIZE THE
VALUE CHAIN (2022) 109
International Trade
•
The model assumes that PVC production for both domestic consumption and for export will continue to grow, but higher prices caused by the “green premium” could undercut this assumption • “Dirty” PVC imports might be assessed a border adjustment that levels the playing field for cleaner domestic producers • Export incentives could compensate clean producers for the green premium they would be paying • At least two major challenges arise for such policies • One is the difficulty of estimating the amount of embodied carbon in any particular shipment of PVC resin • A second is avoiding protectionism and favoritism unrelated to climate goals WHITFIELD ET AL., PATHWAYS TO DECARBONIZE THE PVC VALUE CHAIN (2022) 110
Policy Priorities for Chemical Industry Decarbonization
• Immediate: Demonstration projects • Near-term:•Infrastructure planning and initial projects • Grid decarbonization • Procurement standards development • Medium-term:•Large-scale infrastructure development • Incentives for early technology adoption • “Clean” procurement programs • Longer-term:•Carbonpricing or air pollution regulations • Trade policies Appendix 6 provides a more detailed discussion of policy insights and issues. WHITFIELD ET AL., PATHWAYS TO DECARBONIZE THE PVC VALUE CHAIN (2022) 111
Opportunities for Future Research
• Validation of this study. • Use of our methodology to assess other value chemical industry chains. • Quantification of emissions and costs of other decarbonization technology options. • Detailed analysis of specific policy issues and options. WHITFIELD ET AL., PATHWAYS TO DECARBONIZE THE PVC VALUE CHAIN (2022) 112


Ronald ronaldmwhitfield@gmail.comNortheasternExecutiveWhitfieldProfessorUniversity617-581-3414 David ProfessorHart George Mason dhart@gmu.eduUniversity703-993-2279