2 minute read
AIR FREIGHT ANALYSIS


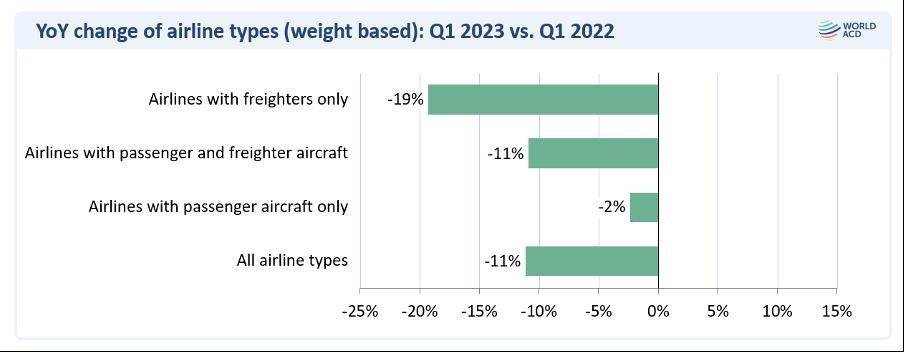
Freighters lose market share
Unsurprisingly, given the recent pandemic and market dynamics, there was also a strong difference between the relative performance of those operating all-cargo aircraft versus passenger belly capacity, consistent with the progressive return of passenger aircraft to the market as part of post-Covid recovery.
Advertisement
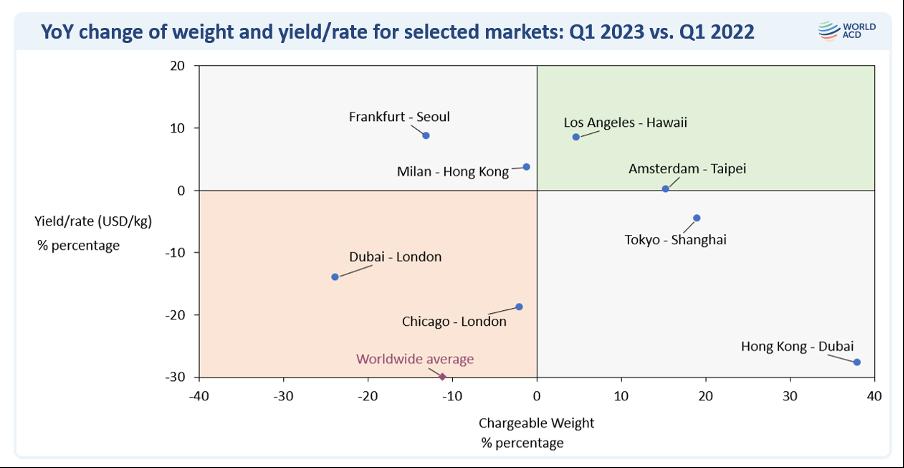
But more dramatically, while Dubai-London volumes were down by -24%, Hong Kong-Dubai tonnages rose by +38%, YoY, although average rates on that lane fell by -28% – consistent with a rise in capacity from the Far East to the Middle East, due in part to the war in Ukraine and some post-Covid reopening of Asian markets.
Pharma deep-dive
Last but by not least, WorldACD has done an extra-deep analysis of the dynamics of the Pharma/Temp market to reveal some highly noteworthy trend developments, particularly by splitting the Pharma/Temp category into two subcategories: shipments requiring Active cooling versus those using Passive cooling or temperature-control methods. Active cooling represents 10.6% of the total Pharma/Temp volume in Q1 of 2023, versus 10.3% last year.
Freighter operators experienced the largest decline (-19%) in traffic volumes compared with last year, while airlines with only passenger aircraft performed best (-2%). Airlines operating both passenger and freighter aircraft fell somewhere in the middle, recording a -11% drop in tonnages.
Key trade lanes differ
A selection of some key lanes highlights that many lanes experienced weight and rate trends that are significantly different from the worldwide average of -11% and -31%, respectively. For example, Frankfurt-Seoul recorded a -13% decline in volumes, but a +9% rise in average yields, with Milan-Hong Kong seeing a much smaller volume decline (-1%) but also achieved a rise (+4%) in average rates.
The Pharma/Temp category as a whole – which accounts for around 4.1% of total worldwide flown air cargo and includes Pharma and other temperature-controlled non-perishables products – saw a worldwide rise in Q1 of almost +1% (+0.7%), YoY, partly thanks to a significant rise (+4.5%) in shipments requiring Active temperature control or cooling. In contrast, shipment volumes using Passive temperature control grew just +0.3% during this period, on a global basis.
This analysis becomes even more interesting when we examine specific lanes or origin and destination markets. WorldACD’s analysis reveals that the top 10 origins for shipments using Active cooling technology in 2023 Q1 were: USA, Germany, Switzerland, Italy, France, Belgium, Ireland, India, and Austria. Among these, the four largest countries (USA, Germany, Switzerland, Italy) account for 56% of Active worldwide volumes.
Continuing strong growth in major markets
Within this group, shipments using Active cooling are growing by more than 10%, YoY, from the following origins: France (+113%), Belgium (+65%), Italy (+17%), Germany (+14%), Netherlands (+14%). Among the top 10, there were declines ex-USA (-9%), Austria (-8%) and ex-India (-5%).
In terms of destination markets, WorldACD has identified the top 10 destinations for Active cooling in Q1 2023 as: USA, China, Brazil, Japan, Canada, Australia, Switzerland, Taiwan, Belgium, South Korea, with the four largest destinations (USA, China, Brazil, Japan) accounting for 54% of worldwide volume in Active cooling.
Among this group, shipments flown using Active cooling grew by more than 10%, YoY, to the following destinations: Taiwan (+81%), USA (+44%), and Japan (+13%), with double-digit declines to China (-39%), Australia (-29%), South Korea (-18%), Brazil (-17%), and Belgium (-15%).
Region to region, the two largest regional markets (Europe to North America and Europe to Asia Pacific) account for 55% of worldwide volume in Active cooling, with double-digit YoY growth on Europe to North America (+45%), North America to MESA (+22%) and Europe to MESA (+15%).
But analysing specific origin and destination markets also reveals significant growth in certain parts of the Passive Pharma/Temp market, which still makes up almost 90% of Pharma/Temp shipments. For example, there was double-digit percentage growth from top origin markets including Italy (+45%), Ireland (+16%), India (+13%), the Netherlands (+13%) and Switzerland (+12%). And Passive Pharma/Temp shipments continued to rise to key Asia Pacific destination markets such as Taiwan (+34%), China (+20%), South Korea (+13%) and Australia (+8%), plus also to Brazil (+6%).


