2 minute read
AIR CARGO ANALYSIS REVEALS BIG VARIATIONS BEHIND Q1 DECLINES


In-depth examination by WorldACD of global demand and pricing figures in the first quarter of 2023 highlights markets, lanes and product types still recording gains or deviating significantly from the worldwide average, plus other underlying trends
In-depth analysis of global air freight demand and pricing figures in the first quarter (Q1) of 2023 reveals some big variations behind the overall declines, with some markets, lanes and product types still recording gains and others deviating significantly from the worldwide average, according to WorldACD Market Data.
Advertisement
As the air cargo data specialist reported earlier this month, worldwide air cargo chargeable weight flown in the first quarter (Q1) of 2023 ended up -11% below that of the equivalent period last year (Q1 2022). But a deep-dive into WorldACD’s data reveals that behind those figures there is a tremendous amount of variation globally, depending on factors such as origin point or region, product type, shipment weight, and whether cargo was flown via freighter or passenger belly capacity.
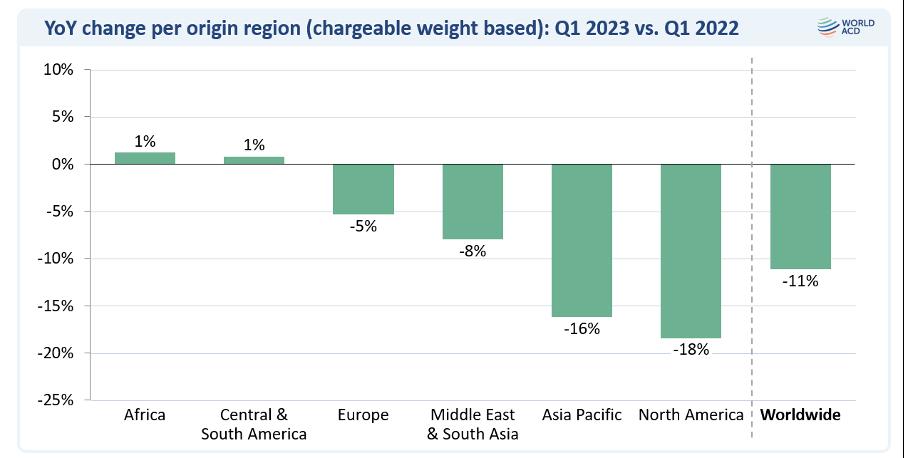
Big drops ex-Asia Pacific and North America
For example, the overall tonnage performance of the different main origin regions ranges from a +1% year-on-year (YoY) rise in air cargo volumes originating from Africa and from Central & South America (C&S America) to a decline of -18% from North America and a -16% drop from Asia Pacific, with Europe at -5% and Middle East & South Asia (MESA) closer to the average at -8%.
Breaking down those origin figures further reveals that the -16% drop from Asia Pacific includes a -24% decline in intra-Asia traffic and a -21% fall in traffic to North America, and more-modest declines to Europe (-10%) and Africa (-9%), YoY, despite a capacity rise of +7% ex-Asia Pacific. But that total -16% figure also hides a +30% rise in traffic ex-Asia Pacific to C&S America and a +9% rise to MESA.
Meanwhile, the -18% drop from North America comes despite a capacity rise of +9% and includes a -29% decline to Asia Pacific markets, compared with Q1 2022.
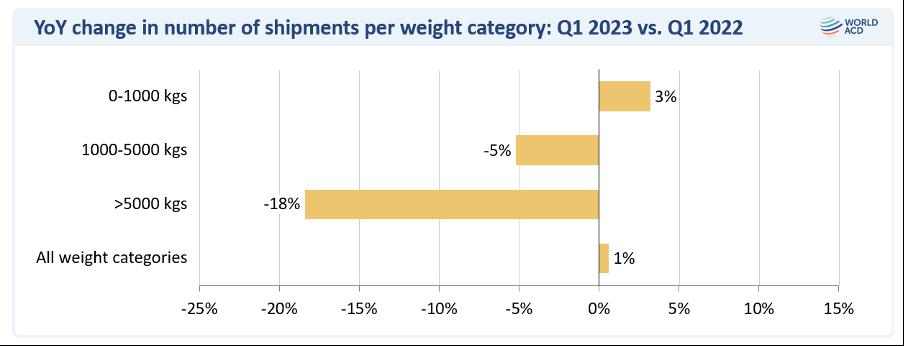
Smaller shipments keep growing
Also highly revealing is an examination of the demand profiles of different shipment weight bands, which highlights a continuing trend towards smaller shipments, correlated with the ongoing growth of e-commerce. Analysis by WorldACD reveals that shipments up to 1000 kgs increased by +3%, YoY, whereas those in the 1000-5000 kgs bracket decreased by -5% and the total tonnage of shipments greater than 5000 kgs decreased very significantly in Q1, by -18%.
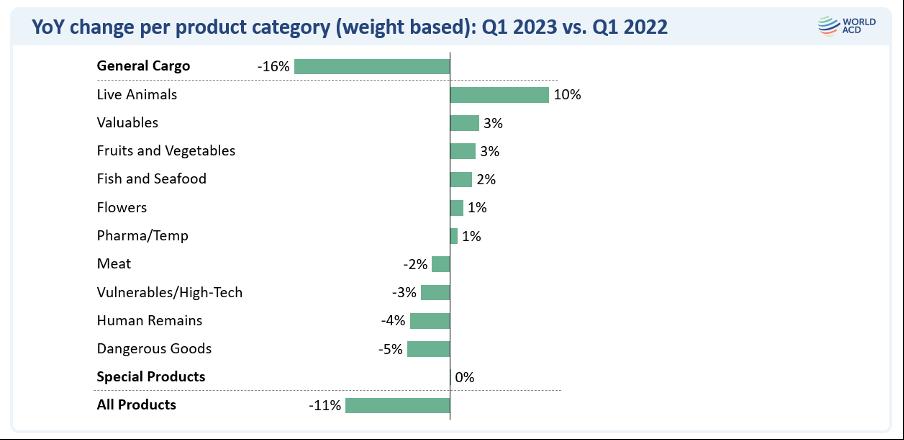
Live Animals recorded the biggest growth (+10%), with moremodest gains for Valuables (+3%), Perishables (+2%) – including Fruit & Vegetables (+3%), Fish & Seafood (+2%) and Flowers (+1%) – and Pharma/Temp products (+1%). However, there were modest declines on certain other product types including Dangerous Goods (-5%), Human Remains (-4%), Vulnerables/High-Tech (-3%), and Meat products (-2%) that meant demand for special products as a whole remained flat at 0% in Q1, YoY.
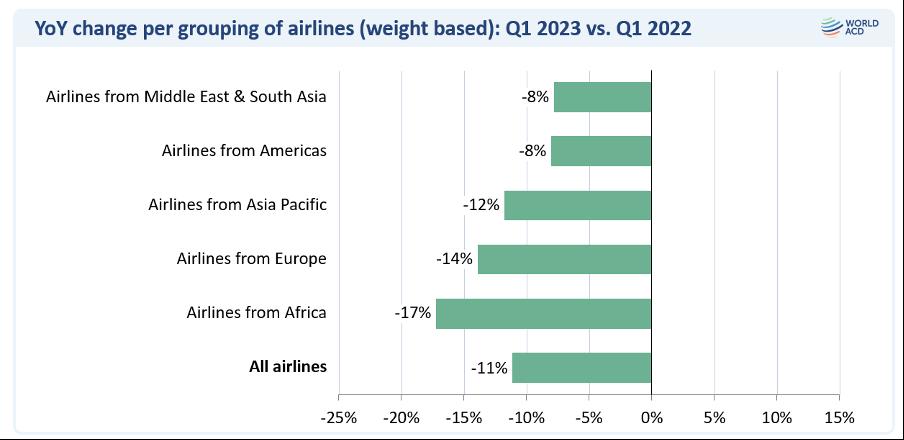
From a carrier perspective, the overall decline in global demand was shared relatively evenly in terms of airlines’ regional geographic bases, although airlines from MESA (-8%) and the Americas (-8%) did best, and airlines from Africa experienced the greatest drop in cargo (-17%), with carriers from Asia Pacific (-12%) and Europe (-14%) performing slightly below the global average.
Perishables market stable
Zooming in on the relatively stable Perishables markets, where total worldwide overall volumes were up by +2%, we can see some significantly different performances among the top origin countries and between different Perishables categories.
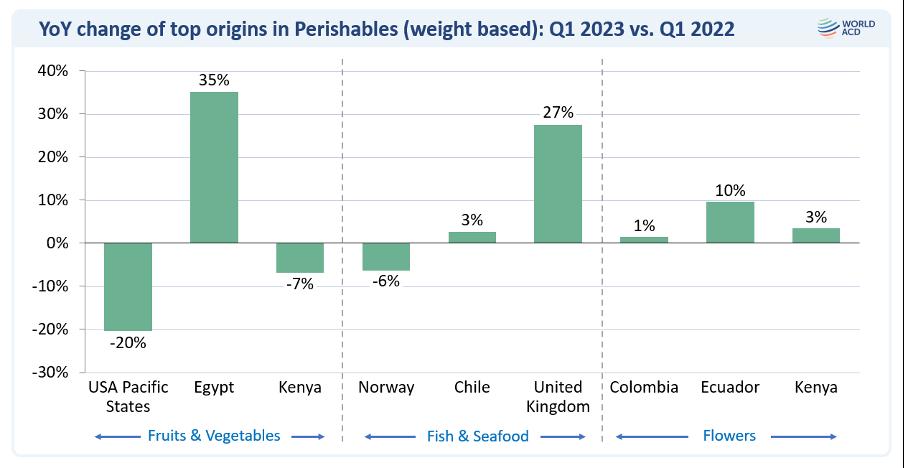
For example, while Fruits and Vegetables ex-US Pacific states were down -20%, YoY, demand from Egypt rose by +35%. And although Fish & Seafood tonnages from Norway were down -6%, they rose by +3% from Chile and +27% from the UK. And shipments of Flowers from Ecuador rose by +10% whereas demand from Colombia was more or less stable (+1%) and increased by around +3% from Kenya.
Variability among products
Examining the results on a product or verticals level, there is also considerable variation. Continuing a long-term trend towards a growing importance of special products, General Cargo experienced the biggest decline, falling -16%, YoY, whereas the various special products categories saw either a much more modest decline or growth in some verticals.


