
A Strategic Blueprint for the Region’s Future A Strategic Blueprint for the Region’s Future
A Strategic Blueprint for the Region’s Future A Strategic Blueprint for the Region’s Future
We recognize our Visionary Cities for their commitment to partnership and regional collaboration, as their leadership will be instrumental in advancing the Fort Bend 2050 vision and helping translate strategy into meaningful action for our community’s future.

















We gratefully recognize our Visionary Sponsors, whose leadership and investment underwrote this publication; their partnership not only made this work possible but will continue to serve as a vital resource as we advance the Fort Bend 2050 vision.










Fort Bend County stands at a defining moment. As one of the fastest-growing regions in the nation, our population is projected to nearly double—approaching two million residents by 2050. This level of growth presents extraordinary opportunity, but also a clear responsibility: to ensure that our infrastructure, workforce, and systems are aligned to support a thriving, competitive region for decades to come.
The Fort Bend Regional Partnership commissioned the Fort Bend 2050 Study to better understand what lies ahead—and to provide a strategic, data-driven framework to guide decision-making across our community. This effort reflects our commitment to proactive leadership. Rather than reacting to growth, we believe Fort Bend County must anticipate it, plan for it, and position itself to lead.
The findings of this report reinforce a central truth: growth alone does not guarantee long-term success. Our ability to remain economically competitive and maintain a high quality of life will depend on how well we align critical systems with where and how our community is expanding. From mobility and transportation capacity, to water and drainage infrastructure, to energy reliability and workforce readiness, the path forward requires coordination, investment, and shared vision.
Fort Bend 2050 is more than a study—it is a roadmap. It is designed to inform business leaders, guide policymakers, and support community stakeholders as we collectively navigate the challenges and opportunities ahead. Most importantly, it serves as a call to action. The future of Fort Bend County will be shaped by the decisions we make today. By working together—across sectors and jurisdictions—we can ensure that our region not only grows, but thrives.
We are proud to lead this effort and grateful to the many partners who have contributed their insight and leadership along the way. We invite you to engage with this work and join us in shaping the future of Fort Bend County.
Fort Bend Regional Partnership Executive Council
Tariq Zafar, Chair
Sidney Evans, Chair-Elect
Jim Rice, Immediate Past-Chair
Keith Borgfeldt, Treasurer
Jared Jameson, Fort Bend Regional Business Council Chair
David Oliver, Legal Counsel
Keri Schmidt, CCE, IOM, President & CEO
The Fort Bend 2050 Study was commissioned by the Fort Bend Regional Partnership to provide a data-driven, forward-looking assessment of the county’s growth and long-term needs. Led by Dr. Jeronimo Cortina of the University of Houston, the study was developed through a comprehensive and collaborative process that included regional surveys, expert interviews, focus groups, and engagement with industry leaders across various sectors. This approach ensures the findings reflect both quantitative analysis and the real-world perspectives of those shaping and experiencing Fort Bend County’s continued growth.
Fort Bend County enters the second half of the decade from a position of strength, but also with a clearer set of governing challenges than at any previous stage in its growth trajectory. The county remains one of the region’s primary engines of population and household expansion, with growth large enough not only to add residents, but to reshape how Fort Bend functions on a daily basis. Population is projected to rise from 822,779 in 2020 to 953,983 in 2025 and 1,073,554 by 2030, while households grow from 311,705 to 355,521 over the same five-year period. By 2050, the population will double that of the beginning of the decade. At the same time, the county’s daytime operating footprint is becoming more substantial, meaning that transportation, emergency response, commercial services, and public systems must increasingly be calibrated not only to where people live, but to where they work, travel, and spend time during the day.
Yet the core message of this report is that growth itself is not Fort Bend’s principal challenge. The larger challenge is whether the county can align growth with capacity, and whether it can do so in a way that preserves quality of life while strengthening long-run competitiveness. The report shows a county entering a more complex phase of development: one in which rapid expansion and densification are producing high-pressure corridors, growth nodes, and development edges, while a broader set of mature neighborhoods increasingly require reinvestment, maintenance, and quality-of-life stabilization. This is, in effect, a two-speed county. Some places require forward-looking infrastructure sequencing and growth management; others require a stronger state-of-good-repair strategy, neighborhood stabilization, and service modernization. That uneven geography matters because counties do not lose competitiveness only when they stop growing. They lose competitiveness when infrastructure, service delivery, and public coordination fail to keep pace with where growth is actually occurring.
That is why this report places quality of life at the center of the Fort Bend 2050 agenda. Quality of life is not a secondary outcome to be addressed after economic development, infrastructure, or public services are handled. It is increasingly the measure through which economic performance, household stability, and government effectiveness are experienced in everyday life. Mobility, drainage, water reliability, power readiness, housing attainability, access to health-supporting environments, public safety, and responsive public institutions all shape whether growth feels like opportunity or burden. In that sense, Fort Bend’s long-run advantage will depend less on whether new households continue to arrive and more on whether the county can remain reliable, livable, and governable at the scale of growth it is already producing. Counties that manage that transition well retain talent, strengthen employer confidence, protect household resilience, and avoid the hidden costs that accumulate when systems lag behind demand.
Economically, the county’s fundamentals remain exceptionally strong. Fort Bend continues to benefit from high incomes, high educational attainment, a large professional workforce, and robust consumer spending capacity. But the report also shows that prosperity and pressure are arriving together. Housing values are rising quickly, household formation is outpacing population growth, and a growing daytime footprint is reshaping service demand. These trends can strengthen the tax base and expand market activity, but they also raise the stakes for affordability, workforce stability, and land-use efficiency. When housing costs rise faster than attainable options for essential workers, younger households, and moderate-income families, the county risks deepening a jobs-housing mismatch that later appears as longer commutes, labor-force friction, turnover, and uneven access to opportunity. A diversified housing pipeline, including ownership opportunities, strategically located rental supply, and missing-middle options, is therefore not simply a housing concern; it is part of Fort Bend’s broader economic development strategy. Employers recruit from housing markets, and counties that preserve attainable, well-located housing protect both workforce participation and local economic dynamism.
Transportation illustrates most clearly how competitiveness and quality of life now converge. The report estimates that peak-period congestion imposes roughly $158 million in annual weekday economic losses, making delay not just an inconvenience but a recurring productivity drag on households and firms. Congestion reduces reliability, narrows the effective labor market, and increases the hidden cost of doing business. For households, long and unreliable travel times consume hours that would otherwise go to family care, health appointments, school engagement, and community life. For employers, they raise logistics costs, complicate scheduling, and weaken the county’s attractiveness to time-sensitive industries. That is why Fort Bend 2050 treats mobility not as a simple road-building agenda, but as a system objective that includes corridor management, bottleneck relief, targeted transit expansion, public transportation options, and demand management strategies that recover time and improve reliability. In a fast-growing county, preserving quality of life increasingly means preserving predictable movement.
Water, drainage, and power readiness function in a similar way. They are no longer background technical systems; they are growth gates. The report makes clear that Fort Bend has a strong base in drainage and flood control, but that the county’s next competitive step is to move toward a broader multi-benefit OneWater strategy that aligns water supply, reuse, subsidence constraints, ecological stewardship, and growth geography. Likewise, electric reliability and interconnection readiness increasingly shape whether high-value development can proceed with confidence. In both cases, infrastructure reliability has become part of the county’s economic identity. Jurisdictions that can demonstrate predictable water, drainage, and power capacity have a clear advantage in attracting employers, sustaining investment confidence, and protecting property values over time.
The report also underscores that social conditions and place-based vulnerability are not peripheral concerns to be addressed separately from growth strategy. Fort Bend’s at-risk populations, including older adults, residents with disabilities, households with transportation constraints, and those facing limited English proficiency or poverty, are interwoven throughout the county’s broader growth pattern. Similarly, food-access gaps, deprivation, and co-burden geographies of poor mental and physical health reveal that quality of life is unevenly distributed across place. These patterns matter because weak access to health, mobility, language support, and routine services can translate into lower workforce stability, lower educational engagement, higher public costs, and weaker long-term resilience. For that reason, language access, navigation systems, age-friendly planning, and place-based health interventions should be understood not as add-ons, but as part of the county’s productivity infrastructure. A stronger quality-of-life environment is also a stronger labor-market and public-service environment.
Fort Bend’s development future should also continue to include agriculture. As the report notes, preserving a viable agricultural footprint is not a nostalgic argument against suburban growth; it is a strategy for resilience, economic diversification, land stewardship, and flood-sensitive open space. Agriculture remains part of Fort Bend’s productive landscape and identity, and incorporating it into the county’s long-range economic and land-use agenda strengthens rather than weakens a balanced growth strategy. A county that can grow while still protecting productive working lands is better positioned to retain flexibility, ecological function, and a broader mix of economic activity over time.
Ultimately, the findings of this report point to one overarching conclusion: Fort Bend’s next decade will be defined less by whether growth continues and more by whether the county can convert that growth into performance. That means aligning growth with infrastructure capacity, treating reliability as a core public asset, modernizing permitting and coordination, sustaining reinvestment in aging systems, protecting housing attainability, strengthening multimodal mobility, and investing in the institutional capacity needed to manage a county of this scale and complexity. The larger goal is straightforward but demanding: to ensure that rising population, rising economic activity, and rising expectations are matched by rising quality of life. Fort Bend 2050 is therefore not simply a growth plan. It is a quality-of-life agenda, a competitiveness agenda, and an implementation agenda for the next phase of the county’s future.
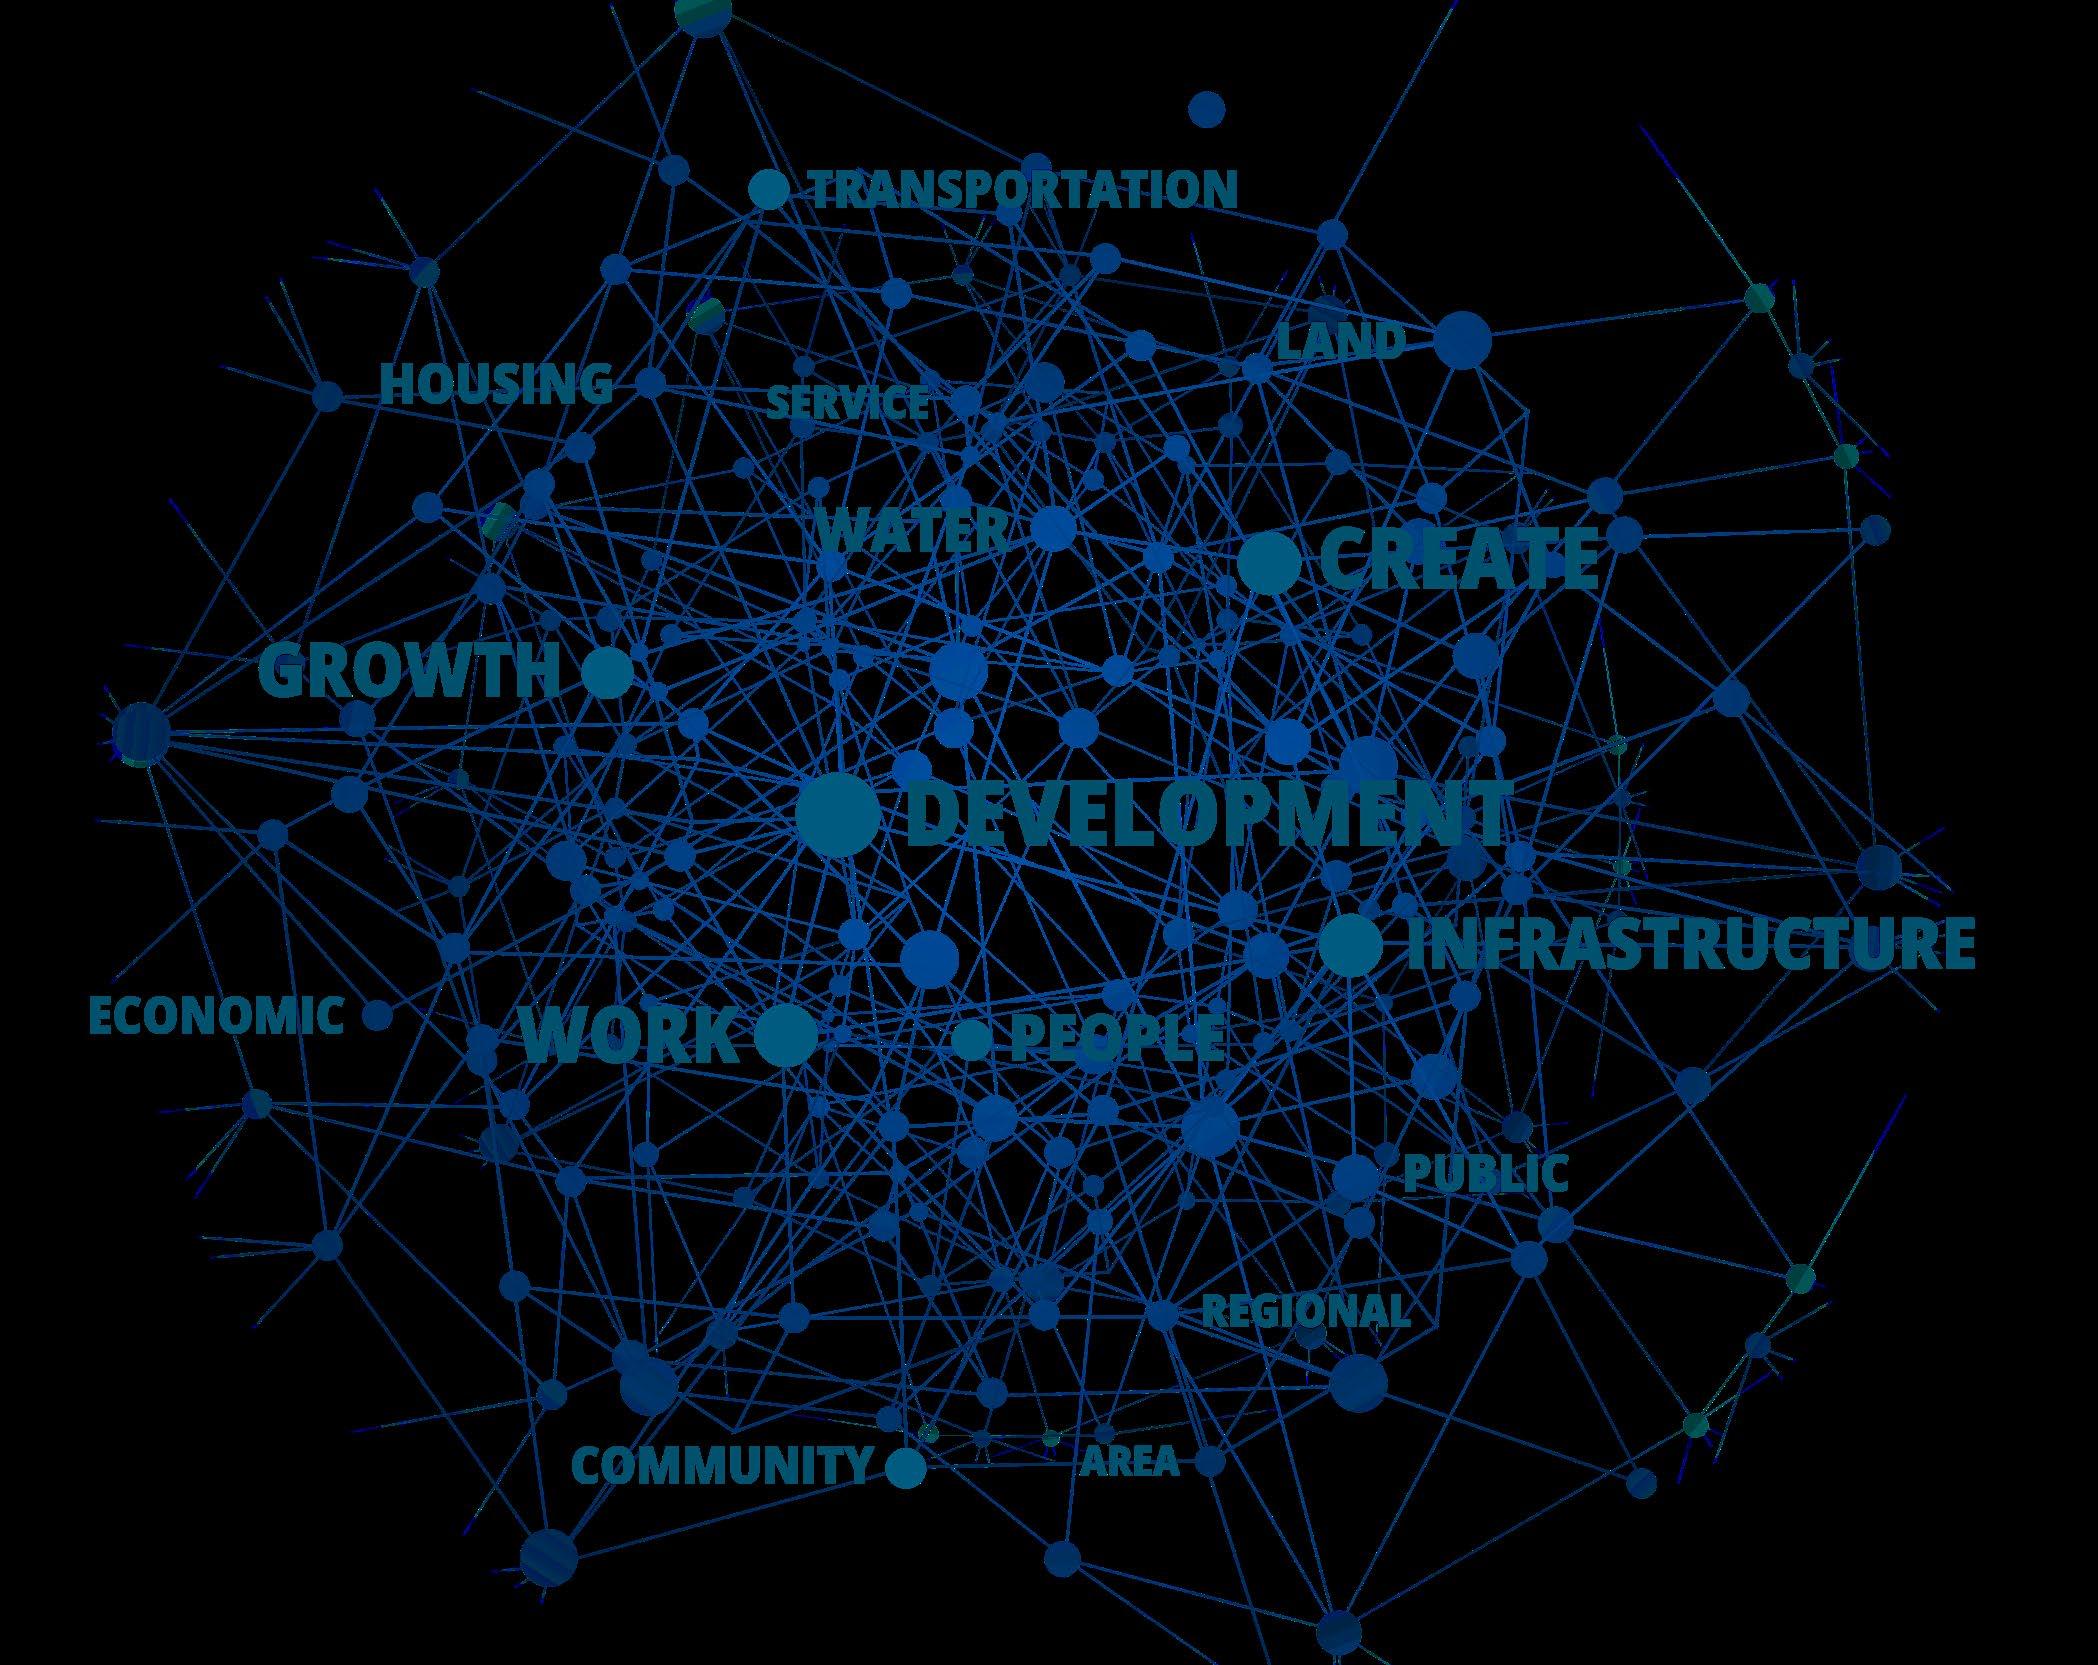
Figure 1. Word Cloud. The most emphasized themes are “development,” “infrastructure,” “work,” “growth,” and “create,” suggesting stakeholders are focused on managing rapid growth through infrastructure investment and job/economic expansion. A second tier of frequently used terms—“transportation,” “housing,” “water,” “public,” “economic,” “land,” “area,” “people,” “community,” “service,” and “regional”—points to priorities around mobility, housing supply/ affordability, water systems, and coordinated planning.
Stakeholders that participated in the engagement survey converge on a single operating reality: Fort Bend’s next decade will be defined less by whether growth occurs and more by whether the county can convert rapid growth into a self-sustaining, high-quality region with resilient infrastructure, a stronger commercial base, and clear cross-jurisdiction coordination. Stakeholders consistently prioritize mobility and economic competitiveness, framing congestion, long commutes, and infrastructure lag as immediate constraints on quality of life and long-run development outcomes.
In the ranking exercise, transportation and mobility infrastructure and economic development/job creation rise clearly to the top, followed by population growth/housing needs and education/workforce development. Water resources and energy/power resilience appear as next-tier constraints, often treated as “growth gates”—systems that must scale in advance of development rather than being retrofitted after pressures intensify.
Open-ended feedback reinforces three major signals. First, respondents believe Fort Bend has been planned as a bedroom community and must pivot toward job centers, shovel-ready sites, and a more diversified industry mix. Second, respondents repeatedly describe governance and delivery systems (permitting, asset tracking, interagency coordination) as siloed and not designed for the pace of growth. Third, commuting burdens and limited transportation alternatives are seen as a root cause of household stress, employer attraction challenges, and inequitable access to opportunity—driving calls for real public transit options alongside targeted roadway investments.
(N=72)
Transportation & mobility infrastructure
Economic development & job creation
Population growth & housing needs
Education & workforce development
Water resources
Energy & power resilience
Housing affordability & stability
Public health & healthcare access
Crime prevention
Public safety & emergency preparedness
Environmental sustainability
Technology & innovation readiness
Parks, recreation & quality of life
Mean rank (lower = higher priority)
0246810
Respondents frame transportation as the county’s most immediate constraint: congestion and long commutes are already shaping daily life and the county’s competitiveness. Stakeholders do not describe mobility as a single-project problem; they describe a structural mismatch between growth form (housing-led expansion) and a transportation system still built primarily for single-occupancy vehicles. This produces higher household costs, time loss, and uneven access to work, services, and amenities.
Planning signal: Fort Bend 2050 should adopt a mobility strategy with three tracks—(1) corridor performance and bottleneck relief, (2) bus/park-and-ride and rapid service expansions, and (3) serious rail/rapid transit feasibility and right-ofway preservation—tied explicitly to where job centers and mixed-use nodes are targeted.
Stakeholders repeatedly describe Fort Bend as planned for a bedroom-community model. The survey indicates strong support for a pivot toward a more self-sustaining economic hub—anchored by job centers, shovel-ready sites, and a selective industry strategy (technology/innovation, manufacturing/logistics, healthcare/life sciences, and education/research). Respondents also express concern about incentives that shift costs to the public while privatizing gains, urging a more disciplined, partnership-based approach to recruitment.
Planning signal: The county’s competitive posture should emphasize predictable delivery (site readiness, permitting timelines, utility capacity) as much as incentives. Fort Bend 2050 should define what “high-value” employers mean in practice: wages, local hiring pathways, infrastructure contributions, and long-term civic partnerships.
Water resources and energy/power resilience sit just below the top tier in the ranking exercise, but narrative comments treat them as gating constraints. Respondents emphasize the risks of drought and limited potable water supply, flood exposure and runoff impacts, and grid readiness for an expanded population and modern, energy-sensitive industries. Several comments directly link these risks to displacement and inequity, warning that unmanaged runoff and flood management decisions can shift burdens onto the most vulnerable.
Planning signal: Fort Bend 2050 should adopt explicit development readiness standards that require demonstrated capacity plans for water/drainage and power, while mobility impacts are evaluated.
Across the open-ended responses, stakeholders describe permitting and planning technology as siloed and not designed for collaboration or the pace of growth. Respondents call for modern solutions, expert consultation on complex projects, clearer communication channels with the public, and case studies/best practices from peer regions. The collaboration rating item reinforces that respondents see coordination as uneven and in need of improvement.
Planning signal: Fort Bend 2050 should function as a shared “operating system”—common metrics, shared data, predictable processes, and decision rules that align cities and the county around the same growth-readiness standards.
Fort Bend County enters the second half of the decade as one of the region’s primary growth engines, with expansion that is large enough to reshape not only where people live, but how the county functions day-to-day. The baseline story is straightforward: the population rises from around 800,000 in 2020 to an estimated 954,000 in 2025 and is projected to exceed 1 million by 2030, alongside rapid household formation (roughly 311,000 households in 2025 to 355,000 by 2030). This growth is accompanied by a steady shift in the county’s “daily operating footprint,” including a sizable daytime population tied to employment and travel patterns—meaning transportation, public safety, commercial services, and emergency response must be calibrated to peak daytime demand, not only to residential totals.
The county’s growth is also increasingly spatially uneven. At the block-group level, projected 2025–2030 population change is overwhelmingly positive but typically modest, while a small set of breakout places drive disproportionately large gains. This creates a two-speed county: high-pressure growth nodes where marginal demand for roads, drainage, utilities, parks, and public services will rise quickly, and mature neighborhoods where growth is steady, flat, or slightly declining—places where the planning posture shifts toward reinvestment, maintenance, and quality-of-life stabilization rather than greenfield expansion. Density trends reinforce this point. Between 2010 and 2030, the “floor” of density rises meaningfully across the distribution, indicating broad-based suburban urbanization rather than growth confined to a few already-dense areas. Operationally, that pushes the county toward a future where multimodal mobility, corridor management, and service delivery in more compact environments become central—not optional add-ons.
Economically, Fort Bend’s fundamentals remain strong, but the results show how prosperity and pressure can coexist. The county’s income and human capital profile is high by national standards, and consumer spending patterns signal robust purchasing power. At the same time, housing is moving up the value ladder quickly: by 2025, roughly half of owner-occupied units are valued at $400,000+, rising to nearly two-thirds by 2030, with median home value projected to climb substantially. The housing pipeline itself is projected to expand strongly through 2030—predominantly owner-led—while renter growth is real but highly concentrated in a small number of hotspot block groups. This combination matters for affordability and workforce stability. Even in a high-income county, near-threshold affordability becomes a planning risk when prices rise faster than the incomes of essential workers and younger households, and when “renter hotspot” lease-ups produce rapid, localized demand shocks for schools, traffic operations, and service calls.
Public finance and market activity measures point in the same direction: broad growth with increasing concentration. Between 2025 and 2030, total expenditures rise sharply countywide, but the upper tail grows faster than the middle, and the geography becomes more “peaky” over time—meaning a smaller set of places captures a larger share of total dollars and added growth. For implementation, this is a warning against treating countywide averages as sufficient for resource allocation. The practical risk is not simply underestimating total demand; it is misallocating capacity—overbuilding in stable areas while under-serving the corridors and areas where growth is most intense.
Vulnerability is also embedded within growth. Fort Bend’s at-risk population is not a single neighborhood story; it is interwoven into the county’s broader diversity and household structure. Large absolute counts of residents facing disability-related needs, aging, limited English proficiency, transportation constraints (including zero-vehicle households), and poverty imply that “universal” systems—clear communications, resilient infrastructure, streamlined service navigation—must be paired with targeted delivery strategies where barriers compound. Language access emerges as core service infrastructure, particularly given the intersection of limited English proficiency and older age. These conditions shape public health access, emergency preparedness, and the effectiveness of routine county programs.
Place-based well-being indicators sharpen where layered interventions are most needed. Supermarket access gaps are present but uneven, and socioeconomic deprivation (as measured by Area Deprivation Index [ADI] deciles) is concentrated in a relatively small share of block groups—yet the overlap between the two is limited. That weak relationship is a crucial policy signal: food-access geography and deprivation are related but distinct problems that require different tools, with a small set of “dual-burden” block groups standing out as priority targets for integrated action (mobility and retail access paired with affordability and household supports). Health measures tell a parallel story. Poor mental health and poor physical health vary substantially by tract and move together strongly, identifying a set of co-burden tracts where integrated behavioral health access, chronic disease prevention, and navigation supports are likely to yield the highest returns in quality of life and productivity.
Finally, the infrastructure results tie growth directly to competitiveness. Electricity demand is modeled as highly sensitive to temperature and time-of-day patterns, with baseline demand rising as population grows—supporting a “power-ready” economic development agenda that emphasizes reliability, peak management, and faster interconnection pathways. Water analysis frames Fort Bend’s current drainage-centered approach as strong but incomplete: the county is effective at detention and flood control, yet the long-run opportunity is to transcend single-purpose projects and move toward a multi-benefit “OneWater” strategy that aligns growth, subsidence constraints, surface-water conversion timelines, reuse, and ecological stewardship. Transportation findings translate congestion into a recurring economic loss, with monetized delay signaling a real drag on productivity and reliability ($158 million dollar per year loss only during weekdays)—and commuting-time hotspot data adding an equity-and-competitiveness layer that strengthens the case for phased, practical public transportation and demand management.
Taken together, the results point to a single governing theme for Fort Bend 2050: growth is not the challenge; mismatch is. The county’s next decade will be defined by how well it aligns where growth is occurring with where capacity—mobility, water, power, housing variety, and human services—can credibly keep pace.
The report draws on several core data sources to assess Fort Bend Countyʼs growth, infrastructure, and quality-of-life needs. Demographic, housing, income, labor force, consumer spending, market, affordability, Tapestry, commuting, and crime-risk indicators come from ESRI’s (Environmental Systems Research Institute) demographic and market datasets. The analysis also uses ACS 5-year data for at-risk population indicators, PolicyMap-related measures for supermarket access and area deprivation, ERCOT and local weather data for power-demand modeling, Texas Water Development Board Region H data for water planning, and TxDOT data for traffic and congestion analysis.
Fort Bend County continues to operate as one of the region’s primary growth engines. The county’s population rose from 585,379 in 2010 to 822,779 in 2020 and is projected to reach 953,983 in 2025 and 1,073,554 by 2030. That implies sustained expansion through the end of the decade (about 2.39% average annual growth from 2025 to 2030), alongside rapid household formation (from 311,705 households in 2025 to 355,521 by 2030; ~2.67% annually). At the same time, Fort Bend’s economic profile remains distinctive: high incomes, high educational attainment, and a workforce concentrated on white-collar and service-sector jobs. These fundamentals are paired with increasing diversity, gradual aging, and an ongoing shift toward higher-priced housing stock—trends that matter for infrastructure, housing affordability, and service delivery.
Population growth is not only adding residents; it is reshaping the county’s daily rhythm. In 2025, the total daytime estimated population of 788,544 comprised approximately 292,894 workers and 495,650 residents present during typical work hours. This daytime footprint underscores the importance of transportation capacity, employment centers, commercial services, and emergency response systems that are scaled to daytime demand—not just nighttime residency. Households are projected to grow faster than population, with average household size drifting from 3.11 in 2020 to 3.05 in 2025 and 3.01 by 2030, consistent with gradual household fragmentation and maturation of the county’s age structure.
Housing supply is projected to keep pace with growth: housing units increase from 277,910 in 2020 to 330,130 in 2025 and 376,095 in 2030. Tenure is expected to remain predominantly owner-occupied (roughly 73–74% owner occupancy in 2020–2030), although renter occupancy remains substantial (about 20–22%). The value distribution indicates a continued upward shift in the housing stock. In 2025, about 50.1% of owner-occupied units are valued at $400,000 or more, rising to roughly 64.5% by 2030. The share valued at $500,000+ grows from
about 31.6% in 2025 to 43.9% in 2030. Median home value is projected to rise from $399,817 in 2025 to $470,424 in 2030.
Affordability signals are mixed. The 2025 Housing Affordability Index of 90, alongside an estimated 22.2% of income going to mortgage costs, and a Wealth Index of 132. In practice, this combination often reflects a county with strong purchasing power and asset accumulation, but with affordability pressure for middle-income households as the market tilts toward higher values. Policy and planning discussions should treat affordability as a moving target: the county’s growth model depends on sustaining a broad workforce and ensuring that housing options exist across price points and household types.
Fort Bend’s income profile is a defining characteristic. Median household income is estimated at $112,620 in 2025 and projected to reach $126,305 by 2030; per capita income rises from $48,145 to $53,123 over the same period. In 2025, approximately 56.0% of households are in the $100,000+ income bands (including 22.5% at $200,000+). By 2030, the $100,000+ share increases to about 61.2%, with 26.4% at $200,000+. Lower-income households remain present—about 19.3% under $50,000 in 2025, falling to 15.7% by 2030—which is an important reminder that prosperity is not uniform and that targeted supports and inclusive service delivery remain necessary.
Fort Bend’s median age has risen steadily (35.0 in 2010; 37.1 in 2020) and is projected at 37.6 in 2025 and 38.0 by 2030. The county remains relatively family-oriented, with sizeable cohorts in working-age and child-bearing years, but the senior population is growing. Residents aged 65+ account for about 13.8% of the population in 2025 and are projected to reach roughly 15.3% by 2030. This shift implies increasing demand for age-friendly transportation design, accessible housing, preventive health services, and emergency preparedness tailored to older residents.
Household structure data reinforces the county’s family profile. In 2020, married-couple households represented about 63.4% of all households, and multi-person households were common (only 15.3% were one-person households; 21.4% were four-person households; and 10.5% were five-person households). At the same time, single-parent and non-traditional household forms are a significant share of the community, with implications for childcare capacity, school planning, and the design of social services.
Fort Bend is among the most diverse large counties in Texas, and diversity continues to deepen. The diversity index is estimated at 85.8 in 2025 and rises to 86.4 by 2030. In 2025, the population is estimated at roughly 31.6% White alone, 21.5% Black alone, 23.3% Asian alone, and 25.0% of Hispanic origin (which overlaps racial categories). By 2030, White alone declines to about 29.7%, while Asian alone increases to about 24.3%, and Hispanic origin rises to about 26.3%. This pattern suggests that the county’s comparative advantage will increasingly depend on culturally competent service delivery, inclusive civic engagement, and economic development strategies that leverage multilingual and multicultural talent.
Human capital indicators are a major strength. Among residents age 25+, an estimated 31.1% hold a bachelor’s degree and 20.9% hold a graduate/professional degree, meaning roughly 52.0% have at least a bachelor’s degree. This education profile is consistent with the county’s occupational mix: about 74.1% of employed residents are in white-collar occupations, with large shares in professional roles (32.0%) and management/business/financial roles (23.4%).
Labor force conditions in 2025 appear tight and favorable. Of the civilian labor force (age 16+), the unemployment rate is estimated at 3.7%. Employment by industry is dominated by services (51.5%), followed by retail trade (10.7%), manufacturing (8.3%), and finance/insurance/real estate (7.2%), with construction at 5.9%. For planning, this means: (1) continued demand for office, medical, professional, and education-related space; (2) a logistics and retail ecosystem that tracks population growth; and (3) a workforce that is sensitive to commute times and regional mobility constraints.

“The University of Houston is strategically collaborating with the Fort Bend Regional Partnership to advance the region’s long-term growth and competitiveness. Across UH’s Sugar Land and Katy campuses, we are intentionally aligning academic programs with evolving industry needs while building clear, outcome-driven pathways from education to employment. This focused approach strengthens the local talent pipeline, supports workforce resilience, and positions Fort Bend County for sustained economic success.”
Dr. Jay Neal
Associate
Vice President of Academic Affairs & Chief Operating Officer
University of Houston Sugar Land & Katy Campuses
Consumer spending estimates underscore Fort Bend’s purchasing power relative to national norms (ESRI's Spending Potential Index values above 100 indicate above-average spending). In 2025, shelter spending is estimated at roughly $10,301,391,550, with an average of $33,049 per household and an index of 124. Food at home totals about $2,800,539,819 (index 121) and food away from home totals about $1,644,735,421 (index 128). Health care spending is substantial at approximately $2,949,469,418 (index 122). Travel spending is also elevated (about $1,430,236,071; index 127), and support payments/cash contributions show a notably high index (137), which often aligns with philanthropic capacity and inter-household transfers. Taken together, these patterns reflect a county with strong middle- and upper-income consumption, an expanding base of professional households, and robust demand for quality-of-life amenities.

Three near-term implications follow from this profile. First, the county’s scale and pace of growth require forward-looking infrastructure planning—particularly transportation, drainage, and utilities—calibrated to both resident growth and daytime population activity. Second, the housing market is moving up the value ladder. That trend supports tax base growth but can tighten affordability for essential workers and younger households; it elevates the importance of a diversified housing pipeline (starter homes, missing-middle options, and well-located multifamily) and strategic partnerships with municipalities and developers. Third, a more diverse and slightly older population will place a premium on service delivery that is culturally competent and age-friendly, including public health outreach, language access, and program design that reflects varied household structures.
Overall, Fort Bend County’s community profile points to a county that is growing rapidly, diversifying steadily, and maintaining strong economic fundamentals. The county’s opportunity is to translate these fundamentals into resilient systems—housing, mobility, public health, civic capacity, and infrastructure—that keep pace with growth while protecting affordability and quality of life.
“With the significant recent growth and anticipated expansion of the community, Fort Bend needs to be proactive to provide the best possible infrastructure for its residents. Huitt-Zollars, Inc. is proud of the steps that the Fort Bend Regional Partnership is taking with the Fort Bend 2050 report to maintain a quality of life while planning for the future.”
Katherine Mears, PE, ENV SP Vice President & Managing Principal Huitt-Zollars
Between 2000 and 2025, Fort Bend County’s population increased from around 354,000 to almost 954,000—a net gain of almost 600,000 residents (169.2% growth; roughly 2.69x the 2000 base). Over the 25-year period, this corresponds to an average compound annual growth rate (CAGR) of 4.0%.
> Fastest expansion occurred in 2000–2010 (+230,951, 38.5% of total 2000–2025 growth), followed by continued strong gains through 2025.
> Growth remained broad-based but concentrated: the top 10 block groups (ranked by absolute growth) accounted for about 23.3% of countywide growth; the top 50 accounted for about 56.4%.
Sources: Esri, TomTom, Garmin, FAO, NOAA, USGS, © OpenStreetMap contributers, and the GIS User Community
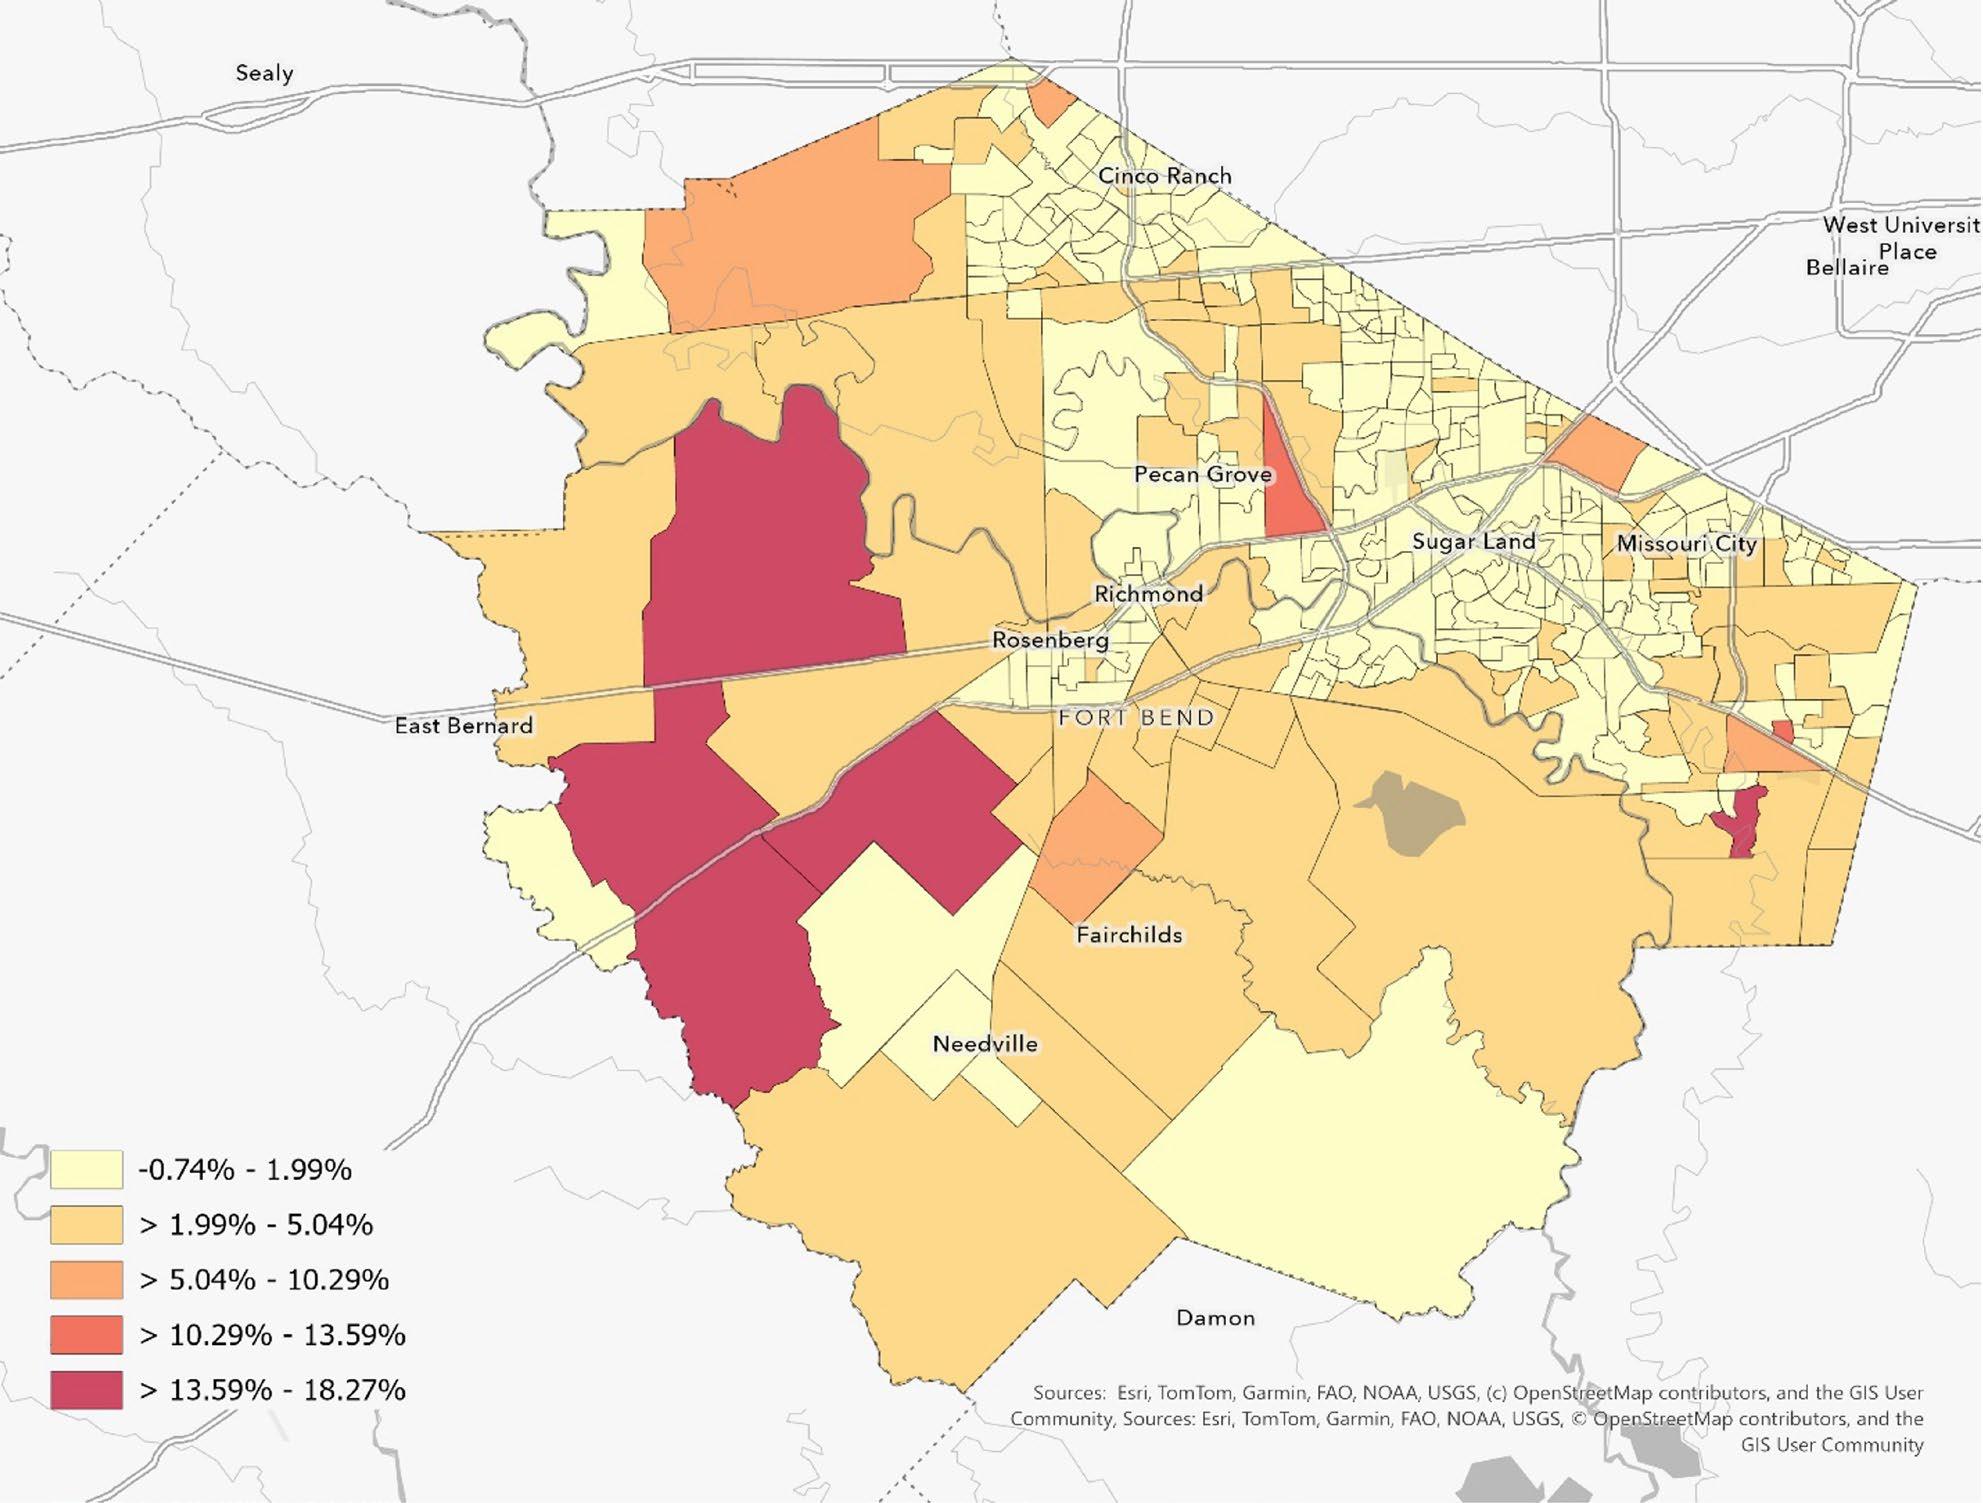
Figure 3. 2025-203 Population Compound Annual Growth Rate showing how fast the population is growing each year, on average, in different parts of Fort Bend County. Lighter areas are growing slowly or are roughly flat, while darker orange/red areas are growing the fastest—up to about 14–18% per year—meaning those neighborhoods are adding residents much more rapidly over the period measured.
The county’s sustained growth—nearly one million residents by 2025—has predictable implications for infrastructure and service demand. Three takeaways stand out from the periodized and block-group patterns:
1. Capacity planning should assume continued net additions on the order of ~120,000–130,000 residents per five-year period in the near term, absent a major economic slowdown or housing supply constraint.
2. Because growth is concentrated, marginal demand will be especially acute in the fastest-growing block groups—often where new subdivisions, schools, road capacity, and utility extensions are expanding simultaneously.
3. Mid-decade estimates (2015, 2025) are useful for detecting turning points between Censuses, but for compliance, funding formulas, and benchmarking, decennial counts (2000, 2010, 2020) should remain the primary reference points.
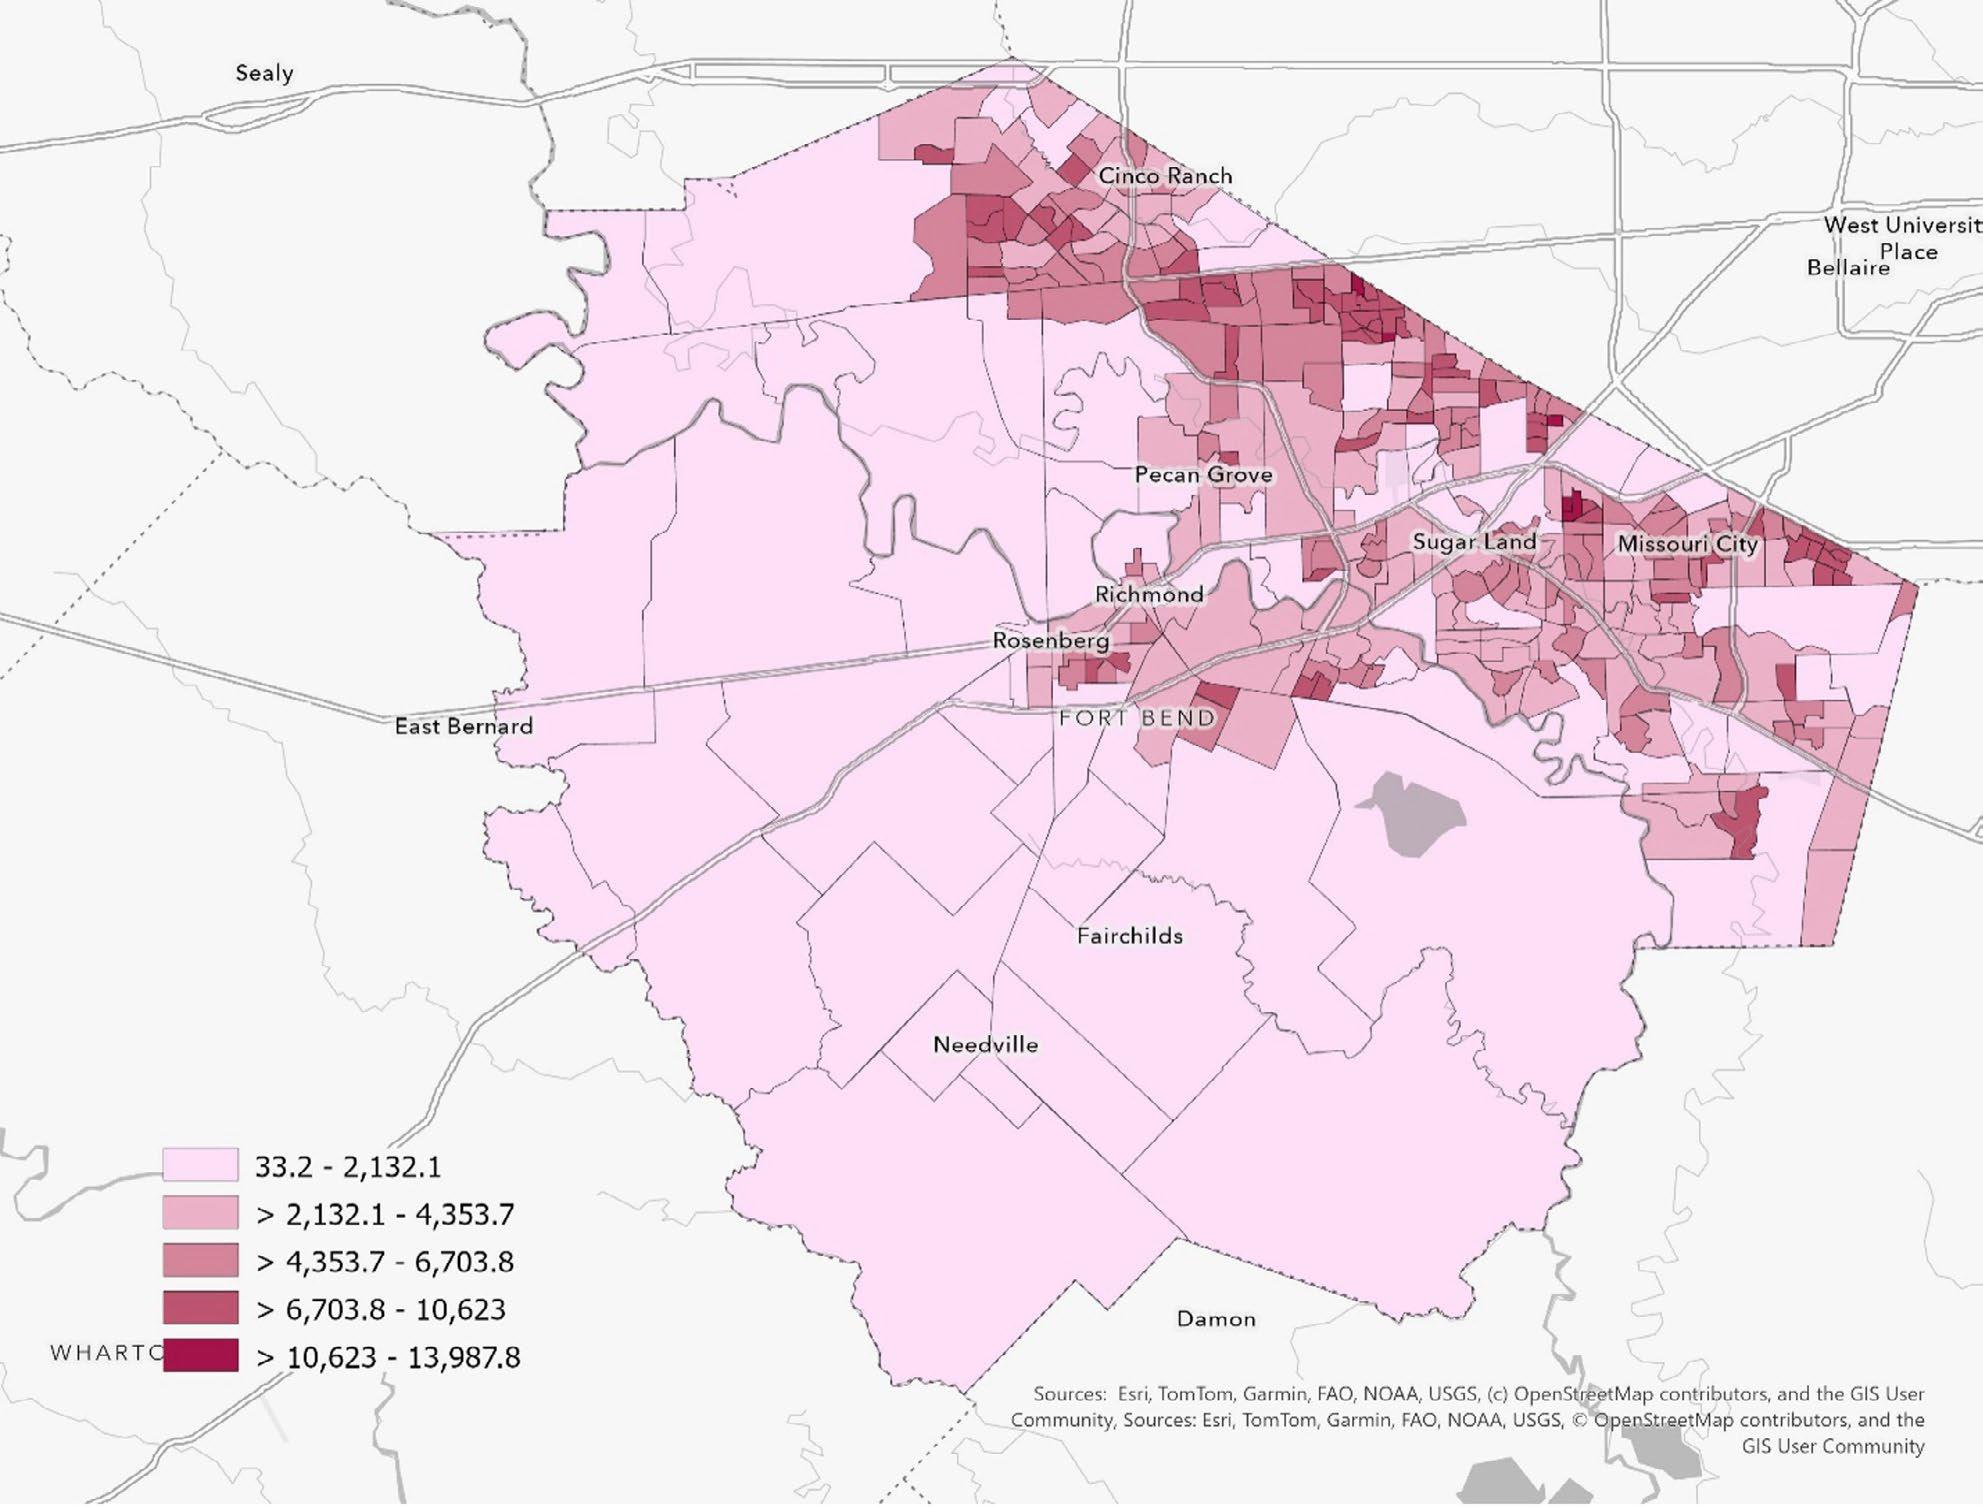
Overall, Fort Bend County’s block-group population density rises steadily from 2010 to 2030. Across the county’s 366 census block groups, mean density increases from 3,489 to 4,398 persons per square mile (+26.0%), and the median increases from 3,109 to 4,101 (+31.9%). Importantly, the lower end of the density distribution shifts upward, signaling that growth is not confined to a handful of already-dense areas; rather, many lower-density block groups become meaningfully more suburban/urban in character over time.
Key findings:
> The countywide density “floor” rises: the 25th percentile increases from 1,142 (2010) to 2,668 (2030), indicating broad-based infill and subdivision development.
> Low-density block groups (<1,000 persons/sq mi) shrink from 23.5% of block groups in 2010 to 8.7% in 2030.
> The 5,000–7,999 band grows from 20.2% to 30.3%, reflecting a larger set of “urbanizing” suburban places.
> Densification is uneven: a subset of block groups shows very large jumps in density between 2010 and 2030 (often from a low baseline), consistent with greenfield buildout and subsequent intensification.
> Countywide Density Trajectory
> Figure 4 summarizes the overall trend. The sharpest step-up occurs from 2010 to 2020, when both the mean and median rise materially. Growth continues into 2025 and 2030, with another notable increase by 2030. Interpreted substantively, the county’s typical neighborhood environment moves further away from exurban density levels and toward a more consistently suburban/urban pattern—an important signal for infrastructure, mobility, service delivery, and land-use decisions.
"At Johnson Development, every community is designed for living, engaging and celebrating life. In order to accomplish this, it takes collaboration with many public and private partners working together on thoughtful and intentional land planning, infrastructure and community design. By investing in resilient and sustainable systems, we can create communities that not only meet today’s needs but endure for generations. Johnson Development is committed to that growth in Fort Bend County and together, these efforts position all stakeholders for long-term economic strength and quality of life.”
Trey Reichert Senior Vice President,
Houston Land Development Operations Johnson Development Corp.
Sources: Esri, TomTom, Garmin, FAO, NOAA, USGS, © OpenStreetMap contributers, and the GIS User Community
Figure 4. 2030 Population Density (population per square mile). Population density is computed by dividing the total population within the geographic area by the total land area. Darker pink areas are the most densely populated (more people packed into a smaller area—typically more urban/suburban neighborhoods), while lighter pink areas have fewer people per square mile (more spread out, often larger-lot or rural areas).d.
Table 1 summarizes the overall trend. The sharpest step-up occurs from 2010 to 2020, when both the mean and median rise materially. Growth continues into 2025 and 2030, with another notable increase by 2030. Interpreted substantively, the county’s typical neighborhood environment moves further away from exurban density levels and toward a more consistently suburban/urban pattern—an important signal for infrastructure, mobility, service delivery, and land-use decisions.
Table 1. Distribution summary of block-group density (persons per square mile). The county’s median density increases by roughly one-third from 2010 to 2030, and the 25th percentile more than doubles. That pattern indicates broad densification—not only a heavier upper tail, but also substantial increases among historically lower-density block groups.
Figure 5 reports the share of block groups in each band over time. The county experiences a clear rebalancing away from very low density (<1,000) and toward moderate-to-higher density categories, especially the 2,500–4,999 and 5,000–7,999 bands.
Figure 5. Share of block groups by density band.
Across Fort Bend County, projected population change for 2025-2030 is overwhelmingly positive but mostly modest. The typical (median) block group is projected to grow by 1.24%, and the middle half of block groups fall between 1.14% and 1.99%. Growth is concentrated in a small number of breakout areas: only 10 block groups exceed 5% growth, but those outliers reach as high as 18.27%. At the other end of the distribution, some more established neighborhoods are projected to decline (lowest: -0.74%).
> Growth intensity is concentrated in (1) Sienna and the south/southeast growth engine, (2) the Rosenberg area edge (often outside city limits), and (3) the westward development interface near Katy/Fulshear.
> Most established communities (e.g., Sugar Land, much of Missouri City, Houston-adjacent areas) show steady growth in the 1-2% range, with isolated pockets above 2.5%.
> Declines and near-stagnation cluster primarily in mature northeast neighborhoods (Mission Bend, Four Corners) plus a handful of isolated block groups in Richmond, Sugar Land, Cinco Ranch, and Rosenberg.
Taken together, the block-group results imply a two-speed county: a small set of growth nodes where short-horizon demand will rise quickly, and a larger set of mature neighborhoods where growth is steady or flat. The recommendations below translate those findings into an implementation frame.
> Prioritize capacity planning for the top growth nodes: Sienna, Fresno, the Rosenberg-area edge, the westward interface near Katy/Fulshear, and localized spikes in Stafford and Missouri City.
> Treat unincorporated growth adjacent to cities as a first-order planning geography. More than onethird of block groups are unincorporated, and the unincorporated category contains multiple countywide top-10 growth hot spots.
> Separate ‘growth management’ from ‘stabilization/ reinvestment’ strategies. Mission Bend, Four Corners, and parts of Cinco Ranch/Sugar Land display flat or negative growth signals that align with mature-neighborhood needs rather than expansion needs.
> Transportation and mobility: rising density typically increases travel demand, intersection pressure, and the value of multimodal connections (sidewalks, trails, transit-supportive design).
> Water, wastewater, and drainage: broad-based densification shifts peak demand and can stress systems built for lower-intensity development; stormwater design becomes especially important where impervious cover grows rapidly.
> Parks and community facilities: as densities rise, access to neighborhood-scale parks and schools becomes more consequential; planning may require smaller, more distributed facilities rather than fewer large ones.
> Housing mix and land-use: the increasing share of block groups in the 5,000–7,999 and 8,000+ bands suggests a growing footprint of townhomes, multifamily, and compact subdivisions—useful signals for future housing policy and zoning discussions.
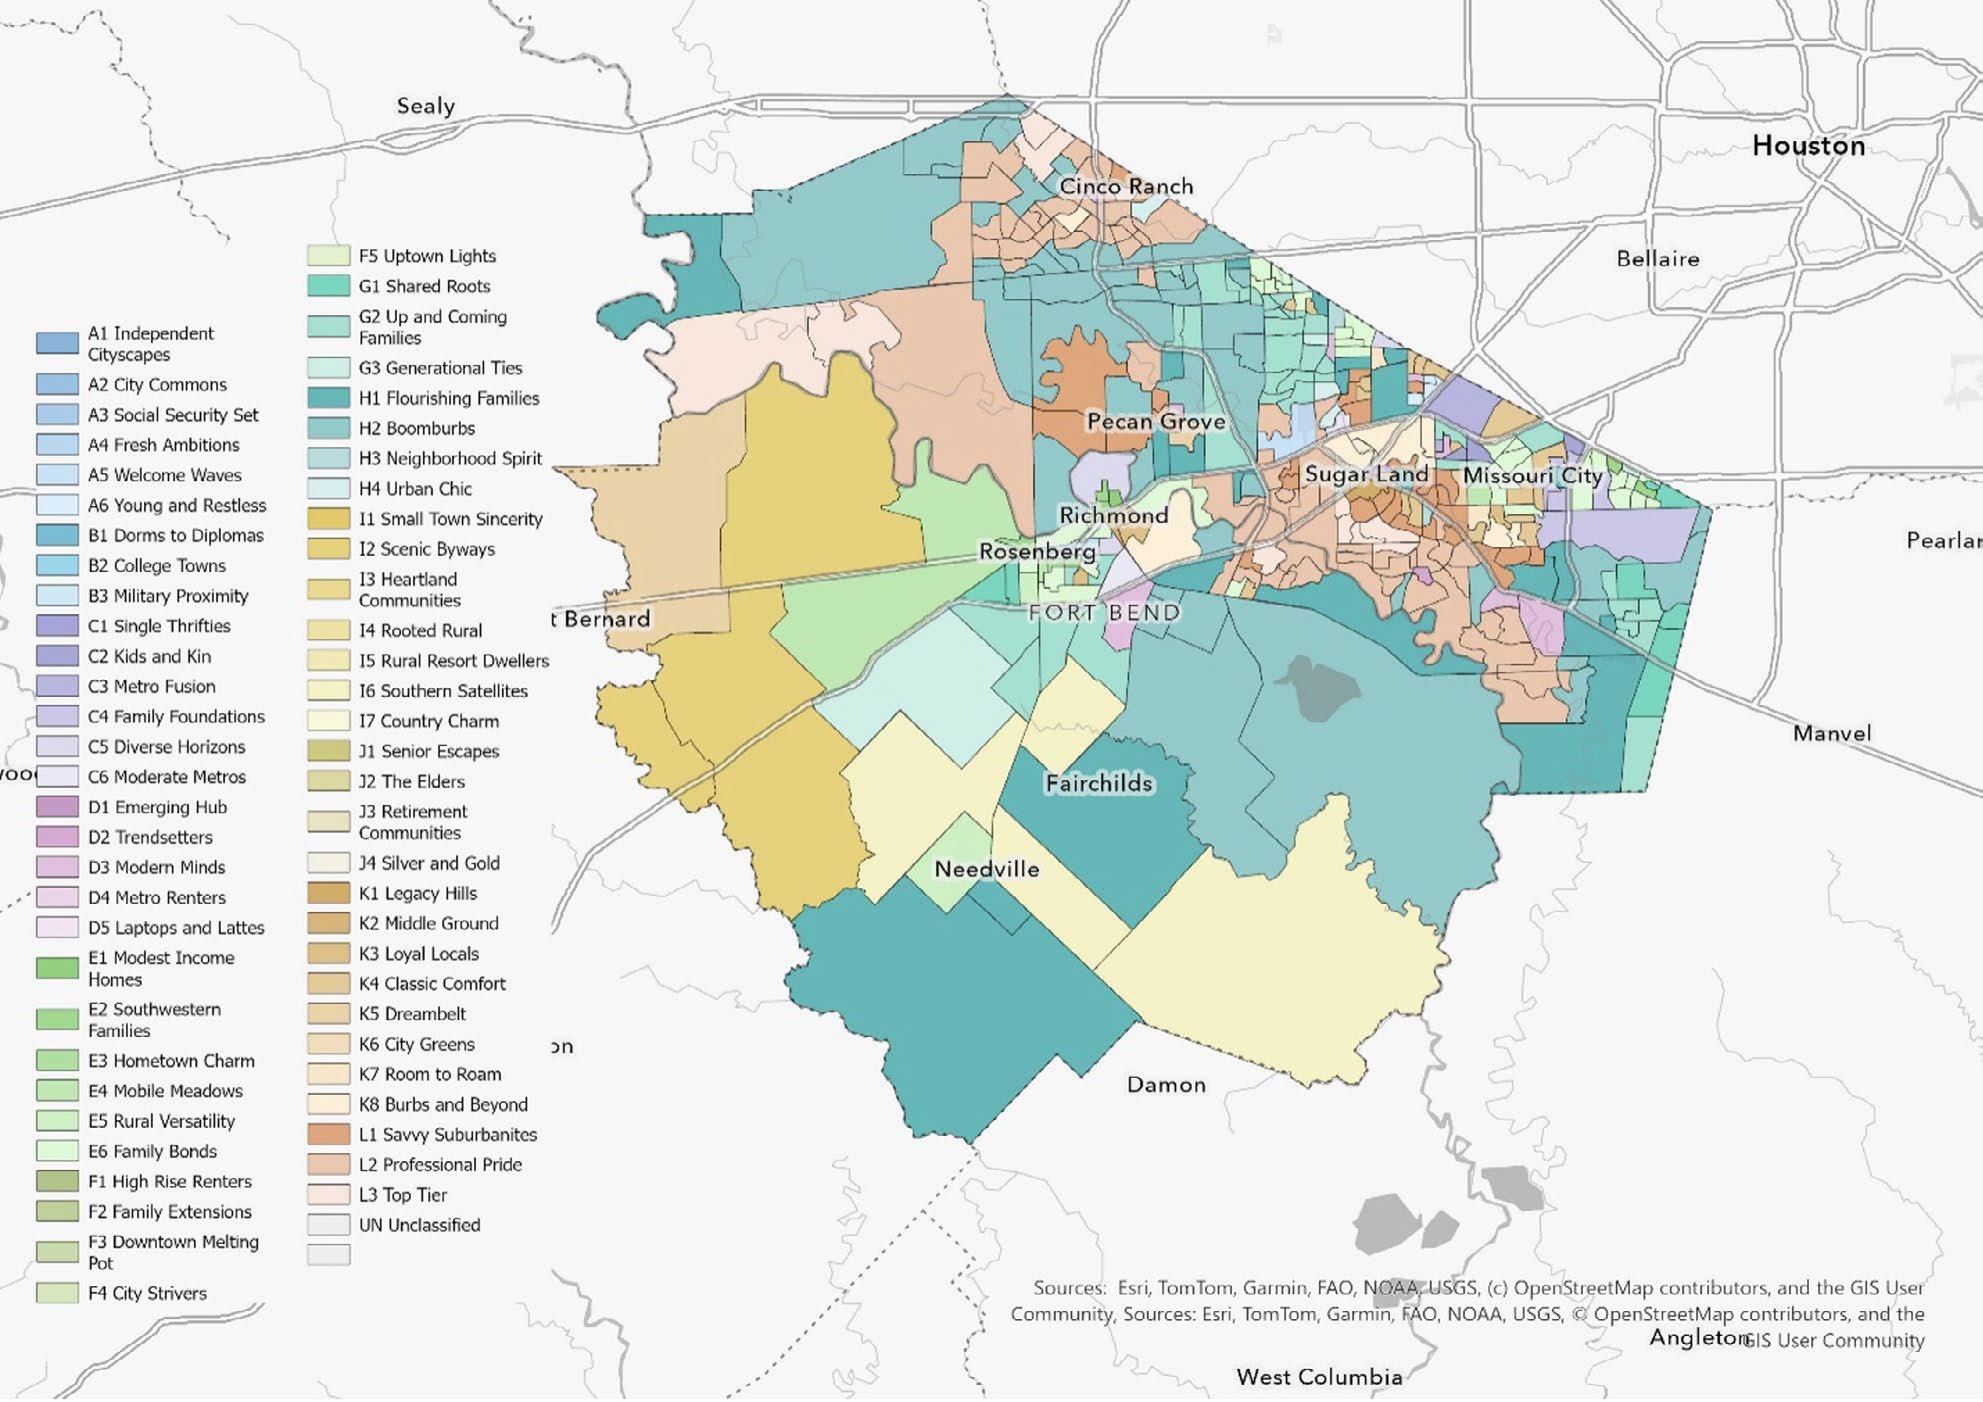
Fort Bend’s dominant-segment geography is anchored by suburban growth and household formation, with three major threads: (1) higher-income professional suburbs, (2) high-earning and fast-growing family suburbs, and (3) multigenerational and culturally diverse family neighborhoods. A smaller but meaningful share of block groups are dominated by urban-professional segments, typically aligning with denser nodes and rental dynamics.
The most common dominant segment is the denominated Professional Pride (Mature and Retired Living) — Married, high-income tech households. It appears as the dominant segment in 71 block groups (19.4%). These are typically high-capacity suburban neighborhoods where expectations for service reliability, schools, and quality-of-life amenities are elevated.
The clustering is especially visible in tracts with three or more dominant block groups, including: Riverstone, Greatwood, Cinco Ranch, and Colony Lakes.
This segment is the second most common: Boomburbs (Family Portraits) — High-earning suburban families. In planning terms, these areas are often where family-service demand concentrates—parks, youth programming, school capacity, and car-oriented mobility needs. This clustering is particularly visible in Seven Meadows, along FM 762 Rd.
Up and Coming Families (Family Portraits) — suburbanites with diverse family structures, education, and employment is a strong signal of growth edges and newer household formation—places where neighborhood identity and service needs can shift rapidly over time. Clustering is particularly visible in Four Corners and eventually in the western part of the County.
Flourishing Families (Family Portraits) — Large suburban families in growing developments. Where the planning posture is often about sustaining quality-of-life as subdivisions mature—keeping pace with incremental growth while maintaining affordability and performance.

Family Bonds (Family Portraits) — multigenerational families with immigrant and non-English speakers is the fourth most common dominant segment. This is a core audience for countywide initiatives. It signals multigenerational households and, often, language diversity—conditions where culturally competent outreach and language access materially change program reach.
This is a meaningful mid-tier dominant segment: Classic Comfort (Mature and Retired Living) — aging suburbanites with multiple vehicles. These segments tend to signal established suburban zones where the planning needs often shift toward maintenance, aging infrastructure, and adapting services for older or longer-tenured households.
Modern Minds (Contemporary Households) — urban, educated, affluent households with commutes is the most common urban-professional dominant segment in the county. While the footprint is smaller than the suburban-family and suburban-professional segments, these block groups often sit in denser nodes where corridor planning, rental dynamics, and multimodal mobility become central.
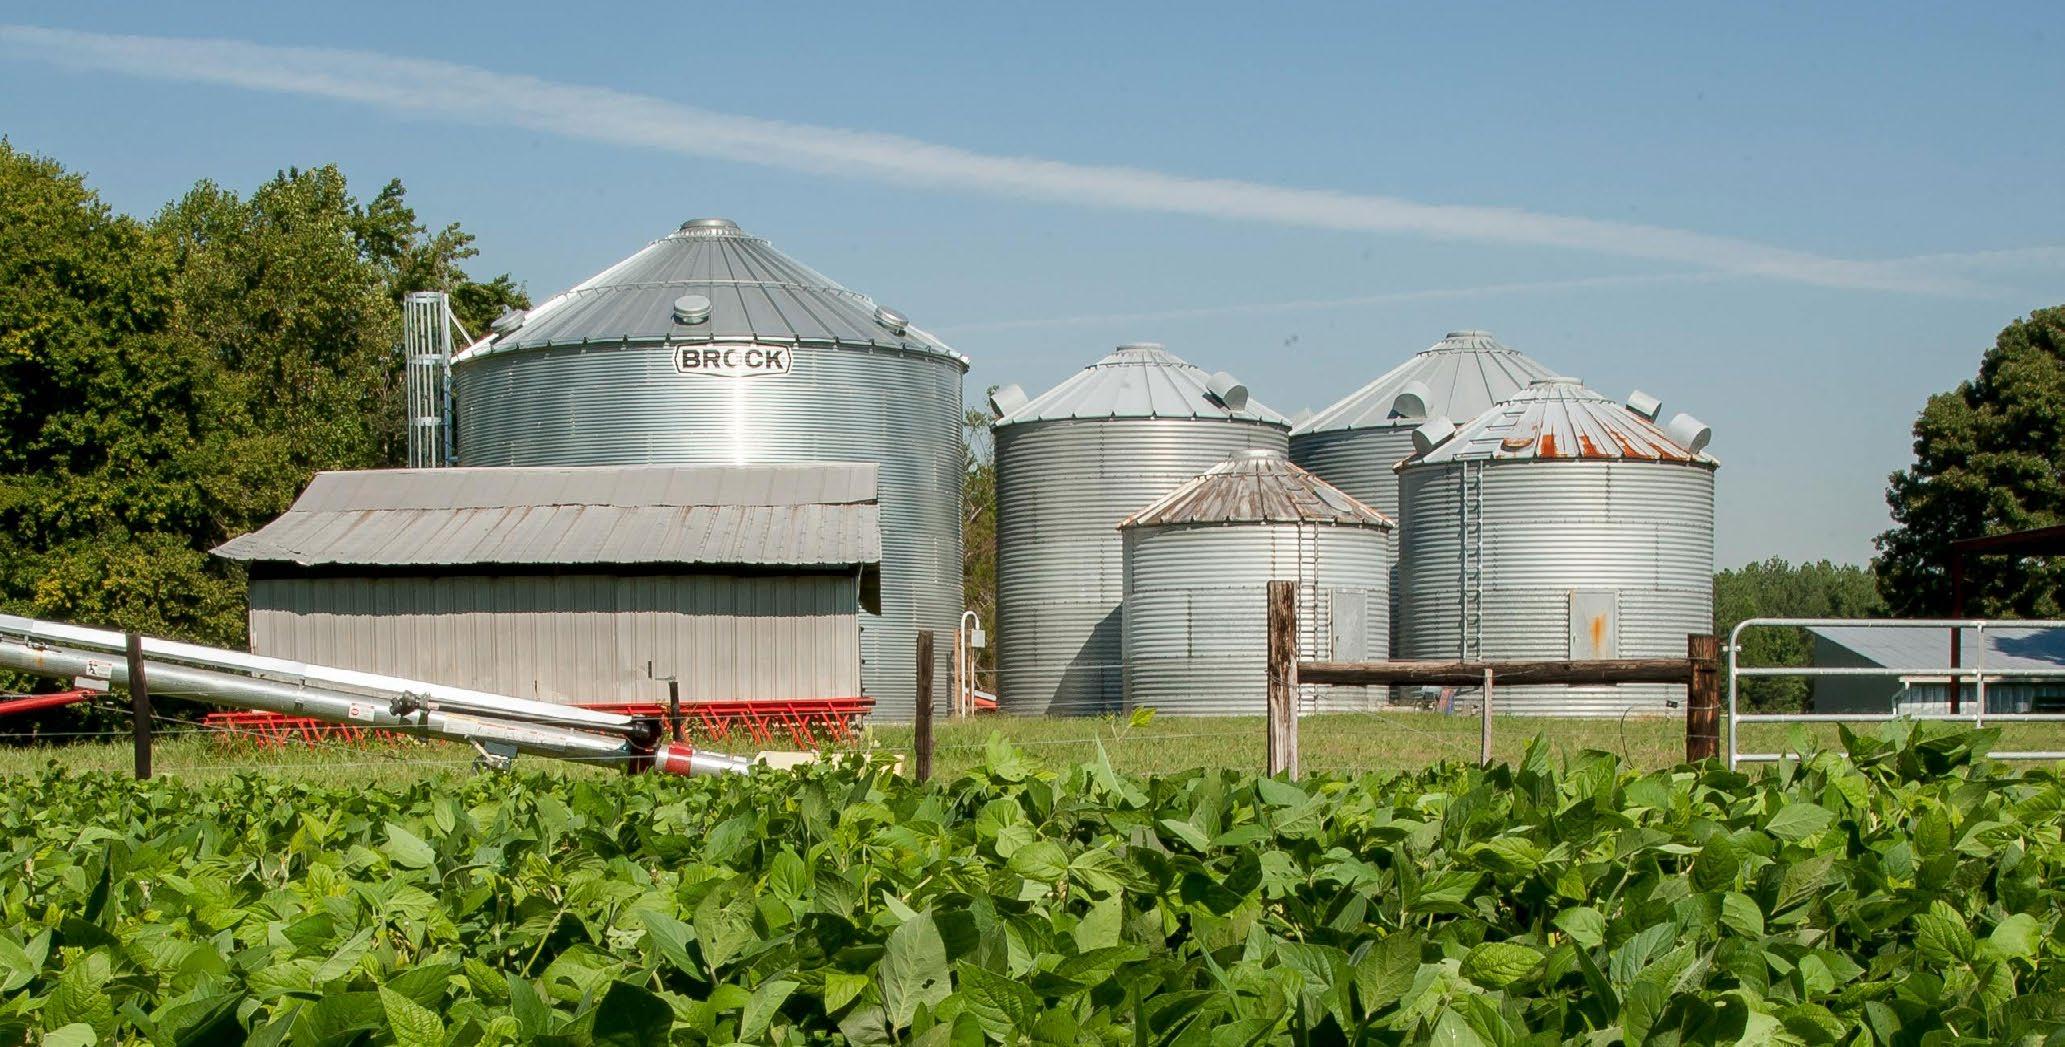
Agriculture is becoming more concentrated rather than broadly distributed. As development pressure intensifies, agriculture may be pushed into fewer areas, making those places more important for land-use compatibility, infrastructure protection, and long-term economic strategy. Put differently, Fort Bend’s future should not be framed as a choice between suburban growth and agriculture. The county’s development strategy should recognize that agriculture is one of the sectors that helped shape Fort Bend’s landscape, economy, and identity, and that it still plays a practical role in employment, land stewardship, food systems, and flood-sensitive open space. Preserving that role is not simply nostalgic; it is a resilience and diversification strategy.
Planning implications: how to use the dominant segment layer in Fort Bend decisions
> Communication and outreach should be designed for multiple default audiences. If the county builds outreach around a single ‘typical’ resident, it will overserve some geographies and underserve others. The county’s dominant profile is split between high-capacity suburban professional and family markets (L2/H2/G2/L1/H1) and substantial multigenerational/community-centered markets (E6 and related E segments). The operational takeaway is straightforward: language access, channel strategy, and trusted messengers should be built into the initial design of countywide efforts.
> Service load and infrastructure demand will skew toward family-centered growth areas. Where H2, H1, and G2 dominate, the planning conversation tends to concentrate around schools, youth programming, parks, roadway performance, and the householdserving retail and service ecosystem. These areas also tend to be sensitive to ‘time costs’ (commuting, school pick-up logistics, childcare), which can influence participation patterns in county programs.
> The county should separate ‘growth management’ tracts from ‘maintenance and reinvestment’ tracts. The L/H/G segments often align with newer growth and expansion needs. The K segments (especially K4 Classic Comfort and K8 Burbs and Beyond) more often align with mature subdivisions where maintenance, drainage, and targeted reinvestment drive perceived service quality. Treating these as the same planning problem can lead to a mismatch: growth tools in maintenance areas or maintenance tools in growth areas.
> Use tract variance as an implementation risk screen. Before rolling out a place-based initiative. If the tract is high-diversity, assume multiple audiences and consider either (a) block-group targeted implementation, or (b) layering additional contextual data (tenure, income, language, school catchments) to avoid misclassification. If the tract is homogeneous, the tract boundary is more likely to behave like a coherent neighborhood unit for planning.
> Treat singleton segments as ‘storytelling anchors’ rather than ‘statistical baselines.’ The rare segments do not define the county, but they are often salient. They can help explain why a countywide average does not match what residents see on the ground in a particular pocket.
> From a policy standpoint, Fort Bend 2050 should explicitly include agriculture as part of the county’s economic development and land-use agenda. One recommendation is to identify and designate priority agricultural preservation and transition areas in the southern and western parts of the county, where agriculture employment remains comparatively stronger. These areas should be protected from incompatible fragmentation while still allowing value-added activity such as food processing, agribusiness services, livestock, equipment support, farm-to-market logistics, and agricultural technology. Rather than treating these areas as “holding zones” until suburban development arrives, the county should plan for them as productive economic landscapes in their own right.
> A second recommendation is to better align infrastructure planning with agricultural viability. Rural roads, drainage systems, irrigation-related needs, broadband access, and freight connectivity all affect whether agricultural producers and workers can remain competitive. In many fast-growing counties, infrastructure investment is concentrated almost entirely around residential and commercial expansion corridors. Fort Bend should avoid that imbalance. A more complete growth strategy would maintain and modernize the infrastructure that supports agricultural operations, especially in the parts of the county where the sector is still concentrated. This includes ensuring that road design, drainage investments, and utility planning do not unintentionally undermine working lands.
> Third, the county should incorporate agriculture into its broader workforce and economic diversification strategy. Even if agriculture does not represent the county’s largest employment sector, it can still anchor a broader ecosystem of jobs tied to food production, environmental management, logistics, agribusiness services, warehousing, and local distribution. Supporting partnerships with local universities, community colleges, local school districts, and workforce providers could help connect agricultural employment to newer opportunities in precision agriculture, waterefficient production, land management, and food supply chain innovation. This would position agriculture not as a declining legacy sector, but as a modernizing component of the county economy.
> Fourth, Fort Bend should link agricultural policy to resilience planning. Agricultural land often serves functions beyond production: it can preserve permeable surfaces, reduce pressure from impervious cover, support groundwater recharge, and act as a buffer against unchecked sprawl. In that sense, retaining a viable agricultural footprint can advance both economic and environmental goals. County leaders should consider conservationoriented tools, compatible zoning approaches where applicable, and incentive structures that help keep agricultural land in productive use while protecting the county’s long-term flood and water resilience objectives.
Sources: Esri, TomTom, Garmin, FAO, NOAA, USGS, © OpenStreetMap contributers, and the GIS User Community
Figure 6. 2025 Dominant Tapestry Segment. Fort Bend County’s dominant neighborhood lifestyle/market segments (Esri’s Tapestry Segmentation) by small area. Each color corresponds to a major group, meaning the County is a patchwork of different community types—from newer, fast-growing family suburbs to established higher-income enclaves, to more rural/small-town and working-class areas.
“Planning for the future is crucial to keeping Fort Bend County competitive . The private and public sectors will continue to work collaboratively so we can prepare for growth while protecting the strengths that make this community a great place to live and work. Fort Bend County’s continued success will depend on growing our business market alongside our population.”
Carlos Guzman Director Fort Bend County Economic Opportunity & Development
Countywide growth is large and sustained. Countywide expenditures are projected to increase by $9.44 billion from 2025 to 2030 (+24.3%). On an implied annualized basis, the countywide Compound Annual Growth Rate (CAGR) is approximately 4.4% per year. This magnitude indicates a meaningful expansion of spending capacity across the County.
The typical block group rises, but the top rises faster. The median block group increases from $72.1 million in 2025 to $87.7 million in 2030. The mean rises from $106.2 million to $132.0 million, with the larger mean increase reflecting faster growth among high- expenditure block groups. At the lower end, the 10th percentile increases from $30.5 million to $35.9 million, while the 90th percentile increases from $180.5 million to $234.6 million. The result is a distribution that not only shifts upward but also stretches further at the upper tail by 2030.
Growth is widespread, clustered in moderate bands. Most block groups experience moderate growth between 2025 and 2030. The largest shares fall between 10% and 25% growth, with a smaller number of block groups exhibiting very large jumps.
Concentration increases by 2030. By 2030, a larger share of total expenditures will be held by the highest- spending block groups. The top 10 block groups’ share rises from 17.9% in 2025 to 19.1% in 2030, and the top 20 share rises from 25.9% to 27.4%. Inequality across block groups also increases (Gini: 0.440 to 0.458). These shifts indicate that the spending geography becomes more ‘peaky’ over time: growth is increasingly anchored in a smaller set of high- expenditure geographies.
A small set of places drives a large share of added dollars. Although growth is widespread, absolute dollar increases are meaningfully concentrated. The top 10 block groups by absolute increase account for 28.0% of the countywide gain, and the top 20 account for 37.3%. This pattern matters operationally because it suggests that a limited set of high-growth areas will account for a disproportionate share of future demand for county systems and services.

Sources: Esri, TomTom, Garmin, FAO, NOAA, USGS, © OpenStreetMap contributers, and the GIS User Community
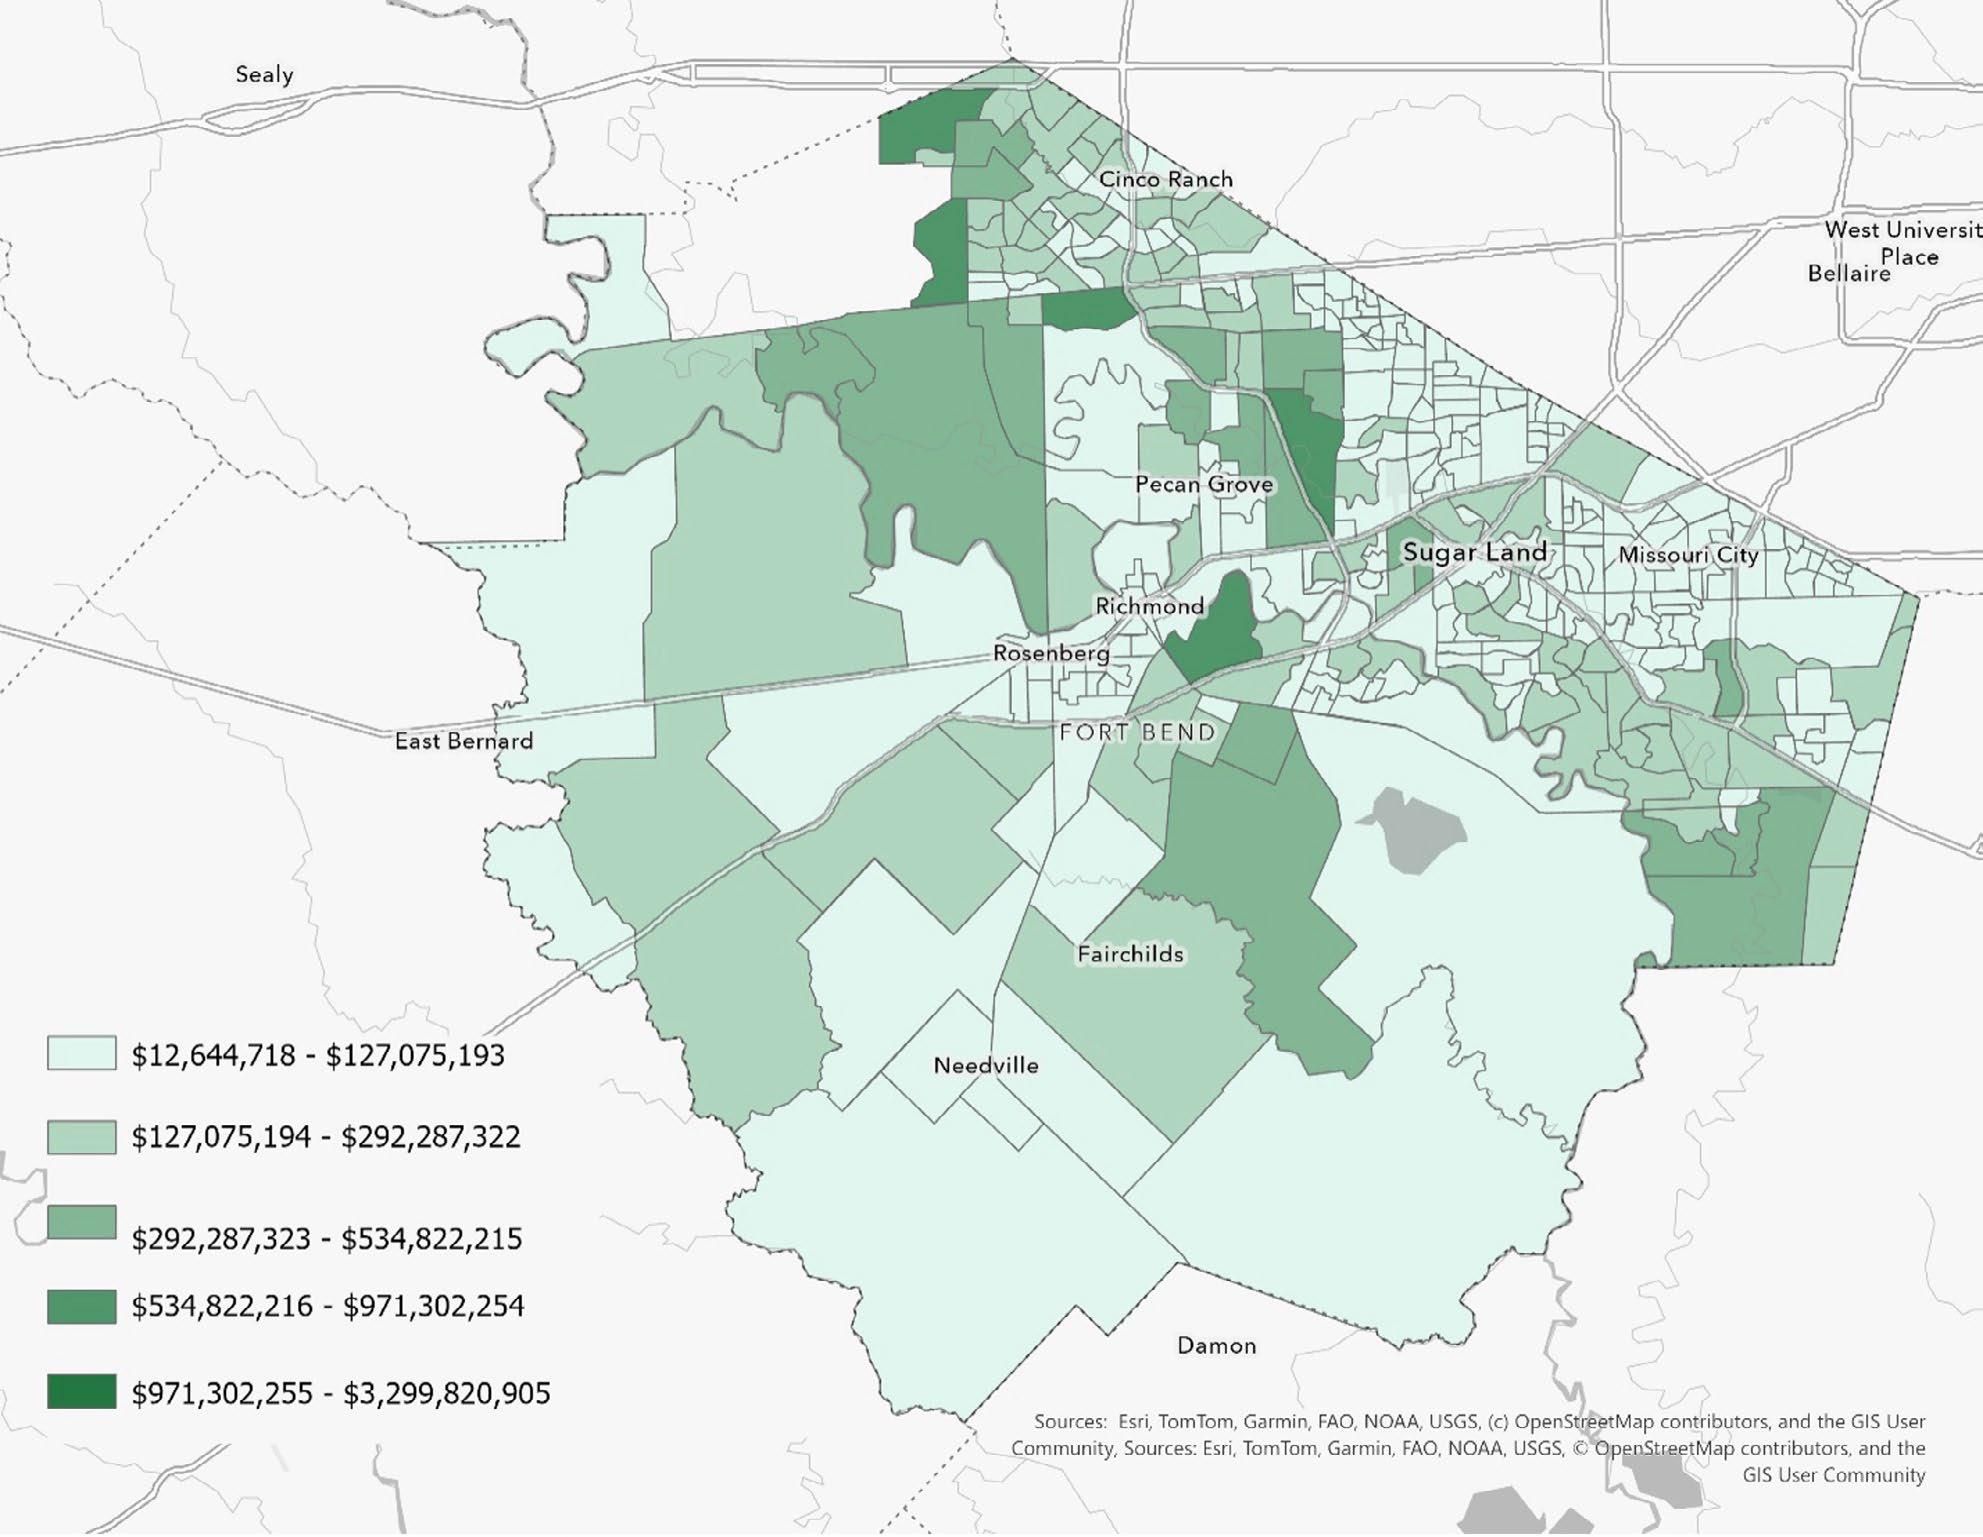
Figure 7. 2030 Annual Budget Expenditures of the Total (aggregate) Amount Spent, Average Amount Spent per Household, and Spending Potential Index (SPI). Darker green areas represent neighborhoods with higher overall and per-household spending—and higher-than-average spending potential—while lighter areas indicate lower total spending and weaker spending potential on average.
The expenditure geography between 2025 and 2030 has two simultaneous characteristics: broad upward movement and increasing concentration. From a policy and management perspective, this combination implies that county systems will face rising overall demand, but that demand will become increasingly uneven across space.
> Infrastructure and service capacity will need to be targeted where growth is steepest. As high-expenditure block groups capture a growing share of the county total, they are likely to experience disproportionate pressure on transportation networks, drainage and stormwater systems, utilities, public safety, and maintenance. Planning and capital improvement programming should explicitly test whether the highest-growth geographies have adequate capacity or require phased expansion.
> Budget forecasting should distinguish between countywide growth and spatial ‘peaks.’ Countywide CAGR masks the fact that some block groups grow far faster than the median. For operational budgeting, the practical risk is under-allocating resources to areas where growth is accelerating and over-allocating to areas that are stable. Incorporating block-group level growth bands into forecasting can improve targeting and reduce service bottlenecks.
> Equity and opportunity risks increase if slower-growth areas are left to drift. Even though most block groups increase, the widening gap between the upper and lower tails suggests the potential for uneven investment and amenity growth over time. If expenditures proxy local economic activity and household demand, slower-growth areas may be at risk of falling behind in access to services, mobility options, and public infrastructure improvements.
“At Accredo Packaging/API Group, we’re proud to be part of the Fort Bend community and contribute to its continued growth. As a family-owned business celebrating 40 years, our commitment to modern infrastructure, workforce development, and supply chain alignment influences how we operate today and strategically plan for the future. We continue to invest in sustainability driven initiatives, including LEED® Silver–certified facilities and the use of wind-generated electricity in our operations. Our drive to innovate, scale and adapt supports a resilient and successful regional economy for the members of Fort Bend County."
Rex Varn Chief Operating Officer Accredo Packaging, Inc.

Fort Bend County’s overall profile is one of prosperity and rapid growth, but the same growth dynamics also increase the importance of understanding—and planning for—residents who face higher risks related to disability, aging, limited English proficiency, transportation access, and poverty.
In 2025 the county is estimated to have 953,983 residents and 311,705 households. Within that total, ACS-based indicators point to sizable groups that may be more vulnerable to economic shocks, health events, extreme weather, or barriers to accessing services. These groups are not confined to a single geography or demographic group; rather, they are interwoven into the county’s broader diversity and household structure. A practical implication is that county systems—public health, emergency management, transportation, and social service navigation—must be designed to reach residents who are both growing in number and increasingly mixed in language and life circumstances.


Three headline measures provide a useful baseline for the county’s at-risk population.
1. 1. An estimated 52,628 households include at least one person with a disability (ACS 5-year), which is approximately 16.9% of all households.
2. 2. The county has about 131,972 residents age 65 and older—roughly 13.8% of the total population—reflecting a gradual but meaningful aging trend.
3. 3. An estimated 8,244 households report zero vehicles available, about 2.6% of all households, indicating a transportation access vulnerability that can become acute during disruptions (storm events, medical episodes, job changes) even in generally auto-oriented environments.
The disability indicator—households with one or more people with a disability—captures a broad set of functional limitations that can affect employment stability, health care access, and emergency preparedness. At roughly 16.9% of households, disability is not a marginal issue; it is a mainstream planning consideration. In operational terms, this reinforces the need for accessible communications, universal design standards in public facilities, continuity-of-care strategies during emergencies, and coordination with providers and community organizations that can support residents who may have mobility constraints or require assistive services. It also suggests that investments in preventive health, community health workers, and benefits navigation can have outsized returns by stabilizing households that are at higher risk of cascading hardship following a health shock.
Language patterns highlight both Fort Bend’s diversity and the service-delivery requirements that accompany it. Among residents age 5 and older (approximately 806,442 people), about 59.3% speak English only, while sizable shares speak Spanish (about 17.0%), Asian-Pacific Island languages (about 11.5%), Indo-European languages (about 8.6%), or other languages (about 3.6%). From an at-risk perspective, the more consequential measure is limited English proficiency—residents who speak English ‘not well’ or have ‘no English’. Across language groups, this totals about 43,035 people (roughly 5.3% of the age 5+ population captured in the table).
Risk is especially concentrated among older adults. Among residents age 65+, approximately 12,266 are estimated to have limited English proficiency (about 9.3% of the 65+ population). Spanish-speaking seniors with no English are estimated at 1,463. This combination—age and limited English—can create barriers to health care access, disaster communication, and routine interactions with government systems. Accordingly, language access should be treated as core infrastructure: translation and interpretation capacity, culturally competent outreach, and trusted messengers are essential to ensuring equitable access to services and effective emergency response.
Economic risk is present even in a high-income county. ACS estimates indicate that about 21,212 households have income below the poverty level, representing approximately 7.54% of households. While the overall share is lower than many jurisdictions, the absolute count is large and should be interpreted alongside other vulnerabilities—such as disability, limited English proficiency, and lack of vehicle access—that can compound hardship. For county planning, this supports a dual strategy: universal systems that work well for everyone (e.g., streamlined service navigation, clear communication, resilient infrastructure), paired with targeted supports for residents facing the greatest barriers (e.g., benefit enrollment, rental/utility assistance, food access, and wraparound case management).
Taken together, Fort Bend’s at-risk population challenges are less about a single dominant problem and more about ‘compound vulnerability’—where disability, age, language barriers, transportation constraints, and income insecurity overlap. This has three practical implications. First, emergency management planning should continue to provide residents with accessible communications and additional support to evacuate, shelter safely, or obtain medications and care during disruptions. Second, public health and human services systems should prioritize navigation and outreach, recognizing that eligibility complexity and language barriers can suppress take-up even when programs exist. Third, transportation planning should incorporate a small-but-important group of zero-vehicle households and older adults who may be dependent on others for mobility, particularly for health care appointments and essential errands.
Below are policy alternatives that align with the risk signals in the data and can be pursued in parallel. The emphasis is on scalable approaches that strengthen countywide capacity while targeting the highest-risk residents.
Create (or strengthen) a centralized navigation model that integrates eligibility screening, referrals, and warm handoffs across county and partner programs (public health, aging services, housing assistance, benefits, and nonprofit supports). Operationally, this can be delivered through a blended model of a multilingual call center, web portal, and community-based navigators (including community health workers). This approach directly addresses barriers faced by low-income households, seniors, and residents with limited English proficiency by reducing the transaction costs of accessing help.

Adopt a countywide language access standard that specifies translation/interpretation thresholds, priority languages, and rapid-deployment capacity for emergencies. Pair this with ‘trusted messenger’ partnerships (faith communities, cultural organizations, clinics, schools) to disseminate time-sensitive information. Given the estimated 12,266 limited-English seniors, this is both a public health and emergency preparedness investment.
Coordinate an ‘aging-in-place’ strategy that blends home modification supports (ramps, grab bars), fall-prevention programs, caregiver support, and transportation assistance for medical visits. Because about 16.9% of households include a person with a disability, accessibility improvements to county facilities, parks, and service sites also provide broad benefits. Consider integrating screening for functional needs into routine outreach (clinic visits, community events) to provide proactive support rather than crisis-driven responses.
For the estimated 8,244 zero-vehicle households, mobility barriers can limit access to jobs, schooling, and health care. Policy alternatives include expanding county-supported non-emergency medical transportation (NEMT), implementing micro transit pilots in areas with higher concentrations of seniors/zero-vehicle households, and partnering with municipalities and employers to provide last-mile solutions. Transportation interventions should be designed with language accessibility and disability accommodations from the outset.
Keep updating emergency operations plans to explicitly incorporate functional and access needs: multilingual alerts, accessible sheltering, medication continuity, and registries or opt-in systems for residents requiring assistance during evacuations. Work with health systems, pharmacies, and home health providers to pre-plan continuity protocols. This is particularly important for older adults with limited English and for households managing disability-related needs.
Develop a tract- or neighborhood-level vulnerability dashboard that integrates indicators like disability households, limited English proficiency, poverty, and vehicle access to guide outreach, facility siting, and partner grants.
“More and more families are moving to Fort Bend County. People are choosing to have babies, raise their families, settle down and retire here. And throughout their lives, they’ll all have important health care needs. Memorial Hermann Sugar Land is proud to partner with Fort Bend County and fellow business leaders to support thoughtful, long-term growth across the region. As one of the fastest growing communities in Greater Houston, ensuring strong health care infrastructure and a prepared workforce are critical to economic growth and community wellbeing. Our vision, to create healthier communities, guides how we invest and plan for the future. From expanding critical outpatient and acute care capacity to advancing workforce readiness through training and career pathways, we are proud to meet the evolving needs of our community while growing alongside it.”
Malisha Patel Senior Vice President and CEO Memorial Hermann Southwest & Sugar
Land Hospitals
1 The PolicyMap Low Access Score, which measures how much a block group’s distance to the nearest supermarket would need to shrink (as a percent) to match the reference distance for similar population density and car-ownership conditions
Access and deprivation help distinguish between places that are geographically underserved by supermarkets and areas experiencing deeper socioeconomic barriers that can make food access, health, and stability more difficult—even when retail is nearby.
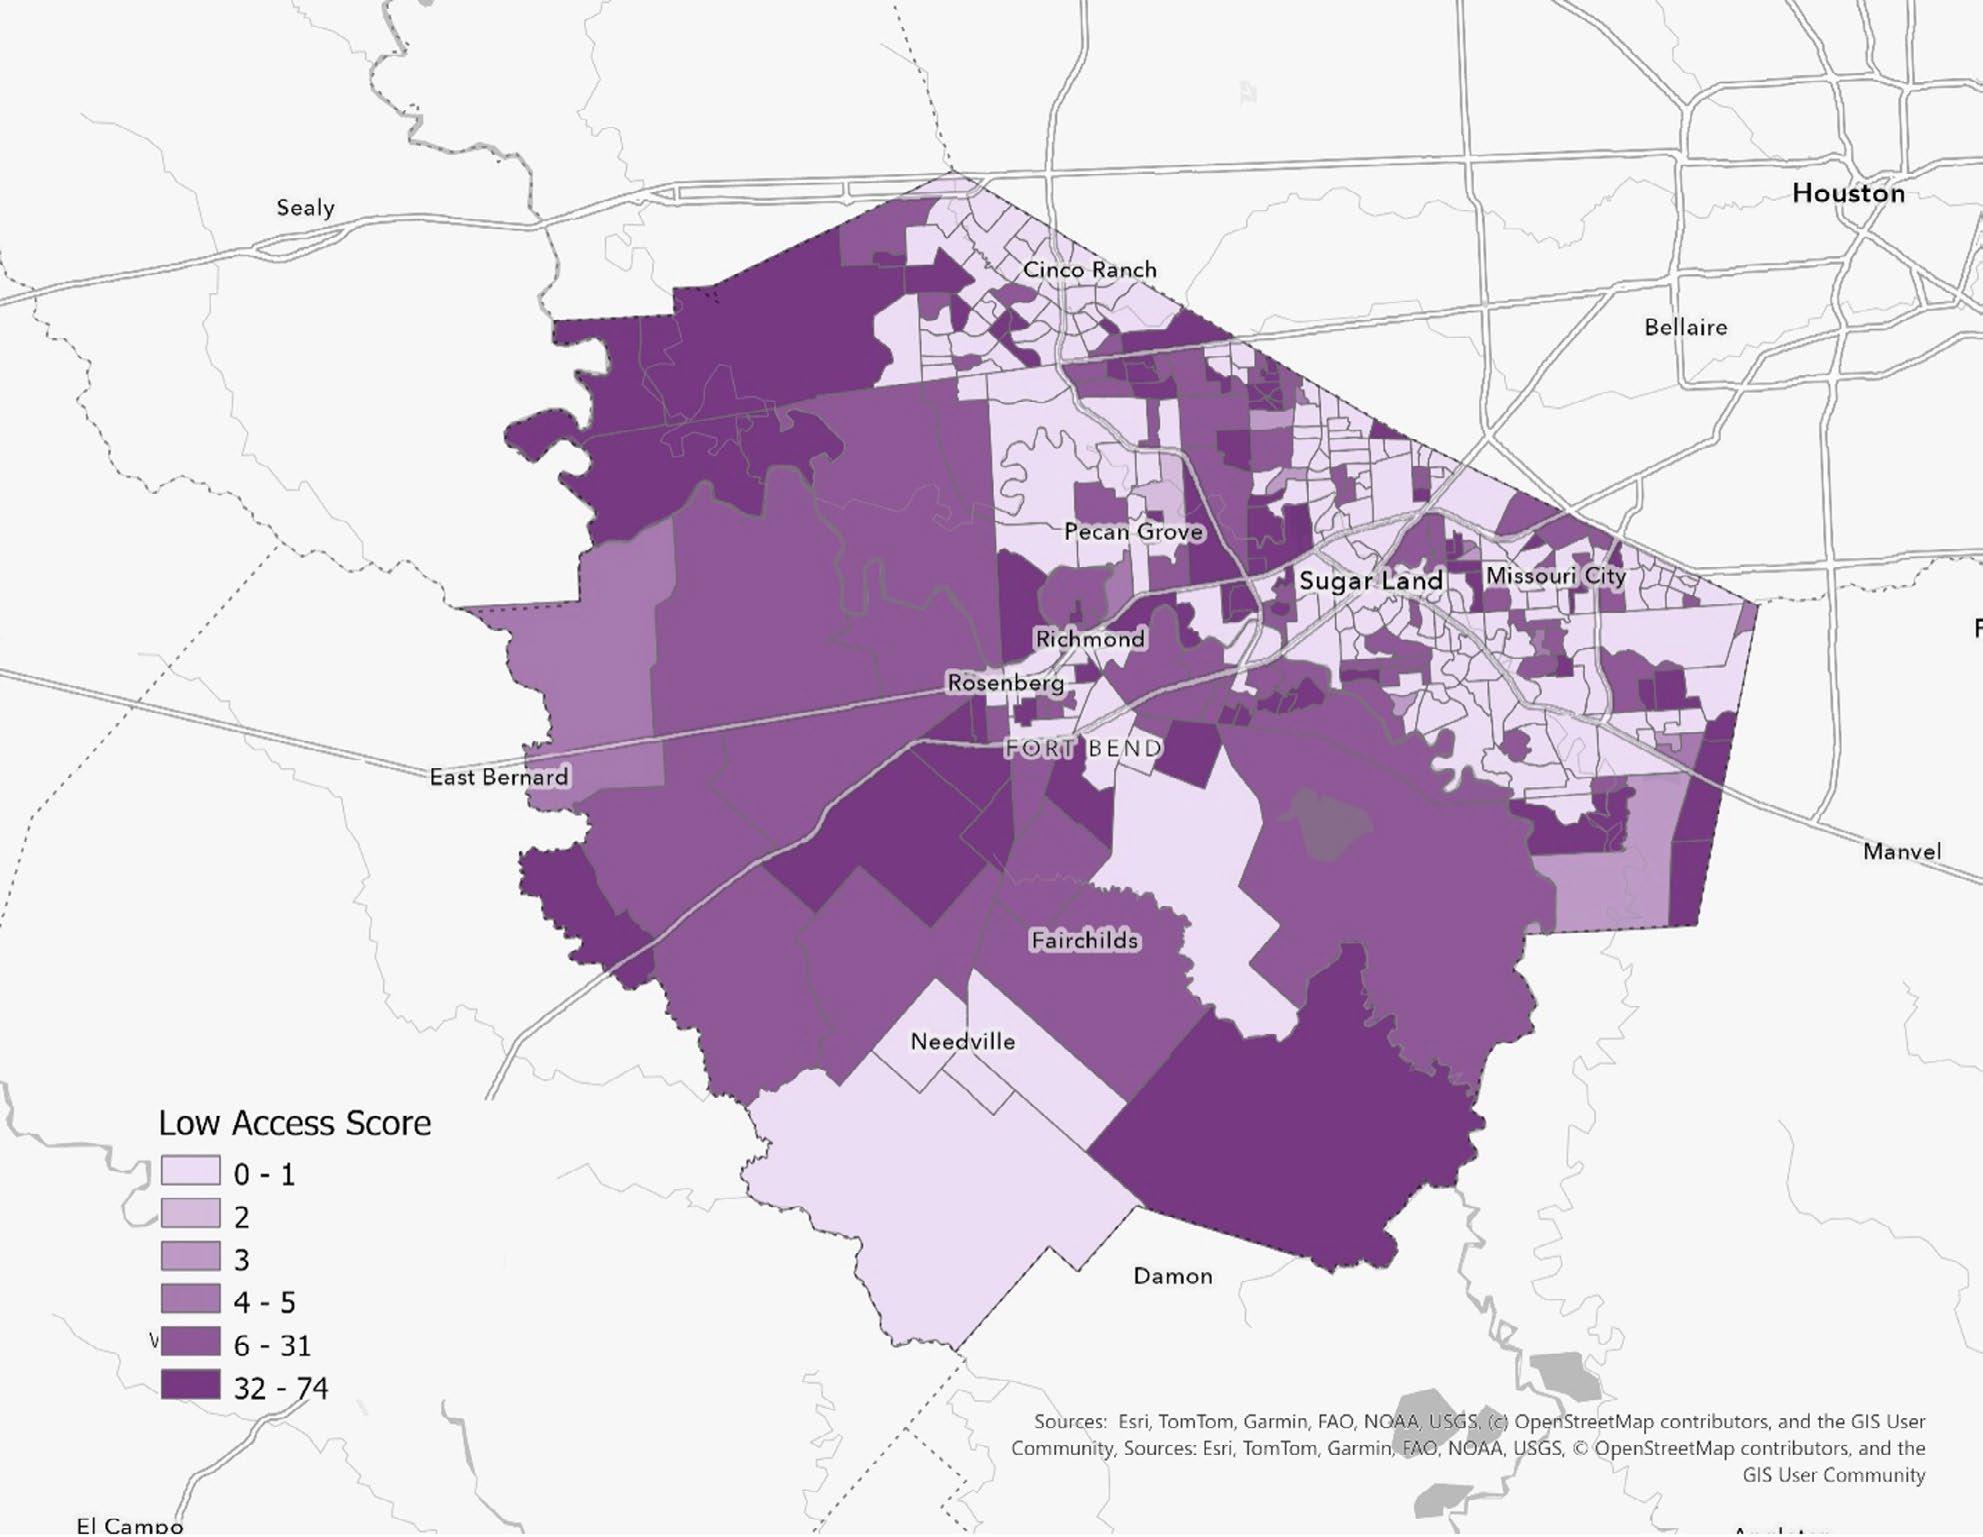
Countywide, supermarket access 1 gaps exist but are unevenly distributed. A majority of block groups (53.6%) have a Low Access Score of 0, indicating that
their supermarket distance is at or below the reference distance for their density and vehicle access context. At the same time, about one quarter of block groups (26.0%) show high or very high access gaps (Low Access Score ≥25), including 34 block groups (9.3%) with very high gaps (≥50). These are the locations where residents must travel substantially farther than expected—given local density and car ownership—to reach a supermarket.
Sources: Esri, TomTom, Garmin, FAO, NOAA, USGS, © OpenStreetMap contributers, and the GIS User Community
Figure 8. Low Access Score map shows where residents have poorer geographic access to supermarkets—darker areas mean people would need a bigger reduction in travel distance to reach “typical” supermarket access for similar communities (i.e., they’re more underserved). Lighter areas indicate neighborhoods where supermarket access is closer to what would be expected given local density and car access.
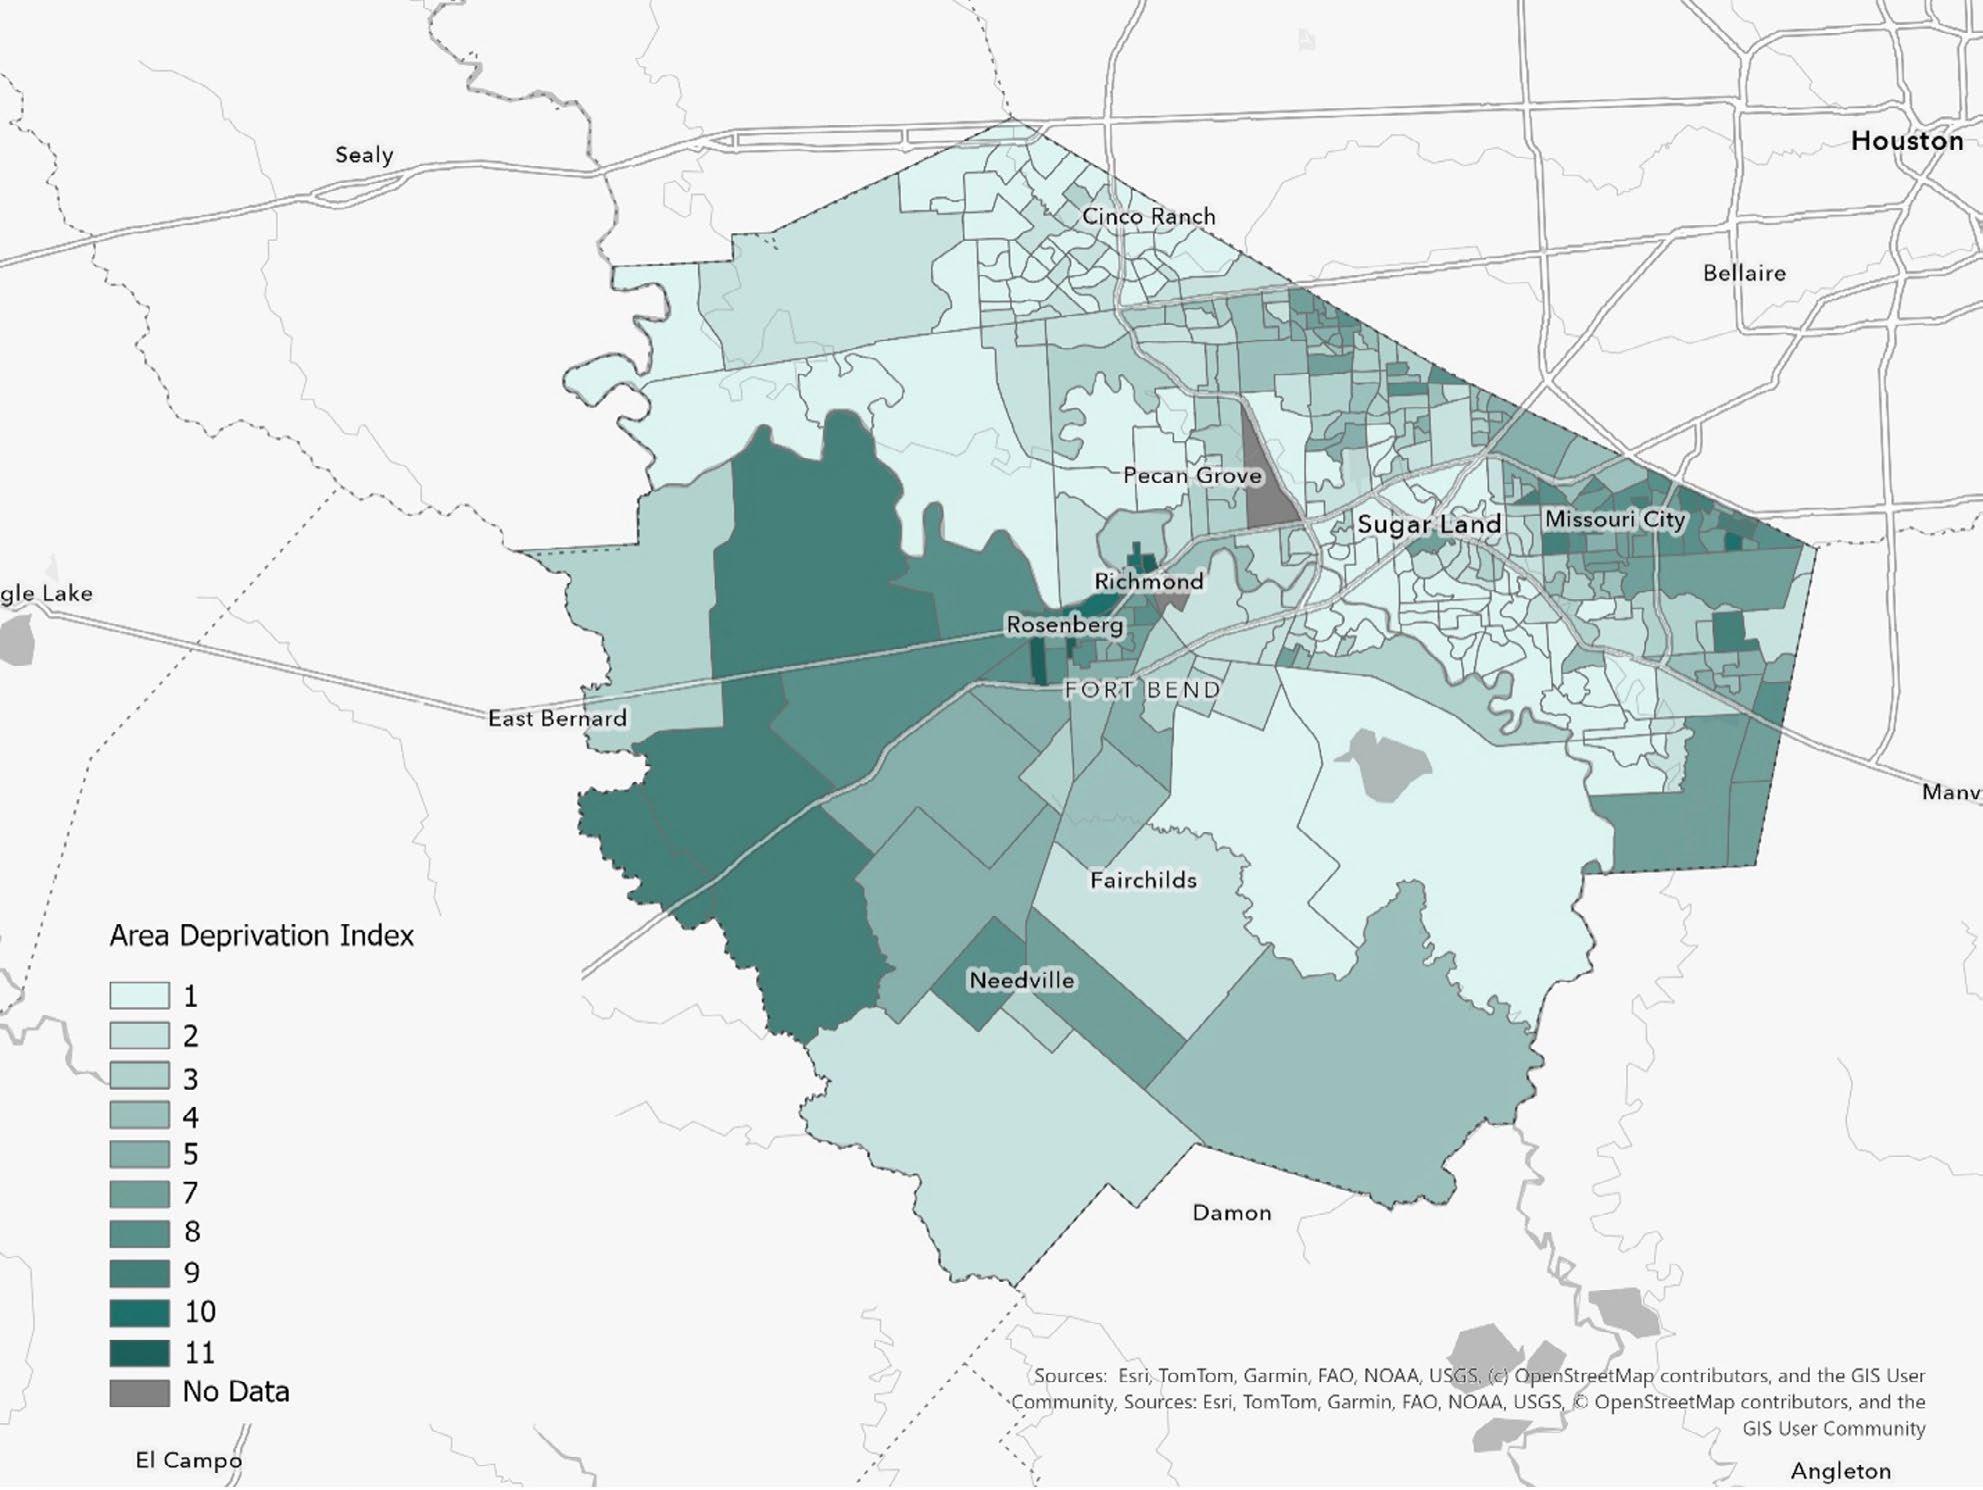
Socioeconomic deprivation 2, as captured by the Area Deprivation Index (ADI) deciles, is concentrated in a relatively small share of the county’s block groups. Roughly 61.7% of block groups fall in the lowest three ADI deciles (1–3), while only 5.7% of block groups are in the highest deprivation deciles (8–10). Notably, the relationship between supermarket access gaps and ADI is weak in this dataset (correlation ≈ 0.05), which is a practical signal for policy: food-access geography and socioeconomic disadvantage should be treated as related but distinct problems, often requiring different tools.
Sources: Esri, TomTom, Garmin, FAO, NOAA, USGS, © OpenStreetMap contributers, and the GIS User Community
Figure 9. The Area Deprivation Index (ADI) state rank, reported as Texas deciles, shows how socioeconomic disadvantage varies across Fort Bend County—darker areas indicate higher deprivation (more barriers tied to income, education, employment, and housing conditions), while lighter areas indicate lower deprivation.
2 The Area Deprivation Index (ADI) state rank, reported as Texas deciles where 10 indicates the highest socioeconomic disadvantage.
These results suggest a two-track strategy for Fort Bend County. The first track focuses on reducing the physical distance burden in places with high Low Access Scores. The second track focuses on reducing the “effective” access burden created by deprivation—affordability constraints, housing instability, and limited bandwidth—even in places where supermarkets are geographically nearby. Because the overlap between the two measures is limited, the county’s most effective approach is not a single universal program, but a layered package that matches the barrier to the place.
Near-term actions can include partnering with grocers and community organizations to deploy mobile markets or scheduled pop-up produce distributions, paired with enrollment assistance for SNAP/WIC and community health navigation. Where transit options exist, small changes—route alignment, microtransit pilots, or subsidized rides to grocery destinations during peak need windows—can materially reduce the travel penalty implied by high Low Access Scores. Over the medium term, the county can use incentives to attract small-format grocery or healthy corner-store models into high-gap tracts, supported by streamlined permitting, site readiness, and targeted infrastructure improvements.
In high-gap but lower-deprivation areas, the core problem is geographic coverage. These places often benefit from market-shaping and transportation solutions—improving last-mile connectivity, enabling shared-use delivery lockers, supporting community-based delivery cooperatives, and making it easier for retailers to pilot new locations. Conversely, in high-deprivation areas with low Low Access Scores, the focus should shift toward affordability and stability: reducing housing cost stress, connecting residents to benefits, expanding preventive health programming, and investing in neighborhood quality improvements that strengthen resilience. In those tracts, a “food desert” framing can miss the larger constraint, which is not where the store is, but whether households can consistently afford and utilize healthy food choices.
Finally, the county should embed these measures into routine planning—alongside health outcomes, traffic and transit data, and economic development metrics—to create a defensible, data-driven foundation for prioritizing investments and communicating progress.

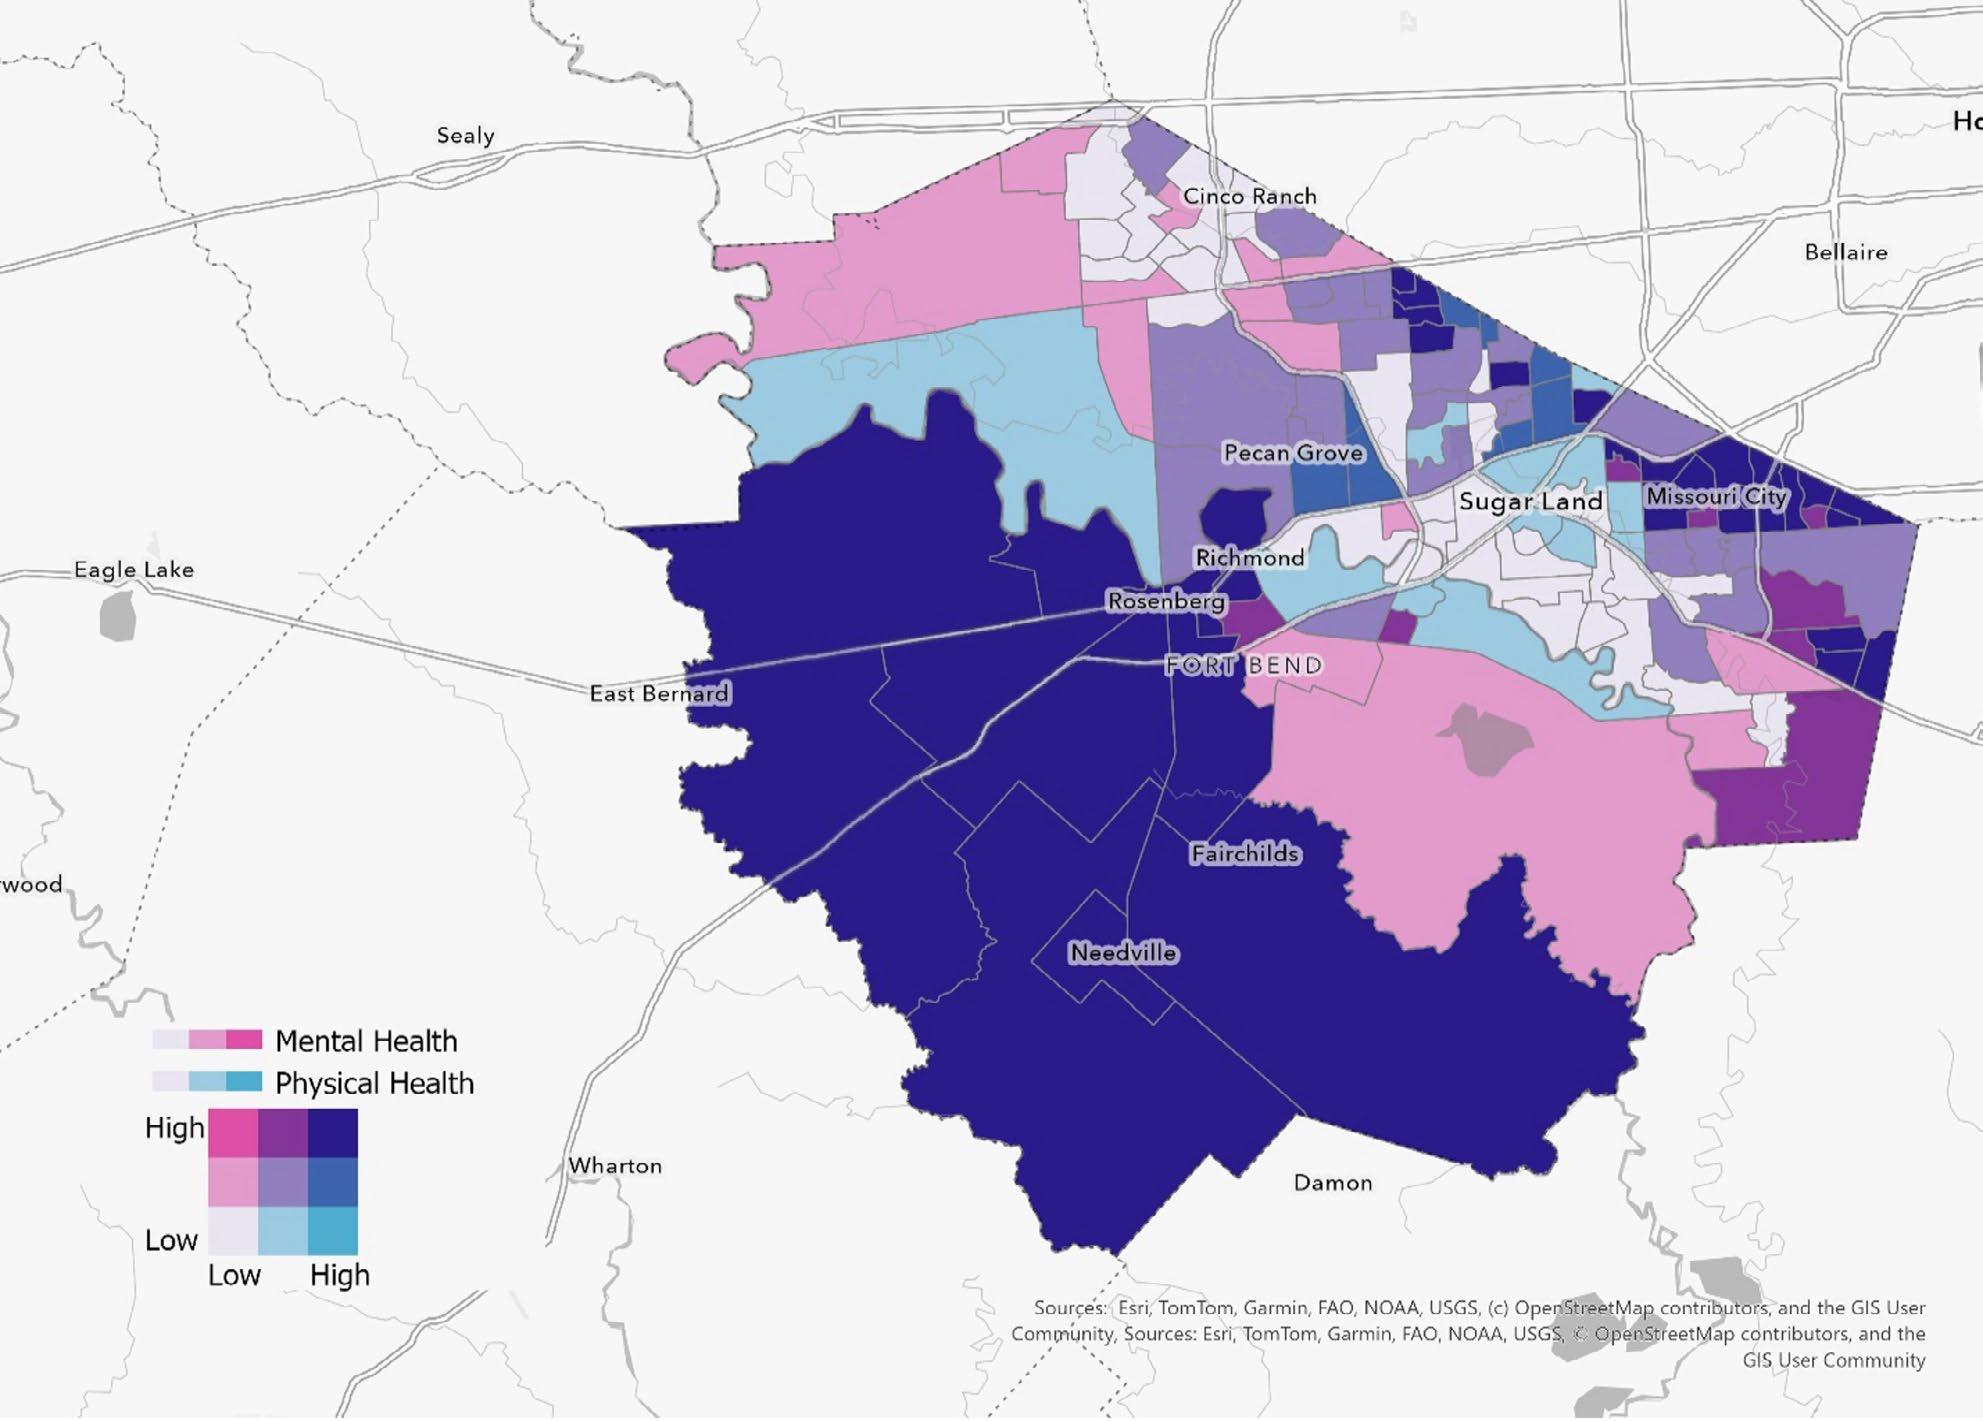
Across Fort Bend County, poor mental health prevalence ranges from 9.8 to 19.8, with an average of 14.8 (median 14.6). Poor physical health prevalence ranges from 6.9 to 19.5, with an average of 11.2 (median 10.5).4 Two countywide patterns stand out.
Sources: Esri, TomTom, Garmin, FAO, NOAA, USGS, © OpenStreetMap contributers, and the GIS User Community
Figure 10. Bivariate map showing where poor mental health (pink scale) and poor physical health (blue scale) are common across Fort Bend County. Darker, more purple areas indicate places with high mental and physical health burdens, while lighter areas are lower on both; pink-leaning areas have higher mental health burden relative to physical, and blue-leaning areas have higher physical burden relative to mental.
3 These measures do not identify the specific causes of distress or illness, they serve as practical “signal” variables for community conditions—including chronic disease burden, stress exposure, unmet behavioral health needs, and the cumulative effects of disadvantage and instability. Used together, the two measures help distinguish where health challenges are primarily psychological, primarily physical, or, most often, intertwined.
4 Estimated prevalence of individual self-perceived mental and/or physical health not good for >=14 days among adults aged 18 or older in 2023.
First, variation is substantial, meaning that health-related quality of life is not evenly distributed across places. Second, the two measures move together strongly: tracts with higher poor mental health prevalence also tend to have higher poor physical health prevalence (correlation ≈ 0.86). This coupling is consistent with well-established dynamics in population health—mental health strain and physical health limitations often reinforce one another through pain, sleep disruption, financial stress, caregiving demands, and reduced access to care.
From a targeting standpoint, the highest-need group includes tracts that fall in the top quintile for both indicators simultaneously (see Figure 10, dark blue tracts). These “co-burden” tracts represent the clearest candidates for integrated action that blends behavioral health access, chronic disease prevention, and supportive services. Additional tracts fall in the top two quintiles for both indicators, suggesting a broader set of communities where prevention and access strategies can still yield high returns.
A place-based health strategy in Fort Bend County should treat poor mental and physical health as an integrated quality-of-life constraint. The strong correlation between the two indicators suggests that an effective response will not be exclusively clinical. It must also address the conditions that shape daily stress and chronic disease: reliable access to primary care, timely behavioral health services, medication adherence and appointment attendance, housing stability, transportation access, and community environments that support physical activity and social connection.
In the highest-burden areas, a near-term priority is to expand “front-door” access to behavioral health and primary care in ways that reduce friction. That can include co-located or embedded behavioral health services in primary care settings, school-based partnerships, and community-based screening and navigation programs that quickly and confidentially link residents to services. Because poor health days translate into missed work and productivity loss, employer-facing strategies can also matter—supporting access to EAP services, tele-behavioral health, and flexible scheduling for care, particularly in labor sectors with limited leave.
On the physical health side, the co-burden pattern indicates that chronic disease prevention and management are a parallel priority. Areas with very high prevalence of poor physical health are likely to benefit from targeted chronic disease screening, community health worker models, and pharmacy partnerships that improve adherence and follow-up. At the neighborhood level, investments that enable routine physical activity—safe walking routes, access to parks, and connections to recreation—are often the most scalable complements to clinic-based care. These investments also generate broader co-benefits for community cohesion and local attractiveness.
Finally, the county should integrate these tract-level measures into an accountability framework that connects health improvement to broader development goals. Reducing poor health days is not only a health outcome; it is a capacity outcome. Communities with fewer poor health days tend to have stronger labor force participation, more consistent school attendance, and a higher baseline quality of life, all of which support long-run economic resilience. Using a tiered approach—co-burden tracts for intensive integrated action, and the broader high-high group for prevention and early intervention—creates a strategy that is targeted, explainable, and scalable.
“A county’s long-term success depends not only on how much it grows, but on how well it prepares for that growth. At AccessHealth, we know strong communities require strong healthcare systems, and as Fort Bend enters its next phase of expansion, thoughtful investment in healthcare infrastructure, workforce readiness, and coordinated planning will be essential to meeting rising demand. A thriving community depends on healthcare systems that grow in step with population needs such as ensuring families have timely access to care, employers can rely on a healthy workforce, and public services remain responsive as the county evolves. By aligning healthcare capacity with Fort Bend’s continued growth, we can help ensure our community remains healthy, resilient, and vibrant for generations to come.”
Palak Jalan Chief Executive Officer AccessHealth
Between 2025 and 2030, Fort Bend County is projected to add 43,816 occupied housing units—a 14.1% increase—expanding from 311,705 to 355,521 occupied households. This growth is predominantly owner-led: owner-occupied units rise by 36,013 (+14.9%), compared with 7,803 additional renter-occupied units (+11.3%).
Table 2. Countywide totals and the tenure balance of growth
The spatial pattern of growth differs sharply by tenure. Owner growth is broadly distributed across the county, suggesting countywide demand for ownership housing and steady expansion across multiple submarkets. Renter growth, by contrast, is more selective, clustering into a smaller number of block-group “hotspots.” This concentration is substantial: the top 10 block groups account for roughly 51.8% of all net renter growth (the top 20 account for about 70.3%), indicating that rental expansion is being absorbed in a limited set of locations rather than being evenly distributed.
2025 Owner-occupied Housing Units
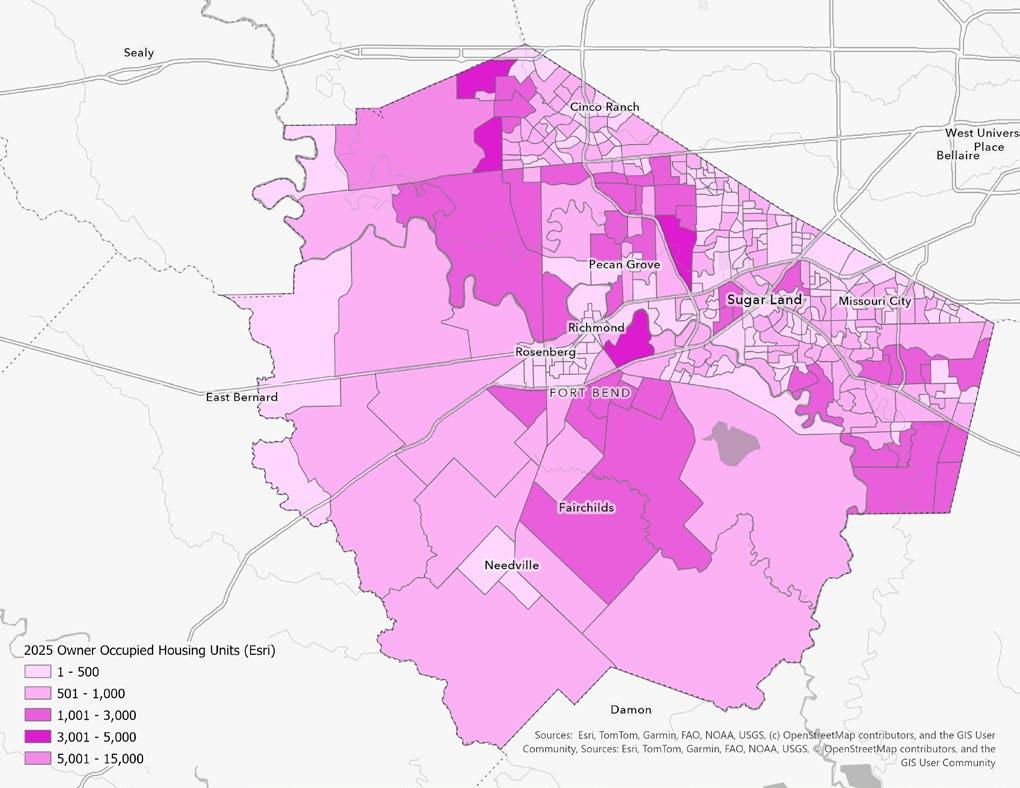
1 - 500
501 - 1,000
1,001 - 3,000
3,001 - 5,000
5,001 - 15,000
2025 Renter-occupied Housing Units
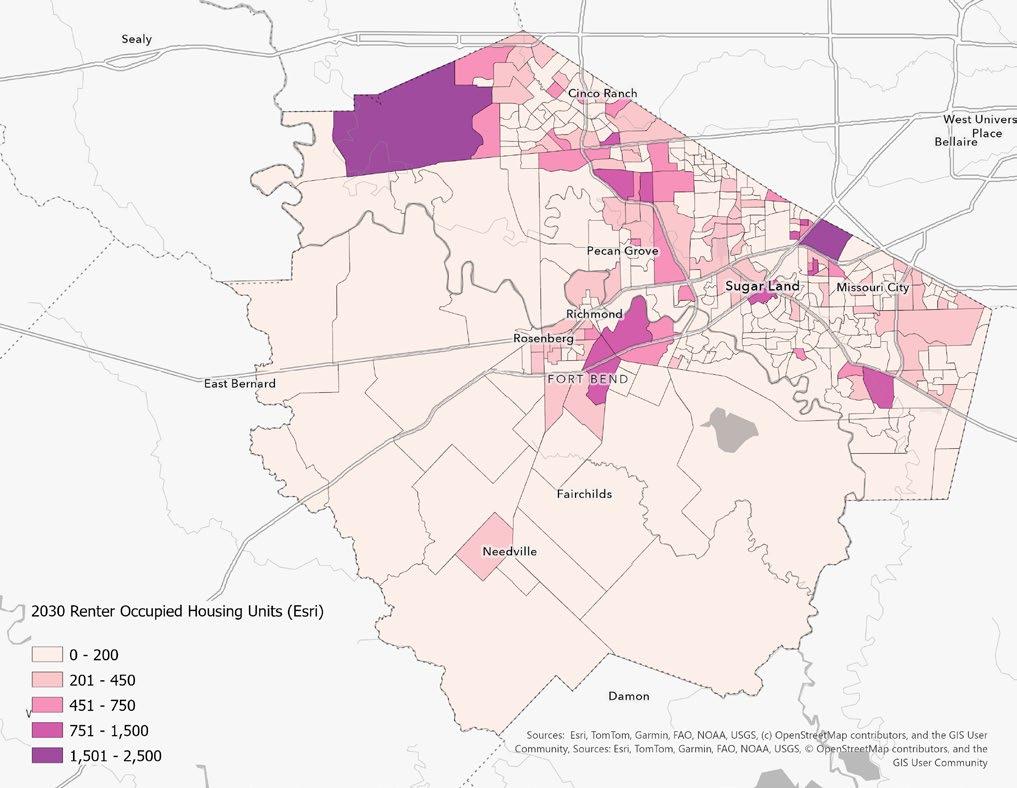
0 - 200
201 - 450
451 - 750
751 - 1,500
1,501 - 2,500
2030 Owner-occupied Housing Units
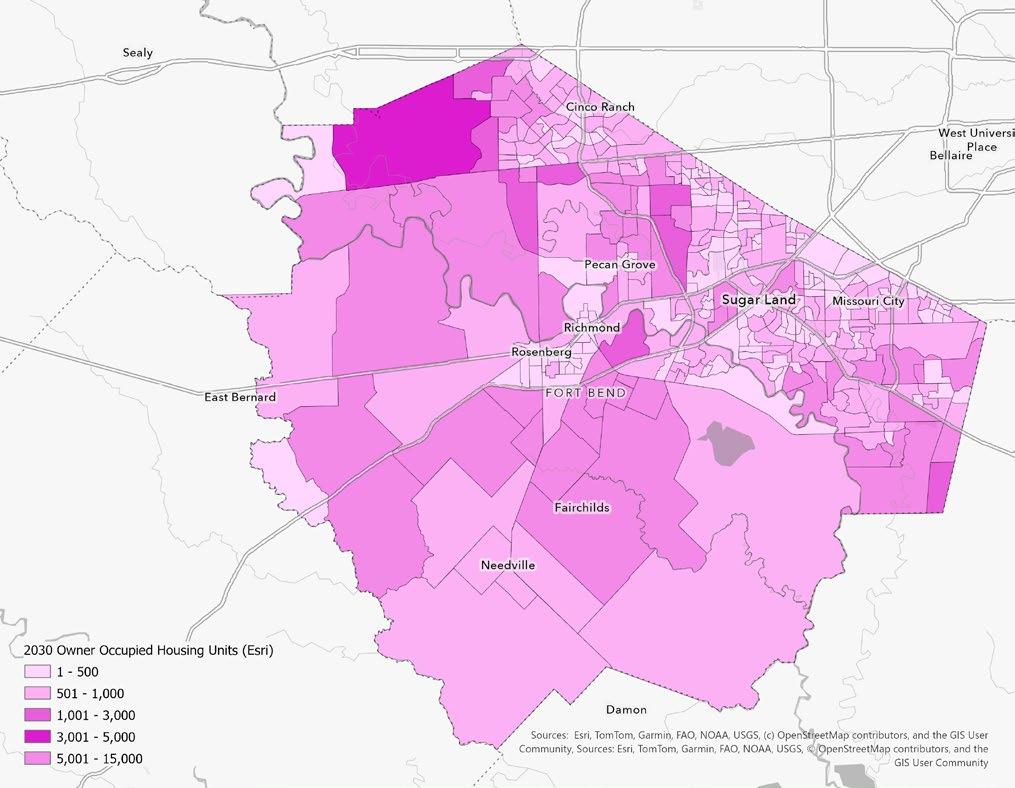
1 - 500
501 - 1,000
1,001 - 3,000
3,001 - 5,000
5,001 - 15,000
2030 Renter-occupied Housing Units
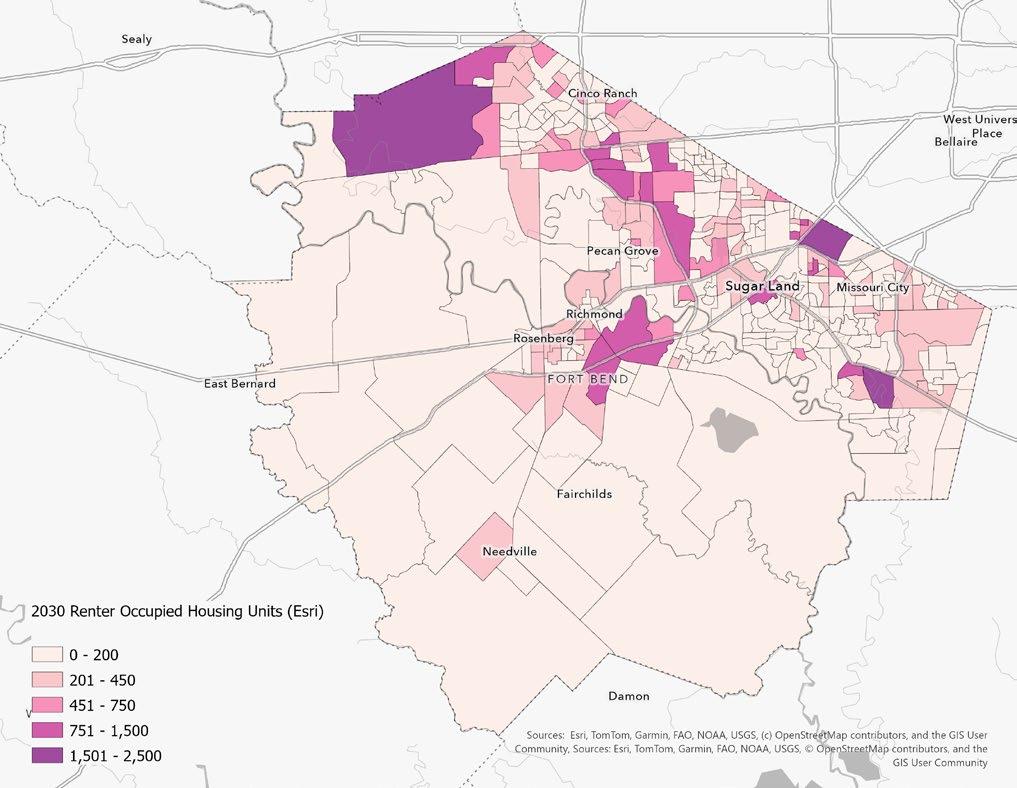
0 - 200
201 - 450
451 - 750
751 - 1,500
1,501 - 2,500
Figure 11. Growth Typology: Owner-Led vs Renter-Led vs Mixed Change
The dominant pattern across the county, however, is typically ‘Up owner / Flat renter’ - single-family expansion without a major change in renter counts. The next most common is ‘Up owner / Up renter’ - places where both tenure types are growing, which often behave like higher-pressure growth nodes.
Overall occupied growth is also concentrated, though less intensely than renter growth. The top 10 block groups account for about 28.3% of total net occupied-unit additions, underscoring the importance of a relatively small number of high-growth areas in driving countywide totals. At the same time, stagnation is uncommon at the block-group scale: most areas register positive gains, even where renter counts are effectively flat (within approximately ±10 units).
The projected, owner-led expansion signals a broad-based increase in household formation and sustained pressure on infrastructure typically associated with single-family growth—most notably local roadway capacity, drainage performance, water and wastewater service, and neighborhood-scale amenities such as parks and community facilities. In parallel, the block groups experiencing concentrated renter growth should be treated as near-term monitoring areas. Multifamily delivery and lease-up cycles can shift population and service demand quickly, creating short-run volatility in traffic, school enrollment, emergency response load, and utility usage within a relatively short window.
Areas where both owner and renter counts are rising strongly represent the county’s highest-pressure nodes. These mixed-growth locations are likely to experience compounded demand across mobility, public services, and development management, making them strong candidates for proactive corridor-level planning, access management, and coordinated capital programming. Conversely, the small number of low-growth or flat block groups—while uncommon—remain analytically important. These patterns may indicate market maturity, limited developable land, redevelopment dynamics, or tenure transition (e.g., ownership-to-rental shifts), rather than simply an absence of demand, and they warrant context-specific interpretation before drawing policy conclusions.
The 2025–2030 projections show strong, owner-led growth with renter growth concentrated in fewer hotspots. Looking beyond 2030, the policy challenge is less about whether growth occurs and more about how the county shapes its geography, infrastructure, and housing mix so that additional growth remains fiscally sustainable, resilient to hazards, and supportive of workforce needs.
Beyond 2030, Fort Bend’s housing system will need to accommodate continued single-family demand while ensuring that rental supply and attainable homeownership options keep pace with job growth, household formation, and demographic change. A tenure-balanced approach reduces volatility and provides flexibility as the county matures.
> Adopt a countywide “tenure balance” target at the planning-area level (not a single countywide ratio): identify where additional rentals are needed to support workforce access and where ownership opportunities should be preserved.
> Expand ‘missing middle’ housing pathways (duplex/triplex/townhome standards) in appropriate corridors to add attainable units without requiring high-rise multifamily.
> Create a by-right (or streamlined) multifamily/ attached-housing overlay in designated growth nodes paired with design standards; use
predictability to reduce entitlement friction and steer growth away from flood-prone areas.
> Use an affordability toolkit that scales with growth: density bonuses, parking reductions in high-access corridors, fee waivers for mixedincome projects, and land banking near future infrastructure investments.
> Implement a preservation strategy for older rental stock: proactive code compliance plus rehabilitation incentives to prevent sudden loss of naturally occurring affordable housing.
The post-2030 risk is capacity mismatch: households continue to arrive where infrastructure is least prepared. The best leverage point is sequencing—tying new development approvals and major rezonings to demonstrated capacity (or funded capacity expansion) for roads, drainage, and utilities.
> Move toward an ‘infrastructure concurrency’ framework: continue to require evidence of funded capacity for drainage and critical corridors in the highest-growth tracts before major plats are approved.
> Prioritize watershed-scale drainage investments in growth corridors; integrate green infrastructure requirements (detention, bioswales, permeable systems) into subdivision standards.
> Update the capital improvement plan (CIP) with a growth-hotspot lens: rank projects by expected household gain beyond 2030, not only by current congestion/complaints.
> Coordinate water/wastewater capacity planning with housing projections: target interlocal agreements and utility upgrades where tract-level household gains are largest.
> Institutionalize ‘complete neighborhood’ service planning in hotspots (parks, libraries, EMS response, school coordination) to avoid lagging public services.
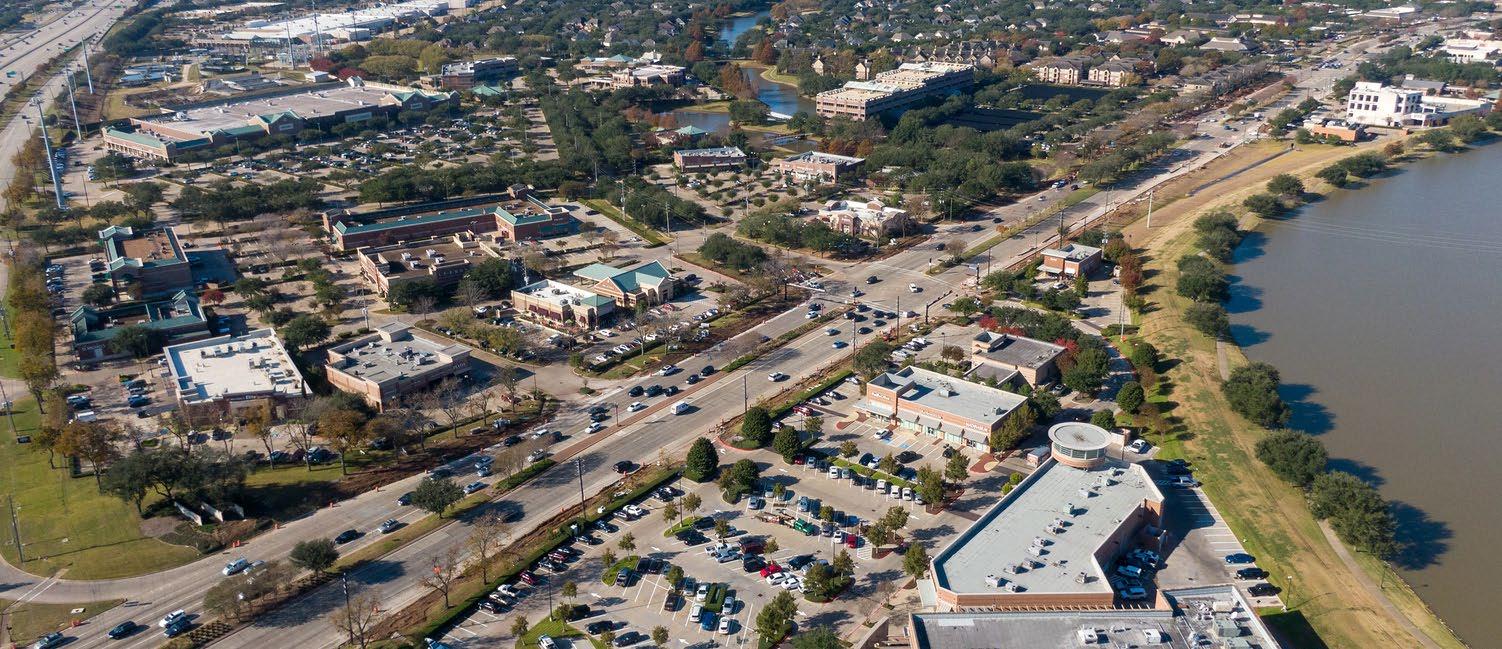
Long-run resilience is an economic development strategy: Safer siting and better stormwater management reduce public costs, insurance burdens, and recovery disruption. Beyond 2030, the county should institutionalize risk-based land use and infrastructure standards as growth pushes toward marginal lands.
> Adopt risk-based siting rules for new housing and critical facilities (avoid repetitive-loss zones; require higher freeboard standards where appropriate).
> Integrate floodplain, subsidence, and extreme-heat exposure into development review as standard ‘risk screens’ with clear mitigation pathways.
> Expand nature-based flood mitigation (buyouts, wetlands restoration, riparian buffers) in conjunction with targeted density in safer nodes.
> Create a resilience financing mechanism (stormwater utility fee, drainage district coordination, or dedicated bond cadence) to keep pace with growth-related runoff.
> Embed resilience performance metrics into project approvals (e.g., post-development runoff targets, heat mitigation tree canopy targets).
If growth continues at the projected pace, mobility becomes a binding constraint. Post-2030 policy should focus on corridor strategies—connecting growth nodes, reducing single-occupancy vehicle dependence where feasible, and protecting freight access.
> Develop corridor mobility plans for the highestgrowth axes with TxDOT: intersection upgrades, signal timing, access management, and multimodal links.
> Tie higher-density housing approvals to first/ last-mile investments (sidewalk networks, safe crossings, trails, micromobility support).
> Preserve right-of-way now for future capacity needs; land acquisition costs rise quickly after development occurs.
> Coordinate with METRO, TxDOT, and cities to stage park-and-ride and express service options where commuting demand is likely to rise.
> Use freight and logistics planning to protect economic competitiveness while managing neighborhood impacts near growth nodes.
Beyond 2030, the key is operationalization: translating projections into an annual decision system that updates priorities as conditions change.
> Create an annual ‘Growth & Capacity Report’ that refreshes tract/block-group indicators (housing delivery, occupancy, infrastructure capacity, flood risk) and updates the CIP ranking.
> Establish a cross-jurisdiction implementation committee (County + cities + major utility districts) focused on the top growth corridors and hotspots.
> Use development agreements in hotspot areas to fund off-site infrastructure (drainage, road connections) with transparent fee schedules.
> Build an early-warning system for renter hotspots (lease-up, complaints, code cases, school enrollment changes) to target service response quickly.
> Publish a simple dashboard: household growth, renter/owner mix, and infrastructure projects delivered—so stakeholders share a common operating picture
“Infrastructure is the backbone of Fort Bend County’s continued success. The county is nearing one million residents and has grown by nearly 70 percent since 2010—making Fort Bend one of the fastest-growing counties in the country. Projections show the population may approach 2 million by 2050. That kind of growth requires planning. Fort Bend has always led with master-planned development, and together, the county and the business community must continue that approach to ensure the county is not just growing—but growing responsibly. By investing in the roads, utilities, and services the community depends on, Fort Bend can meet the needs of today’s residents while preparing for the generations to come.”
David Oliver Partner
Allen Boone Humphries Robinson LLP
The Housing Affordability Index (HAI) summarizes the ability of a typical household to purchase an existing home in a given area. An HAI of 100 indicates that the median household income is sufficient to afford a home at the median home price. Values above 100 indicate that the median household has more than enough income to qualify for the median-priced home; values below 100 indicate that the median household falls short. For the national context, ESRI reports the U.S. HAI was 130 in 2021. This is not a direct like-for-like comparison with 2025, but it provides a useful reference point for what “comfortable” affordability looks like in index terms.
Across Fort Bend County with nonzero values, the median HAI is 101.5 and the mean is 103.7. This places the ‘typical’ block group very close to the affordability break-even point (100), implying a county that is balanced on the margin: many households can still qualify for the median-priced home in their area, but a large share of neighborhoods are already below the threshold.
Nearly half of block groups (47.2%) fall below HAI=100, meaning median incomes are insufficient to afford the median-priced home in those areas. About 24.4% fall below HAI=80, indicating more pronounced affordability stress. In contrast, only 17.5% of block groups reach or exceed HAI=130 (a useful ‘high affordability’ reference point).
The following table helps distinguish three practical affordability regimes: (1) stressed markets where HAI is well below 100, (2) marginal markets near the break-even threshold, and (3) higher-affordability markets where incomes substantially exceed the qualifying threshold. Roughly one quarter of block groups are below HAI=80 (high stress), and another large segment sits between 80 and 99 (moderate stress). A substantial share sits in the 100–129 range (baseline to moderately comfortable), while only a smaller tail reaches 130+ (strong affordability).
Spatially, the pattern suggests that affordability is uneven and highly place-specific: much of the county falls into lower- to middle-affordability bands, while select pockets stand out with substantially higher affordability. For planning, these gradients matter because lower-affordability areas tend to face greater pressure on workforce housing, cost burden, and displacement risk, while higher-affordability zones may be where new household formation and demand can expand more readily—often shifting needs toward infrastructure, schools, and service capacity as growth follows attainable price points.
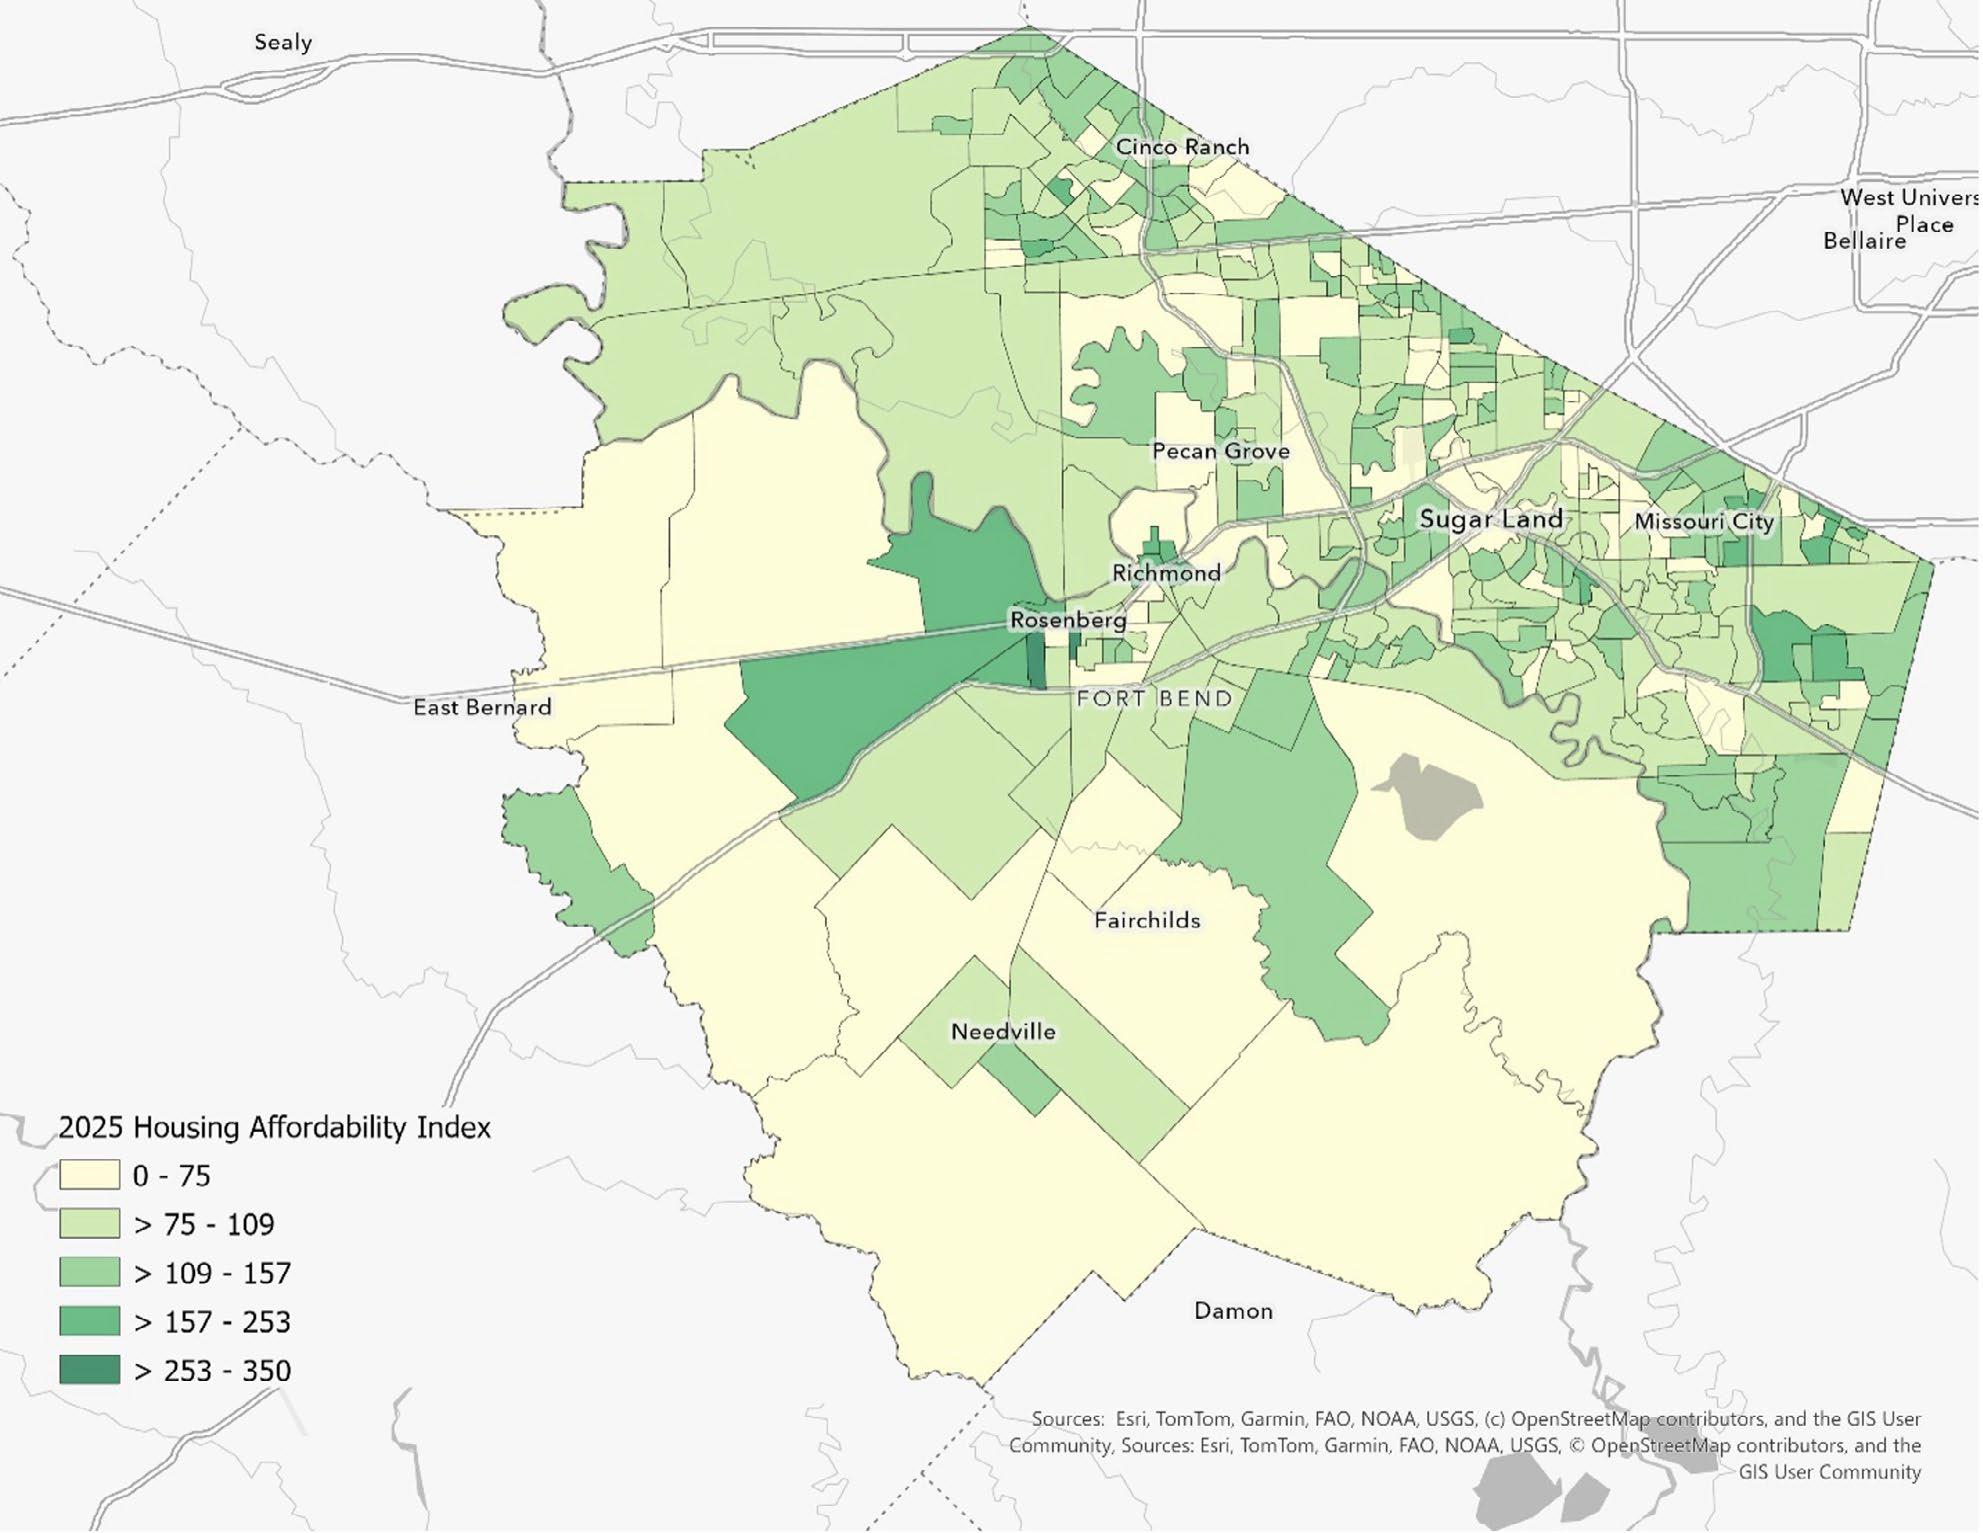
Sources: Esri, TomTom, Garmin, FAO, NOAA, USGS, © OpenStreetMap contributers, and the GIS User Community
Figure 12. 2025 Housing Affordability Index (HAI) across Fort Bend County, showing where homeownership is more or less attainable relative to local incomes and housing costs. Lighter areas (lower HAI values, especially below ~100) signal places where housing is less affordable—meaning the typical household has a harder time comfortably affording the typical home. Darker green areas (higher HAI values) indicate greater affordability, where household purchasing power stretches further against prevailing home prices.
Because HAI reflects a relationship between incomes and prices, policy can improve affordability by (a) expanding the supply and variety of housing, (b) lowering per-unit development costs, (c) protecting and preserving existing attainable stock, and (d) improving household financial capacity.
> Prioritize ‘attainable ownership’ tools: downpayment assistance, shared equity, and targeted homebuyer counseling tied to specific high-stress tracts/block groups.
> Preserve naturally occurring affordable housing (NOAH): proactive code compliance plus rehabilitation grants/loans to landlords who keep rents stable and maintain units.
> Reduce displacement risk: track property tax stress, rent increases, and eviction filings (if available) in the lowest-HAI areas; coordinate with nonprofits for rapid response.
> Use land banking or land assembly near planned infrastructure investments to prevent future price spikes from making affordability gaps worse.
> Expand missing-middle housing pathways (duplexes, triplexes, townhomes) in appropriate corridors to increase attainable options without requiring high-rise multifamily.
> Create predictable, by-right standards in designated growth nodes (especially where infrastructure exists) to reduce entitlement time and financing costs that flow into prices.
> Allow accessory dwelling units (ADUs) with clear design standards in suitable neighborhoods to add gentle density and income flexibility for homeowners.
> Use parking reforms in higher-access areas (near employment centers/corridors): right-size minimums and allow shared parking to reduce per-unit costs.
> Align housing growth with capacity: use concurrency or development agreements so offsite road/drainage costs are predictable and do not create abrupt price shocks.
> Prioritize infrastructure in ‘near-threshold’ areas (HAI ~ 90–110) where modest price increases could tip neighborhoods into unaffordability.
> Streamline permitting and inspections for standard residential products; reduce time-to-build variability to lower financing and holding costs.
“Bartlett Cocke General Contractors appreciates each opportunity to continue investing in the growth and longterm prosperity of Fort Bend County. We remain committed to our mission to Build Better Lives while developing partnerships and building projects that last a lifetime.”
Marcus Wilkins Director of Business Development Bartlett
Cocke General Contractors
> Create an annual Housing Affordability dashboard by tract/block group: HAI, median value, income, tenure mix, and housing delivery (permits/ completions).
> Flag ‘risk of slippage’ areas: tracts where median HAI is 100–110 and where rapid home value growth could push affordability below 100.
> Link affordability monitoring to the CIP: prioritize projects that unlock attainable housing supply (e.g., sewer extensions, drainage upgrades) in designated nodes.
> Coordinate across cities, utility districts, and the county so that affordability goals are not undermined by fragmented standards.
> Adopt a ‘tenure balance’ target at the planningarea level to ensure rental supply and attainable ownership keep pace with employment growth.
> Institutionalize resilience and flood-risk screening so growth is steered toward safer land—avoiding long-run insurance and recovery costs that erode affordability.
> Preserve right-of-way and plan corridor mobility early; congestion costs function like a hidden affordability tax for working households.
Overall, Fort Bend County shows a predominantly below-national risk profile, but with distinct pockets of elevated and high modeled risk. The mean exceeds the median, indicating that the upper tail of block groups has substantially higher index values. 5
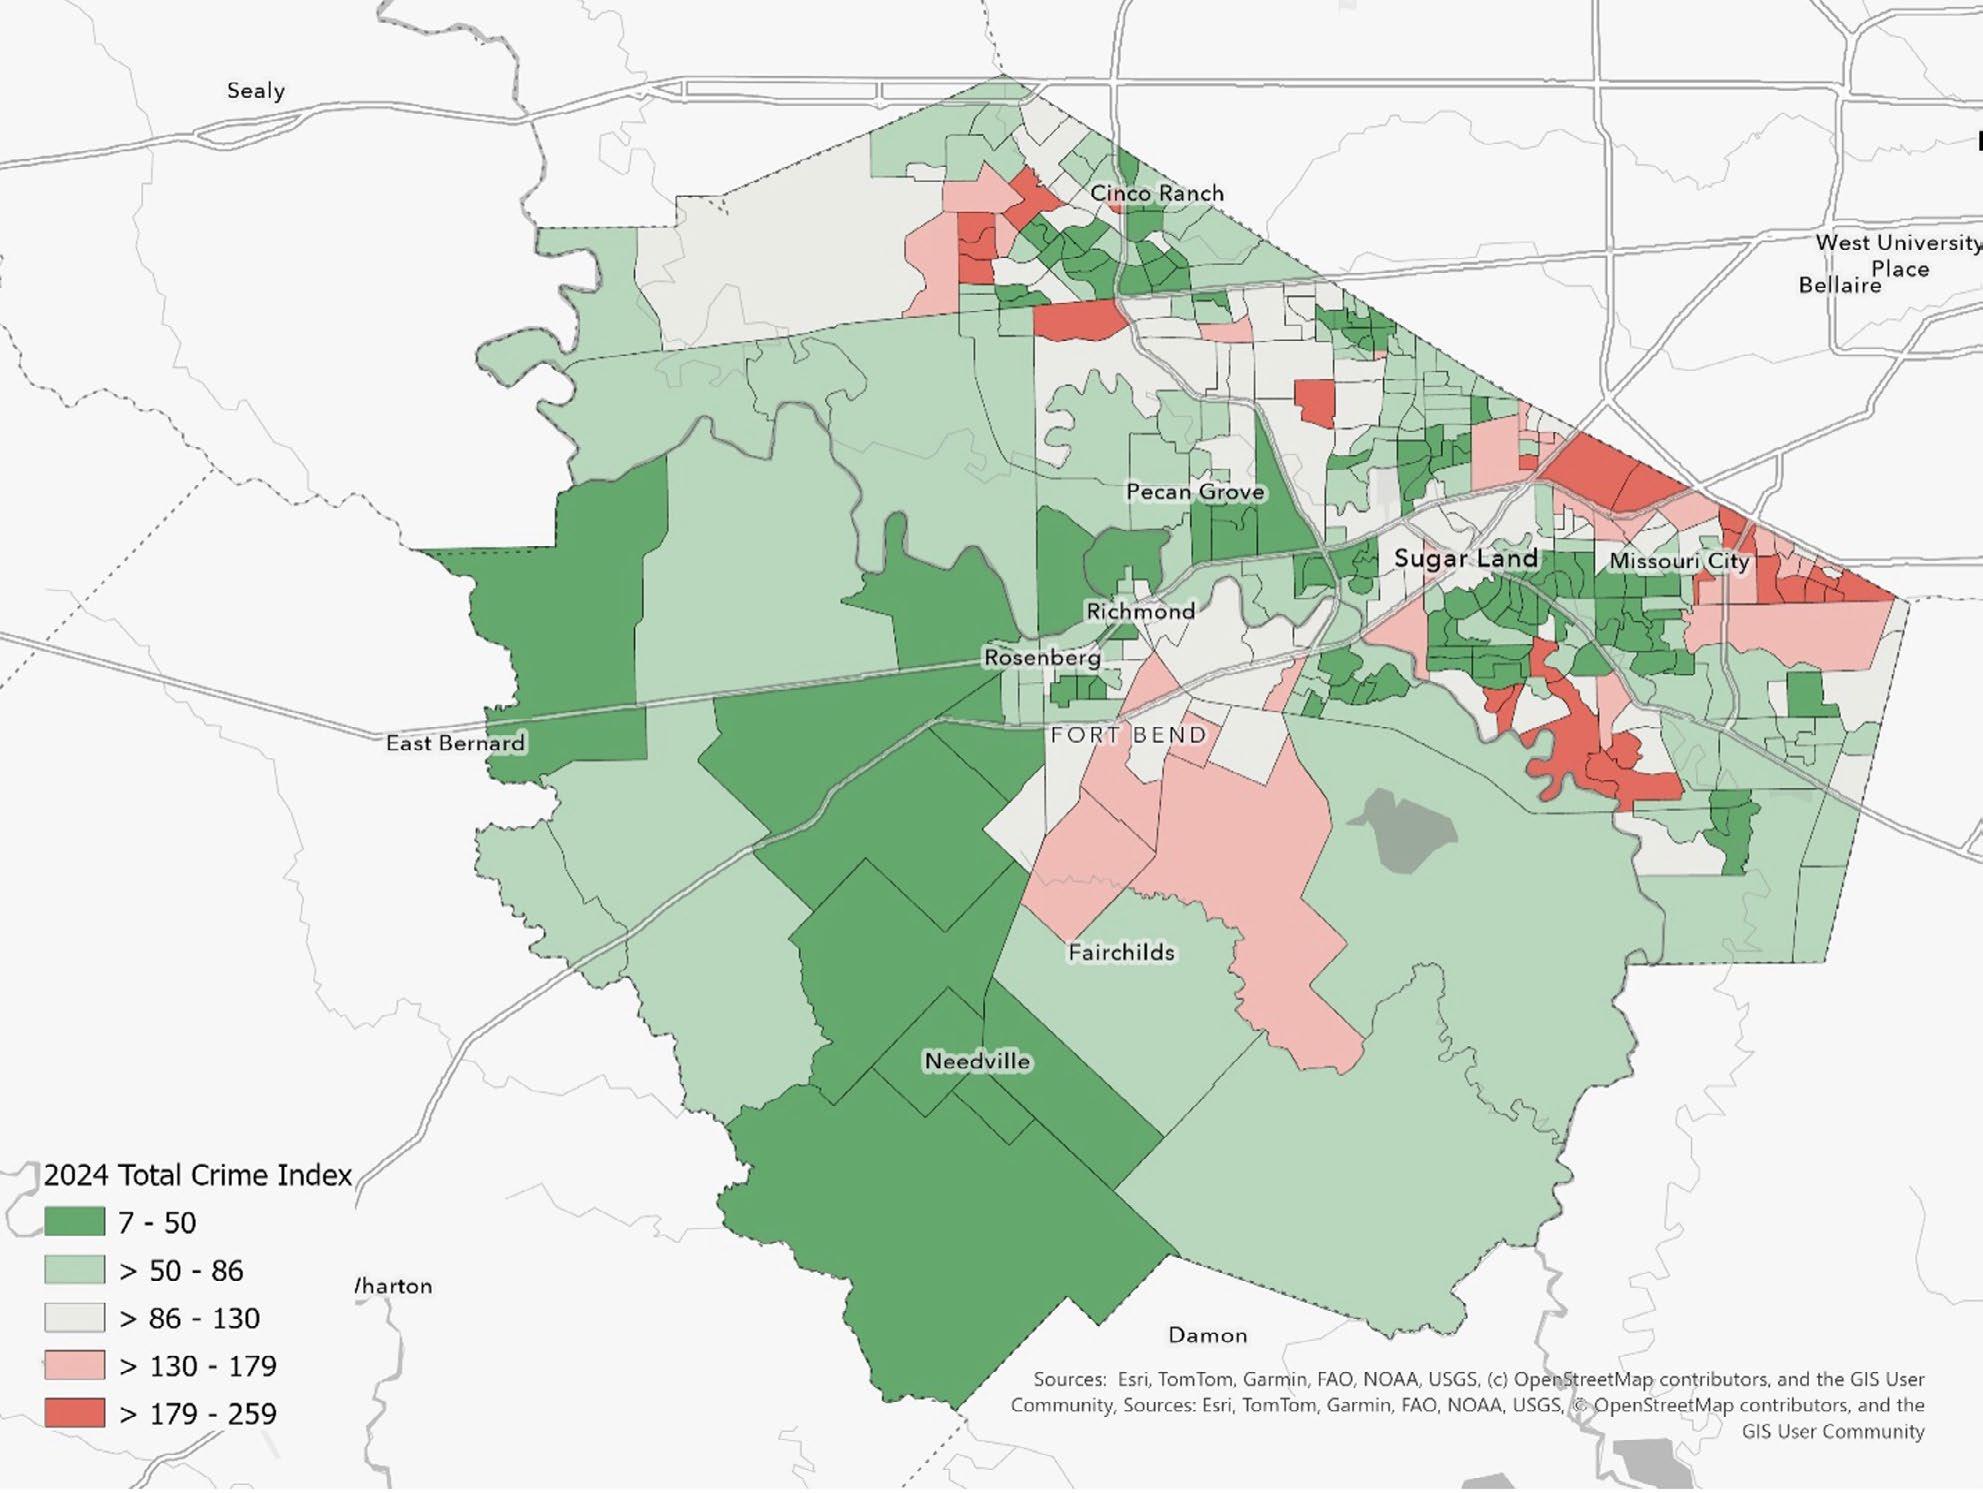
Sources: Esri, TomTom, Garmin, FAO, NOAA, USGS, © OpenStreetMap contributers, and the GIS User Community
Figure 13. Total Crime Index 2024 across Fort Bend County. Green areas indicate lower-than-average crime risk and red areas indicate higher-than-average risk (relative to the U.S. baseline of 100). Overall, most of the county is in the lower-to-moderate range, with higher-risk pockets concentrated in parts of the eastern corridor near major activity/ transportation areas.
5 The Total Crime Index is modeled using FBI Uniform Crime Report (UCR) information combined with demographic inputs from the US Census and the American Community Survey (ACS). Indexes are relative: they do not represent incident counts. They are best interpreted as a screening tool to compare places and to prioritize deeper diagnostics (e.g., calls for service, incident reports, repeat locations, and environmental conditions).
The distribution suggests that the modeled crime risk is not evenly spread. A small set of block groups accounts for most of the county’s above-average risk footprint. Moreover, elevated block groups frequently cluster within the same census tracts, consistent with corridor effects (major arterials, commercial nodes, multi-family concentrations, older built environments, and areas with higher land-use intensity). For policy and development planning, these clusters are ideal candidates for place-based interventions that combine environmental design, property management standards, and continued cross-agency coordination.
The index results point to a practical development agenda: reduce risk in the highest-tier block groups and use early interventions to prevent moderately elevated corridors from escalating. Because development patterns, built-environment conditions, and property management practices are closely tied to community safety outcomes, an effective strategy should integrate public safety into planning, infrastructure, and code enforcement.
Adopt a countywide Crime Prevention Through Environmental Design (CPTED) checklist for new multi-family, retail centers, and large parking facilities in tracts with repeated above-100 block groups. Key elements include lighting and visibility standards, clear sight lines and landscaping rules, access control (where appropriate), active frontage design to increase natural surveillance, and maintenance commitments that prevent deterioration over time.
In hotspot corridors, strengthen coordinated code enforcement and nuisance abatement for properties with chronic problems. Focus on vacancy, unsecured lots, blight conditions, illegal dumping, and repeat-address patterns. Where late-night businesses cluster, establish minimum safety plans (lighting, camera coverage, and property management expectations) as a condition of permitting and renewal.
Treat the 100–150 tier as a prevention zone. Target small-area capital improvements (lighting, sidewalks, crossings), youth and workforce programming, and proactive property standards to prevent drifting into higher tiers. This approach is cost-effective: it protects emerging commercial nodes and growing residential areas before disorder becomes entrenched.
Establish a recurring hotspot review that aligns law enforcement, EMS, code enforcement, parks and trails maintenance, and community partners on the same micro-areas. Use a shared scorecard that combines incident patterns, calls for service, repeat locations, time-to-abatement, and resident perception measures.
To understand how electricity demand in Fort Bend County has been changing—and where it is likely headed— we developed a clear, hour-by-hour picture of recent power use and extended it five years into the future. The analysis begins with a detailed reconstruction of electricity demand over the past five years and then projects those patterns forward under realistic assumptions about weather and population growth.
This report assembled the historical record using hourly electricity demand data from the Electric Reliability Council of Texas (ERCOT) “Native Load” files and paired it with local hourly temperature observations from the Sugar Land Regional Airport weather station. In years where the ERCOT files did not explicitly include calendar dates, the report rebuilds the hourly timeline using the year embedded in the filename and the order of observations in the dataset. This allowed us to create a continuous, internally consistent hourly series across multiple years.
Each hour of electricity demand was then matched with the corresponding temperature and basic calendar context—hour of the day, day of the week, and month of the year. These time markers capture the daily rhythm of residential and commercial activity as well as seasonal differences in energy use. To reflect the county’s rapid growth, we also incorporated a simple population index that increases by 3 percent per year, allowing baseline demand to rise gradually over time.
The historical data used for the analysis span the 2020–2025 period, which serves as the model’s five-year training window. Weather inputs come primarily from the Sugar Land airport station, with Hobby Airport and George Bush Intercontinental Airport used as backups when needed. Population growth is not modeled in detail by sector; instead, a transparent growth assumption is used to ensure that long-run demand trends upward realistically as the county continues to add residents and jobs.

In some of the annual ERCOT files available for this work, the detailed “Houston zone” load series was not consistently present. In those cases, we relied on ERCOT’s total system load and applied a conservative scaling factor— approximately 3 percent—to represent Fort Bend County’s share of statewide demand. This approach keeps the estimates in a realistic range and preserves the underlying hourly and seasonal patterns.
To translate these inputs into a forecast, we estimated a straightforward statistical model that links hourly electricity use to three core drivers: temperature conditions, time of day and time of year, and population growth. The temperature component captures both cooling demand during hot periods and heating demand during cold periods. The calendar controls account for predictable daily and seasonal cycles, while the population index allows demand to trend upward over time even under “normal” weather conditions.
We then projected electricity demand forward five years using typical, long-run average temperature patterns for each hour of the year and continuing population growth at 3 percent annually. The result is a detailed, hour-by-hour outlook for Fort Bend County that reflects both short-term variability and longer-term structural growth.
The model performs well. It explains roughly 89 percent of the hour-to-hour variation in electricity demand in the historical data, which is strong for a model driven primarily by weather and calendar effects. This indicates that it captures the dominant forces shaping electricity use in the region.
Temperature effects behave exactly as expected. Demand rises when temperatures climb above roughly 65 degrees Fahrenheit, reflecting increased air-conditioning use, and it also rises during colder periods as heating demand increases. In the Houston-area climate, the cooling effect is slightly stronger than the heating effect, consistent with the region’s long, hot summers.
Daily and seasonal patterns are also clear. Electricity use is lowest overnight, increases during the morning as households and businesses become active, and peaks in the late afternoon and evening. Summer months— particularly June through August—show the highest demand, while spring and fall are generally lower unless interrupted by heat waves or cold fronts.
Population growth plays a critical role in shaping the long-term trajectory. As Fort Bend County grows, baseline electricity demand rises alongside it. By incorporating a simple population index, the forecast naturally trends upward over time, even when weather conditions are held at normal levels.
When scaled to represent Fort Bend County specifically, the estimates suggest that recent evening demand frequently falls in the range of roughly one to two gigawatts during high-use periods, particularly in summer. These levels reflect a combination of strong cooling demand and a rapidly expanding population. While the exact magnitudes will be refined once Houston-zone data are fully incorporated, the underlying patterns—higher demand during hot hours, summer peaks, and evening surges—are robust and will not change.
Given that extreme weather events seem to be occurring at higher rates, these were left in the data. Taken together, this approach provides Fort Bend County with a practical, intuitive picture of electricity demand that aligns with lived experience: hot afternoons drive usage up, cold snaps do as well, evenings are consistently the busiest, and growth matters.
Series: History Forecast
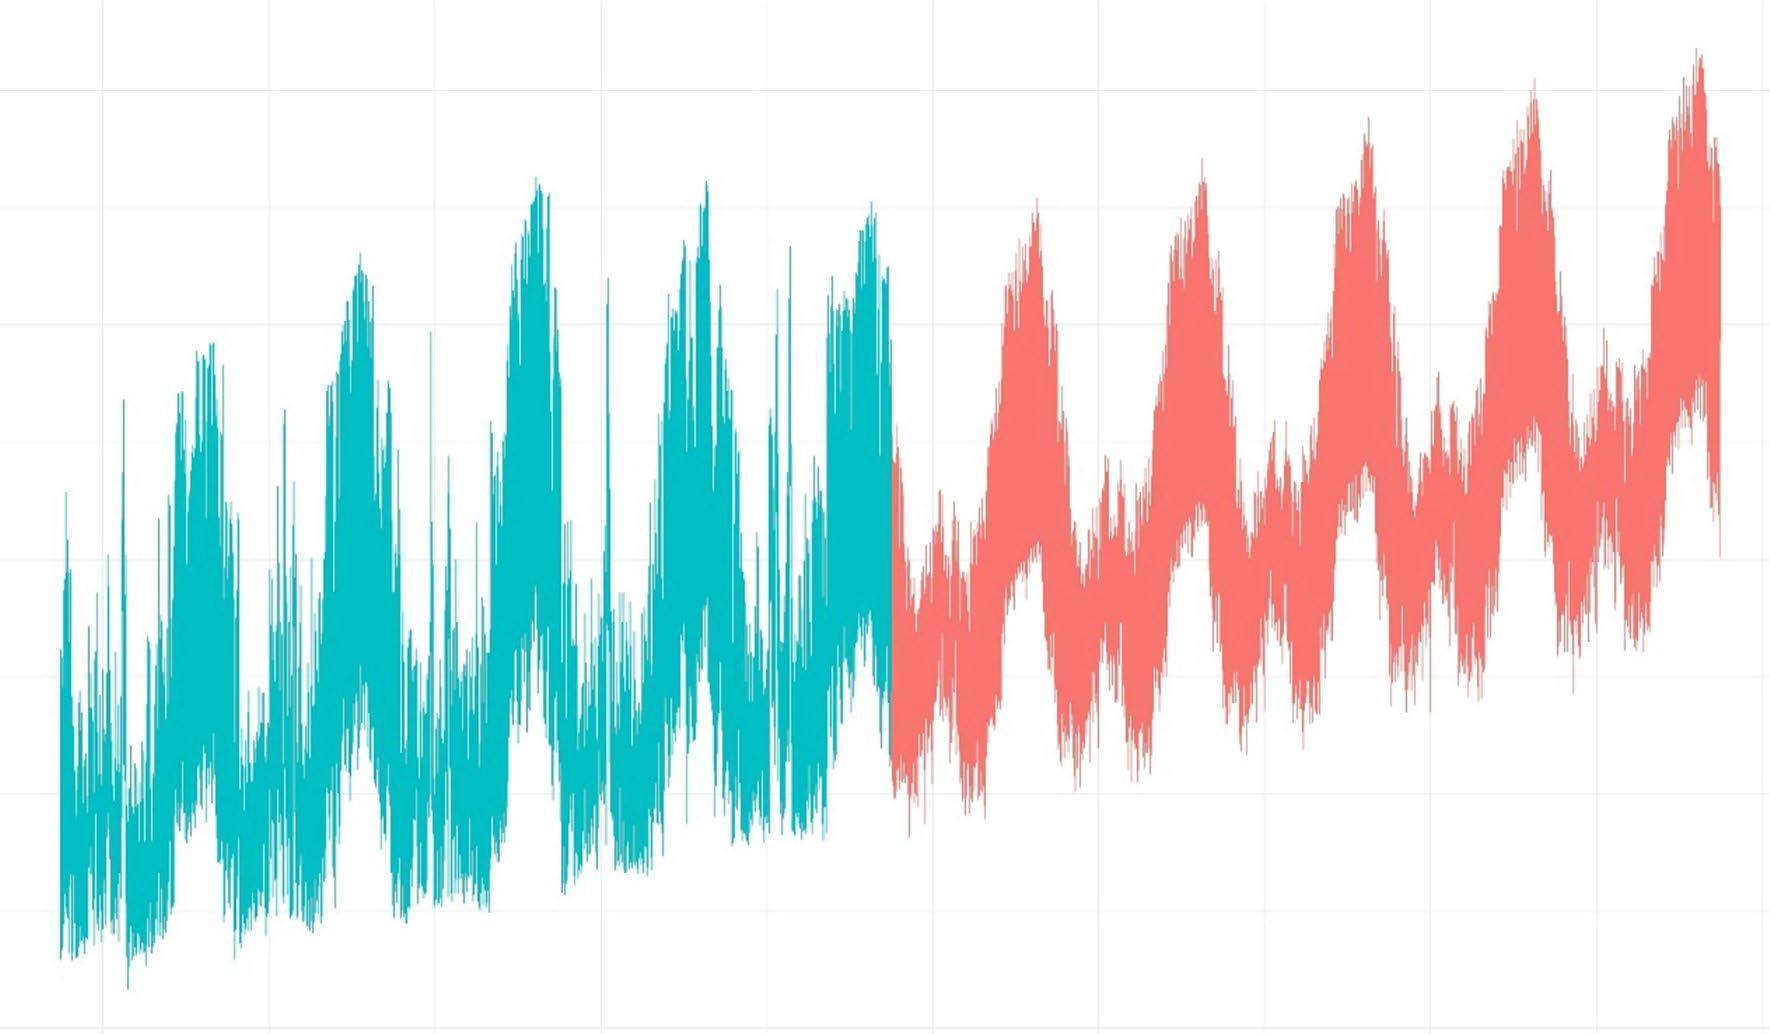
“POWER-READY SITES” PROGRAM (ECONOMIC DEVELOPMENT ORGANIZATION (EDO) & TRANSMISSION AND DISTRIBUTION UTILITY (TDU))
> Create a tiered list of sites with substation proximity, dual-feed options, and upgrade timelines.
> Pre-entitle priority sites; pre-negotiate easements; publish interconnection checklists/timelines.
PEAK-SMART INCENTIVES FOR NEW & EXPANDING FIRMS
> Tie abatements/agreements to peak-friendly design (high-Seasonal Energy Efficiency Ratio (SEER) HVAC, cool roofs, thermal/battery storage, smart controls).
> Promote Time-of-Use (TOU)/critical-peak tariffs; enroll in curtailable/interruptible riders.
> Zone for shared small modular reactors, solar, and storage microgrids with islanding for critical operations.
> Use Property Assessed Clean Energy (PACE), green bonds, U.S. Department of Energy (DOE)/Inflation Reduction Act (IRA) tools; consider Energy Service Company (ESCO) delivery.
> Steer to sites with dual feed/N-1 redundancy (able to withstand the loss of one component), room for a substation, and compliant backup gen pads.
> Require Demand Response (DR)/Virtual Power Plant (VPP) participation and 2–4 hours of storage per MW of Information Technology (IT) for peak relief.
> Encourage heat reuse and non-potable water loops.
> Bulk smart thermostats; Rooftop Unit (RTU) tune-ups/retro-commissioning for retail; in-unit HVAC upgrades in multifamily.
> Enroll devices in critical-peak response; target May–August rollouts.
> Scale: 10,000 smart thermostats ≈ 5–8 MW of dispatchable peak relief.

> Set critical-facility standards for backup power and community cooling centers.
> Promote solar + storage at grocery/pharmacy hubs to protect cold chains.
> Pitch continuity/talent benefits to relocating or expanding firms.
> Publish triggers for studies, timelines by size class, and a fast-track for storage-paired projects.
> Predictability reduces risk and accelerates investment.
> Adopt cool roof/envelope enhancements for large shells; allow storage/thermal mass alternates.
> Lead by example: county buildings with TOU-aware controls and storage.
> Curate a local integrator/vendor list (controls, storage, microgrids, HVAC retrofits).
> Partner with local colleges and the University of Houston for short courses in Distributed Energy Resources (DERs) and energy analytics.
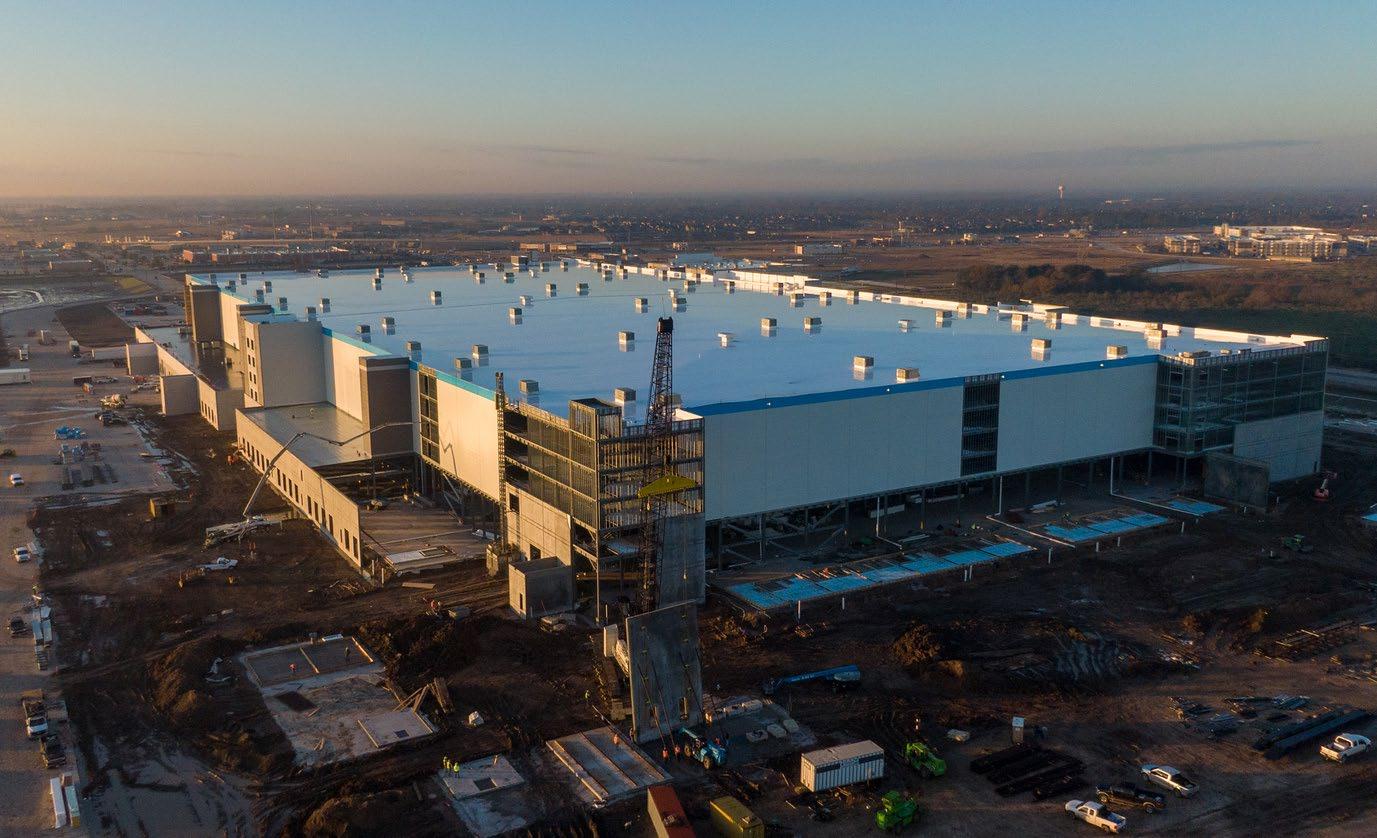
One of the barriers to faster power delivery and economic expansion can be the traditional model where the incumbent utility alone is responsible for approving and constructing interconnection infrastructure. While Transmission and Distribution Utilities (TDUs) follow safety and regulatory requirements under the Public Utility Commission of Texas (PUC) rules when integrating distributed generation or large loads, this can contribute to longer timelines and uncertainty for new developments.
To broaden options and reduce friction for developers, Fort Bend County can explore and support alternative infrastructure pathways, such as:
Study the appropriateness of developing, under federal and state law, independent developers (through mechanisms such as high-voltage direct current or merchant transmission projects) involvement in the building of transmission lines that interconnect directly to ERCOT’s grid, bypassing the traditional incumbent utility build-out.
> Policy action: Encourage County engagement with third-party transmission proponents (e.g., HVDC projects) to identify opportunities where non-CenterPoint lines could serve new load centers when economically justified.
ERCOT’s “Connect and Manage” / Coordinated Interconnection Planning Reforms
ERCOT is actively revising its interconnection processes to deal with the surge of large load requests (especially for data centers and similar economic growth projects) by grouping studies (“Batch Zero”) and prioritizing efficient planning. This is a market-wide effort separate from any single utility’s build decisions and stands to accelerate interconnection readiness once criteria are finalized.
> Policy action: Advocate for Fort Bend County participation in ERCOT’s interconnection stakeholder processes, ensuring that large economic development projects are included in early-batch planning to reduce uncertainty and queue times.
Support for Behind-the-Meter and Non-Exporting DER Installations
Even without exporting to the grid, distributed generation and storage systems can be connected in ways that reduce reliance on upstream utility upgrades. Some jurisdictions and utilities streamline interconnection for non-export systems (which have limited grid impact) and energy storage systems that support local reliability.
> Policy action: Promote and incentivize behind-the-meter generation and storage paired with advanced controls for campus and industrial parks, reducing the need for large utility network reinforcements and creating local resilience.
Explore Community Aggregation and Retail Supply Alternatives (where legislatively possible)
While Texas does not currently have a formal Community Choice Aggregation (CCA) law like some other states, similar concepts — aggregating load to negotiate better supply and infrastructure solutions — could further empower local entities to work with competitive developers, retail electric providers (REPs), and DER providers rather than being limited to incumbent utility infrastructure timelines.
> Policy action: Monitor potential future legislation or PUC rule changes that might enable local power purchasing or aggregation mechanisms to create competitive alternatives to utility-led infrastructure deployment.
Fort Bend has built a solid, technically sound foundation around one clear idea: detain the peak and move the water. At the county scale, the Drainage District’s mission is straightforward—maintain channels and review new development to prevent adverse drainage impacts on current and future residents. The county already insists that every meaningful project “make room for the water,” but almost entirely in service of flood control rather than as a systematic strategy for reuse, cooling, or community amenity. The county’s strategy takes flood risk seriously and is willing to invest in large-scale storage. However, these projects are still engineered primarily as single-purpose basins and pump stations—highly functional, but not yet conceived as multi-benefit “sponge” landscapes that also deliver shade, cooling, recreation, or non-potable water supply.
Taken together, the County’s approach to water is clear: Fort Bend’s current strategy is a strong starting point. The county is already very good at insisting on detention, protecting downstream properties, and building major storage where it matters. The opportunity now is to build on that strength and transcend it—to evolve from a system that simply detains and drains toward one that also captures, cools, reuses, and enhances the places where people live. Most water authorities are already implementing some of these core ideas that the county needs to continue supporting.
Fort Bend County’s land use, transportation, housing, and economic development decisions need to be grounded in a realistic view of long-term water availability and regulatory constraints.
Texas Water Development Board’s Region H already treats Fort Bend as one of the major demand centers in the region. In 2020, Fort Bend’s population was just over 800,000, and municipal water use was on the order of 125,000
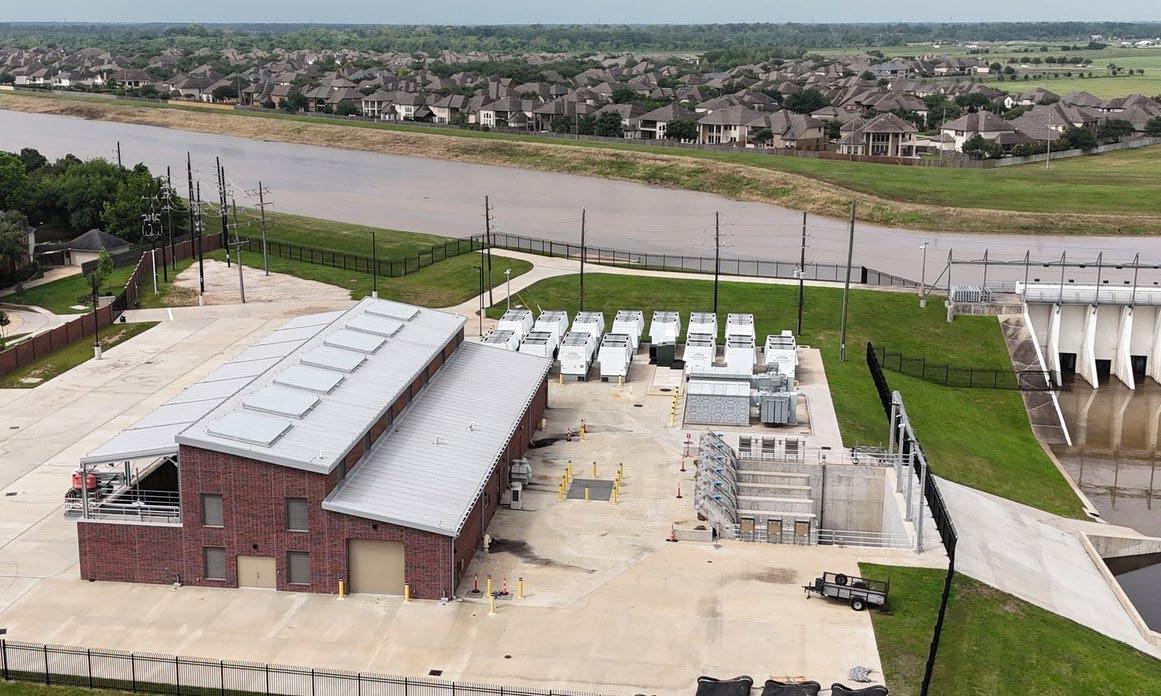
acre-feet per year—putting the County in the same conversation as the large municipal providers in Harris County. The 2026 Regional Water Plan projects that Fort Bend’s future “needs” (shortfalls) are driven almost entirely by municipal demand, with gaps growing from roughly 40,000 acre-feet in 2030 to more than 100,000 acre-feet by 2080 if the status quo is maintained.
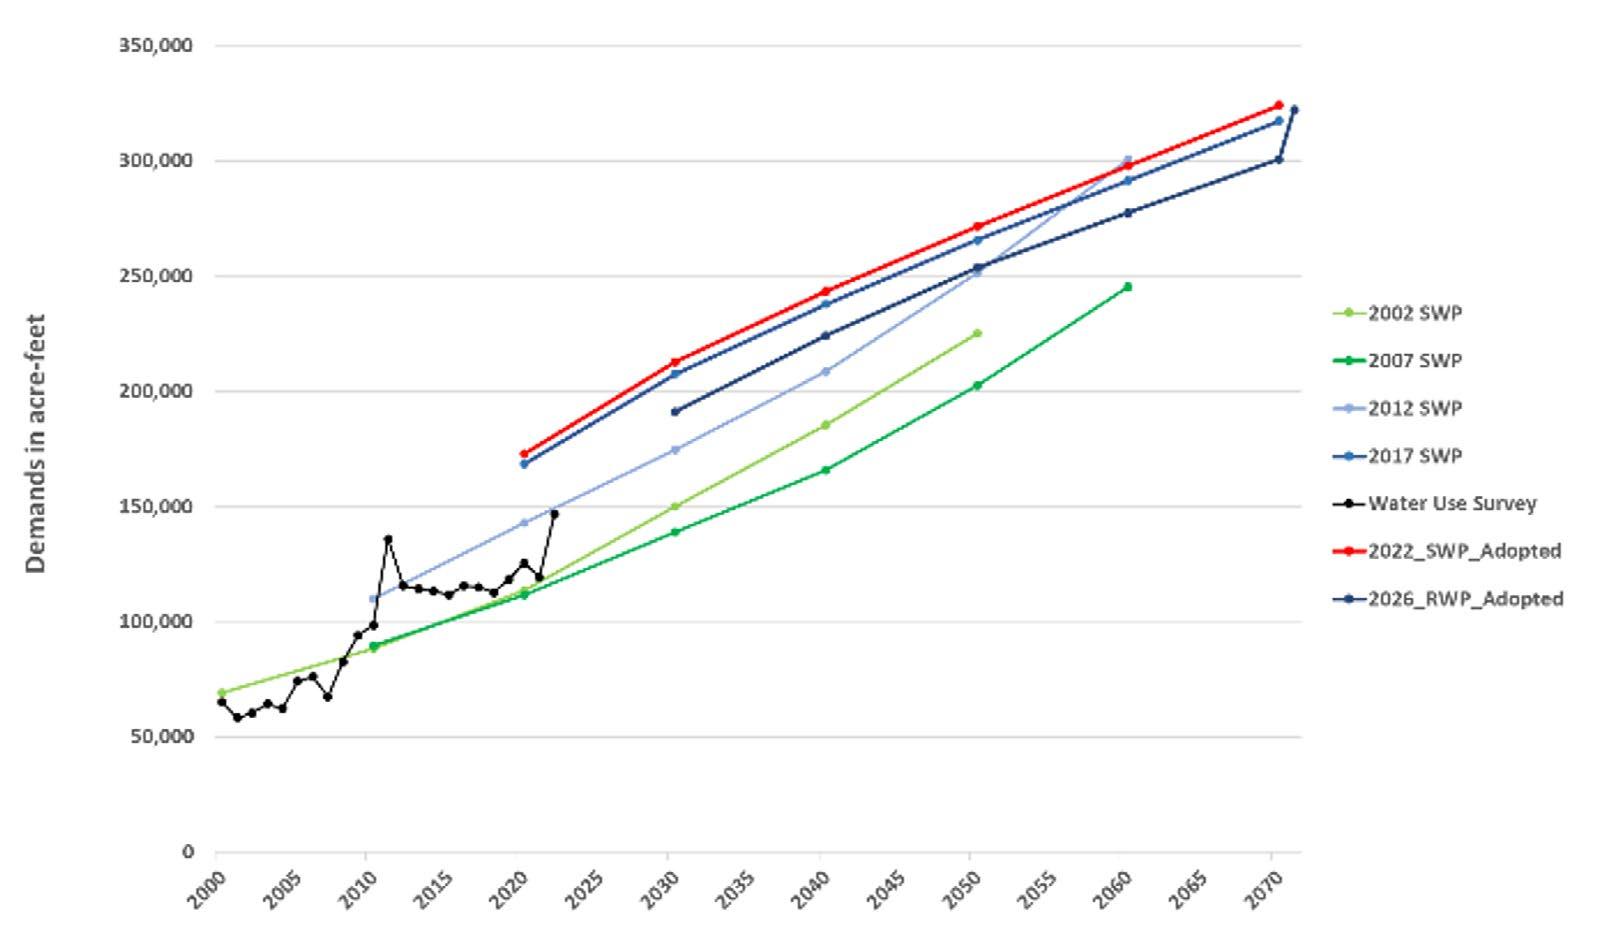
2002 SWP
2007 SWP
2012 SWP 2017 SWP
Water Use Survey
2022_SWP_Adopted
2026_RWP_Adopted
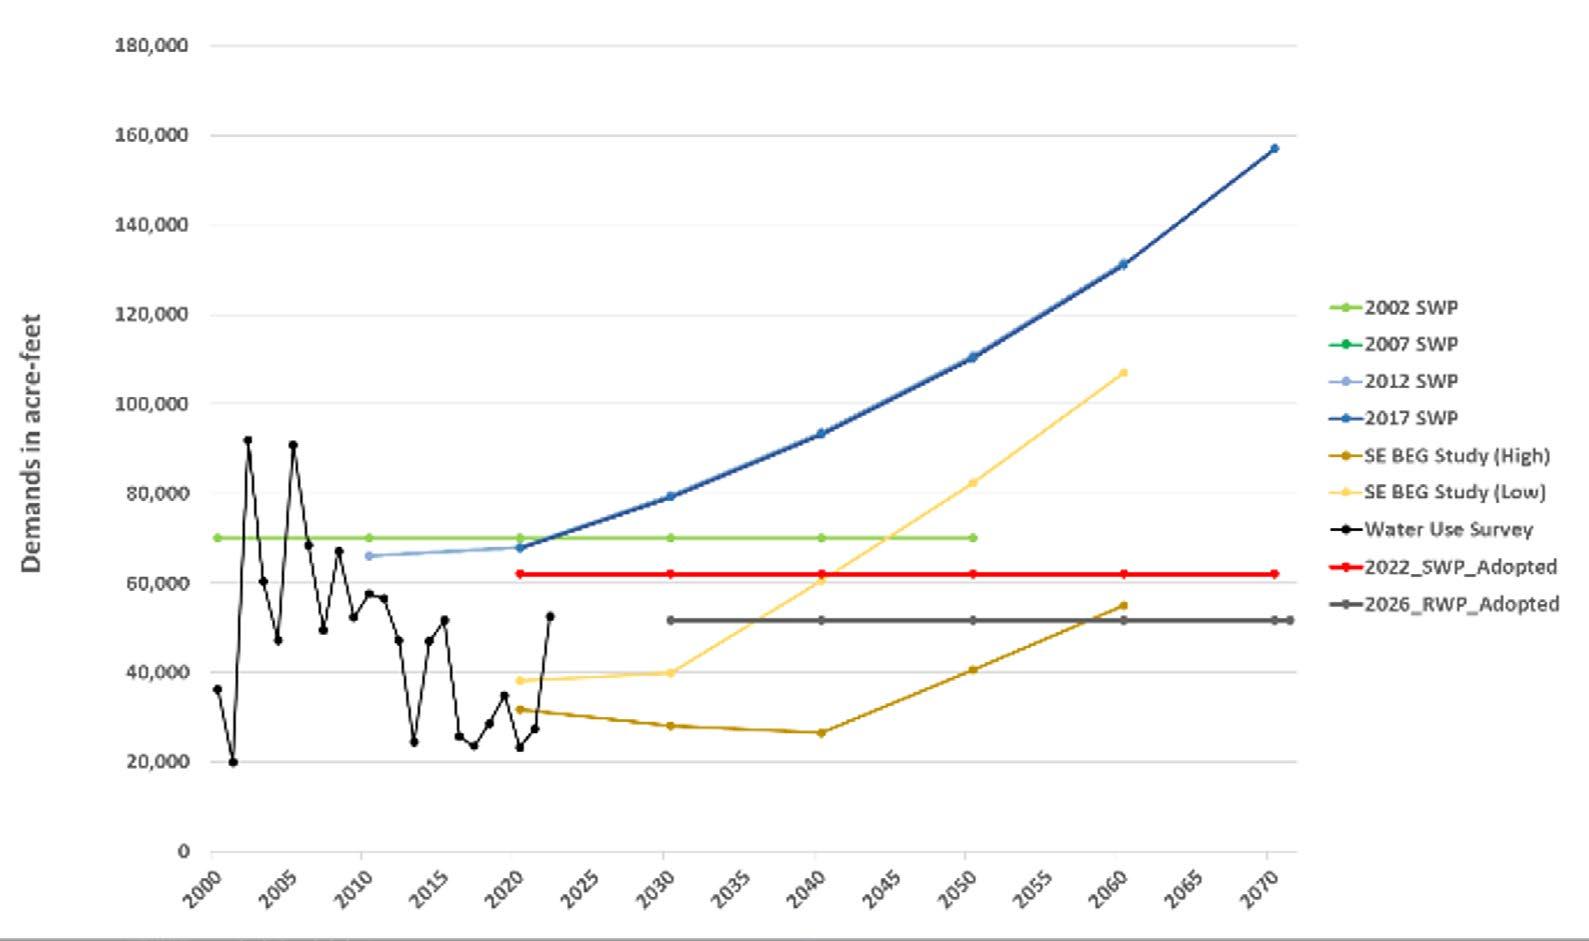
2002 SWP
2007 SWP
2012 SWP
2017 SWP
SE BEG Study (High)
SE BEG Study (Low)
Water Use Survey
2022_SWP_Adopted
2026_RWP_Adopted
At the same time, Fort Bend carries substantial non-municipal demands (irrigation, livestock, manufacturing, and steam-electric power), sits in a subsidence district with binding groundwater rules, and hosts unique ecological assets such as Big Creek and the Brazos River floodplain. In short, water supply planning is no longer a narrow utility issue. It is now central to the county’s broader growth and quality-of-life strategy.
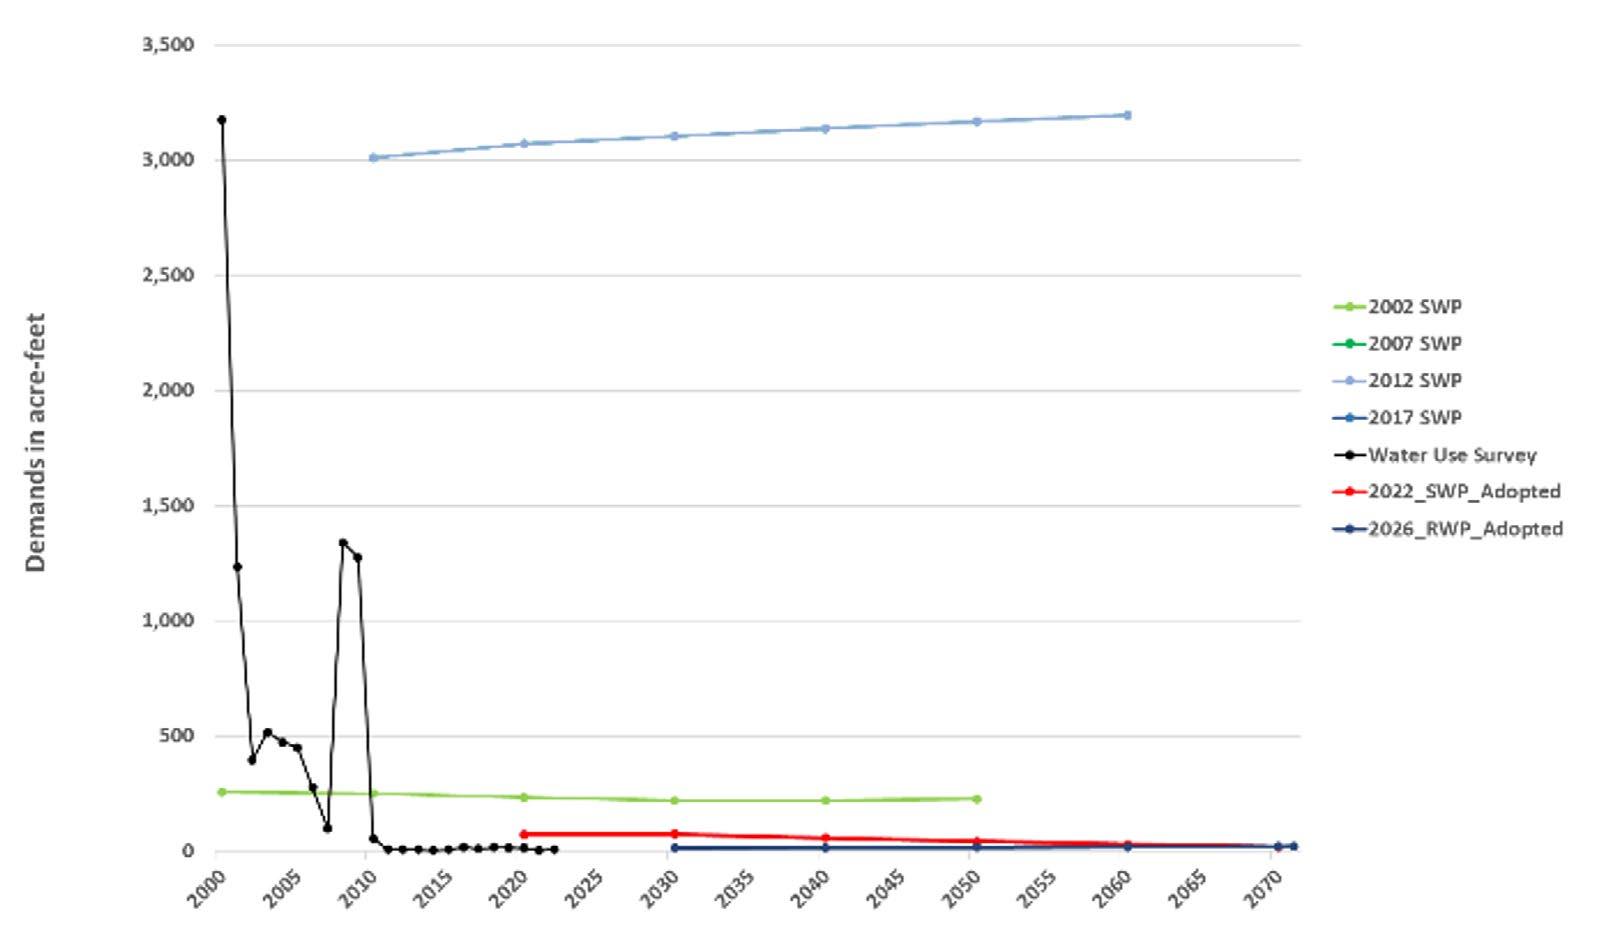
2026_RWP_Adopted
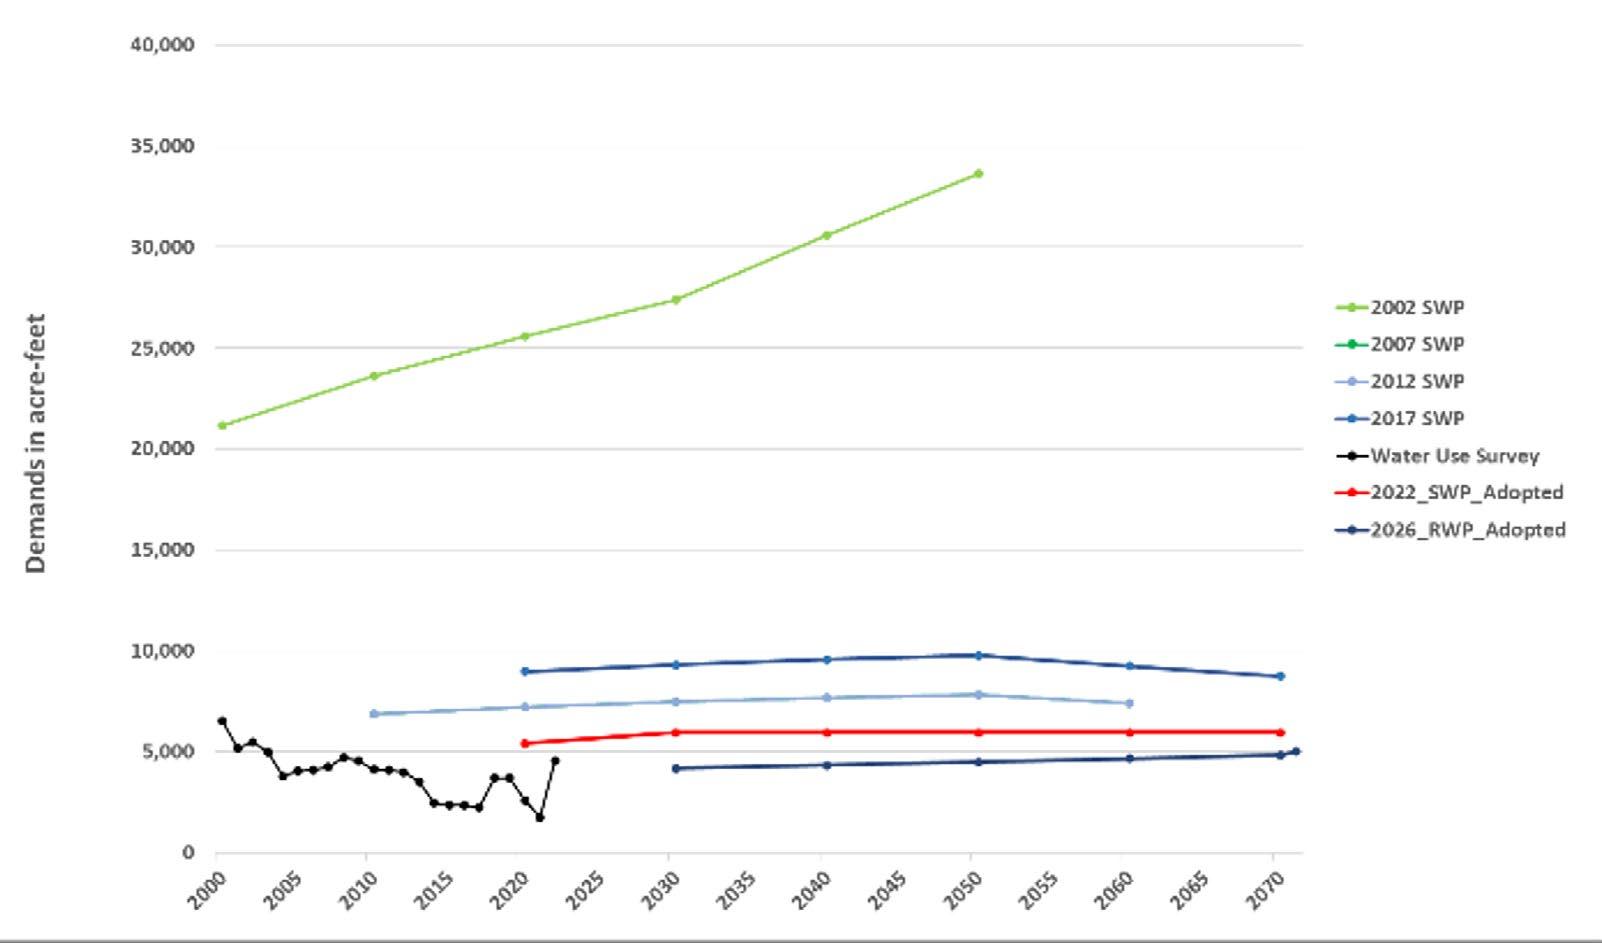
Demands
2022_SWP_Adopted
2026_RWP_Adopted
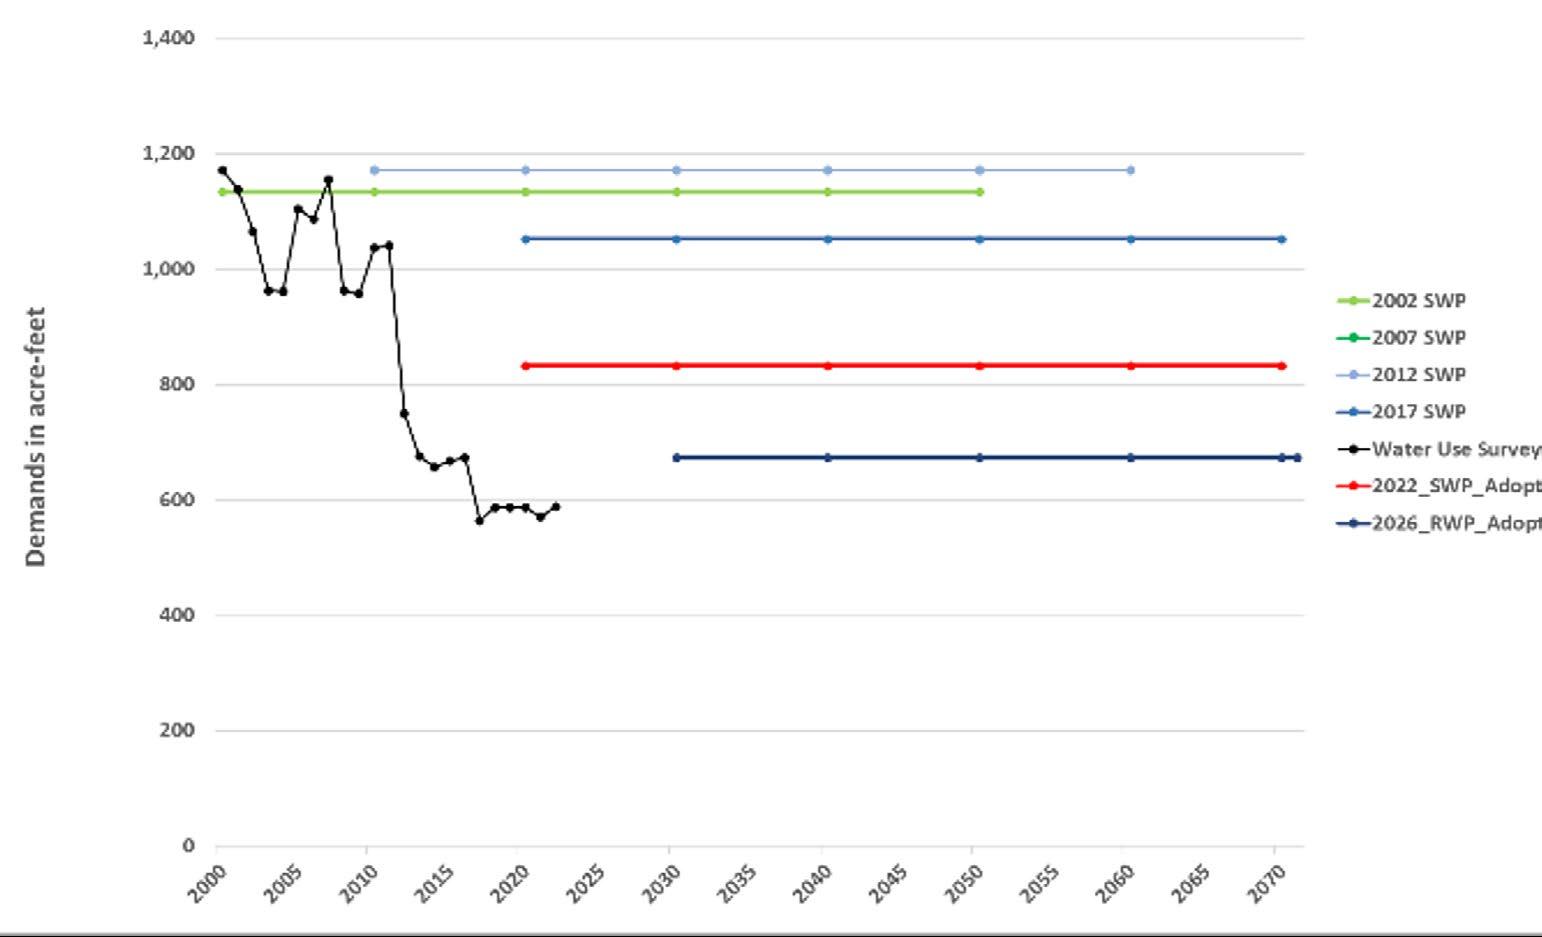
Demands in acre-feet
2002 SWP
2007 SWP
2012 SWP
2017 SWP
Water Use Survey
2022_SWP_Adopted
2026_RWP_Adopted
Demands in acre-feet
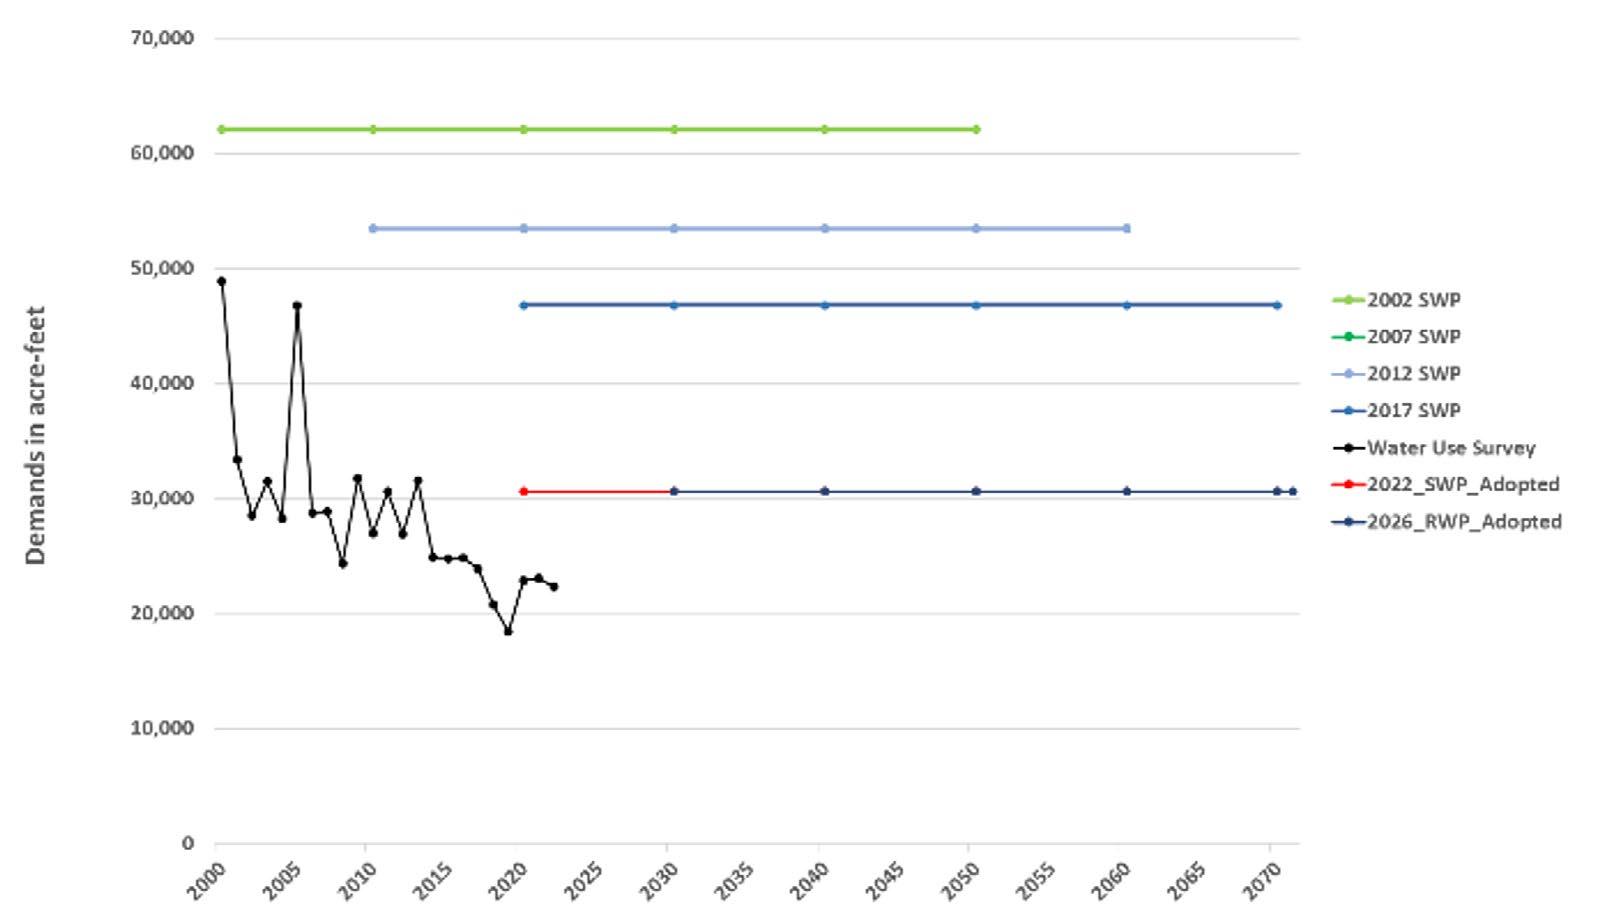
Figure 15. Fort Bend County Water Demand Projections in Region H
Source: https://www.twdb.texas.gov/waterplanning/data/dashboard/index.asp
2002 SWP
2007 SWP
2012 SWP
2017 SWP
Water Use Survey
2022_SWP_Adopted
2026_RWP_Adopted
First, Fort Bend is a fast-growing, high-demand county whose water story is now dominated by municipal use. The projected shortfalls are almost entirely about keeping up with people and housing, not industry. That reality needs to show up in how County leaders think about future development approvals, roadway corridors, and capital projects.
Second, Fort Bend County’s water system is deeply regional. Cities and districts in Fort Bend depend on a mix of self-supplied groundwater, surface water from the Brazos River, and imported supplies and services from entities such as the Gulf Coast Water Authority (GCWA), the Brazos River Authority (BRA), the City of Houston, and the North Fort Bend Water Authority (NFBWA), and the West Fort Bend Water Authority (WFBWA). No single utility can solve this on its own.
Third, Fort Bend sits inside the Fort Bend Subsidence District. Groundwater pumpage is regulated, conversion to surface water is mandatory on a schedule, and subsidence risk is real. The Regional Water Plan (RWP) explicitly ties some of the county’s projected supplies and projects to subsidence rules and Groundwater Reduction Plan (GRP) timelines. Given these constraints, the County, even though it does not have the authority to supply water, cannot afford to treat this issue as an appendix that only water authorities need to worry about. Stormwater and water supply need to be one of the core reference points in the county’s long-range planning, on par with traffic models, floodplain maps, and demographic forecasts.

Fort Bend’s major municipal demand centers on future shortfalls that are almost entirely tied to people, housing, and jobs. The county’s projected municipal water needs climb sharply over the planning horizon. Ignoring this reality will impose future supply crunches, expensive emergency fixes, or both.
At the county level, the response should be straightforward: build those demand projections into the county’s core planning work. That means using the RWP as a baseline when considering long-term land use, corridor planning, and major rezoning decisions. It also means asking hard questions when a proposed development or special district implies densities that clearly outrun the regional water assumptions.
Practically, the County can:
> Continue supporting water authorities’ requirements for large developments and new or expanded MUDs/ WCIDs to show how their 30- to 50-year water needs stay within the region’s water supply.
> Tie county letters of support for potential developmental projects to clear, credible water supply strategies.
> Continue supporting water authorities’ roadway and utility corridor planning with the County’s. The goal is not to slow growth, but to anchor it in a realistic picture of water availability.
Conservation and water loss reduction are not side projects. They are first-tier strategies that can deliver large, relatively low-cost volumes. Advanced conservation and water loss control for municipal systems together represent well over 200,000 acre-feet of potential savings region-wide—comparable to major new supply projects, but with lower long-term risk.
For Fort Bend, conservation should be treated as a fundamental aspect of infrastructure. The county should maintain partnerships with utilities that are seeking state funding support. Additionally, major developments should have a current conservation and water-loss plan that is at least as ambitious as the assumptions in the RWP. Furthermore, the county should continue supporting conservation and reuse programs led by water authorities such as the NFBWA and the WFBWA.
On the ground, that translates into things like Advanced Metering Infrastructure (AMI), smart irrigation standards in new subdivisions, leak detection programs that are funded and evaluated, and plumbing codes for new construction that lock in efficiency from the start. For small and medium-sized systems, the county can help by partnering with NFBWA, WFBWA, GCWA, and BRA to create shared services for analytics, technical assistance, and customer outreach, rather than expecting each entity to invent its own program from scratch.
Because Fort Bend sits in a subsidence district, groundwater reduction and conversion to surface water are not optional. The RWP explicitly calls out a series of GRP-related projects in Fort Bend, including Sugar Land’s Integrated Water Resource Plan, GRPs for Missouri City, Richmond, and Rosenberg, and GRP-driven projects in Fort Bend MUD 25 and Fort Bend WCID 2. The North Fort Bend Water Authority’s GRP is the backbone for many of these efforts and is explicitly tied to the subsidence district’s rules.
The county’s policy posture should be to reinforce that direction. In practice, that means making “GRP alignment” a basic standard for any new or expanded special district in regulated areas. New districts should either join an existing GRP (such as NFBWA or a city GRP) or demonstrate how they will meet subsidence requirements with a robust surface water strategy that is consistent with the regional water plan.
At the same time, the county can help avoid duplication and stranded investments by mapping planned GRP transmission and treatment projects against county road projects. Knowing that an entity or a city will be extending a major line along a corridor, the county should coordinate easements, crossings, and construction schedules on the front end. That saves resources, reduces disruption, and speeds up conversion.
Fort Bend’s water picture is inherently regional. GCWA supplies Brazos River water to cities and districts in the county, including Missouri City, Sugar Land, and Fort Bend WCID 2, as well as to manufacturing users. NFBWA brings in treated surface water purchased from the City of Houston. BRA, in turn, manages major Brazos River supplies and contracts. No one is operating in a vacuum.
County leadership has to take into account the multitude of stakeholders involved and, in some cases, refresh high-level MOUs with GCWA, BRA, WFBWA, NFBWA, and the City of Houston that acknowledge Fort Bend’s
projected demands. The county can then use already established corridors by water authorities as a lens for overall county planning and tie them into robust regional surface systems to gain a clear advantage over isolated groundwater-only strategies that may not be sustainable.
The RWP also leans on reuse—especially non-potable reuse—as part of the long-term supply portfolio. It highlights existing and planned projects, including GCWA municipal reuse, NFBWA member-district reuse, and wastewater reclamation projects designed to serve irrigation and other non-potable demands.
Fort Bend already has building blocks in place, such as reuse components in Sugar Land’s planning and in certain MUD-level projects. The county can turn those isolated examples into a strategy by identifying where reuse makes the most sense—parks and athletic complexes, golf courses, HOA common areas, and certain industrial parks—and lining those up with existing and planned wastewater treatment plants.
A practical step is to adopt a “reuse-ready” standard for large new developments located near existing or planned treatment plants. That would mean requiring purple-pipe or dual-plumbing stubs in new subdivisions and commercial sites so that, when reuse lines are extended, they can be connected quickly and at relatively low cost. Coupled with technical assistance from NFBWA and GCWA on design and rate-setting, this gives Fort Bend a way to stretch supplies without waiting for large new raw water projects.
Region H’s RWP designates Big Creek in Fort Bend County as a Unique Stream Segment. The plan describes Big Creek as an old Brazos River channel with oxbows, bottomland hardwoods, wetlands, and high habitat value, much of it within or adjacent to Brazos Bend State Park. The plan also notes that projected demands will change return flows to Big Creek, with implications for hydrology and ecology.
From a county perspective, Big Creek and the surrounding Brazos floodplain should be treated as “working green infrastructure”—assets that provide flood attenuation, water-quality benefits, recreation, and habitat. The Unique Stream designation gives Fort Bend a strong rationale to embed stronger protections into subdivision, drainage, and floodplain regulations in that corridor.
Concretely, the county can require wider riparian buffers, limit channelization, and favor buyouts or conservation easements in high-risk floodplain areas along Big Creek and the adjacent Brazos corridor. The County can also use this area as a “OneWater” lab, monitoring how changes in wastewater discharges, reuse, and land use affect flows and ecological indicators over time. That turns a regulatory requirement into a visible quality-of-life asset.
The RWP makes clear that many of the most vulnerable systems are small utilities and rural or unincorporated areas that show up in the plan as “County-Other” water user groups. Their needs are often driven as much by infrastructure gaps and regulatory constraints as by raw water availability.
Fort Bend can address that vulnerability by treating small systems as a defined portfolio rather than a collection of isolated problems. The first step is diagnostic: map all small systems—service areas, sources, storage, interconnections, and recent outage history. Once that picture is clear, the County can prioritize projects that create redundancy and resilience, such as emergency interconnects between neighboring systems, backup wells or storage in single-source areas, and targeted main replacements in places with chronic leaks or breaks.
County policy can then tie support to preparedness. For example, small systems seeking county-backed funding or letters of support could be required to have current drought contingency plans and at least one interconnect memorandum of understanding with a neighboring system. The county can also help bundle multiple small projects into larger funding applications that are more competitive at the state level.
Region H recognizes the institutional complexity of this region: subsidence districts that regulate groundwater, regional water authorities that manage conversion and surface water projects, river authorities, and a mix of cities and special districts. In Fort Bend, that includes the Fort Bend Subsidence District, NFBWA, WFBWA, GCWA, BRA, and multiple cities, LIDs, Fort Bend Levee Coalition, and MUDs.
Rather than treating those institutions as separate tracks, Fort Bend can convene them into a standing OneWater and subsidence working group. The charge would be to keep land use, water supply, and subsidence policy in the same conversation. That means aligning planned GRP and surface-water projects with the county’s growth corridors and flood-control work, and flagging potential conflicts early.
Each year, the group could produce three simple products: a shared map of planned water and wastewater infrastructure overlaid on county growth and floodplain maps; a short report on subsidence and groundwater trends; and a scorecard that tracks the status of Fort Bend–related Water Management Strategies in the region. Those deliverables give Commissioners Court and staff a clear way to see whether we are implementing the plan we say we are relying on.
Fort Bend’s water story is not just about households. The county already hosts meaningful non-municipal demands, including manufacturing, irrigation, and steam-electric power. Entities like NRG and GCWA supply water to these sectors using a mix of river rights, groundwater, and contracts.
That reality should inform how the county approaches economic development. When recruiting or negotiating with potential employers—especially large industrial or power-adjacent projects—the county should ask basic questions about projected water use, peak demands, cooling technology, and reuse. High-water-intensity industries should be steered to locations with robust, diversified supplies and strong infrastructure, not to the edges of small systems that are already stretched.
The county can also tie local incentives to water performance. For example, premium tax abatements or local support packages could be contingent on using high-efficiency cooling and process systems, implementing internal reuse where feasible, and participating in county or authority-run demand management programs. That keeps Fort Bend jobs strategy aligned with the county’s long-term water strategy, rather than trading one off against the other.
This section provides a 5-year forecast for traffic volumes and congestion levels for road segments in Fort Bend County. It does this by integrating traffic volume data from TxDOT monitoring stations, along with relevant metadata, and TxDOT’s roadway inventory, which includes information on lane counts, speed limits, and segment lengths.
This workflow produces a planning-grade screening forecast, not a full travel demand model. Results are best used to identify emerging pressure points along corridors and segments. Because the approach applies station-derived growth trends (or a countywide default where station matches are not available), it does not fully capture network re-routing, induced demand, land-use feedbacks, signal timing and intersection operations, incident/nonrecurring delay, or corridor-specific capacity constraints beyond the simplified per-lane capacity assumptions. The congestion measures are also peak-hour representations driven by peak-hour and directional distribution factors rather than an hour-by-hour daytime profile, so the delay metrics should be interpreted as relative, comparative indicators (useful for ranking and targeting), not as definitive estimates of total daily delay.
Using the projected 2030 segment-level delay proxy, we translated peak-hour delay into an approximate economic cost of time lost. For each roadway segment, the model estimates per-vehicle delay and aggregates it across peak-direction flow to produce the delay burden. We monetized this delay by applying the U.S. DOT-recommended Value of Travel Time Savings of $21.80 per person-hour (2024 dollars - https://www.transportation.gov/office-policy/transportation-policy/revised-departmental-guidance-valuation-travel-time-economic) and treating the delay burden as vehicle-minutes of delay per peak-direction peak hour (converted to vehicle-hours by dividing by 60).


Under a conservative occupancy assumption of 1.0 person per vehicle, we then annualized to 2 peak hours per weekday and 250 weekdays per year (500 peak hours annually). Under this screening framework, the network-wide monetized delay across non-flagged roadway segments is approximately $316,000 per peak-direction peak hour, which scales to $632,000 per weekday and about $158.0 million per year (weekdays only).
The monetized delay estimates give Fort Bend a clear signal: congestion is not merely a “mobility issue”—it is a recurring economic loss that grows as the county grows. When peak-period delay scales into large annual figures, that number is a proxy for thousands of hours of productive time that never occur: employees arriving late or leaving early to avoid peak traffic, service calls that take fewer stops per day, deliveries that require larger buffers, and meetings and appointments that get canceled or missed. For households, it is time displaced from caregiving, education, health visits, and rest—costs that are real even when they do not show up on a balance sheet. For employers, congestion translates into higher labor costs (paid time spent traveling rather than producing), higher logistics costs (extra trucks, drivers, or shifts to deliver the same volume), and growing uncertainty that undermines on-time performance. The key point is that congestion is as much about reliability as speed: when a 25-minute trip unexpectedly becomes 45 minutes, firms compensate by padding schedules, and workers by leaving earlier. Those adaptations reduce the effective size of the labor market and the county’s attractiveness to time-sensitive industries.
These mobility costs matter directly for economic development and site selection. Companies evaluate not only tax rates and available land but also the realities of moving people and goods daily. Congestion exacerbates the “last-mile” challenge affecting everything from industrial parks to healthcare facilities and retail nodes. A distribution or advanced manufacturing operation must hit production schedules; a healthcare system must ensure staff and patients can reliably reach facilities; a professional services firm needs predictable access to talent and clients. When travel time variability rises, it becomes harder to sustain just-in-time supply chains, shift-based operations, and high-frequency service industries. Over time, persistent congestion can depress corridor performance: businesses face higher turnover because commutes become intolerable; developers see higher risk in locations that are difficult to access; and the county’s growth begins to outpace its ability to deliver the infrastructure conditions that investors expect. In practical terms, congestion functions like a hidden surcharge on every expansion decision—an added cost that competitors in better-connected regions may not face.
Public transportation is needed because it is one of the few tools that can increase mobility capacity without requiring a one-for-one expansion of roadway space, which is expensive, disruptive, and often constrained by right-of-way. Roads are essential, but in rapidly urbanizing areas they cannot be the only strategy. Transit—when designed around real commute patterns and anchored in employment centers, activity hubs, and park-and-ride networks—adds person-throughput: it moves more people through a corridor than general-purpose lanes can, especially during peak hours when congestion is most costly. Transit also provides a dependable alternative for workers whose jobs have fixed start times (healthcare, education, public safety,
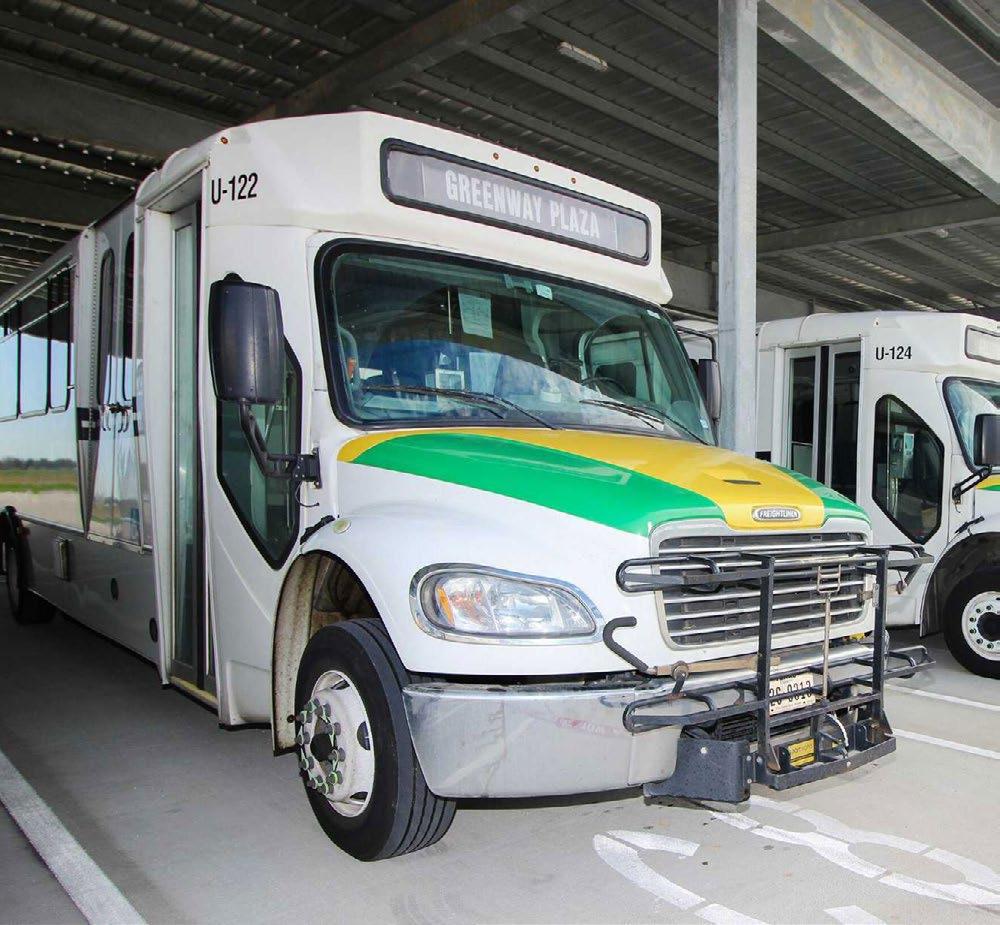
logistics), and for households that need a second mobility option when a vehicle is unavailable, unaffordable, or impractical. Importantly, for Fort Bend it can increase express commuter routes, managed-lane/HOV-supported bus service, park-and-ride expansion, and high-frequency circulators connecting major residential growth areas to job clusters. These services can be deployed in phases, scaled with demand, and paired with targeted roadway improvements to maximize performance.
From a job creation perspective, public transportation supports both the supply and demand sides of the labor market. On the supply side, it expands the geography of opportunity: more residents can reliably reach more jobs, and employers can draw from a larger talent pool without forcing every worker into a long, high-stress drive. This is especially important as Fort Bend becomes more economically diverse and as job growth spreads across multiple nodes rather than a single downtown destination. On the demand side, transit-ready corridors and hubs tend to attract more stable private investment because access becomes more predictable; that encourages office, medical, retail, and mixed-use development in locations where employees and customers can arrive without excessive delay. Transit investment also creates near-term construction and operations jobs, but its more important role is long-run productivity: it lowers the effective cost of distance, improves punctuality and attendance, and reduces turnover driven by punishing commutes. In high-growth counties, these are not marginal gains—they can determine whether firms expand locally or look elsewhere.
Quality of life is the final—and often most salient—dimension, and it is tightly linked to economic performance. Long and unreliable commutes increase stress, reduce time available for family and community, and create barriers to routine healthcare and preventive services. Congestion also has equity implications: households with fewer transportation options pay a larger share of their income and time for mobility, and they suffer more when a single breakdown (car trouble, childcare schedule change, a missed connection) cascades into job instability. Better public transportation improves quality of life by giving residents more control over their schedules and by reducing the day-to-day volatility of travel. It can also improve safety by reducing exposure to peak-hour crash risk and supporting “complete corridor” designs that are safer for walking and biking near activity centers. When residents feel that growth does not automatically mean gridlock, it changes how they experience the county’s success: development feels like opportunity rather than burden.
Taken together, the monetary implications of delay provide a defensible, quantitative rationale for investing in public transportation as part of an integrated mobility and growth strategy. The point is not that transit alone solves congestion; the point is that without a serious transit component, the county is left with an increasingly expensive and physically constrained strategy of widening roads—often chasing demand rather than shaping it. Transit, paired with targeted roadway operations (signal optimization, bottleneck fixes, managed lanes, access management) and land-use coordination around activity centers, is how Fort Bend can protect economic competitiveness, support job creation, and sustain quality of life while continuing to grow.
The commuting-time index data adds an important equity-and-competitiveness layer to the congestion-cost story. In the 2025 dataset on households spending 1–2 hours commuting to/from work per week (national index = 100), 18.9% of Fort Bend block groups are above the national benchmark (Index > 100). Those above-benchmark areas account for roughly 22,052 of the county’s estimated 115,386 households in this commute-time category— about 19.1% of the total “1–2 hours/week” commuting burden captured in the file. In practical terms, this means a meaningful share of the county is already experiencing commute time patterns that are worse than the national norm before layering on additional growth and the delay costs implied by the traffic projections. Long commutes are not just an individual inconvenience; at scale they represent a structural constraint on labor market access, schedule reliability, and household time budgets—especially for shift workers, single-car households, and families with childcare obligations.
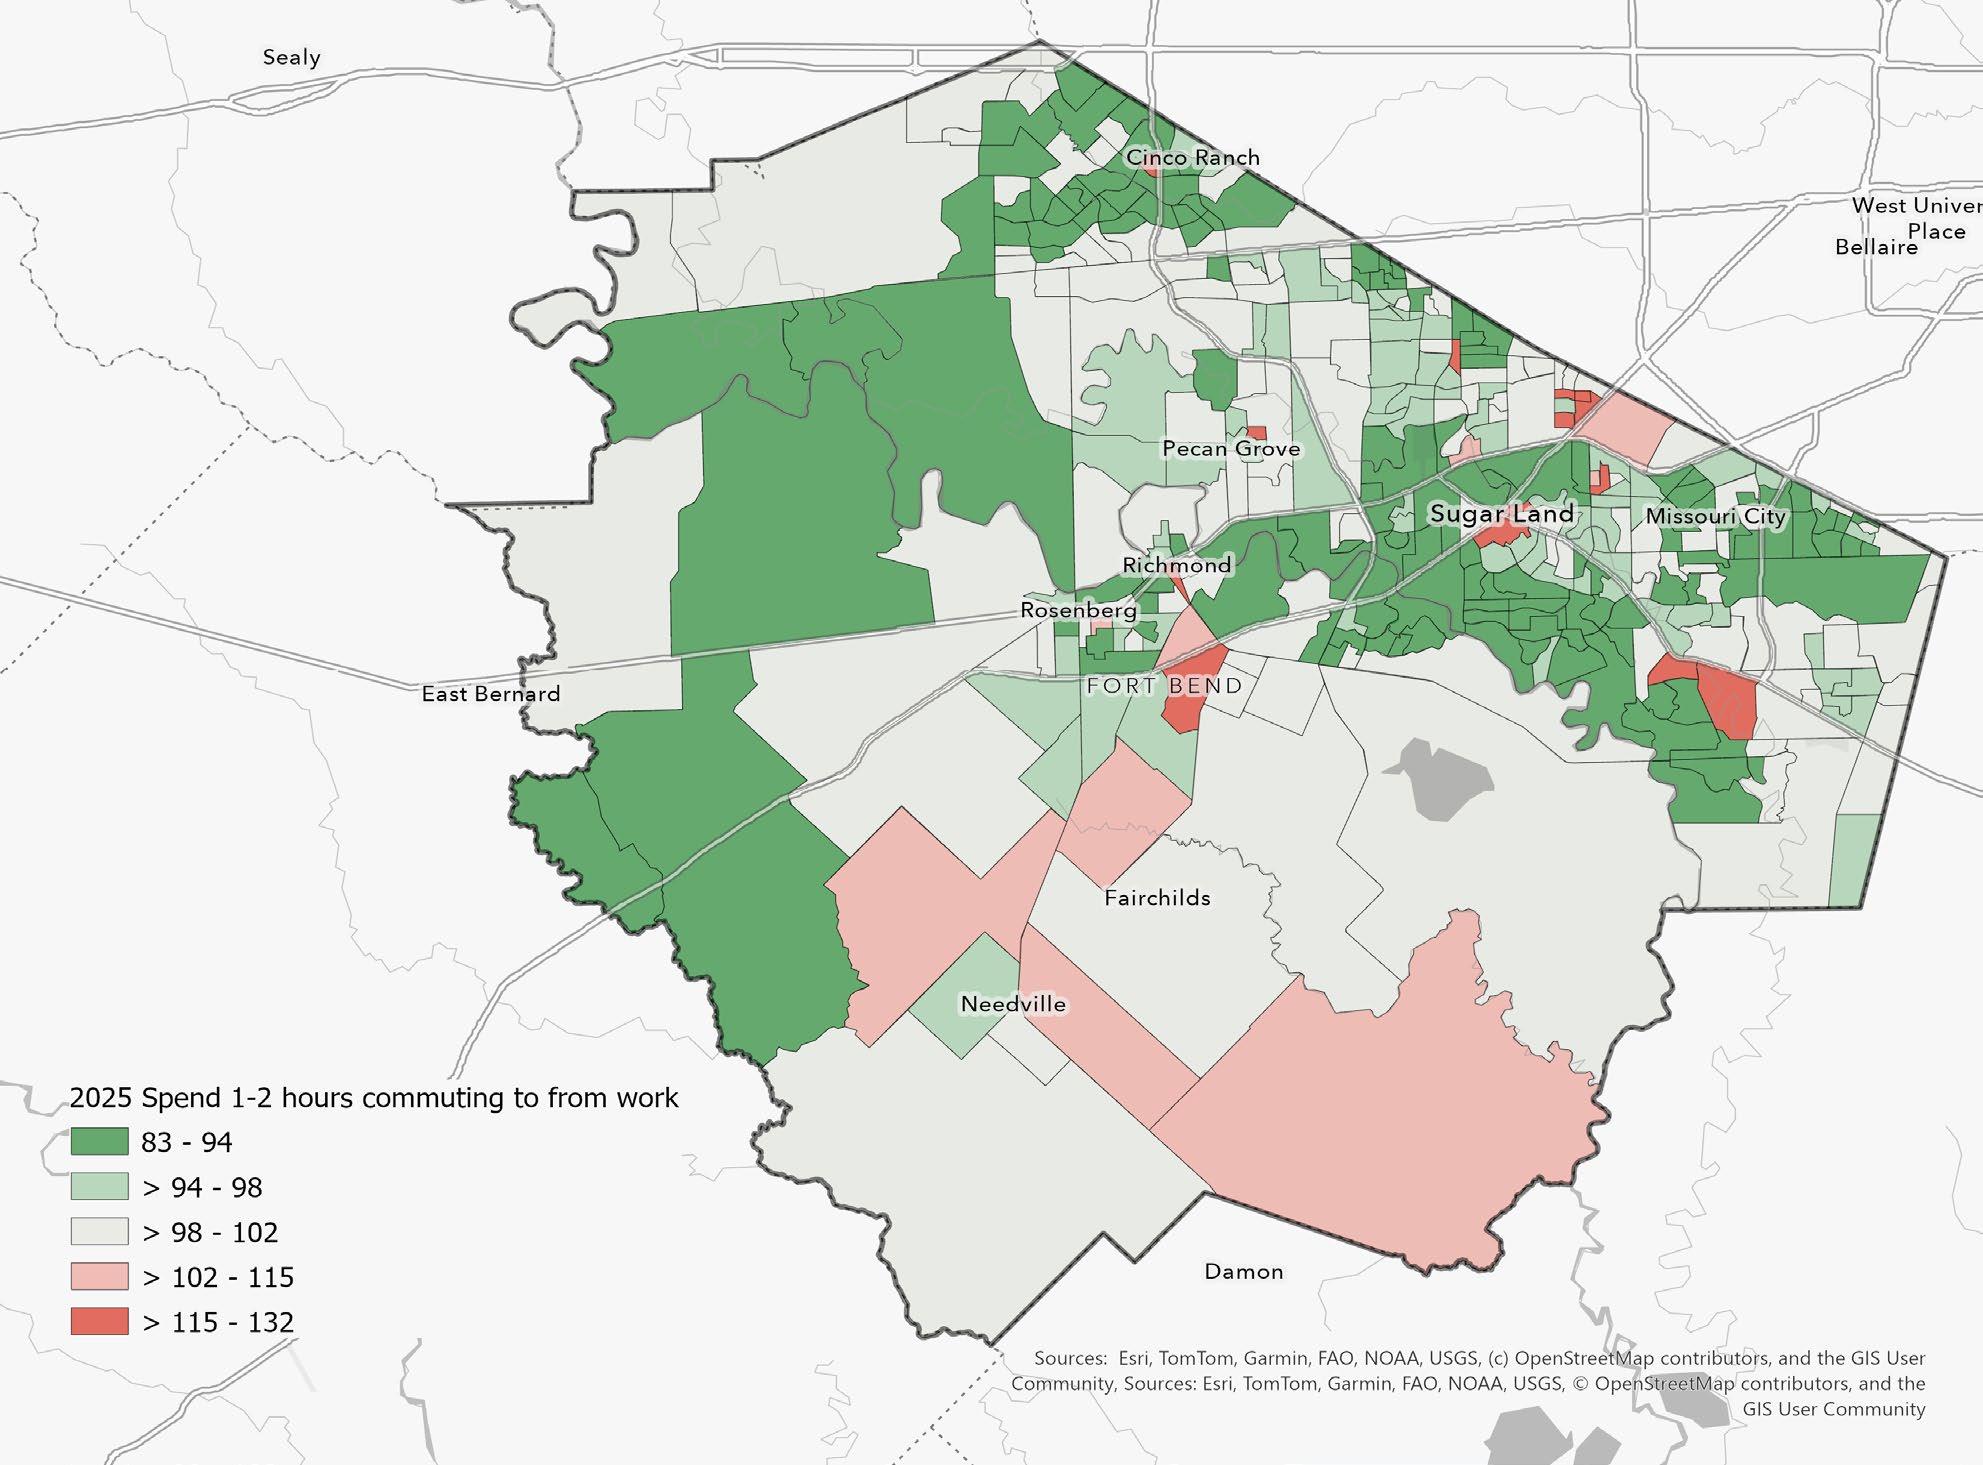
Sources: Esri, TomTom, Garmin, FAO, NOAA, USGS, © OpenStreetMap contributers, and the GIS User Community
Figure 16. Adults who spend 1–2 hours commuting to/from work per week, where 100 equals the U.S. average. Red areas (MPI > 100) indicate neighborhoods where long-commute behavior is more common than the national norm (higher expected demand/likelihood), while green areas (MPI < 100) indicate it is less common than average.
The quality-of-life implications are direct and cumulative. Commute time is one of the few “fixed” weekly demands that competes with sleep, caregiving, school engagement, preventive health, and community participation. When a substantial portion of neighborhoods exceed the national benchmark for lengthy commuting, the county effectively “spends” human time in transit rather than in family life, education, and local civic and commercial activity. From an economic development standpoint, this pattern also reduces the effective size of the workforce shed: employers face tighter recruiting radii, higher turnover risk, and more absenteeism and tardiness when travel becomes unpredictable. Firms that depend on reliable shifts (healthcare, logistics, advanced manufacturing, education, public safety) are particularly sensitive to travel-time reliability. Over time, a county with persistent long-commute hotspots and rising congestion costs can become less attractive for new investment—not because growth is undesirable, but because the daily operating environment becomes less predictable and more expensive.
TARGET TRANSIT WHERE THE “INDEX > 100” COMMUTE BURDEN IS CONCENTRATED.
Use the block-group index layer to prioritize express commuter bus / park-and-ride expansion and managed-lane bus access on the corridors feeding major job centers. This is the fastest way to convert “time lost” into “time recovered” without waiting for major roadway widening.
Partner with large employers, industrial parks, medical campuses, and school districts on:
> Staggered shifts
> Telework/hybrid incentives where feasible
> Employer shuttles from park-and-ride lots
> Guaranteed ride home programs
These interventions directly reduce peak pressure and improve reliability—two drivers of the monetized delay totals.
ALIGN LAND USE AND INFRASTRUCTURE TO REDUCE THE JOBS–HOUSING MISMATCH.
Focus redevelopment and new growth around activity centers and mixed-use nodes that shorten average trip lengths (more “trip internalization”), and require transportation concurrency where feasible so that major developments support corridor capacity and multimodal access.
Prioritize relatively quick “reliability packages” on top corridors: signal coordination, ramp/merge improvements, access management, incident clearance, and targeted intersection upgrades. Reliability gains often produce outsized benefits for employers compared with marginal speed gains.

Fort Bend’s growth trajectory makes one conclusion unavoidable: the next decade will be defined as much by the county’s ability to maintain and renew aging infrastructure as by its ability to expand capacity. Roads, drainage channels, stormwater controls, pump stations, water and wastewater systems, and neighborhood assets are not simply physical components; they are the county’s reliability platform. When that platform degrades, the consequences are predictable and costly: emergency repairs replace planned renewal, floods and service disruptions become more frequent, congestion worsens faster than expansions can address, and quality-of-life gaps widen in the neighborhoods least able to absorb them. Economic development is directly affected as well; modern employers increasingly assess not only tax and land availability, but also uptime—power resilience, drainage performance, water reliability, and transportation functionality.
Fort Bend 2050 should therefore treat aging infrastructure renewal as a core competitiveness strategy with two integrated pillars: (1) diversified, programmatic financing and (2) institutionalized asset management that makes maintenance planned, scheduled, and measurable.
Aging infrastructure funding fails when it is episodic and reactive. Best practice is to create a blended financing stack that matches the asset type to the appropriate tool and ensures that renewal is not dependent on emergencies to become visible.
PROGRAMMATIC
Fort Bend should move toward a predictable cadence for renewal funding tied to transparent reporting on asset condition. A disciplined bond strategy—supported by an annual “State of Assets” report—helps ensure the county does not accumulate deferred maintenance that becomes exponentially more expensive. For drainage and stormwater, where costs are large and risks are system-wide, Fort Bend should evaluate the feasibility of stable, dedicated funding streams where permissible and appropriate. The guiding principle is simple: if an asset class has ongoing renewal needs, it should not be funded only through occasional windfalls.
In high-growth areas, Fort Bend should also strengthen mechanisms to ensure that growth pays its proportional share of the infrastructure capacity it consumes. This can include participation agreements and structured development contributions for off-site improvements that are directly triggered by growth—particularly drainage and corridor throughput improvements—so that existing residents are not continually asked to subsidize new demand.
In select areas—particularly where infrastructure upgrades will increase accessibility and property values—district-based tools can help finance improvements. The county and municipalities can consider corridor-specific value capture where conditions support it, focusing on projects with visible, long-lived benefits (multimodal access, drainage upgrades, streetscape, and safety improvements). The emphasis should be disciplined: value capture is most effective when paired with a clear corridor plan and transparent project sequencing.
Water and wastewater renewal often aligns well with state revolving funds and state-administered financing programs, particularly where projects improve reliability, reduce losses, enhance compliance, or expand capacity in a measured way. Fort Bend 2050 should explicitly direct partners to build a pipeline of “finance-ready” projects— projects with completed scope definition, cost estimates, and engineering readiness—so that the county and its partners can move quickly when funding windows open.
Drainage renewal and flood mitigation are often eligible for federal resilience programs, particularly when projects reduce repetitive-loss risk or improve system performance during major storm events. Fort Bend should treat federal programs as leverage: local dollars establish commitment and match capacity, while federal funds accelerate scale and speed. The critical implementation insight is that federal funding rewards readiness. That means building a standing pipeline of scoped projects, pre-positioned benefit-cost documentation where required, and consistent coordination with partner jurisdictions.
While core infrastructure renewal will rely primarily on public capital, performance contracting can free up general funds by reducing operating costs in public facilities (energy efficiency, controls, equipment modernization). Fort Bend should treat this as complementary: reduce operating burdens where feasible and redirect savings toward high-need asset classes like drainage and roadway renewal.
Funding is necessary but not sufficient. Many jurisdictions spend significant resources and still fall behind because they lack a coherent asset management system. Fort Bend 2050 should recommend a countywide shift toward state-of-good-repair governance, where maintenance is scheduled, documented, and performance-tracked.
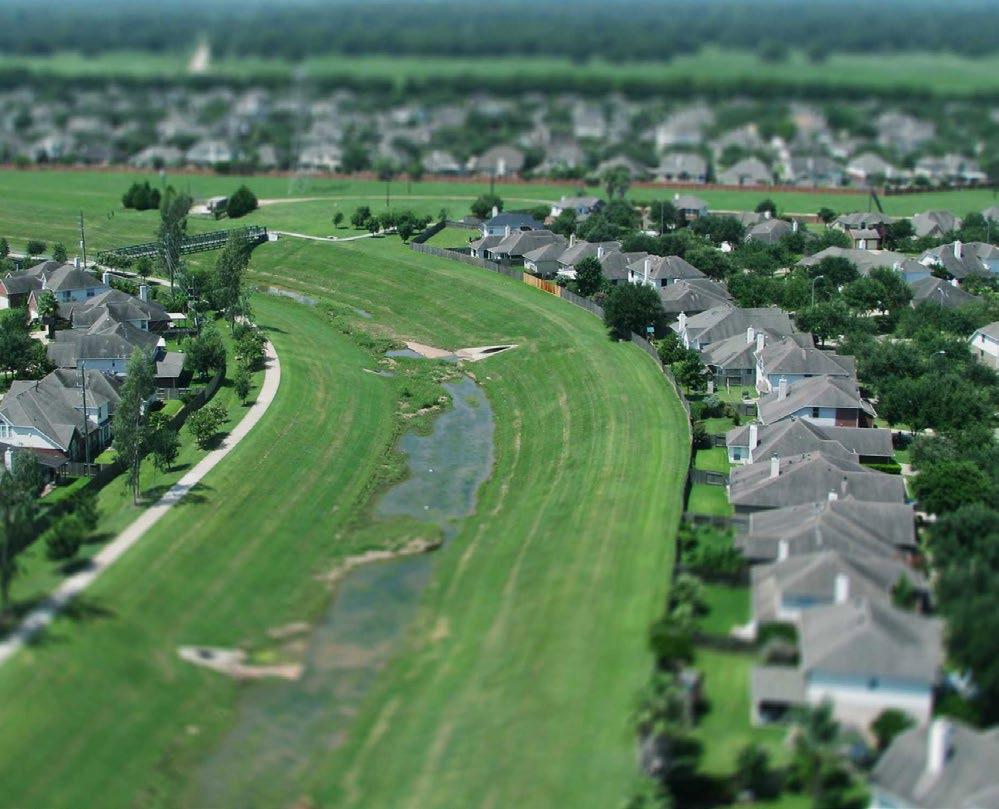
The first step is a complete, standardized inventory of assets: location, type, age, expected useful life, condition rating, criticality (service consequence of failure), and replacement value. This registry becomes the county’s “balance sheet” for infrastructure. It also enables transparency: the county can show residents what exists, what is deteriorating, and why renewal investments are being prioritized.
A Computerized Maintenance Management System (CMMS) turns maintenance from a series of disconnected work orders into a planned program. Inspections, preventive maintenance schedules, and repairs become trackable, auditable, and improvable over time. High-criticality assets—pump stations, major stormwater controls, lift stations, high-volume intersections—should shift toward risk-based maintenance rather than purely time-based schedules.
One of the most effective governance practices is making maintenance visible. The county should publish an annual maintenance and renewal calendar that identifies, by quarter and by corridor/watershed, planned actions such as: roadway resurfacing and preservation (seal coats, overlays); channel vegetation management and sediment removal schedules; sidewalk/ADA gap closures in targeted areas; lighting and safety upgrades where warranted. This calendar improves accountability, reduces resident frustration by setting expectations, and helps coordinate across departments and jurisdictions to bundle projects and reduce repeated disruptions.
Fort Bend should track a small, stable set of indicators that can be reported publicly and used internally to allocate resources. Recommended measures include:
> pavement condition index (PCI) or comparable roadway condition measures
> % lane-miles in good/fair/poor condition
> drainage backlog indicators (e.g., miles of channel requiring rehabilitation, sediment/ vegetation backlog)
> repeat-failure locations and mean time to repair for critical assets
> water loss / non-revenue water (where applicable through partnership reporting)
> an annual renewal ratio (renewal spending relative to estimated renewal need or depreciation)
These measures make it possible to demonstrate progress, identify where performance is slipping, and justify prioritization decisions.
A strong best practice is to adopt a policy target for annual renewal investment as a share of replacement value for each asset class (roads, drainage, facilities, utilities, where applicable). The specific target should be evidence-based and updated annually as the asset registry improves. The key is to make renewal of normal budget expectation, not a discretionary afterthought.
Fort Bend should explicitly pursue bundling—coordinating resurfacing with drainage upgrades, sidewalk/ADA improvements, lighting, and utility work. Bundling reduces mobilization costs, reduces repeat construction impacts on residents, and improves overall corridor outcomes. It also creates visible quality-of-life improvements and strengthens public confidence that infrastructure investments are coherent rather than piecemeal.
Fort Bend 2050 is fundamentally a collaborative plan. Its success will not be determined by whether the county can articulate the right priorities, but by whether Fort Bend can deliver those priorities across a governance landscape that is, by design, fragmented. Fort Bend County, multiple municipalities, and dozens of MUDs each control key levers of growth: land use authority, subdivision and development review, roadway and right-of-way decisions, water and wastewater capacity, drainage standards, and the timing of capital investments. In practice, this means that the county can pursue a strong strategy and still fail to achieve the outcomes residents expect if projects are sequenced inconsistently, if permitting standards differ materially across boundaries, or if infrastructure investments do not align with where growth is being approved. A coherent future, therefore, requires a coherent delivery system—one that respects local authority but creates interoperability in the places that matter most: corridors, watersheds, and growth nodes.


The case for county–city–MUD collaboration is not abstract or aspirational; it is operational. The county’s largest risks over the next decade—congestion, drainage and flood exposure, water supply constraints, uneven infrastructure service, and affordability pressures—are cross-jurisdictional by nature. Traffic does not stop at a city limit. Watersheds do not respect municipal boundaries. Water and wastewater systems are physically interdependent and frequently traverse multiple jurisdictions. Economic development decisions made by one jurisdiction can create transportation and service demands borne by another. Without structured collaboration, Fort Bend faces several predictable problems that erode quality of life and fiscal stability.
First, sequencing failure: growth is approved faster than the infrastructure necessary to support it, forcing retrofits that are more expensive, more disruptive, and more inequitable. Second, cost shifting: the benefits of development accrue to one tax base while the infrastructure burdens fall on another jurisdiction or on residents in the form of congestion, flooding, and service degradation. Third, stranded or duplicated investment: infrastructure is built in isolated increments that do not connect into an efficient system—leading to patchwork mobility, drainage improvements that move water downstream rather than managing it, and utility expansions that do not align with long-run capacity plans. Fourth, administrative fragmentation: investors,
residents, and partner agencies encounter a confusing set of separate processes, inconsistent expectations, and limited visibility into decision-making, thereby slowing delivery and undermining trust.
By contrast, collaboration produces direct and measurable benefits to all parties. For cities, predictable coordination reduces development conflicts, strengthens corridor outcomes, and improves credibility with residents by showing that growth comes with a plan and a timeline for infrastructure. For the county, alignment prevents perpetual catch-up and allows capital dollars to be concentrated where they will meaningfully improve system performance. For MUDs, coordination reduces uncertainty, speeds delivery, improves system reliability, and creates clearer expectations around long-run maintenance and integration with broader plans. For residents and employers, collaboration translates into shorter commutes, fewer repetitive construction disruptions, better flood resilience, clearer service standards, more transparent permitting, and a more competitive environment for job creation. Collaboration is therefore best understood as both a risk-management strategy and a value-creation strategy: it reduces fiscal and operational risk while accelerating the county’s ability to deliver visible outcomes.
Fort Bend does not need identical rules everywhere to achieve coherence. It needs interoperability: a set of shared standards, operating practices, and information systems that allow multiple jurisdictions to function as one system across the core constraints of growth. Interoperability requires common definitions and evidence standards, shared visibility into projects and conditions, synchronized capital planning, and a structured escalation path for resolving conflicts early. But it also requires something more practical: a shared expectation that government should be understandable, navigable, and service-oriented for those who rely on it.
That means the county’s implementation model should not only focus on what gets built, but on how county business gets done. Permitting, plan review, development coordination, data sharing, and intergovernmental communication should be treated as core infrastructure of growth management. In a fast-growing county, process is policy. When processes are slow, opaque, or inconsistent, the costs are real: delayed investment, duplicated staff work, avoidable frustration, and diminished public confidence. When processes are modernized, transparent, and well-coordinated, the county gains not only speed but legitimacy.
Fort Bend 2050 should include a formal Implementation Compact that establishes shared expectations across the county, cities, and MUDs for how growth will be coordinated. This is not a new layer of bureaucracy for its own sake; it is an agreement that turns the plan into a delivery mechanism, where community participation and public-private shared governance are the norm.
The compact should be anchored in a standing council within the Fort Bend Regional Partnership, with routine participation from county engineering, transportation, drainage, permitting, economic development, and other relevant departments; municipal planning and engineering leads; major MUD operators; and liaison participation from TxDOT and regional transit partners as appropriate. The purpose of this council would be to maintain a shared pipeline of priority corridors and projects, keep the plan aligned with on-the-ground development activity, and resolve sequencing issues before they become crises. The compact should produce a short, public-facing quarterly Delivery Memo that outlines what moved, what is stuck, what decisions are needed, and what the next 90 days will focus on.
In addition to quarterly coordination, Fort Bend should identify a limited set of Tier 1 corridors and growth nodes—areas where congestion, development intensity, drainage risk, and infrastructure demand are converging—and establish corridor delivery teams. Each team should have a named lead agency and a jointly approved scope: roadway operations and safety; drainage and detention or retention strategy; water and wastewater capacity; sidewalks and ADA access; lighting; utility coordination; and permitting alignment. The key is to manage these corridors as systems, not as isolated projects.
A shared Growth Readiness Standard should further support implementation by setting minimum documentation thresholds for watershed-level drainage and downstream impacts; water supply alignment and wastewater capacity; transportation impacts tied to corridor performance; emergency access and evacuation connectivity; and power availability and resilience considerations for major employment sites. This would not eliminate local control. It would instead raise the baseline, reduce uncertainty, and create more consistent expectations for developments large enough to alter corridor performance or infrastructure demand.
Once per year, the county and partner jurisdictions should also hold a structured Alignment Summit to overlay capital plans onto a single map showing growth hotspots, congestion corridors, flood risk, utility constraints, and underserved infrastructure gaps. The output should be a jointly published sequenced plan that identifies where bundling will occur and where timing needs to be adjusted. This is one of the simplest, highest-return coordination mechanisms because it prevents repetitive construction, accelerates outcomes, and makes public spending more legible to residents.
Fort Bend 2050 should explicitly recognize that long-range implementation requires modernization of the county’s day-to-day operating model. Growth management is not only about the quality of the plan; it is also about the quality of the administrative systems that translate policy into action. In a county as rapidly growing and as complex as Fort Bend, outdated processes can become a major constraint on competitiveness, service delivery, and public trust. The county should therefore treat operational modernization as a strategic priority rather than an internal housekeeping matter.
One of the most immediate opportunities lies in the use of technology to improve permitting and development review. Fort Bend should move toward a more integrated digital environment in which applicants can submit materials electronically, track status in real time, receive coordinated comments, and clearly understand next steps. Technology should be deployed not simply to digitize old paper processes, but to reduce delays, eliminate unnecessary duplication, and make the system easier to navigate. For those seeking permits, approvals, or development-related decisions, transparency should be a core principle. Applicants should be able to see where a permit stands, which department is reviewing it, what deficiencies remain, and what reasonable timelines they can expect. A process that is visible is more manageable; a process that is understandable is more trusted.
This modernization should also be framed explicitly as a customer service improvement. Residents, property owners, and employers do not experience county government through organization charts; they experience it through response times, clarity, consistency, and accessibility. As Fort Bend grows, more people will interact with county systems at moments that matter financially and practically—opening businesses, building homes, expanding facilities, navigating inspections, or resolving infrastructure issues. The county should therefore adopt a stronger service orientation in which clear communication, timely feedback, standardized guidance, and visible points of contact are treated as essential features of implementation. Better customer service is not cosmetic. It reduces confusion, lowers transaction costs, improves compliance, and strengthens confidence in the county’s ability to manage growth responsibly.
Operational modernization must also include a recommendation to revise internal processes for how county business is conducted. In many jurisdictions, delays are not caused by the absence of policy direction, but by fragmented workflows, unclear handoffs, sequential review structures, redundant sign-offs, and limited visibility across departments. Fort Bend 2050 should call for periodic internal process mapping and review so that the county can identify bottlenecks, clarify responsibilities, streamline approvals, and align departmental workflows around measurable service standards. This is particularly important in fast-growth contexts where engineering, health and human services, parks, drainage, mobility, permitting, legal review, communications, budgeting, and economic development increasingly depend on one another. A county cannot operate at the speed of growth if its internal processes are still organized around institutional silos.
Shared technology platforms can further strengthen this effort. Common project tracking systems, interoperable GIS layers, digital as-builts, and integrated review workflows can help departments and partner jurisdictions work from the same information at the same time. This strengthens coordination internally and externally. It reduces avoidable conflict, improves sequencing, and creates better institutional memory over time. Fort Bend should therefore view digital modernization not as an optional upgrade, but as part of the implementation infrastructure necessary to deliver a more coordinated and transparent growth strategy.
The county should also advance a shared data backbone through a countywide infrastructure and growth dashboard that includes development pipeline indicators, project delivery status, corridor performance measures, drainage asset condition and backlog, permit timelines, review volumes, and key utility capacity indicators where available. New MUDs and major expansions should be expected to provide standardized digital as-builts and asset inventories to support maintenance planning and emergency response. Public-facing dashboards can also improve transparency by making implementation activity visible to residents and stakeholders, while internal dashboards can support performance management, workload balancing, and earlier identification of operational bottlenecks.
Finally, modernization should extend beyond internal workflow to Fort Bend’s relationship with outside governments. The county’s interactions with state and federal agencies should increasingly be coordinated through one clear county voice. Whether the issue is transportation funding, flood mitigation, water infrastructure, permitting coordination, regulatory advocacy, or legislative priorities, fragmented signals weaken the county’s position. Fort Bend 2050 should therefore recommend a coordinated intergovernmental strategy in which county leadership, partner jurisdictions, and relevant agencies work toward a more unified regional message. Speaking with one voice does not erase local differences; it improves coordination, strengthens grant competitiveness, and makes Fort Bend a more effective partner with state and federal government.
No shared operating system can succeed without the institutional capacity to sustain it. Fort Bend 2050 should therefore be explicit that implementation depends not only on projects and plans, but on people. The county will need to attract, retain, and develop highly skilled staff across health and human services, parks, public safety, engineering, planning, permitting, GIS, finance, project management, communications, and intergovernmental relations. In a competitive labor market, this will require real investment. If Fort Bend wants the best and brightest, it must be prepared to compete for them. High-capacity government does not emerge at no cost; it must be built deliberately.
This means acknowledging plainly that human capital will cost the county money. Recruiting stronger technical talent, improving compensation competitiveness, expanding professional development, and building leadership pipelines will all require sustained resources. At the same time, the county should not think only in terms of outside recruitment. Professionalizing current employees is equally important. Existing staff hold valuable institutional knowledge, but they also need access to training, modern tools, updated process expectations, and clear pathways for advancement if the county wants to improve service quality over time. Fort Bend 2050 should therefore frame workforce investment as both a recruitment strategy and a professionalization strategy.
The case for this investment is practical, not symbolic. Understaffed or under-supported institutions tend to produce slower reviews, uneven decisions, weaker customer experience, avoidable turnover, and reduced capacity to pursue grants, coordinate major projects, and manage growth proactively. Those weaknesses eventually appear in resident experience and in market confidence. By contrast, a county that is able to recruit top talent and continuously develop its existing workforce gains more than administrative efficiency. It gains stronger judgment, faster implementation, better continuity, and a greater ability to adapt as conditions change.
Fort Bend should therefore consider a workforce strategy tied directly to implementation. This could include salary benchmarking for hard-to-fill technical positions, targeted recruitment for specialized roles, professional development and certification support, leadership training, cross-departmental rotations, and process-improvement training for frontline and supervisory staff. The county should also assess whether some of its most important growth-management functions require new classifications, new units, or updated organizational structures that better reflect the complexity of contemporary county governance. As growth pressures intensify, staffing models designed for a slower and less interconnected era will become increasingly inadequate.
Institutional capacity also matters for coordination beyond county government. If Fort Bend is to operate more effectively with cities, MUDs, regional agencies, and outside governmental partners, it will need staff who can convene, negotiate, communicate, and manage across jurisdictions. Collaboration is not self-executing. It depends on professional capacity, administrative discipline, and leadership attention. In that sense, investment in human capital is not separate from implementation. It is one of the foundations that makes implementation possible.
Fort Bend 2050 should define implementation not only as a matter of capital planning, but as the construction of a shared operating system for growth. That operating system must include coordinated governance, interoperable standards, modernized permitting, transparent customer-facing processes, shared data, stronger internal workflows, and sustained investment in the people who make government work. It must also include a disciplined approach to intergovernmental relations, so that Fort Bend presents a coherent voice to the state and federal governments on the issues that will shape its future.
The larger point is straightforward: growth will not wait for government to become more coordinated, more transparent, or more professionalized. The county must do that work now. Fort Bend’s ability to preserve quality of life, maintain public confidence, and compete successfully for residents, employers, and infrastructure resources will depend not only on what it plans, but on how well it organizes itself to deliver. In that sense, building a shared operating system is not an administrative side project. It is one of the central development strategies of Fort Bend 2050.
Fort Bend County’s next chapter will not be defined by whether growth continues. Growth is already here, and by every major indicator in this report it will remain one of the county’s defining realities through 2050 and beyond. The more consequential question is whether Fort Bend can convert rapid expansion into a durable quality-of-life advantage. That is the central message of this report. The county’s challenge is not growth itself, but mismatch: mismatch between where population and housing are accelerating and where infrastructure and services are ready; mismatch between a historically bedroom-community development pattern and the need for a stronger local employment base; mismatch between the speed of private development and the pace of public coordination; and mismatch between countywide prosperity and the uneven geographies of congestion, affordability pressure, health burden, and vulnerability. Fort Bend 2050 should therefore be understood as a strategy to close those gaps and to ensure that growth is translated into reliability, resilience, and everyday livability.
The findings point clearly to a county operating in two speeds. One set of corridors, nodes, and growth edges is absorbing rapid increases in households, traffic, utility demand, and development pressure. Another, larger set of mature neighborhoods is entering a different phase, one in which reinvestment, maintenance, service quality, and stabilization matter as much as expansion. That distinction matters because a county cannot govern all places with the same tools. Growth areas require sequencing, concurrency, and forward-looking capital programming. Mature areas require a stronger state-of-good-repair strategy, targeted neighborhood improvements, and policies that protect quality of life as infrastructure ages and market conditions shift. A successful Fort Bend 2050 agenda must therefore move beyond countywide averages and adopt a hotspot-informed operating model that matches investment and policy to local conditions.

Just as important, the report shows that quality of life and competitiveness are not separate policy domains. They are increasingly the same conversation. Mobility, water reliability, drainage performance, housing attainability, health access, public safety, and customer-facing government all shape whether Fort Bend remains an attractive place to live, work, invest, and raise a family. Congestion now imposes real economic losses. Water and power readiness increasingly determine where growth can credibly occur. Housing price escalation, if left unmanaged, threatens the jobs-housing balance that underpins a productive local economy. Poor mental and physical health, language barriers, transportation limitations, and aging-related needs are not peripheral concerns; they directly affect labor force stability, school engagement, household resilience, and long-run public costs. In practical terms, a county that improves quality of life is also strengthening its economic development platform. Reliability is the connective tissue between the two.
For that reason, Fort Bend 2050 should treat mobility as a system objective rather than a project list. It should treat water and flood resilience as growth gates rather than downstream technical issues. It should treat power readiness as a core site-selection and business-retention asset. It should treat housing diversity and affordability as workforce policy. And it should treat health, accessibility, and inclusive service delivery as forms of productivity infrastructure. The report also makes clear that agriculture should remain part of this broader county strategy. Preserving a viable agricultural footprint is not an argument against growth; it is a resilience, land stewardship, and economic diversification strategy that helps Fort Bend maintain part of the productive landscape that has long shaped its identity.
The implementation implications are equally clear. The county will not achieve these outcomes through isolated projects or siloed departments. It will require a shared operating system across the county, municipalities, MUDs, and regional partners. That means common growth-readiness expectations, better coordination of corridor and watershed decisions, more transparent and technology-enabled permitting, stronger customer service, improved asset management, and a clearer countywide voice in dealing with state and federal partners. It also means investing in institutional capacity. Fort Bend’s future will depend not only on roads, channels, substations, and treatment plants, but on whether the county can attract, retain, and professionalize the people who make complex government function well. High-capacity growth management is not free, but the cost of under-capacity government is far greater: slower delivery, fragmented decisions, weaker public confidence, and missed opportunity.
The broader takeaway from this report is both cautionary and optimistic. The caution is that past success does not guarantee future performance. Fast-growing counties can gradually lose their advantage when congestion becomes normalized, when affordability slips, when systems age faster than they are renewed, and when public institutions struggle to keep pace with development. The optimism is that Fort Bend enters this period from a position of real strength. It has a large and growing population, high levels of human capital, strong incomes, substantial consumer capacity, a diverse and dynamic community, and a geography that still offers room to shape outcomes rather than merely react to them. Those strengths create an opening to move from growth as an output to performance as a governing principle.
Ultimately, Fort Bend 2050 should be judged by a simple standard: whether growth continues to feel like opportunity rather than burden. That is the real test of long-range planning in a county of this scale and dynamism. If Fort Bend aligns growth with infrastructure capacity, protects housing attainability, strengthens corridor performance, modernizes water and power planning, sustains reinvestment in aging systems, includes agriculture in the county’s development future, and builds a more coordinated and service-oriented operating model, it can convert demographic momentum into durable advantage. The goal is not merely to accommodate more people. It is to build a county where rising population, rising economic activity, and rising expectations are matched by rising quality of life. That is the promise of Fort Bend 2050, and it is the work now in front of the county.

Dr. Jeronimo Cortina is the Senator Don Henderson Professor in the Department of Political Science and Executive Director of the Population Health Collaborative at the University of Houston. He specializes in political geography, quantitative methods, population health, and American and Texas politics. He holds a Ph.D. in Political Science and a Master of Public Administration from Columbia University in the City of New York.
Dr. Cortina brings extensive experience in public policy, project implementation, evaluation, and capacity building across Texas, North Africa, Eastern Europe, and Latin America. A widely published scholar and sought-after commentator, his expertise has been featured in major media outlets, and he co-hosts Party Politics on Houston Public Media. He is the author of Proximity Politics: How Distance Shapes Public Opinion and Political Behavior (Columbia University Press).
"This report is the planning instrument through which Fort Bend 2050 becomes more than a growth projection; it is a quality-of-life agenda, a competitiveness agenda, and an implementation roadmap that gives county leaders the evidence base to make consequential decisions with confidence, accountability, and a clear line of sight toward the county's long-run resilience. Quality of life is not a secondary outcome to be addressed after economic development and infrastructure are handled; it is the measure through which economic performance, household stability, and government effectiveness are experienced in everyday life."
Jeronimo Cortina

The UH Population Health Collaborative is an educational and research hub, leveraging innovative research and analytics to craft accessible training and educational resources that drive positive community outcomes. The Collaborative's value proposition is firmly anchored in a steadfast commitment to policy relevance, deeply rooted in the broader policy and social context, and rigorously validated. We place a premium on expeditiously addressing policy questions by employing a data-driven analytical approach, enriched by valuable community insights, while remaining highly adaptable and open to change and innovation, solidifying our position as a trusted and transparent partner in the pursuit of improved quality of life.
The Fort Bend Regional Partnership is the leading business-led organization advancing economic growth and long-term prosperity in Fort Bend County. As the largest single-county chamber in the greater Houston region and the largest business organization in Fort Bend County, the Partnership represents more than 1,000 business organizations, 5,000 individuals, and over 250,000 jobs.
As a 5-Star Accredited Chamber, the Partnership serves as a unified voice for business—bringing together leaders from across industries, government, and the community to address the region’s most critical opportunities and challenges. For more than 50 years, the organization has been a strong and effective advocate for business, driven by the continued investment and engagement of its partners.
Through strategic advocacy, data-driven initiatives, and cross-sector collaboration, the Fort Bend Regional Partnership works to protect and advance the business interests of the region while strengthening the foundation for future growth. The Partnership creates, enhances, and promotes the dynamic environment in which we work and live—ensuring Fort Bend County remains a premier place to do business and build a high quality of life for generations to come.
www.FortBendRegionalPartnership.com info@fbrp.org 281-491-0800
445 Commerce Green Blvd. | Sugar Land, TX 77478

President & CEO

Director of Programs

Director of Business Development
Senior Executive Director of Economic Development

Director of Public Policy

Assistant Director of Programs
The Fort Bend Regional Business Council is dedicated to public policy and advocacy that foster sustainable growth and a thriving business climate. It serves as a hub for partners to collaborate on local public policy










Burning Red Construction & Development




















initiatives, programs, and ballot measures that promote a pro-growth, pro-business agenda while preserving quality of life and place. This group plays a key role in shaping and influencing Fort Bend County’s development, government, and education priorities—aligning closely with the vision of Fort Bend 2050 by advancing the long-term strategies, partnerships, and policy frameworks necessary to support the county’s continued growth and competitiveness.




































A Strategic Blueprint for the Region’s Future