




The newest asphalt and pavement products.
It’s good news all-around as almost every industry sector grew.
The data is more nuanced than ever before, and the story of where the industry is going feels full of an anxious energy.
Subcribe to the twice monthly Blacktop Update newsletter, and stay on top of all the latest howto articles, new products, industry events, the upcoming Pavement Awards 2026, videos like the No Edge Lines series, and SO MUCH MORE! Scan the QR code below and sign-up TODAY!

While the service remained popular among contractors this year, there were other positive signs that this category’s erosion may have tapered off.
The strongest category for sub-contracting tells us that while volume fell, profits were consistent with previous years’ data.
The pavement repair sector recorded the most dramatic per-contractor reversal of any category in this year’s report.
HCSS integrates with Geotab to bring realtime vehicle data into fleet management systems, reducing manual entry and improving maintenance and job costing accuracy.
Read the article at: https://pavemg.com/xtw6mz1r
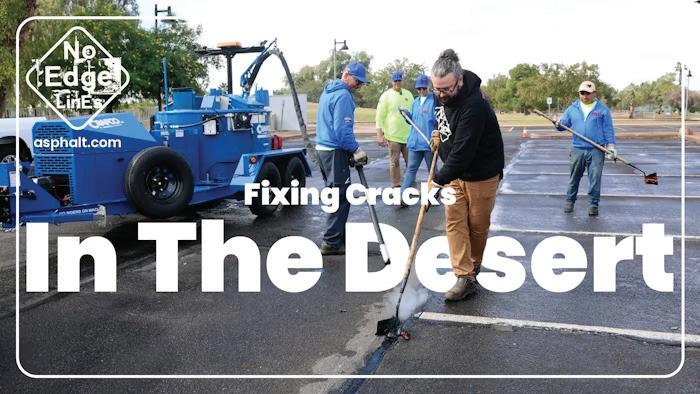
Rainstorm | No Edge Lines Season 3 Episode 4
Desert conditions and extreme temperatures push pavements to their limits, and learning how to repair them is even harder when you’re fighting bad weather.
Watch the video at: https://pavemg.com/NELS3E4
Women make up just 11% of the construction workforce as bias, limited advancement paths and workplace culture continue to impact retention and growth.
Watch the video at: https://pavemg.com/3l71go6e

ADVISORY BOARD
Agua Trucks Inc .................................................................... Wickenburg, AZ, Scott Duscher
Asphalt Contractors Inc., Union Grove, WI
Robert Kordus


Published and copyrighted 2026 by IRONMARKETS. All rights reserved. No part of this publication may be reproduced or transmitted in any form or by any means, electronic or mechanical, including photocopy, recording or any information storage or retrieval system, without written permission from the publisher.

Individual subscriptions are available without charge in the U.S. only to pavement maintenance contractors, producers and government employees involved in paving or pavement maintenance; dealers, and distributors of pavement maintenance equipment or materials; and others with similar business activities. Complete the subscription form at www.forconstructionpros.com or use your company letterhead giving all the information requested. Publisher reserves the right to reject nonqualified subscribers. One year subscriptions for nonqualified individuals: $35.00 U.S.A., $60.00 Canada and Mexico, and $85.00 all other countries (payable in U.S. funds, drawn on U.S. bank). Single copies available (prepaid only) $10.00 each (U.S., Canada & Mexico), $15.00 each (International). Pavement Maintenance & Reconstruction (ISSN 1098-5875), is published eight times per year: January, February, March, April/May, June/July, August/September, October/ November, December by IRONMARKETS, 201 N. Main St. Ste 350, Fort Atkinson, WI 53538. Periodicals postage paid at Fort Atkinson, WI and additional entry offices.



POSTMASTER: Please send change of address to , 201 N. Main St. Ste. 350, Fort Atkinson, WI 53538. Printed in the USA.
PAVEMENT MAINTENANCE & RECONSTRUCTION is proudly supported by these associations:




Asphalt Restoration Technology Systems, Orlando, FL
Brahney Paving, Hillsborough, NJ
Eosso Brothers Paving; Hazlet, NJ
Connie Lorenz
Steven Brahney
Tom Eosso
Maul Paving/Concrete/Sealcoating, PLainfield, IL Chris Maul
Parking Lot Maintenance, Lake St. Louis, MO Todd Bruening
Petra Paving, Hampstead, NH Chris Tammany
Pioneer Paving, Albuquerque, NM Don Rooney
Roberts Traffic, Hollywood, FL Lisa Birchfield
Show Striping Inc. (SSI), Wisconsin Dells, WI Amber Showalter
T&N Asphalt Services, Salt Lake City, UT Nick Howell
Young Sealcoating Inc, Lynchburg, VA
Steve Young
The Paving Lady Mauro Comuzzi
JMP Excelsior Services
Jim Panzenhagen
Sweeping Industry Veteran Gabe Vitale
Flat Nickel Management
Wis-Coat Asphalt Maintenance
Clear Choice Sealing
Michael Nawa
Marvin Joles
Warren Johnson
Jacketta Sweeping Services Debbie Jacketta
Royal Pavement Solutions Kenneth Roy III
ASSOCIATION REPRESENTATIVES:
Pavement Coatings Technology Council ....................... Brian Riggs, Executive Director



















It’s time to be as blunt as possible.
Typically, I am not the sort of person who feels the need to appease other people. In fact, you might say that I have a contrarian nature, at times. I am resistant when others tell me what to do, if I feel that they lack the sort of authority earned from experience and first-hand knowledge. Sometimes I’ve even been known to outright go in the opposite direction with things, just because I don’t like the way I was told. Am I painting the right sort of picture here?

Brandon Noel, Editor-In-Chief bNoel@iron.markets
234-600-8983
I’m not him. I’m not the guy who’s going to just say something because anyone told me to do it. Additionally, I’m not going to write an article in here about anything unless, at the very least, I’ve done my homework or vetted an idea to my best ability. Now, with that being said, Let me put this out there.
I’ve been concerned about the health and stability of the industry since Q3 of 2025. In December of last year, I wrote that a lot of things needed to go right in Q1 of 2026 for us to avoid the things that I was growing apprehensive about. Costs. Inflation. Materials. Trade policy. Service demand. Unfortunately, none of the factors I told people to watch for have gone the right way. Thankfully, however, I’ve yet to hear word from contractors in the field really sounding any alarms. There could be a few reasons for this, so here is my current working theory.
Recently, I was on location with a contractor who shared the details with me about a large bid they’d been party to. It was for a national commercial customer they’d worked for in the past, and so, their bid process was not unfamiliar. After being awarded the contract, he’d managed to find out what some of the other bids were, and, to his surprise, a few were lower. A lot lower though, as in, not even close to realistic.
“My first thought, when I saw them, was that it looked like a bid from three-or-four years ago,” he said. “Some people seem to be hesitant to raise their prices, but, it’s just not reality.”
If this is happening in other parts of the country, where contractors are holding on to outdated pricing structures in order to avoid customer sticker-shock, then that could partially explain some things...but not everything, because everyone I talk to still seems pretty busy.
Another possibility is that commercial clients are trying to push through as much of their annual maintenance as possible, as early as possible, to avoid what they all know is coming. At the time of this writing, the Iran war is entering its eleventh week, and there does not appear to be a clear off-ramp for the hostilities. We are two-weeks away from a full blown physical oil shortage being triggered. Last week, the final oil tanker that was en route before the war started, pulled into dock. There are no others coming, as of right now.
I’ve written about it before, but it bears repeating. Contractors should be building pricing protections into all their contracts going forward for the rest of the season. Things are too unpredictable and too volatile to do anything else. The commercial clients will feel it too, as transportation costs start impacting their businesses.
Worst case scenario: By mid Summer everyone might batten-down the hatches, and be trying to wait out the oil-shock/shortage. Best case scenario: We deal with a few months of elevated asphalt prices per ton.
See you on the road! ■


EDITORIAL
Editor-In-Chief Brandon Noel bnoel@iron.markets
Content Director, Marketing Services Jessica Lombardo jlombardo@iron.markets
Managing Editor Allyson Sherrier asherrier@iron.markets
AUDIENCE
Audience Development Director Angela Franks
PRODUCTION
Senior Production Manager Cindy Rusch crusch@iron.markets
Art Director ............................................................... April Van Etten
ADVERTISING/SALES
Brand Director Amy Schwandt aschwandt@iron.markets
Brand Manager Megan Perleberg mperleberg@iron.markets
Sales Representative Sean Dunphy sdunphy@iron.markets
Sales Representative Kris Flitcroft kflitcroft@iron.markets
IRONMARKETS
Chief Executive Officer Ron Spink
Chief Revenue Officer Amy Schwandt VP, Finance Greta Teter VP, Operations & IT Nick Raether
Brand Director, Construction, OEM & IRONPROS Sean Dunphy
Brand Director, Supply Chain Brian Hines Director, Marketing Services ..................................... Becky Peck
Content Director Marina Mayer Director, Event Content & Programming Jess Lombardo Director, Lead Generation Operations Bailey Acton
CIRCULATION & SUBSCRIPTIONS
201 N. Main St. Ste. 350, Fort Atkinson, WI 53538 afranks@iron.markets
LIST RENTAL
Sr. Account Manager Bart Piccirillo | Data Axle (518) 339 4511 | bart.piccirillo@infogroup.com
REPRINT SERVICES
Brand Manager Megan Perleberg mperleberg@iron.markets | (800) 538-5544
Published and copyrighted 2026 by IRONMARKETS. All rights reserved. No part of this publication may be reproduced or transmitted in any form or by any means, electronic or mechanical, including photocopy, recording, or any information storage or retrieval system, without written permission from the publisher.
@PAVEMENTMAGAZINE

@PAVEMENTMAGAZINE
@PAVEMENTMAGAZINE
@PAVEMENTMAINTENANCE





WWW.FORCONSTRUCTIONPROS.COM/PAVEMENT Published by IRONMARKETS 201 N. Main St. Ste 350, Fort Atkinson, WI 53538 (800) 538-5544 • IRON.MARKETS.COM
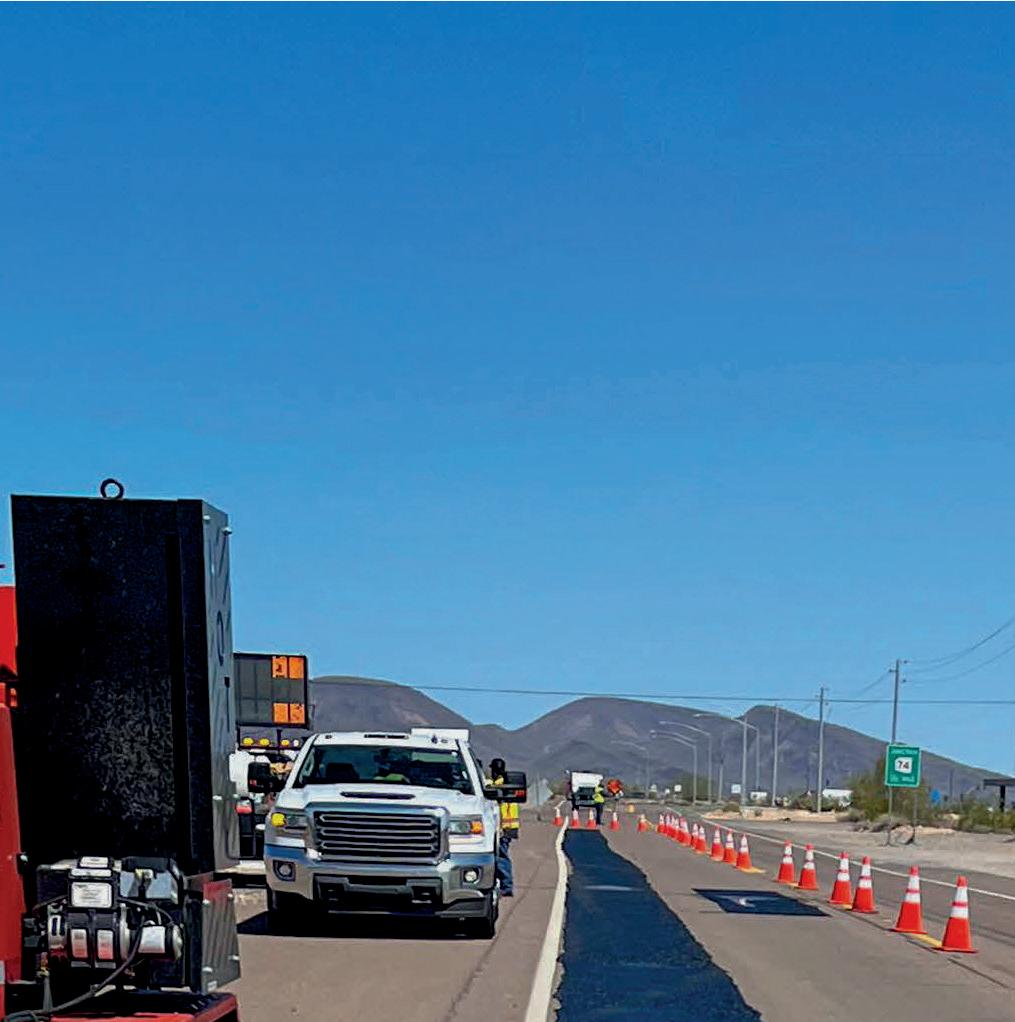
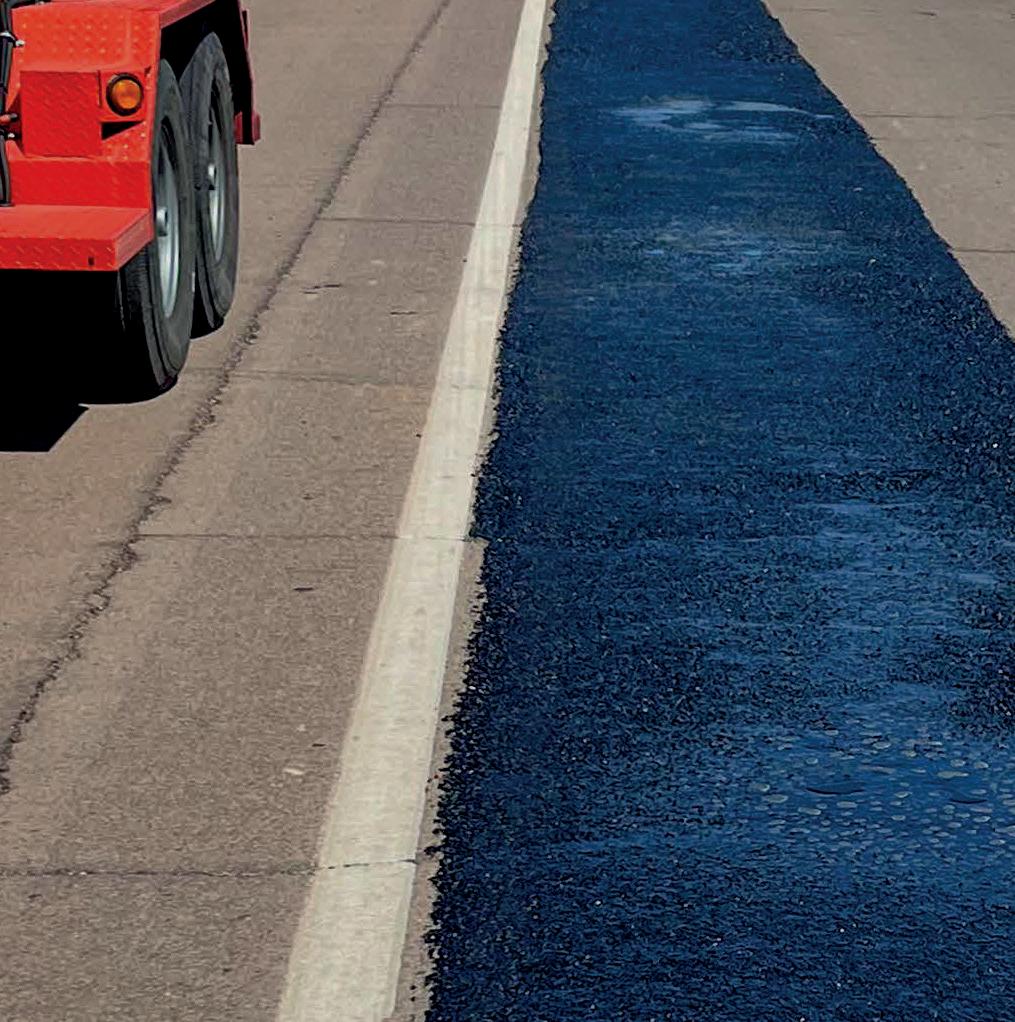
When large pavement repairs can’t slow traffic down, Mastic One® delivers. Its fast application and quick return to service minimize disruption, while its durable, flexible performance ensures repairs last.





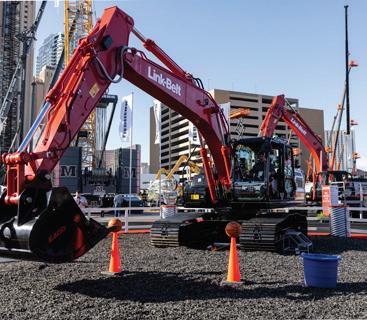
Link-Belt Excavators
Link-Belt Excavators unveiled the 245 X4S and 80 X4 models, which are designed to improve fuel efficiency, operator comfort and machine connectivity. The booth also featured a technology area focused on connectivity, artificial intelligence and operator training. Two excavator simulators allowed attendees to experience machine operation and jobsite technologies in a hands-on environment.
Bobcat Co.

Bobcat’s lineup is now divided into Classic and Pro models. Classic loaders include compact track loaders such as the T450, T595, T650 and T770, as well as skid-steer loaders including the S70, S450, S590, S650 and S770. These machines focus on traditional controls and features suited for general construction, landscaping and rental applications.
The company also introduced an expanded Precision Grade 3D platform that supports grade control systems from Trimble and Topcon. The system is designed to allow contractors to install machine guidance technology more easily. In addition to equipment and technology displays, the exhibit included interactive demonstrations such as the Excavator Showdown, where operators competed to complete precision challenges using a 220 X4S excavator.
Manufacturing,
Thunder Creek Equipment’s two pickupmounted skid systems aimed at improving fueling and preventative maintenance workflows on construction jobsites: the Diesel Pickup Skid (DPS) and Lube Pickup Skid (LPS).
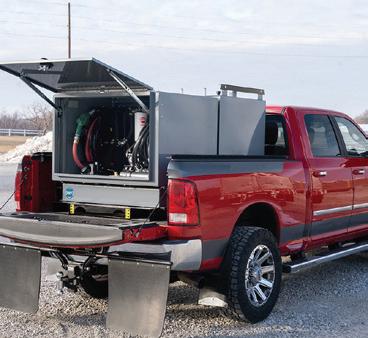
The systems are designed to address ongoing challenges for contractors and fleet managers, including labor shortages, compliance requirements and equipment downtime. Fueling, diesel exhaust fluid (DEF) handling and routine maintenance often pull crews away from production. Equipment that does not require special licensing can expand who is able to perform these tasks in the field.
Both skids offer a total capacity of 230 gallons and are built for flexible deployment, with fork pockets and mounting options for pickup beds, flatbeds, trailers or stationary use.
Crafco, Inc.
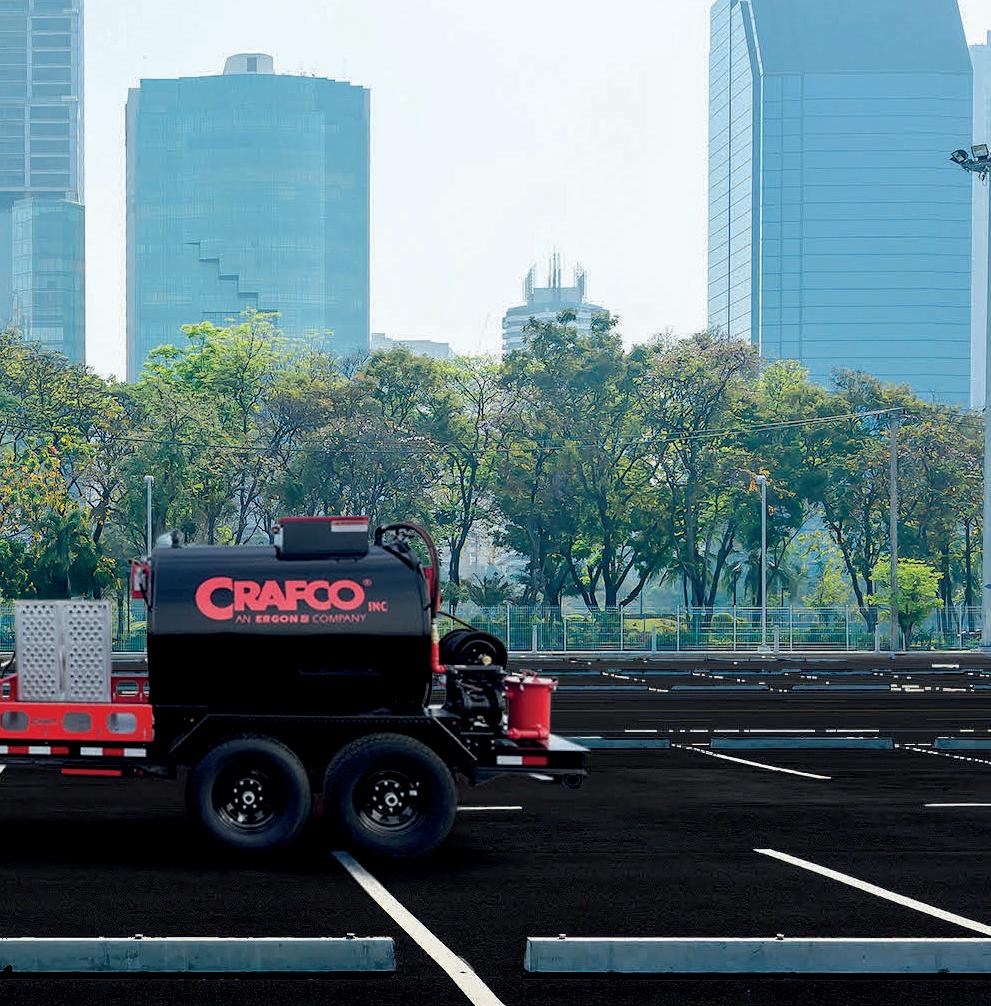
Crafco has introduced a new Tack Tank designed for asphalt and paving operations, with models available in 300- and 600-gallon capacities.

The units feature a hydraulically driven pump capable of output up to 35 gallons per minute, allowing crews to handle a range of job sizes and operate even when material remains in the lines. The system also enables reversing the pump to reclaim unused material.
The Tack Tank is equipped with a 250,000-BTU burner and a triple-pass flue design to improve heating efficiency and reduce warm-up time.
The release reflects ongoing equipment updates aimed at improving productivity and material handling on paving jobsites.
The Pro category includes compact track loaders such as the T64-2, T66-2, T76-2 and T86-2, along with skid-steer loaders including the S64-2, S66-2, S76-2 and S86-2. These machines incorporate additional technology, including four selectable drive modes designed to adjust machine responsiveness for different tasks.
The Pro models also feature updated electrical systems, redesigned operator cabs with heated air ride seats and an 8-inch touchscreen display with integrated camera functions.
According to the company, the updates are intended to simplify machine operation and support operators with varying levels of experience.
Wacker Neuson America Corporation
Wacker Neuson designs and builds both machines at its Menomonee Falls, Wisconsin, factory. The 3- to 4-ton excavators share a platform and feature a redesigned operator station with a 7-inch touch-screen display, keyless start and updated cab layout. Both models also include smooth hydraulics and a standard dozer blade with float function. They also introduced the WL750 as part of a new wheel loader lineup that includes the WL950 and WL1150. The company said the loaders pair a compact design with hydraulic quick-change systems and attachment compatibility for construction, landscaping and municipal work.
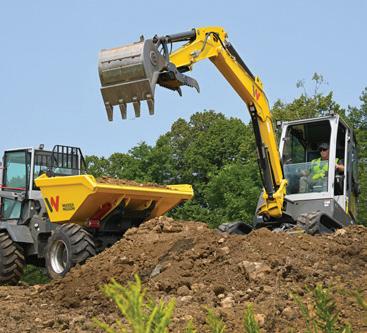
The new TH625 telehandler expands Wacker Neuson’s telehandler lineup with a model designed for lifting, material handling and ground-engaging tasks.
Red Wing Shoe Co.
Red Wing has introduced IronFlex, a new line of work boots designed for construction and trade professionals.

The medium-duty boots were developed using fit data from more than 3 million workers, aiming to improve comfort and mobility for long hours on the job. The design includes a roomier toe box, added heel stability and a flexible construction intended to move with the wearer.
Key features include a cushioned midsole, slip-resistant outsole with ladder grip and a waterproof leather upper. Select models also offer a micro-adjustable fit system. The IronFlex line includes multiple men’s and women’s styles, all meeting ASTM standards for jobsite safety. The boots are now available through Red Wing retail locations.
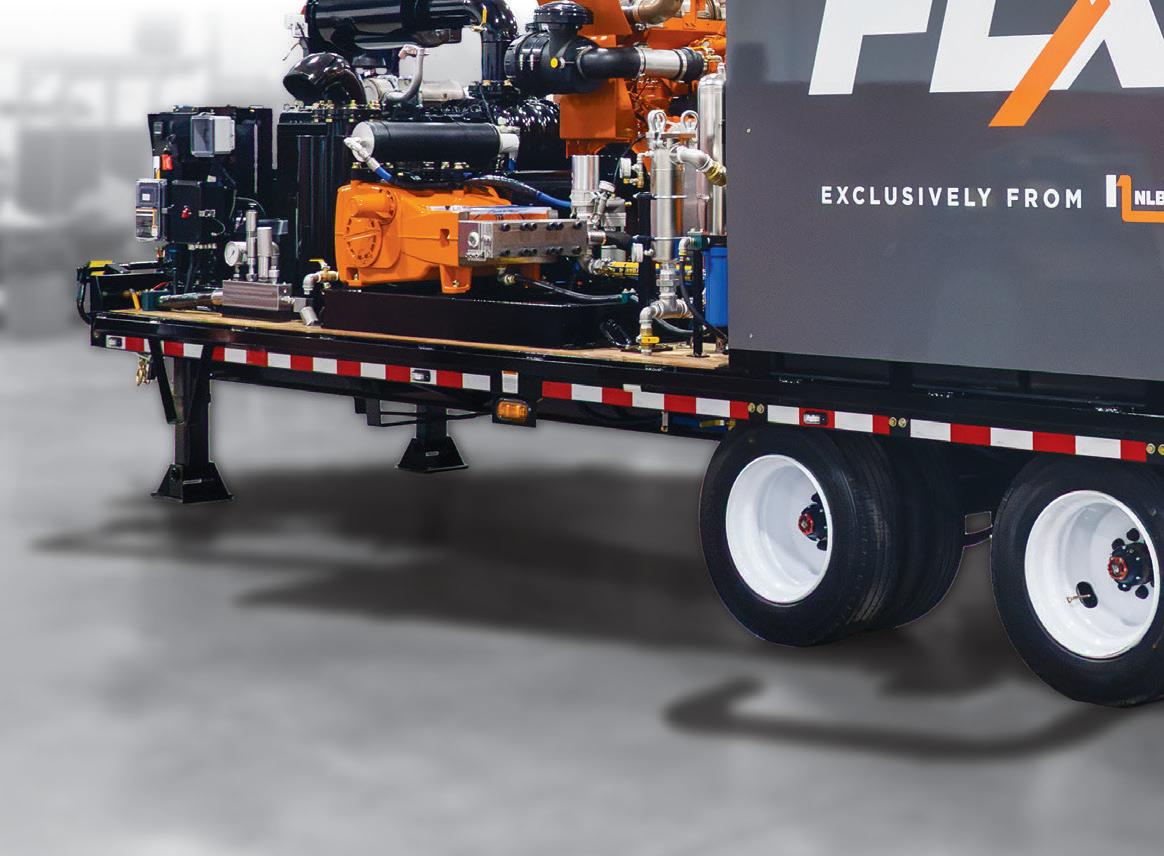
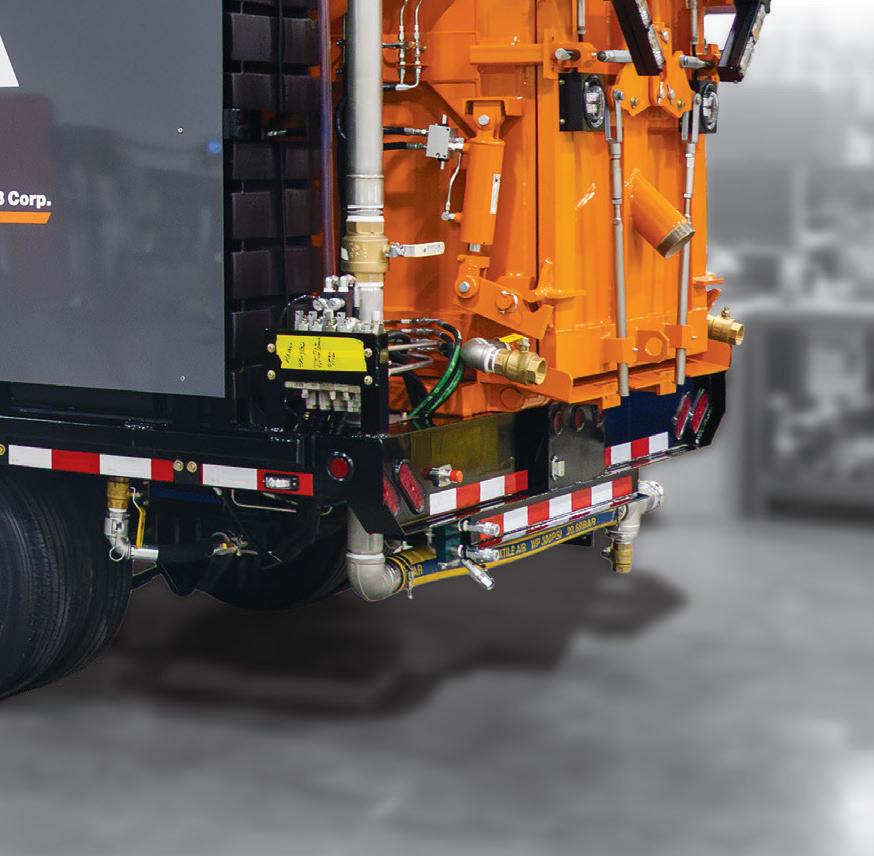
Meet the FLX System—a compact, trailer-mounted, high-pressure water jetting unit that’s ready to tackle line removal and a variety of surface prep projects. It’s built to be simple, cost-effective, and flexible, making it a game-changer for contractors who need an all-in-one solution.
• Complete & Compact
The pump, water tanks, debris tank, vacuum recovery, and an accessory all come on a easy-to-tow trailer.
• Customizeable for Any Job
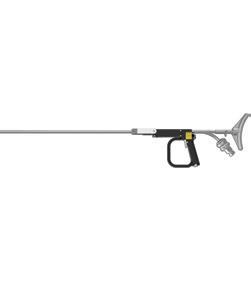
Swap out the SpinJet®*, for a Curb Cleaner, eSync Hand Lance, or a Self-Guided SpinJet for various coating & line removal applications.
• Smart, Budget-Friendly Choice
Need an economical solution? The FLX System gives you pro-level performance without the price tag of a full-sized pavement marking removal truck.
• Save Time & Money with Automation
Pair it with the Self-Guided SpinJet for automated line removal, keeping operators safe and reducing labor costs.
Get the job done faster, easier, and smarter with the FLX System—the complete, flexible solution for your projects.














By Brandon Noel, Editor-in-Chief
Last year, I told a contractor about the big growth we had, and his response was: “We’ll probably see a correction to that next season.” He was right.
The TC 2026 data, drawn from CY 2025 financial data, shows the pavement maintenance industry pulling back from the historic surge that defined previous cycles. The average Top 40 contractor generated $32.9 million in gross sales in 2025, down from the $38.0 million percontractor average reported in TC 2025. That works out to a 13.4% year-overyear contraction at the contractor level, and it ends the two-year recovery arc the industry was riding after the inflation shock of 2022 finally cooled.




For the first time since I took over as editor, we’ve had to revise our Top Contractor list from 50 down to 40. This isn’t the first time this sort of change has happened. The lists were originally the Top 75. The change reflects a smaller respondent pool this year than in previous cycles. While analyzing the data, after the 40th rank, gross sales dropped below an avaerage financial threshold that we felt necessitated a reduction. Holding the line at 40 preserved the prestige of the list and kept the data set credible for year-over-year comparison.
The Top 40’s average revenue mix held its general shape from the previous year, but there are some interesting changes to discuss in the category analysis.
The most striking single-number was in subcontractor revenue. The Top 40 reported an average of 16.1% of gross

sales generated as a subcontractor, down from 25% in TC 2025. That is a ninepoint decline in a single year and ends a multi-year upward trend that pushed the figure from 17% in ‘22 to 25% in ‘25.
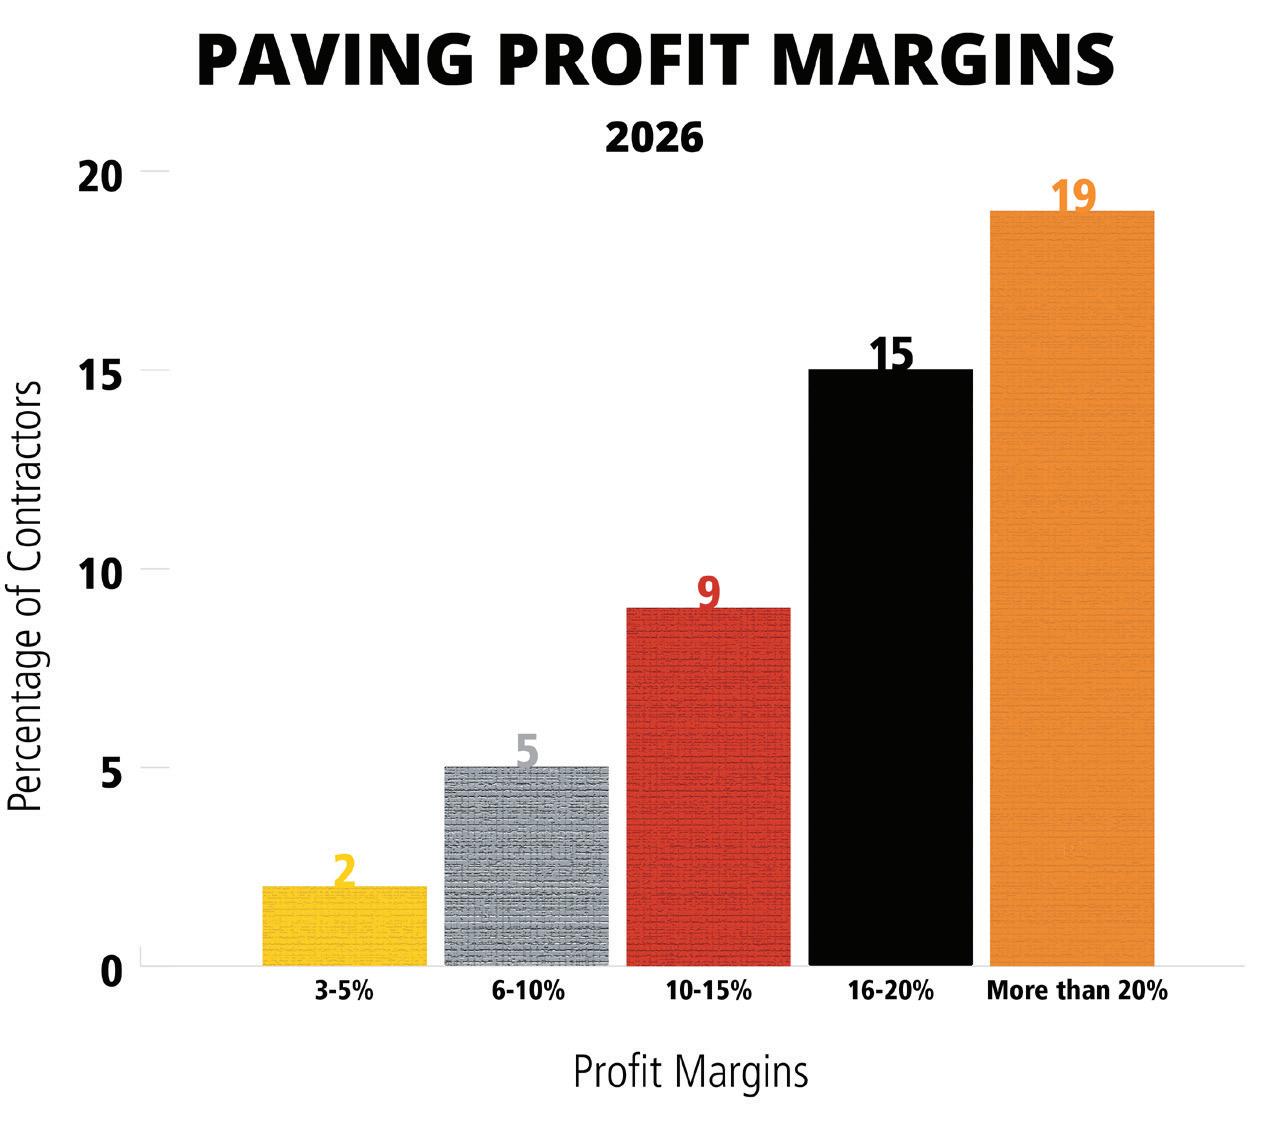
The contraction has a counternarrative buried in the margin data, and it deserves attention. Of the Top 40, 14 contractors reported profit margins above 20%, and 13 more reported margins between 16% and 20%. That puts more than two-thirds of the list, at margins of 16% or higher. Only two contractors reported margins below 5%. ■

























250 YEARS AGO, AMERICANʼS BUILT SOMETHING THAT LASTS. SO DID WE.













4-TON CAPACITY: HAUL MORE MATERIAL, TAKE ON BIGGER JOBS, AND MAKE MORE PER RUN
48-HOUR HEAT RETENTION: KEEP YOUR ASPHALT HOT AND WORKABLE


RECLAIM ASPHALT: USE EVERYTHING YOUʼVE BOUGHT






FULL-DUMP HYDRAULIC SCISSOR HOIST: UNLOAD MATERIAL FASTER TO GET TO YOUR NEXT JOB SOONER
DUAL SHOVELING PORTS: CUT LABOR TIME IN HALF WITH TO PERSON UNLOADING CAPABILITIES
LOW MAINTENANCE COSTS: AVERAGE $500 A YEAR




BEST SERVICE TEAM INDUSTRY WIDE: TECHS READY TO PROVIDE SERVICE AND MAINTENANCE AT YOUR CONVENIENCE





















$250OFFAKM8000TEDD













By Brandon Noel, Editor-in-Chief

The data is more nuanced than ever before.
Last year’s analysis ended with a projection I wasn’t happy making. After three consecutive years of declining paving-only sales across the Top 50, the compound annual decline rate of ~12.5% suggested the segment could fall to roughly $611 million in 2026 and $534 million in 2027.
Well, the data point and, thankfully, it appears to be leveling off with a few caveats. The stabilization appears on a per-contractor basis, for paving-only sales, which rebounded.
The TC 2026 Top 40 Paving Contractors generated $638.5 million in paving-only revenue, which works out to an average of $15.96 million per contractor. That figure sits 14.3% above the TC 2025 per-contractor average of $13.97 million. The aggregate number is smaller than last year’s $698 million only because the Top 40 is ten contractors shorter than the Top 50. Per contractor, the segment grew.
The projected $611 million for 2026, scaled to a Top 50 framework, would have implied roughly $12.22 million per contractor. The actual per-contractor figure outperformed that projection by 31%.
However, the total gross sales picture for the Top 40 still tells a contraction story, and the broader recovery the industry posted in TC 2025 has clearly run its course. But the specific forecast made in last year’s analysis did not hold, and that should be recognized, even if we aren’t out of the woods, yet.
The Top 40 Paving reported $1.278 billion in total gross sales, with an average per-contractor gross of $31.95 million. That average came in 16.2% below the TC 2025 Top 50 average of $38.13 million. Total gross softened, but paving-only revenue held up better than the overall business.
That divergence also showed in the revenue mix. Paving rose to 49.4% of the average Top 40 contractor’s gross, up from 48.5% in TC 2025. The Top 40 contractors leaned harder into paving as their other revenue streams somewhat thinned. Pavement repair fell to 15.3% from 21.3%, sealcoating rose to 15.6% from 11.0%, striping dropped to 5.7% from 7.6%, surface treatments held at 1.2%, and other work, including milling, earthworks, and concrete, climbed
to 12.8% from 11.1%.
Compared to the other Top 40 categories in this year’s report, pavingonly sales remained by far the highestearning segment, followed by pavement repair at $184.8 million ($557.2 million in TC 2025), sealcoating at $144.0 million ($165.8 million in TC 2025), and striping at $85.4 million ($134.1 million in TC 2025).
The aggregate drops in pavement repair and striping are dramatic on the surface, but those comparisons sit on the same Top 40 versus Top 50 footing I mentioned in the Overview.
In last year’s analysis I introduced a working hypothesis that customer paving needs follow a cycle that mirrors the typical lifespan of asphalt pavement, in
conjunction with general new construction and community development. To test it, the TC 2025 survey added a question separating new construction from existing pavement maintenance. Of the Top 50 Paving Contractors that year, 80% of completed work happened on existing pavements, and 20% was wholly new surface.
The TC 2026 Top 40 reported 80.0% existing pavement maintenance and 20.0% new construction. The ratio did not move.
Two consecutive years at the same percentage split isn’t absolutely conclusive, but it is worth mentioning and continuing to track. The Paving Top 40 is a maintenance-driven segment with a roughly stable one-fifth share of newconstruction work riding on top. More than any single year’s revenue swings, this is probably the cleanest framework for understanding paving demand going forward. If the ratio shifts meaningfully in TC 2027, that itself will be interesting.
The TC 2025 article tracked a consolidation of contractors into the highest profit margin band. That pattern moderated this year, with a small redistribution back into the upper-middle range. Among the Top 40 Paving Contractors:
• 35% (14) reported margins above 20%, down from 40% (20 of 50) in TC 2025
• 27.5% (11) reported margins in the 16% to 20% range, up from 14% (7 of 50)
• 20% (8) reported 11% to 15% margins, up from 18% (9 of 50)
• 12.5% (5) reported 6% to 10% margins, down from 26% (13 of 50)
• 5% (2) reported 5% or less, up from 2% (1 of 50)
The top tier of margins lost a couple of points, but the 16% to 20% band nearly doubled. Combined, those two upper tiers account for 62.5% of the Top 40, compared to 54% of last year’s Top 50. Pricing held in paving, even as the volume side of the business contracted.
Every contractor in the Top 40 Paving did some parking lot work, with parking lots averaging 61.0% of the typical contractor’s work composition, down marginally from 60.6% the year before. Driveway work averaged 13.4%, up from 11.6% in TC 2025, with 24 of 40 contractors doing some driveway work at an average composition of 22.4% among those who did. Residential roads and city streets averaged 16.9%, down from 18.3%, with 30 contractors reporting some residential road work. Highway work averaged 3.5%, with only 10 of the 40 doing any highway work at all, a notable drop from the 14 of 50 a year ago. The other-locations category, which captures sports surfaces, cart paths, and sidewalks, averaged 5.2% with 20 contractors doing some.
The residential lean we identified in the overview shows up here: more driveways, fewer highways, parking lots still on top.
Every Top 40 Paving Contractor did some commercial or industrial work, averaging 52.3% of the typical contractor’s mix, down slightly from 53.7% in TC 2025. Municipal work averaged 14.4%, down from 15.5%, with 31 of 40 contractors reporting some municipal work at an average composition of 18.6% among those who did.
Multi-family residential work averaged 16.4%, down from 19.3%. Singlefamily residential, the most striking move in the customer-mix data, averaged 13.1%, up from 8.6% in TC 2025, with 24 of the 40 contractors doing some single-family work at an average composition of 21.9% among those who did. The other-customer category averaged 3.7%, up from 2.9%.
Combined with the driveway data, the single-family jump confirms the residential pivot. Top 40 paving contractors leaned into smaller-scale residential work in 2025 in a way they had not done the year before.
All but one of the Top 40
self-performed at least 50% of their work, consistent with the 48 of 50 that did so in TC 2025. The bigger movement was in subcontracted revenue. The Top 40 generated an average of 16.7% of gross from acting as a subcontractor for other contractors, down from 22.8% in TC 2025. That is a six-point drop in a single year and reverses what had been a multi-year upward trend.
• 35% (14) worked for more than 400 customers, and 55% (22) completed more than 400 projects
• 2.5% (1) worked for 301 to 400 customers, and 5% (2) completed 301 to 400 jobs
• 17.5% (7) worked for 201 to 300 customers, and 7.5% (3) completed 201 to 300 jobs
• 15% (6) worked for 151 to 200 customers, and 15% (6) completed 151 to 200 jobs
• 10% (4) worked for 101 to 150 customers, and 10% (4) completed 101 to 150 jobs
• 20% (8) worked for fewer than 100 customers, and 7.5% (3) completed fewer than 100 jobs
The Top 40 ran more concentrated customer relationships and higher project counts than last year’s Top 50, with 55% completing more than 400 jobs compared to 46% a year ago. Fewer customers, more repeat work, more volume per relationship.
70% (28) of the Top 40 reported fleet replacement values above $2 million, down from 68% (34 of 50) in TC 2025. Another 10% (4) fell into the $1 million to $2 million range, with 17.5% (7) reporting between $500,000 and $1 million, and one contractor at less than $250,000. The capital concentration of the Top 40 paving segment held steady, and the rising equipment costs and tariff pressures noted in last year’s article will show up most clearly in next year’s data, when full-year impacts have worked through fleet decisions. ■

Since its introduction, the Weiler P385 has set the standard for commercial pavers. The P385C raises that standard.
Variable speed and reversible conveyors and augers and a 25% increase in tunnel height provide optimal material output.



Increase to 120 hp with the Cat® C3.6 Tier 4F/Stage V engine.

Modular conveyor drive and sealed chain case increase feeder system reliability and life.


Enhanced heat system performance with direct-drive hydraulic generator and elimination of GFCI breakers.


































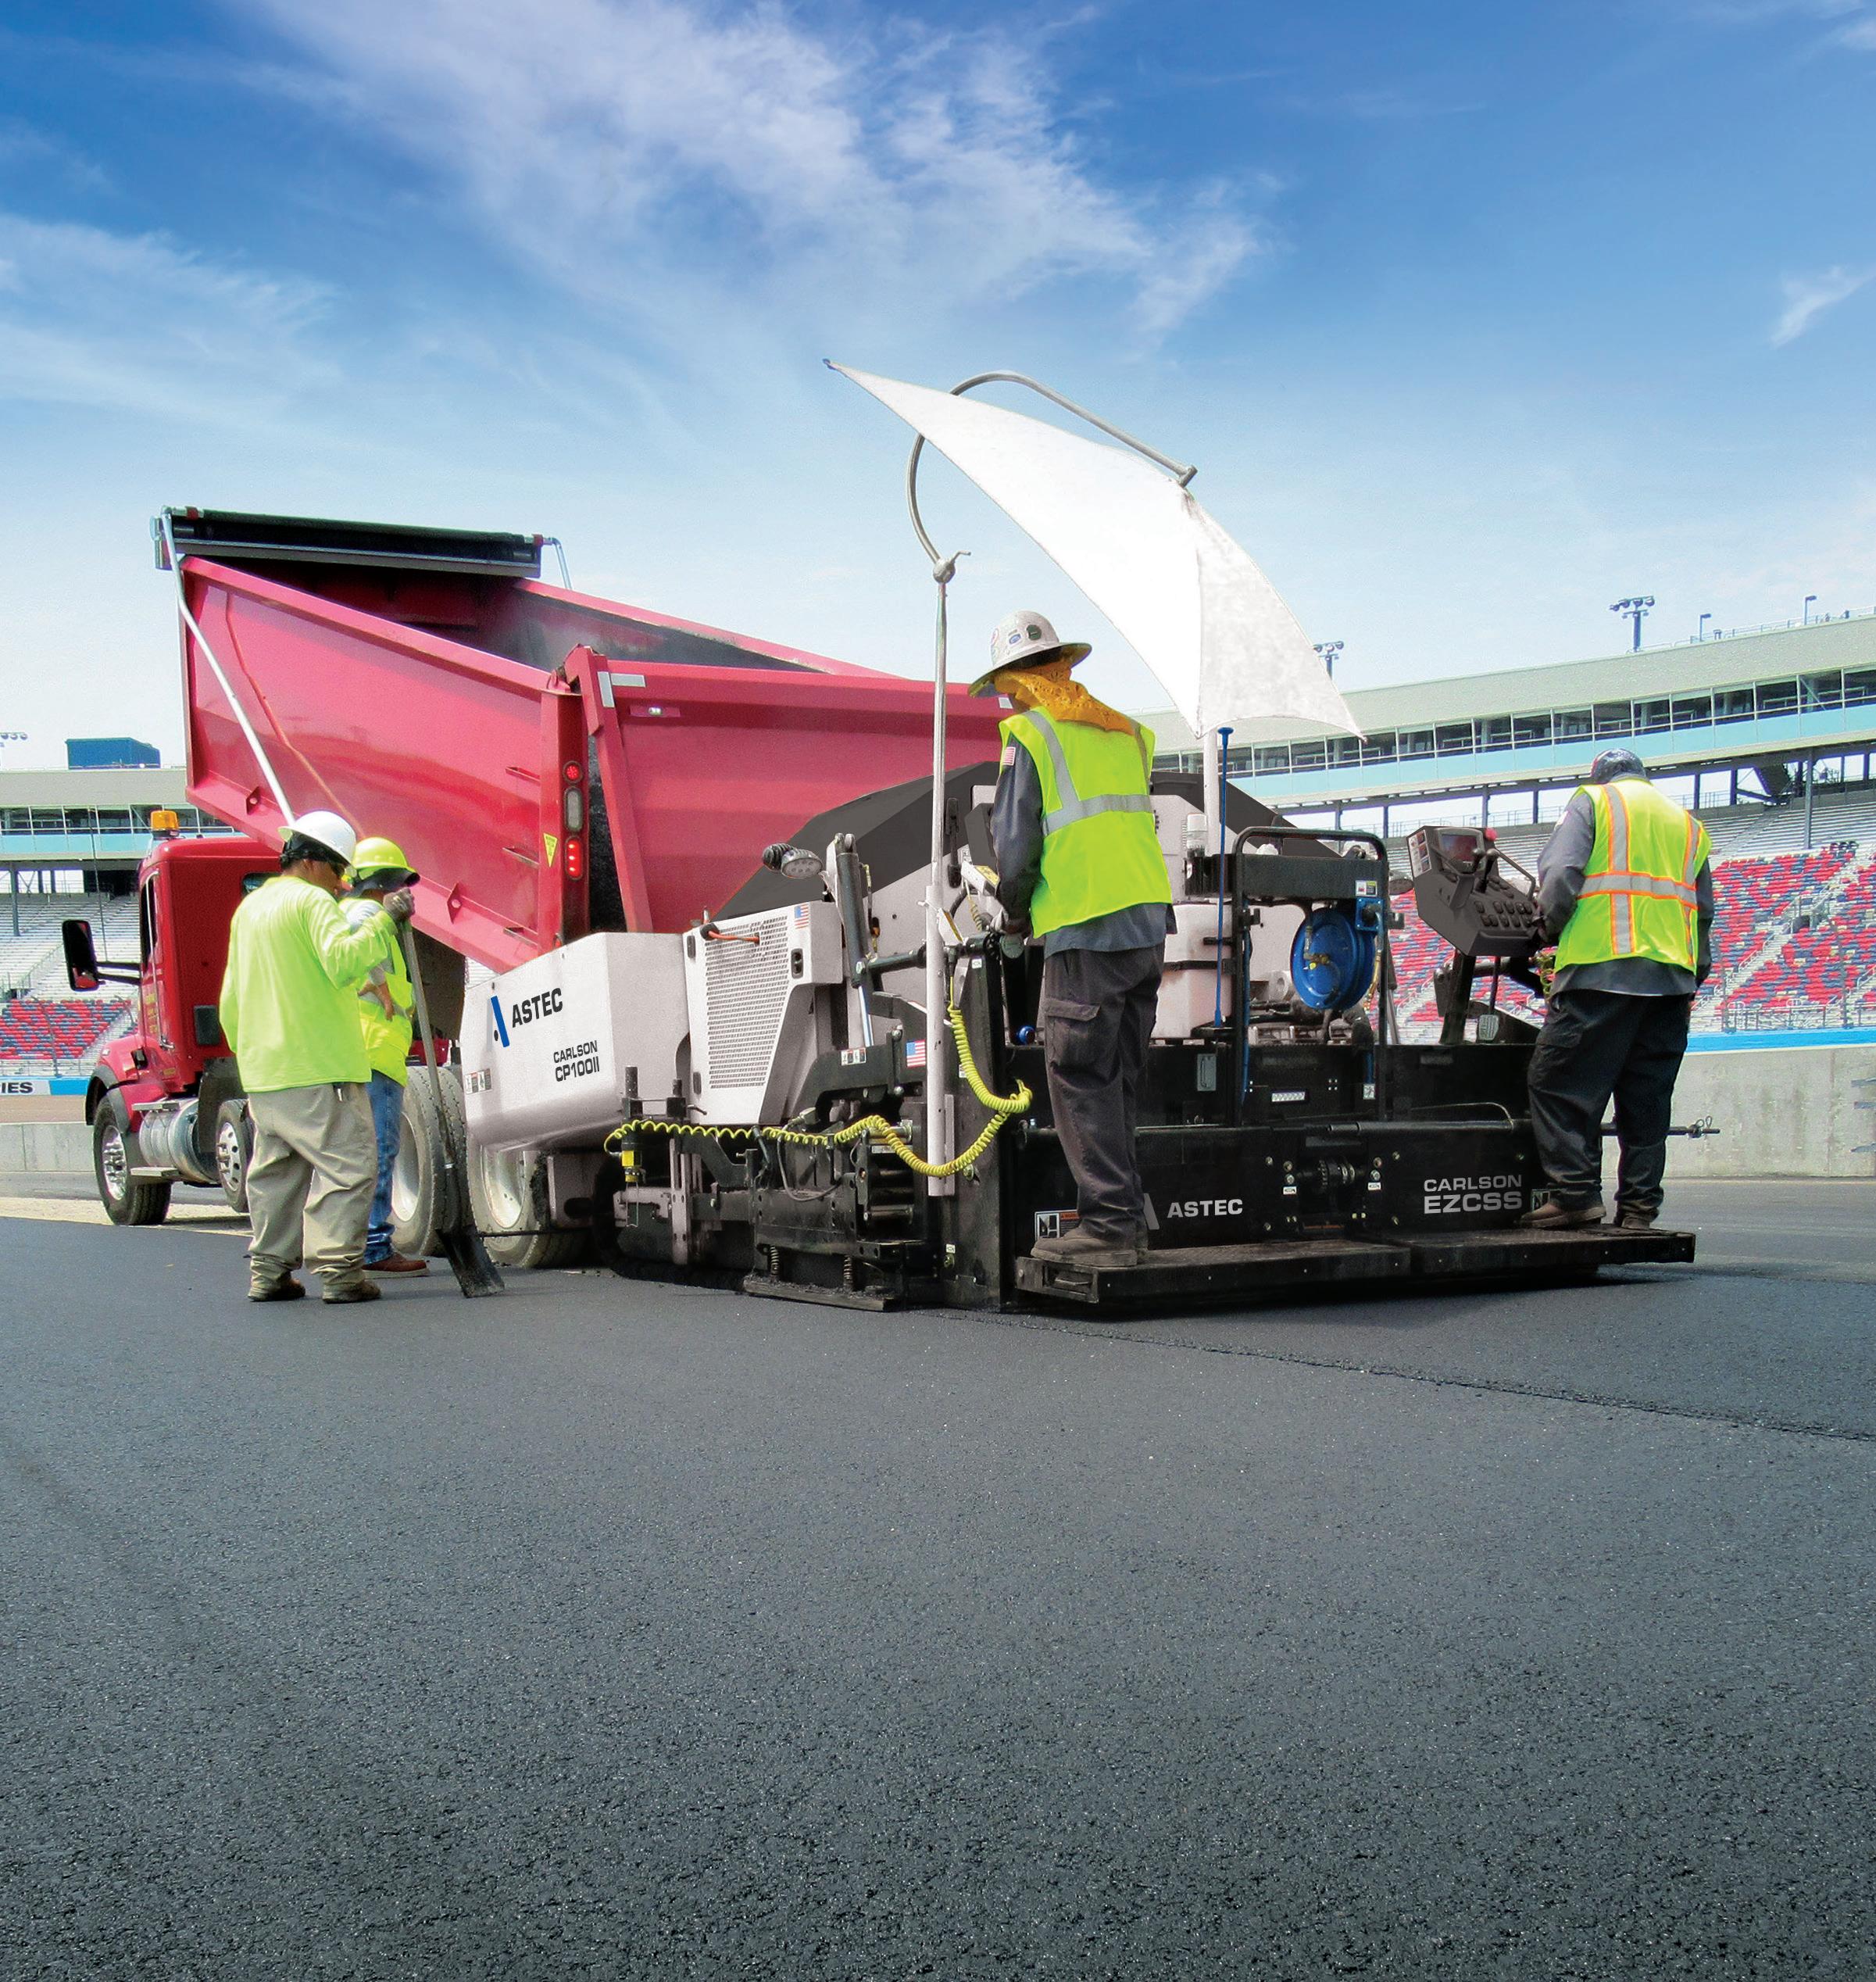
Carlson CP 100 II
The CP100 II sets the standard for versatility, component life cycle and mat quality. With a powerful 100 horsepower engine, an array of configurations and the class-leading Carlson EZCSS single slide screed, it’s easy to see why the CP100 II is the ideal choice for heavy-duty commercial paving.

By Brandon Noel, Editor-in-Chief
There are positive signs that the sector erosion may have tapered off.
For the second consecutive category in this year’s report, last year’s projected decline failed to materialize at the contractor level. The TC 2025 analysis used an elevenyear compound annual growth rate of approximately -3.97% to project the Sealcoating Top 50 would fall to roughly $159.4 million in 2026, $153.1 million in 2027, and $147.0 million in 2028. The TC 2026 Top 40 reported $144.0 million in sealcoat-only revenue, which on the surface looks like a confirmation, but on a per-contractor basis, however, the sealcoat-only average grew to $3.60 million, up 8.6% from the TC 2025 average of $3.32 million, and up 17.7% from TC 2024.
While that is a positive piece of data, it’s still important to understand that the long-term aggregate decline from 2015-to 2025 is a real signal that has not been refuted by this year’s data. Additionally, the shrinking respondent pool that drove the Top 50 to Top 40 contraction is almost certainly a contributing factor in the aggregate-dollar figures and cannot be easily separated from the underlying trend. Third, the per-contractor numbers do not look like a sector in decline. They look like a sector holding the line.
Both pictures are true, and they will likely reconcile in one direction or the other, eventually.
The Top 40 Sealcoating Contractors
Sponsored by

reported $1.183 billion in total gross sales, averaging $29.59 million per contractor. The total gross average came in ~18% below the TC 2025 Top 50 average of $36.21 million, which fits the broader contraction pattern I’ve seen.
The more interesting movement, however, happened inside the revenue mix. Sealcoating climbed to 26.3% of the average Top 40 contractor’s gross, up from 23.9% in TC 2025. That is a 2.4-point gain in a single year, and it reverses the erosion trend I was concerned with from last year’s analysis. Paving fell to 34.5% of the average mix, down from 38.2%. Pavement repair dropped to 15.7% from 18.5%. Striping rose to 11.4% from 8.7%. Surface
treatments climbed to 1.8% from 0.6%. Other work held at 10.4%, down marginally from 11.1%.
Sealcoating, which last year looked like a service slowly losing ground in the portfolio of the Top 50, gained ground in the portfolio of the Top 40. The two outlier contractors who generated more than 90% of their income from sealcoating in TC 2025 are no longer the only contractors leaning hard into the service. The Top 40 averaged a higher sealcoating share than any Top 50 list in recent memory. That change is consistent with one of two readings, and possibly both. Either the contractors who stuck with sealcoating as a meaningful portion of their
business outperformed the broader market in 2025, or the Top 40 framework filtered out lower-share sealcoaters who would have appeared in a Top 50. The data we have cannot fully separate those two effects, and only greater participation, with more contractor data would help sort things out in the future.
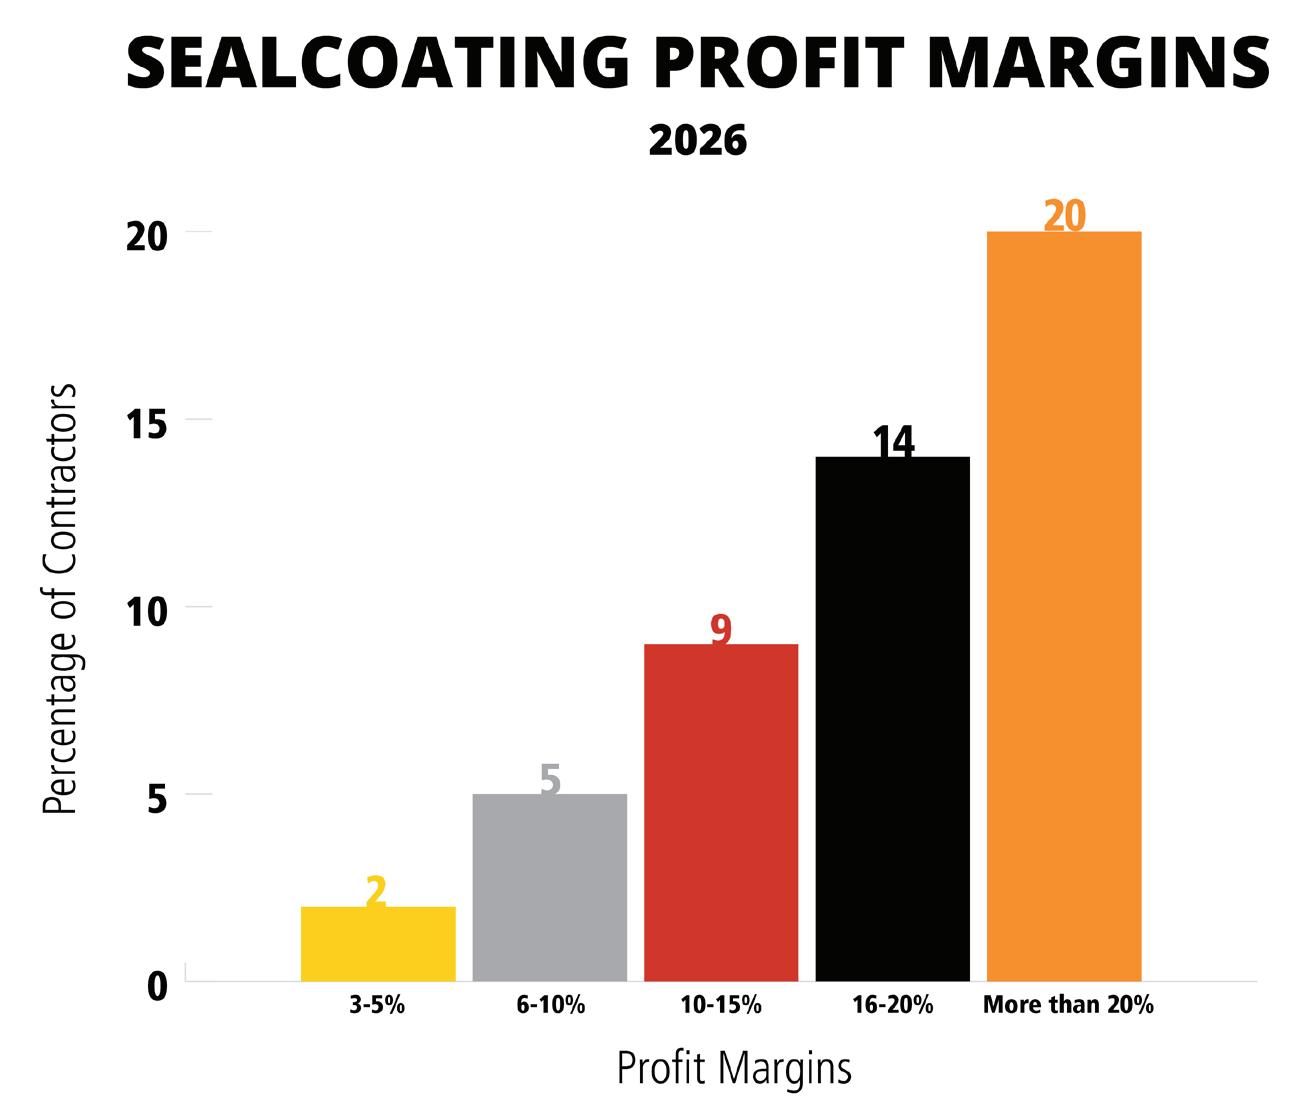
The profit margin distribution shifted noticeably from last year. Among the TC 2026 Top 40:
• 35% (14) reported margins above 20%, down from 46% (23 of 50)
• 27.5% (11) reported margins in the 16% to 20% range, up from 10% (5 of 50)
• 20% (8) reported 11% to 15% margins, up from 14% (7 of 50)
• 12.5% (5) reported 6% to 10% margins, down from 28% (14 of 50)
• 5% (2) reported less than 5% margins, up from 2% (1 of 50)
The very top tier compressed, but the upper-middle band more than doubled in share. Combined, the two upper tiers account for 62.5% of the Top 40, essentially flat from the 56% combined share of the TC 2025 Top 50. The, “middle of the pack eroding,” pattern observed in last year’s analysis did not continue. The middle thickened instead, which I think is a healthy sign.
The most likely explanation is that last year’s run-up to 46% of contractors above 20% profit margins was a highwater mark driven by stabilizing material costs and contractors holding pricing power coming out of inflation shock. This year’s redistribution into the 16% to 20% range looks like a normalization toward sustainable margins, not a deterioration of profitability. Two of 40 contractors falling into the under-5% band is the only meaningful warning signal in the data, but it represents a smaller share of the list than it did last year on a strictcount basis.
Every contractor in the Top 40
Sealcoating did some parking lot work, averaging 66.8% of their composition, up from 64.4% in TC 2025. Driveway work averaged 11.1%, up from 10.3%, with 25 of 40 contractors doing some driveway work at an average composition of 17.7% among those who did. Residential roads and city streets averaged 15.9%, down from 17.9%. Highway work fell sharply to 2.8% on average, with only 6 of 40 contractors reporting any highway work at all, down from 11 of 50 a year ago. The otherlocations category averaged 3.5%.
The slight drift toward driveways and away from residential roads tracks the broader residential pivot, but more gently than the Paving category showed.
Every Top 40 Sealcoating Contractor did commercial or industrial work, averaging 57.9% of customer mix, up from 56.5% in TC 2025. Municipal work averaged 11.5%, down from 12.6%, with 31 of 40 contractors reporting some municipal work. Multi-family residential averaged 18.3%, down from 20.3%, with all 40 contractors reporting at least some multifamily work. Single-family residential averaged 11.0%, up from 7.7%, with 25 of 40 contractors doing some singlefamily work at an average composition of 17.6% among those who did.
The customer mix in sealcoating moved less dramatically than in paving. The single-family share grew but the multi-family share remained the secondlargest residential customer base, holding above 18% on average.
Again, all but one of the Top 40 selfperformed at least 50% of their work, and that’s consistent with the 47 of 50 that did so in TC 2025. Subcontracted revenue averaged 18.4% of gross sales, down from 21.8% in TC 2025. That 3.4-point drop is smaller than the sixpoint drop in Paving and the nine-point drop reported in the overview, suggesting Sealcoating Top 40 contractors held their sub-work better than the broader market.
• 37.5% (15) worked for more than 400 customers, and 55% (22) completed more than 400 projects
• 17.5% (7) worked for 201 to 300 customers, and 10% (4) completed 201 to 300 jobs
• 17.5% (7) worked for 151 to 200 customers, and 15% (6) completed 151 to 200 jobs
• 12.5% (5) worked for 101 to 150 customers, and 7.5% (3) completed 101 to 150 jobs
• 15% (6) worked for fewer than 100 customers, and 7.5% (3) completed fewer than 100 jobs
• No contractors reported between 301 and 400 customers, and 5% (2) completed 301 to 400 jobs
The Top 40 leaned slightly toward higher customer counts than the TC 2025 Top 50 did, with 37.5% serving more than 400 customers compared to 26% (13 of 50) a year ago. Job counts followed the same pattern. The highvolume operators stayed at the top of the list, and the smaller-volume tail shortened proportionally.
60% (24) of the Top 40 reported fleet replacement values above $2 million, down from 58% (29 of 50) on a count basis but slightly higher as a share of the list. Another 10% (4) fell into the $1 million to $2 million range, with 22.5% (9) reporting between $500,000 and $1 million, 5% (2) between $250,000 and $500,000, and one contractor at less than $250,000.
The capital intensity of the Sealcoating Top 40 sits roughly where it did a year ago, with a slightly higher concentration of mid-size fleets in the $500,000 to $1 million range. As flagged in last year’s article, rising equipment costs and the implementation of import tariffs will most likely show up clearly in TC 2027 data, after a full year of impact has worked through fleet replacement cycles. ■


It’s more than a clean, consistent finish. Crafco sealcoat protects and preserves pavement with performance designed to last. Combined with purpose-built equipment, each application delivers lasting durability that helps extend pavement life while maintaining a smooth, uniform appearance.


















By Brandon Noel, Editor-in-Chief
Sponsored by
The strongest category for sub-contracting tells us that while volume fell, profits were consistent with previous years’ data.
Striping was the first category where the per-contractor numbers and the aggregate numbers told the same story, and it was a contraction story. The TC 2026 Top 40 Striping Contractors generated $85.4 million in striping-only revenue, averaging $2.13 million per contractor. That per-contractor figure sat 20.4% below the TC 2025 Top 50 average of $2.68 million, and it gave back most of the +49% jump the category posted between TC 2024 and TC 2025.
Last year, I described the Striping category as, “probably the least volatile, and the most resilient to outside factors,” among the four categories. The TC 2026 data does not support that statement, and it’s made me rethink my entire assessment. But this contraction sits inside a more interesting and revealing pattern.
Even as striping-only revenue fell, striping rose as a percentage of the Top 40’s average revenue mix, climbing from 15.66% in TC 2025 to 22.70% in TC 2026. That is the largest share gain of any category in this year’s report, and it carried a clear implication. The Top 40 Striping contractors lost total gross sales faster than they lost striping sales. Striping became a larger share of a smaller pie for individual contractors.
The Top 40 Striping reported $1.179 billion in total gross sales, averaging $29.5 million per contractor. The total gross average came in 19.4% below the TC 2025 Top 50 average of $36.55 million, the steepest per-contractor gross drop of the four categories.
The revenue mix tells the more interesting industry story. Striping climbed to 22.7% of the average Top 40 contractor’s gross. Paving fell to 29.8% of the mix, down from 37.3% in TC 2025. Pavement repair dropped to 12.9% from 19.0%. Sealcoating rose to 21.4% from 17.0%. Surface treatments climbed to 1.8% from 0.5%, and other work dropped to 11.4% from 10.6%.
Two contractors in the Top 40
derived 100% of their revenue from striping, and six total contractors generated more than 50% of their gross from the service, up from three in TC 2025. The pure-play and striping-heavy contractors became more visible in this year’s list.
One major reason for that was a surge in survey engagement from contractors who specialize in striping services as their primary revenue stream.
I had a theory that striping might be increasingly subcontracted out by larger contractors to specialists, which could help explain why striping appeared in revenue-mix data without those contractors building striping-specific scale. The TC 2026 data is consistent with that theory in a way the TC 2025 numbers alone could not prove.
Subcontracted revenue across the Top 40 Striping averaged 22.5% of gross, essentially unchanged from 22.0% in TC 2025. Striping was the only category in this year’s report where subcontracted revenue did not drop. In the Overview, I noted that there was a nine-point decline in sub work across the unified Top 40, and the Paving and Sealcoating analyses both reported drops of six and three points respectively. Striping was flat.
If general contractors and larger pavement companies pulled subcontracted work back across most categories in 2025, but held or expanded the striping work they subcontracted out, that is consistent with a structural pattern of striping being treated as a specialized line that the larger contractors often push to specialists. One year of data is not proof, but it is the first piece of evidence that supports the theory. Worth watching in TC 2027!
Last year’s analysis identified a, “middle disappearing,” trend in striping margins, with the 16% to 20% band contracting from 22% of the Top 50 in TC 2024 to 12% in TC 2025. That trend reversed in a single year. Among the TC 2026 Top 40 Striping Contractors:
• 37.5% (15) reported margins above 20%, up marginally from 36% (18 of 50) in TC 2025
• 30% (12) reported margins in the 16% to 20% range, up from 12% (6 of 50)
• 15% (6) reported 11% to 15% margins, down from 20% (10 of 50)
• 12.5% (5) reported 6% to 10% margins, down sharply from 30% (15 of 50)
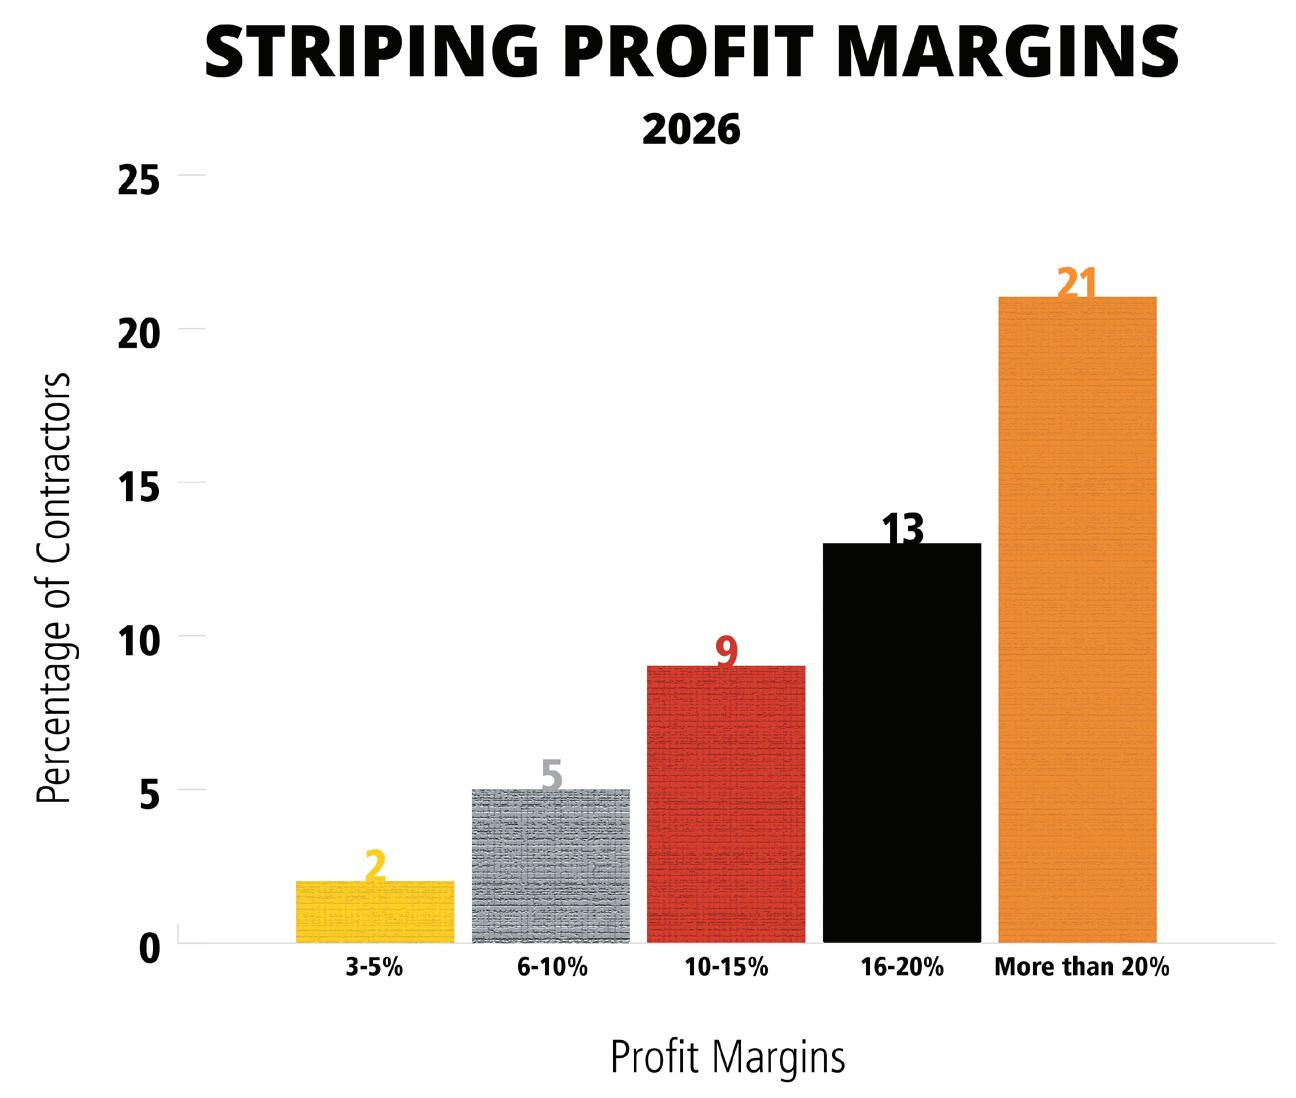
• 5% (2) reported less than 5% margins, up from 2% (1 of 50)
The 16% to 20% band actually exploded with the combined upper tiers, margins of 16% or higher, jumped to 67.5% of the Top 40 from 48% of the TC 2025 Top 50. Striping contractors took less volume but held more margin than they did a year ago.
Every contractor in the Top 40 Striping did some parking lot work, averaging 68.0% of their typical work composition, up from 66.9% in TC 2025. Driveway work averaged 6.2%, down from 6.7%, with 22 of 40 contractors doing some driveway work. Highway work averaged 5.1%, with only 9 of 40 contractors reporting any highway striping at all. Residential streets averaged 17.0%, down from 17.7%. The otherlocations category averaged 3.7%.
Striping concentrated more on parking lots in 2026 than it had in TC 2025. The category did not pivot residentially in the same way Paving and Sealcoating did. It held its commercial-parking core and let the residential work soften.
Every Top 40 Striping Contractor did commercial or industrial work, averaging 56.3% of customer mix, down from 57.2% in TC 2025. Municipal work averaged 14.9%, down from 15.6%, with 34 of 40 contractors reporting some municipal work. Multi-family residential averaged 17.4%, down from 20.1%, with 39 of 40 contractors reporting some multi-family work. Singlefamily residential averaged 8.0%, up from 4.7%, with 25 of 40 contractors doing some single-family work at an average composition of 12.8% among those who did. Other customer types averaged 3.4%.
The customer mix softened across every category except single-family, with multi-family taking the largest single drop at nearly three points. The residential pivot showed up here, but more muted than in Paving and less commercially defensive than Sealcoating.
Only two contactors of the Top 40 did not self-perform at least 50% of their work, consistent with the 47 of 50 in TC 2025.
• 32.5% (13) worked for more than 400 customers, and 50% (20) completed
more than 400 projects
• 2.5% (1) worked for 301 to 400 customers, and 5% (2) completed 301 to 400 jobs
• 17.5% (7) worked for 201 to 300 customers, and 12.5% (5) completed 201 to 300 jobs
• 12.5% (5) worked for 151 to 200 customers, and 17.5% (7) completed 151 to 200 jobs
• 12.5% (5) worked for 101 to 150 customers, and 7.5% (3) completed 101 to 150 jobs
• 22.5% (9) worked for fewer than 100 customers, and 7.5% (3) completed fewer than 100 jobs
The Top 40 Striping list had a higher concentration at both ends of the customer-count spectrum than the TC 2025 Top 50 did, with 32.5% serving more than 400 customers and 22.5% serving fewer than 100. The middle thinned. That pattern is consistent with the subcontracting theory: large generalists with deep customer rosters at one end, and specialists serving narrower portfolios at the other.
About 57% (23) of the Top 40 reported fleet replacement values above $2 million, down from 58% (29 of 50) in TC 2025 on a count basis. Another 5% (2) fell into the $1 million to $2 million range, 17.5% (7) reported between $500,000 and $1 million, 10% (4) between $250,000 and $500,000, and 10% (4) at less than $250,000.
The Top 40 Striping list ran less capital-intensive than the TC 2025 Top 50 did. The combined share above $1 million dropped from 84% (42 of 50) to 62.5% (25 of 40). That shift indicates either smaller respondent pools at the upper end of the fleet-value distribution or a real movement in how striping contractors approached equipment investment in 2025. As noted in the overview, the full impact of equipment cost increases and import tariffs will not show clearly until TC 2027. ■

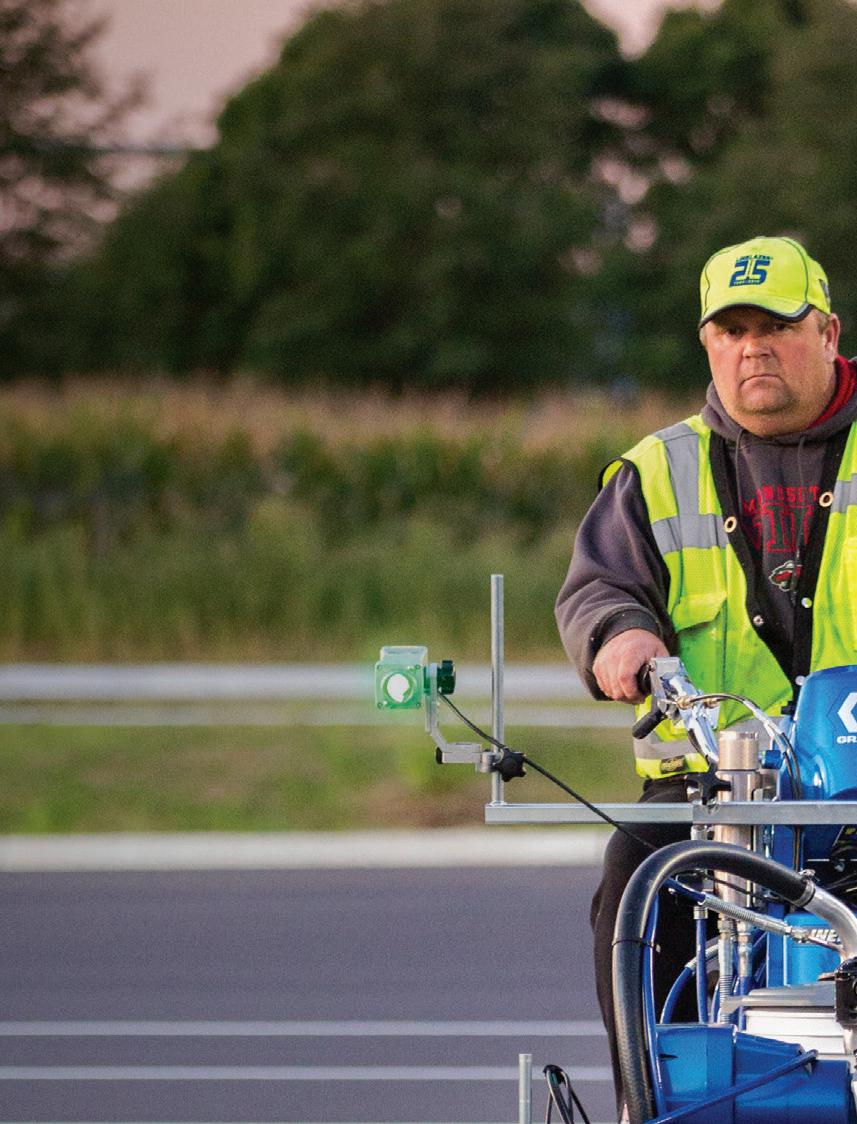
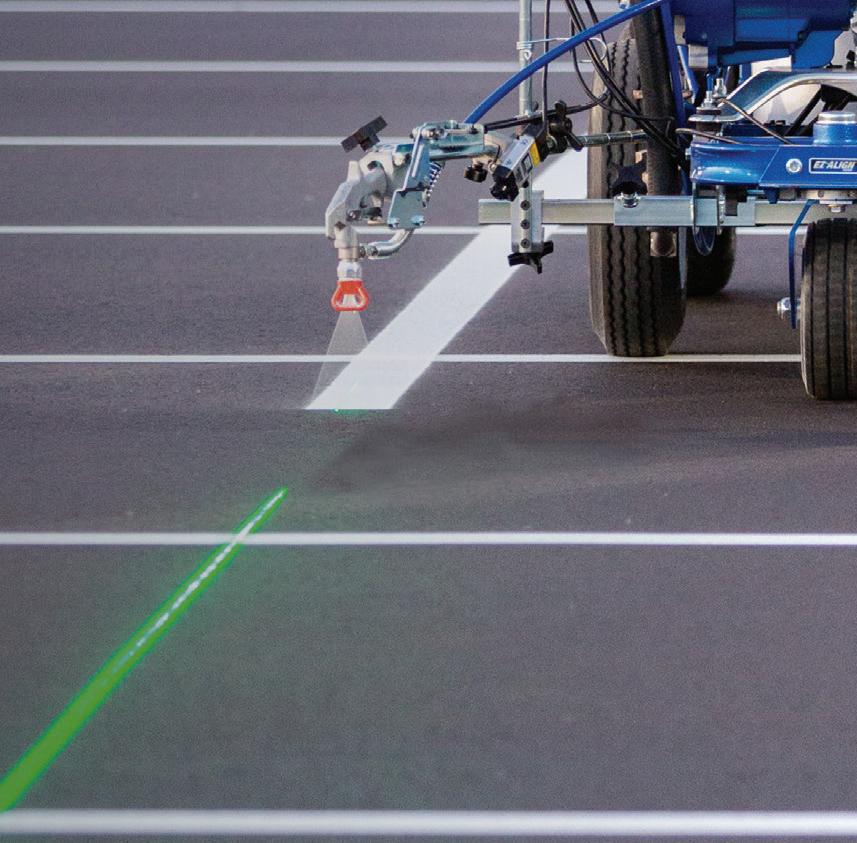
PARKING LOT LAYOUT IN 1/2 THE TIME
NO TAPE MEASURE
Measure the lot with Auto-Layout™ II
NO CHALK
Put down premark dots with Automatic Guns
NO STRING LINE
Connect the dots using LazerGuide™ 2000





By Brandon Noel, Editor-in-Chief
Sponsored by
The pavement repair sector recorded the most dramatic percontractor reversal of any category.
The TC 2026 Top 40 Pavement Repair Contractors generated $184.8 million in pavementrepair-only revenue, averaging $4.62 million per contractor. That per-contractor figure sits 58.5% below the TC 2025 Top 50 average of $11.14 million, and it’s below the TC 2024 baseline of $5.71 million. The +95.1% per-contractor surge that defined the category in TC 2025 not only failed to hold, it gave back the entire run-up and then some.
Last year’s analysis posed a specific structural concern. The piece anticipated what would happen as the funding period for the Infrastructure Investment and Jobs Act (IIJA), which technically concludes in September of this year. CY 2025 is the data year for this report, and it is the first reporting period where IIJA-driven work was no longer a meaningful tailwind. The pavement repair sector, which depends more directly on federal infrastructure dollars than the other three Top Contractor categories, felt the pullback first and hardest.
One possible explanation is that federal-money cycle peaked, and then began to normalize, What we are seeing this year is that the data caught up to the reality on the ground. What this means for next season could be more dire if the federal government is slow to approve reauthorization and get the funds moving again.
The pavement repair contraction did not show up where contractors might have expected it. Average total gross sales for the Top 40 held up relatively well, dropping only 6.5% from the TC 2025 Top 50 average of $33.96 million to $31.74 million per contractor. That is the smallest per-contractor gross drop of any category in this year’s report. The damage concentrated almost entirely on pavement-repair-specific revenue. The Top 40 averaged 19.8% of gross from pavement repair work, down from 23.4% in TC 2025. Pavement repair fell as a share of contractor business, even as those same contractors held their overall scale together by leaning into other service lines. Paving climbed back to 41.1% of the average revenue mix from 42.1%, sealcoating rose to 16.6% from 14.0%, striping held essentially flat at 9.7%, surface treatments climbed to 1.1% from 0.6%, and other
work rose to 11.6% from 10.3%.
The customer mix data confirmed where the contraction lived, and it’s the strongest evidence that supports my theory. Commercial and industrial work held strong at 57.8% of mix, up from 55.1% in TC 2025. Municipal work, however, fell to 10.4% from 15.7%, a 5.3-point drop and the largest municipal contraction in any category this year. That movement is consistent with what IIJA money disappearing from the cycle should look like. Federal dollars route through state DOTs, get awarded to road builders, and trickle into pavement repair work largely through municipal contracts and subcontracted scope. As the federal pipeline tightened, the municipal mix tightened along with it. Multi-family residential dropped to 17.8% from 21.1%, and single-family residential nearly doubled to 9.6% from 5.2%. The residential pivot showed up here too, but it was muted compared to

Sponsored by
the Paving and Sealcoating categories. Pavement repair contractors did not chase smaller residential work as aggressively. They held commercial relationships and let the municipal share absorb the loss.
The subcontractor data closed the loop. Top 40 Pavement Repair contractors averaged 15.3% of gross from subcontracted work, down from 22.7% in TC 2025. That is a 7.4-point drop, the second-largest of any category in this year’s report. Pavement repair specialists are routinely subbed work by larger contractors and road builders. When those GCs had less federal work to push downstream, the specialists felt it directly.
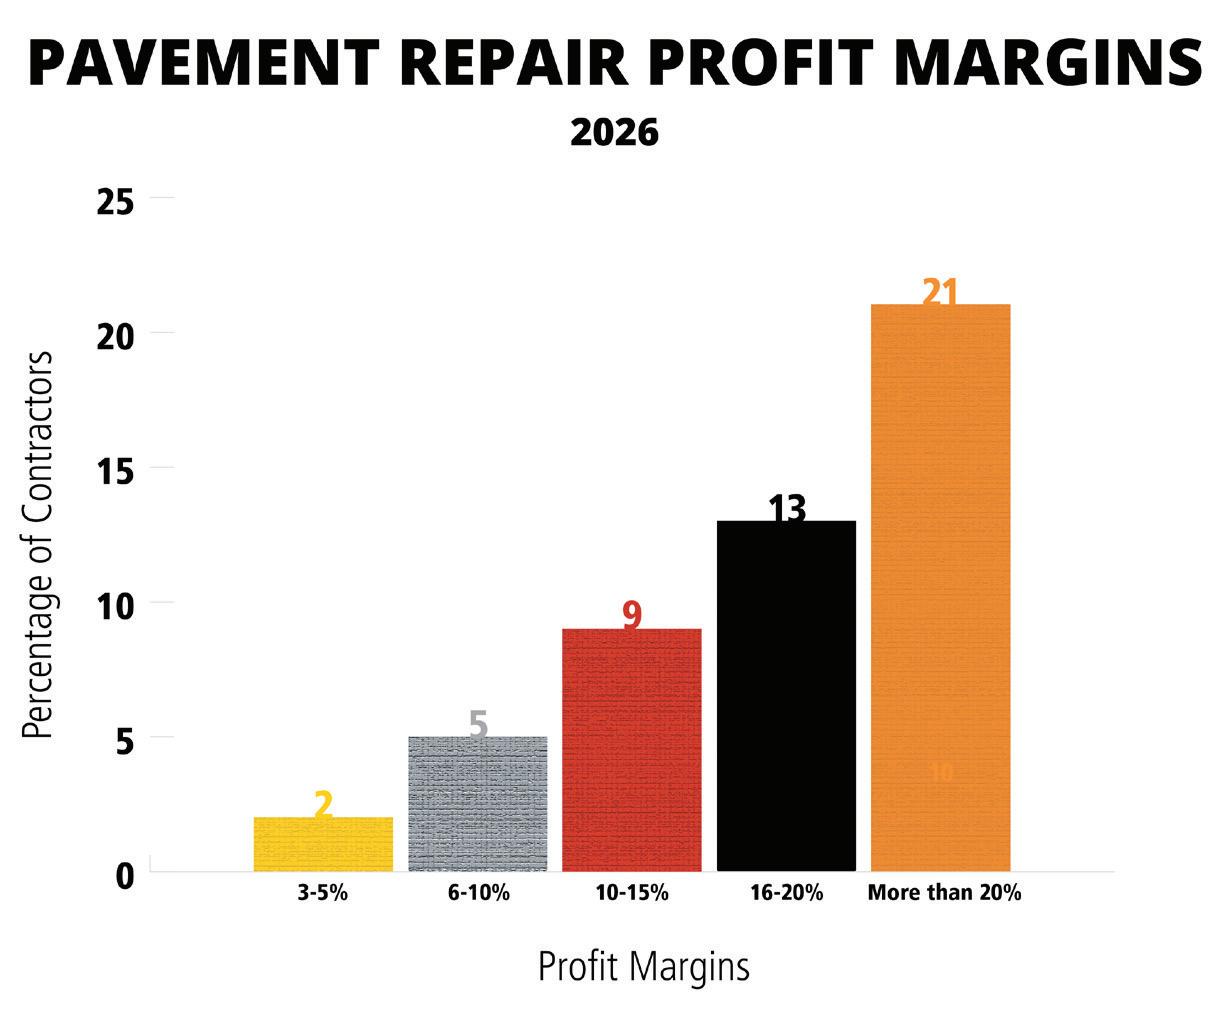
The profit margin distribution followed the upper-middle thickening pattern visible across every category in this year’s report. Among the TC 2026 Top 40 Pavement Repair Contractors:
• 37.5% (15) reported margins above 20%, down from 40% (20 of 50) in TC 2025
• 27.5% (11) reported margins in the 16% to 20% range, up sharply from 12% (6 of 50)
• 17.5% (7) reported 11% to 15% margins, down from 18% (9 of 50)
• 12.5% (5) reported 6% to 10% margins, down from 30% (15 of 50)
• 5% (2) reported less than 5% margins
Last year’s analysis celebrated a notable milestone. The TC 2025 Top 50 Pavement Repair list had no contractors below 6% margin, which was a first for the category. The TC 2026 Top 40 has two contractors below 5%, but the broader pattern is more constructive.
The combined upper tiers, margins of 16% or higher, climbed to 65% of the Top 40 from 52% of the TC 2025 Top 50. Pavement repair contractors took less volume and held more margin per job, which is the same defensive posture visible in Paving, Sealcoating, and Striping this year. The IIJA tailwind may have faded, but pricing seemed about the same overall.
Every contractor in the Top 40 Pavement Repair did some parking lot work, averaging 65.5% of their typical work composition, up from 63.1% in TC 2025. Driveway work averaged 9.3%, with 23 of 40 contractors doing some driveway work at an average composition of 16.2% among those who did, down from 29 of 50 in TC 2025. Highway work averaged 4.1%, with only 9 of 40 contractors reporting any highway pavement repair at all, down from 14 of 50. Residential streets averaged 17.2%, down from 19.5%. The other-locations category averaged 3.9%.
Highway work going down in this category was the most significant signal of the IIJA wind down imnpact. Pavement repair on highways is almost entirely federal-dollar-driven, either directly through DOT contracts or indirectly through road-builder subcontracts. Nine contractors doing some highway work versus 14 a year ago, with an average composition of 18.1% among those who did is pretty stark.
• 32.5% (13) worked for more than 400 customers, and 50% (20) completed more than 400 projects
• 2.5% (1) worked for 301 to 400 customers, and 7.5% (3) completed 301 to 400 jobs
• 15% (6) worked for 201 to 300 customers, and 5% (2) completed 201 to 300 jobs
• 15% (6) worked for 151 to 200 customers, and 20% (8) completed 151 to 200 jobs
• 12.5% (5) worked for 101 to 150 customers, and 7.5% (3) completed 101 to 150 jobs
• 22.5% (9) worked for fewer than 100 customers, and 10% (4) completed fewer than 100 jobs
The Top 40 ran with a higher concentration at both ends of the customercount distribution than the TC 2025 Top 50 did. Half completed more than
400 jobs, the same share as a year ago, but the middle of the project-count distribution thinned. The category looks more bimodal in TC 2026, with highvolume generalists at one end and lowervolume specialists at the other.
As we’ve seen throughout the report, all but one of the Top 40 self-performed at least 50% of their work, consistent with the 48 of 50 in TC 2025.
The honest forecast for the pavement repair sector through TC 2027 and TC 2028 is not encouraging. The federal reauthorization that would replace IIJA does not currently have a clear or predictable legislative path. Surface transportation funding mechanisms remain unresolved, and the gap between IIJA’s expiration and any successor program is the kind of policy uncertainty that pavement repair specialists cannot price into bids or plan operations around.
If a reauthorization stalls into late2026 and beyond, the contractors on this list will navigate a multi-year stretch with no clear federal-dollar tailwind and no certainty about when one might return. The CY 2025 contraction in the TC 2026 data could very well prove to be the start of the cycle rather than its valley. Pavement repair specialists who built operating capacity around the IIJA-era surge may need to recalibrate, and the contractors who do that work earliest and most decisively could be the ones who appear on the TC 2027 and TC 2028 lists in the strongest position. The category’s structural fundamentals are sound, as existing pavement maintenance still drove 84.3% of the Top 40’s reported work, up from 80.5% in TC 2025. This confirmed that the repair-and-rehabilitation thesis that runs through the entire report applies here as much as anywhere. The market for this work exists and will continue to exist. The question is who funds it, at what scale, and on what timeline. ■


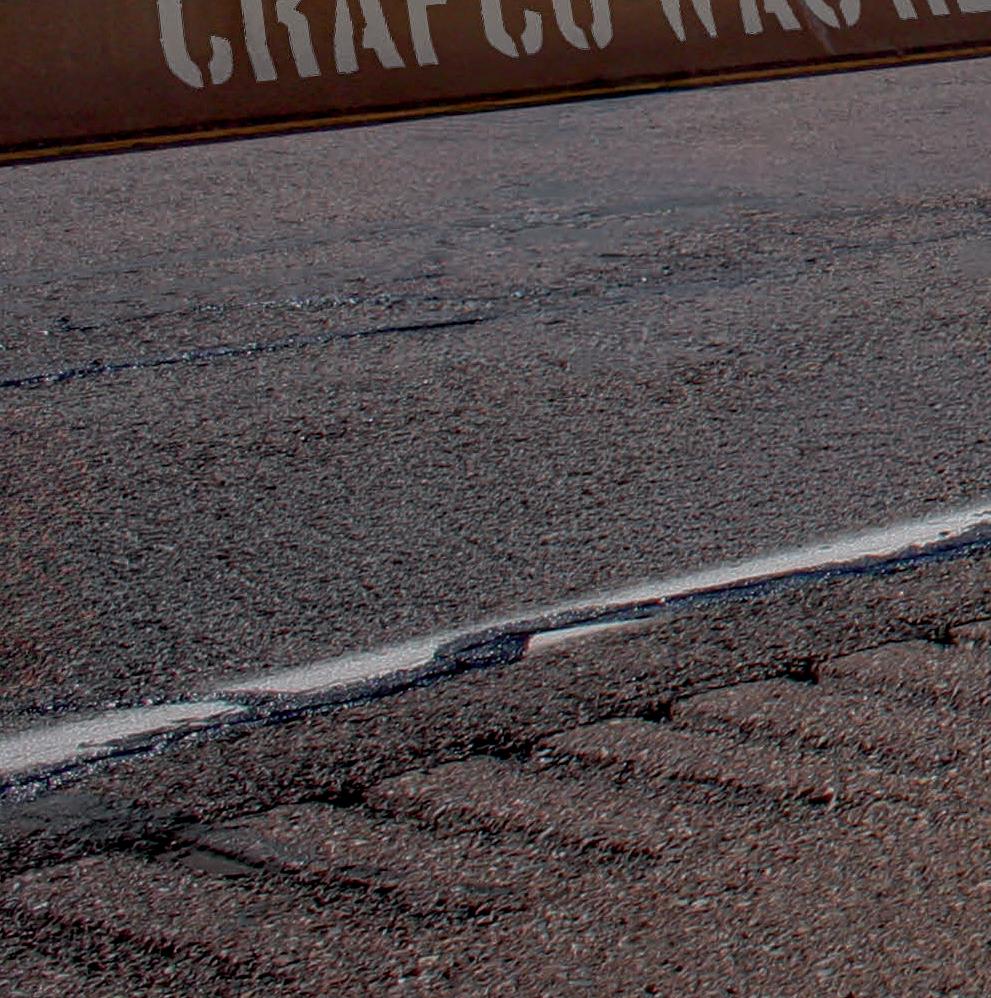

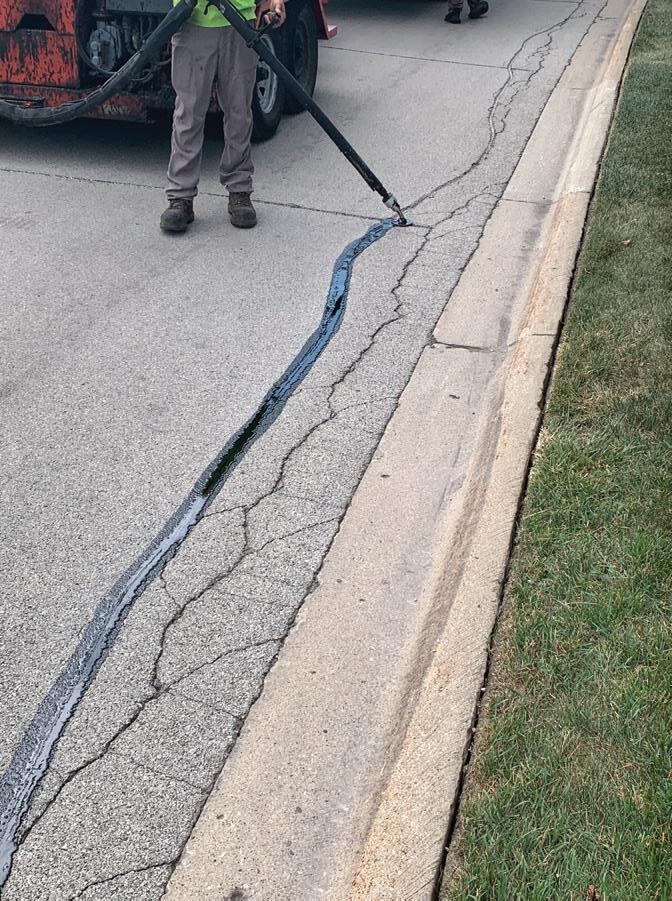
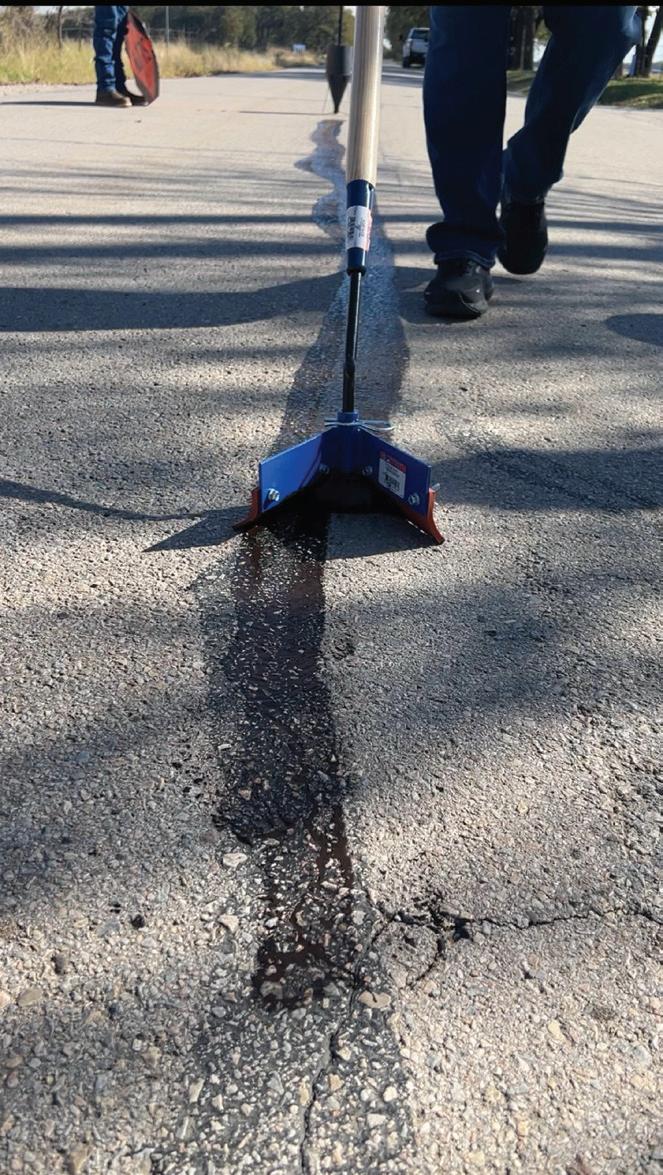
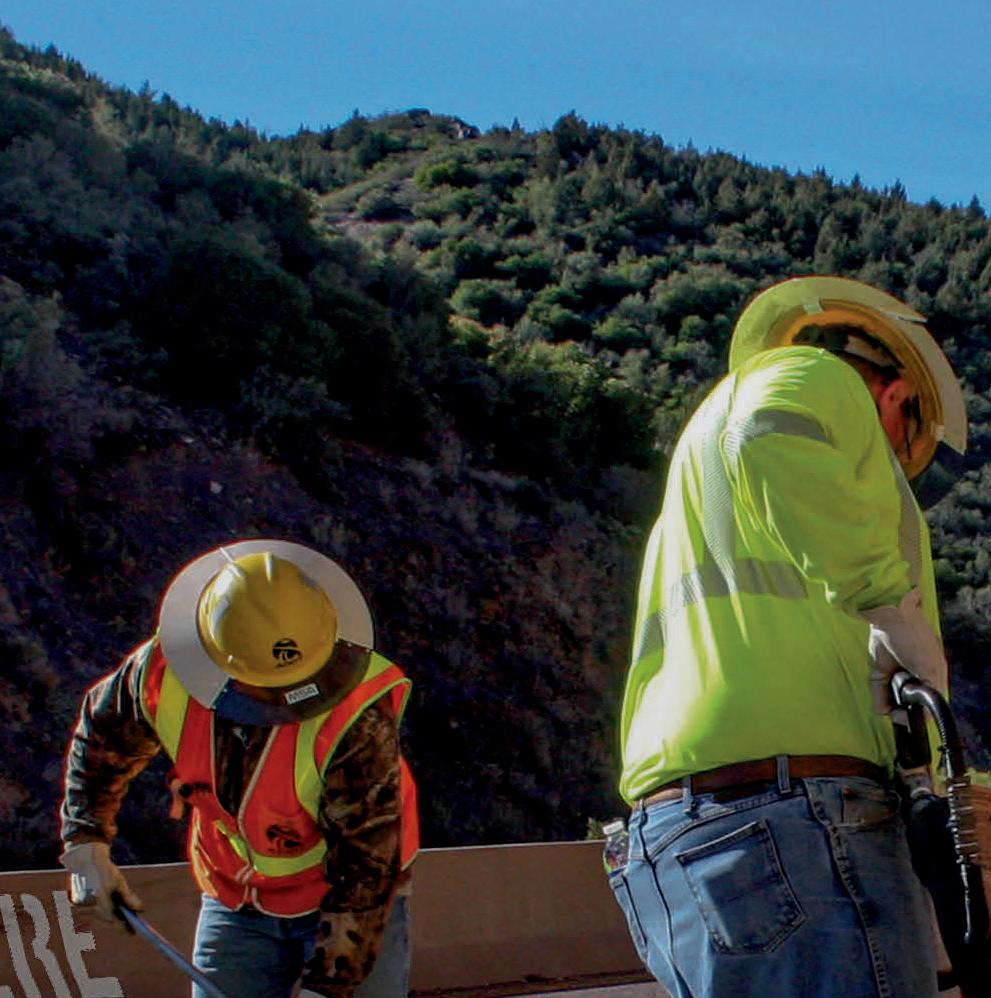
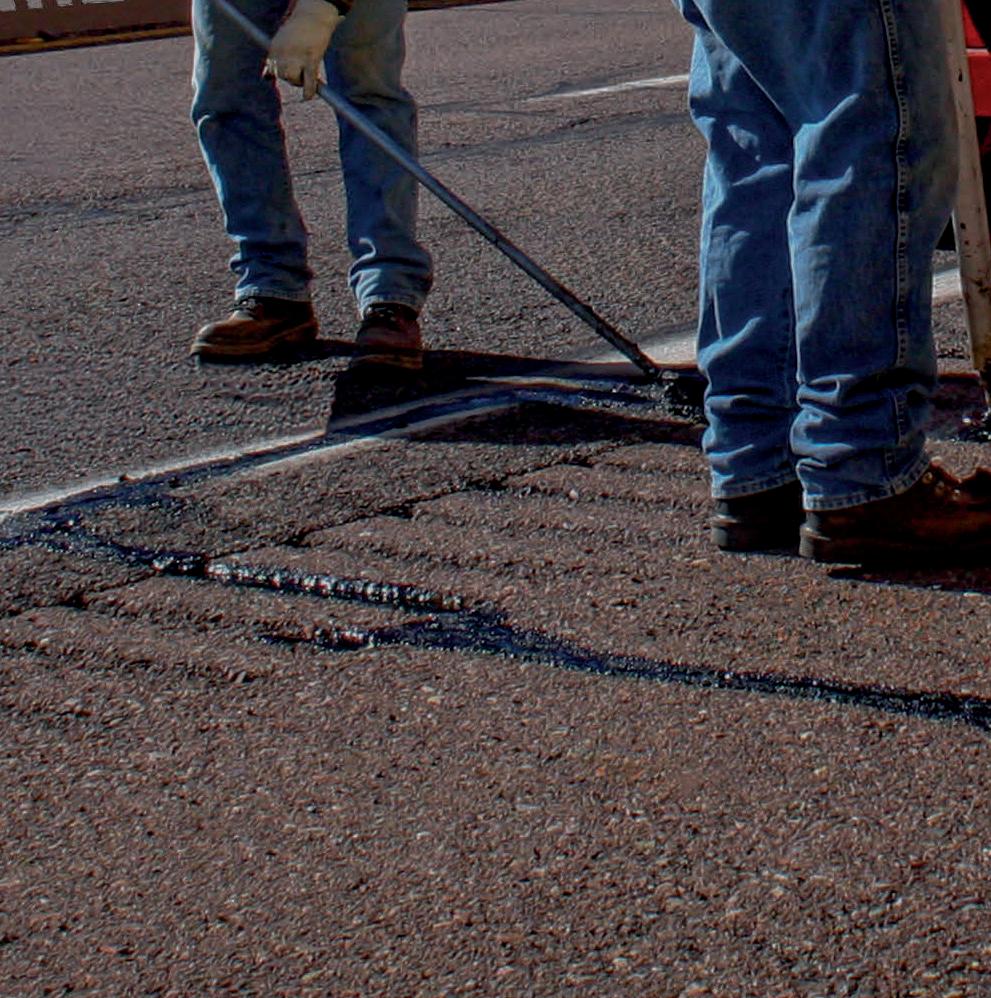
Crafco crack sealant is engineered for durability and flexibility, and when paired with purpose-built equipment, it delivers precise application that fully seals cracks at the source. The result is extended pavement life and long-term performance under demanding conditions.







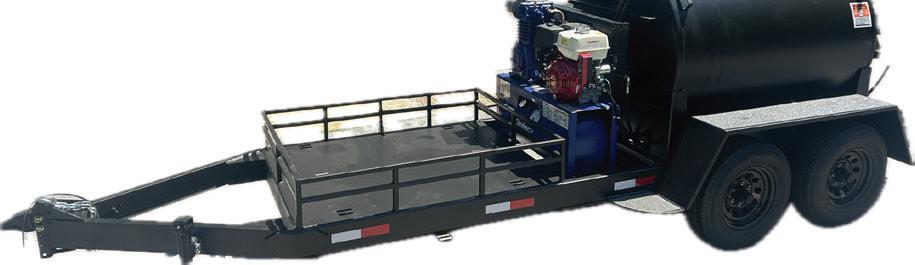








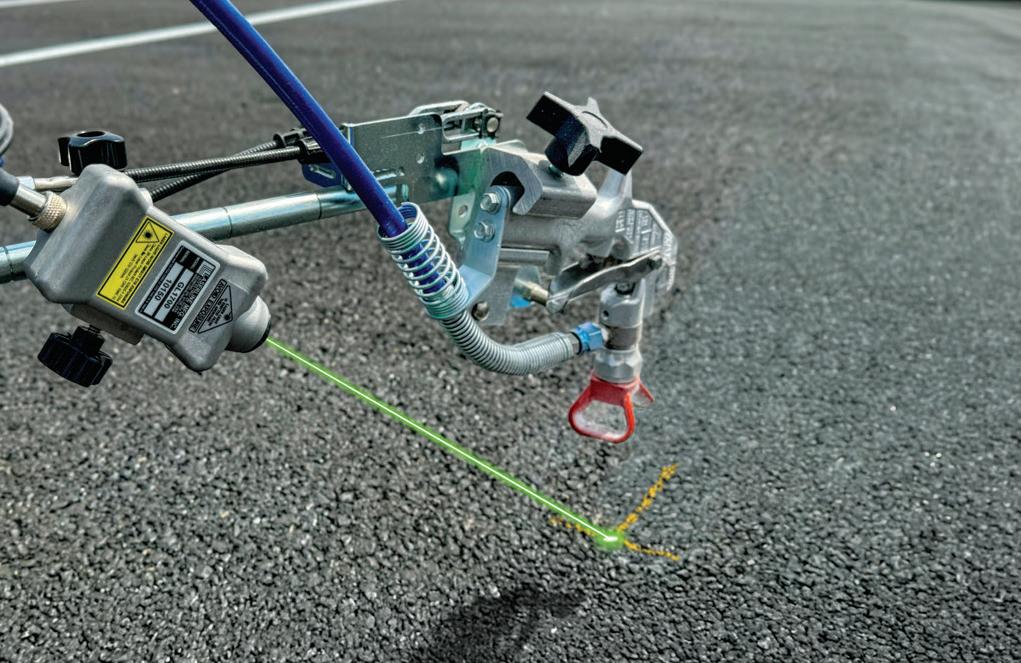
















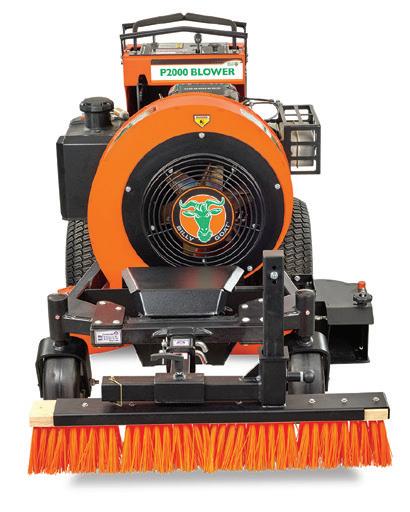










































• Pavement Sealers
• Crack Fillers (Hot & Cold)
• Traffic Paints
• Tennis & Pickleball Coatings



• and much more!




• Sealcoating Equipment & Tools
• Heated Crack Sealing Equipment
• Bulk Storage Tank Programs
• Heated Asphalt Distributors Service
• Job Site Sealer Tankers
• Equipment Rental & Repair



Fully stocked with everything you need for your pavement maintenance job including crack fillers, pothole patch, traffic paints, and more.






















• Highly-Trained Customer Service
• Product & Equipment Training

The global leader in pavement sealer technologies including asphalt-based, acrylic-based, liquid petroleum-based and coal tar.

FEATURING SEALMASTER ULTRA READY-TO-USE PAVEMENT SEALERS


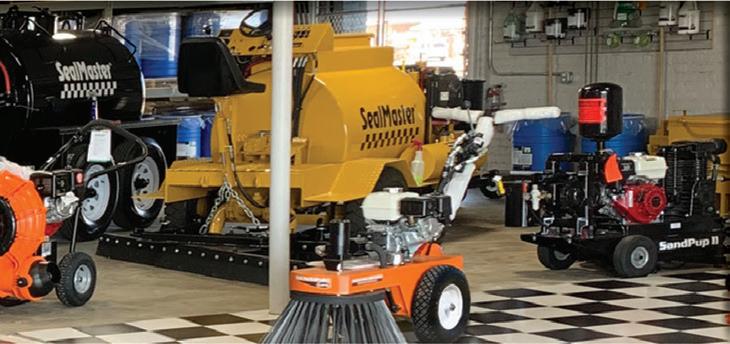
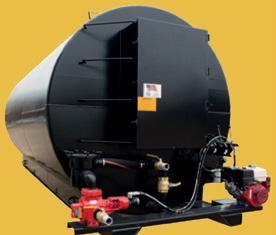
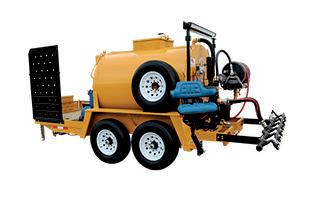
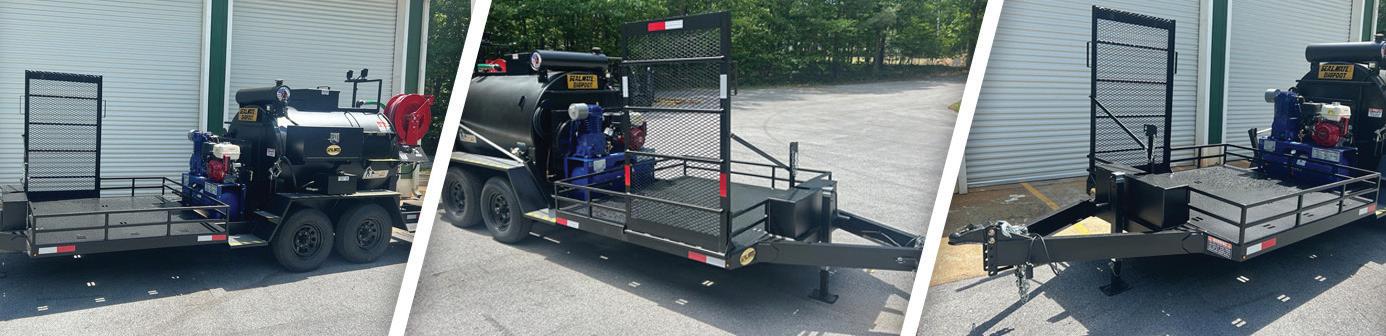
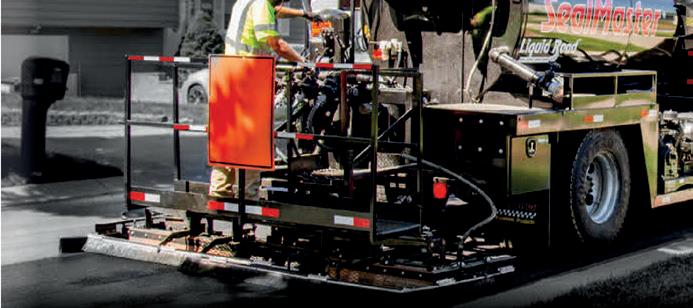
Professional-grade sealcoating and crack-filling equipment designed for performance, durability and ease of use with a nationwide sales and service network.